results presentation - gwa international · gwagroup.com.au 2 disclaimer this presentation contains...
TRANSCRIPT

gwagroup.com.au
Results PresentationHalf-year ended 31 December 2016
20 February 2017

gwagroup.com.au 2
Disclaimer
This presentation contains non-IFRS financial measures to assist users to assess the underlying financial performance of the Group.
The non-IFRS financial measures in this presentation were not the subject of a review or audit by KPMG.

gwagroup.com.au 3
AppendixOutlookSegment resultsGroup resultsOverview
Agenda
Overview Tim SaltManaging Director
Group financial results Patrick GibsonChief Financial Officer
Segment results Patrick Gibson
Summary and outlook Tim Salt

gwagroup.com.au 4
AppendixOutlookSegment resultsGroup resultsOverview
Agenda
Overview Tim SaltManaging Director
Group financial results Patrick GibsonChief Financial Officer
Segment results Patrick Gibson
Summary and outlook Tim Salt

gwagroup.com.au 5
Key themes from first half result
• Customer and consumer initiatives focused on less cyclical Renovation and Replacement segment
• Improving engagement with major customers• Strengthening NPD pipeline – new range of Caroma Cleanflush
• “Back to Basics” execution continuing momentum• Cost out in SG&A • Supply chain efficiencies assist performance
• Solid group financial performance• Continuing to grow top and bottom line, maintain focus on margin resilience through the cycle• Further improvement in Group EBIT margin, Return On Funds Employed and Operating Cashflow
• Continued focus to maximise shareholder value• Interim dividend 7.5 cents per share, fully-franked; up from 7c in prior period• Earnings per share up 14%
#1
#2
#3
#4
AppendixOutlookSegment resultsGroup resultsOverview

gwagroup.com.au 6
Result in context of strategic priorities
AppendixOutlookSegment resultsGroup resultsOverview
• Revenue up 2% vs market growth of ~1%
• Group EBIT margin up 0.8 points, ROFE up 1.8 points
• Corporate costs down 16%
• No significant items in 1HFY17
• Interim dividend 7.5 cents per share; fully franked
Focus area Results for 1HFY17
Maintain margin resilience
2
Grow the top line1
Continue to address cost base
3
“Clean” results4
Dividend Policy 65-85% NPAT
5

gwagroup.com.au 7
Improvement across key metrics
AppendixOutlookSegment resultsGroup resultsOverview
Continuing Operations*
Revenue$223.4m
2%ROFE19.5%
1.8pp
EBITDA$42.2m
6%OperatingCashflow$39.6m
22%
EBIT$39.2m
7%EPS9.9 cents
14%
NPAT$26.0m
8%DividendInterim Ordinary 7.5c
7%
*Continuing Operations exclude the Gliderol Garage Doors business which was divested on 31 July 2015.

gwagroup.com.au 8
Revenue growth ahead of weighted end market growth
AppendixOutlookSegment resultsGroup resultsOverview
GWA end market exposure1
Market activity FY172
Renovation &Replacement
Overall market remains relatively flat
Change 0% (MAT)
Residential detached housecompletions
Strong pipeline remains from lag between approvals and completions
Decreased by 4% in FY17 (MAT)
Multi-Residentialcompletions
Activity increased
Increased by 18% in FY17 (MAT)
Commercial Increase in aged care, offset by reduced activity in health care
Declined 3% (MAT)
1. Source: GWA estimates, Australia market B&K only (FY17 MAT) 2. Source: BIS Shrapnel
Weighted average of end markets up 1%
Renovation & Replacement
52%
Commercial 15%
Multi-Residential
11%
Residential22%
gwagroup.com.au 9
Agenda
Overview Tim SaltManaging Director
Group financial results Patrick GibsonChief Financial Officer
Segment results Patrick Gibson
Summary and outlook Tim Salt
AppendixOutlookSegment resultsGroup resultsOverview

gwagroup.com.au 10
Net profit up 8% on prior period
Net profit from Continuing Operations up 8% on prior corresponding period
EBIT up 7% driven by improved earnings in Bathrooms & Kitchens and cost savings
Lower net interest expense reflects lower interest rates
Effective tax rate 29% -slightly higher than prior period which included non-assessable items
No significant items in 1HFY17
AppendixOutlookSegment resultsGroup resultsOverview
Continuing Operations A$mHalf Year
Dec 15
Half Year
Dec 16% Change
Revenue 220.2 223.4 1.5%
EBIT 36.8 39.2 6.6%
Interest Expense (3.3) (2.7) -18.2%
Tax Expense (9.3) (10.5) 12.9%
NPAT (Normalised) 24.2 26.0 7.5%
Significant Items After Tax 0.0 0.0 0.0%
NPAT (Reported) 24.2 26.0 7.5%
ROFE 17.7% 19.5% 1.8pp
EPS (cents per share) 8.67 9.85 13.6%

gwagroup.com.au 11
Continuing Operations EBIT up 7%
Improved mix in B&K from continued focus on higher margin products
Market volume growth continues to be in Multi-Residential and lower margin products – not a core focus for GWA
FX – recovery of impact of lower A$ in FY16
Further reduction in cost base to address cost inflation partly offset by investment in Marketing, NPD
Focus on margin resilience - Group EBIT margin 17.5% up 0.8ppts from prior period
AppendixOutlookSegment resultsGroup resultsOverview
36.839.2
(1.7)
0.62.7 0.8
0
5
10
15
20
25
30
35
40
45
Dec 15 Volume/Mix Price FX Net costchanges
Dec 16
A$
M
gwagroup.com.au 12
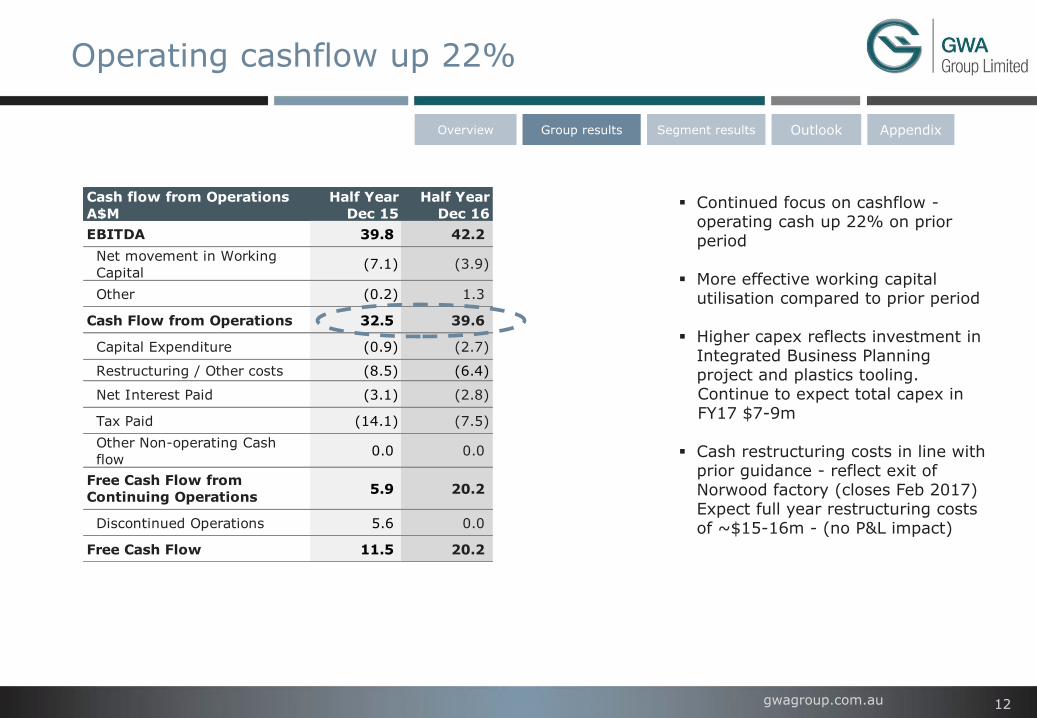
Operating cashflow up 22%
Continued focus on cashflow -operating cash up 22% on prior period
More effective working capital utilisation compared to prior period
Higher capex reflects investment in Integrated Business Planning project and plastics tooling. Continue to expect total capex in FY17 $7-9m
Cash restructuring costs in line with prior guidance - reflect exit of Norwood factory (closes Feb 2017) Expect full year restructuring costs of ~$15-16m - (no P&L impact)
AppendixOutlookSegment resultsGroup resultsOverview
Cash flow from Operations
A$M
Half Year
Dec 15
Half Year
Dec 16
EBITDA 39.8 42.2
Net movement in Working
Capital(7.1) (3.9)
Other (0.2) 1.3
Cash Flow from Operations 32.5 39.6
Capital Expenditure (0.9) (2.7)
Restructuring / Other costs (8.5) (6.4)
Net Interest Paid (3.1) (2.8)
Tax Paid (14.1) (7.5)
Other Non-operating Cash
flow0.0 0.0
Free Cash Flow from
Continuing Operations5.9 20.2
Discontinued Operations 5.6 0.0
Free Cash Flow 11.5 20.2

gwagroup.com.au 13
Strong financial position maintained
AppendixOutlookSegment resultsGroup resultsOverview
GWA remains in strong financial position - credit metrics continue to be consistent with investment grade
Syndicated banking facility extended in October 2016 – single 3-year revolving $225 million facility maturing October 2019
Substantial headroom within facilities - provides enhanced financial flexibility
Metric30 June
2014
30 June
2015
31 Dec
2015
30 June
2016
31 Dec
2016
Net Debt 149.4 94.8 90.8 88.4 92.0
Leverage Ratio
Net Debt / EBITDA 1.7 1.1 1.2 1.1 1.1
Interest Cover
EBITDA / Net Interest 8.5 12.8 14.8 14.3 15.8
Gearing
Net Debt / (Net Debt +
Equity)
26% 24% 22% 22% 23%
gwagroup.com.au 14
Agenda
Overview Tim SaltManaging Director
Group financial results Patrick GibsonChief Financial Officer
Segment results Patrick Gibson
Summary and outlook Tim Salt
AppendixOutlookSegment resultsGroup resultsOverview
gwagroup.com.au 15
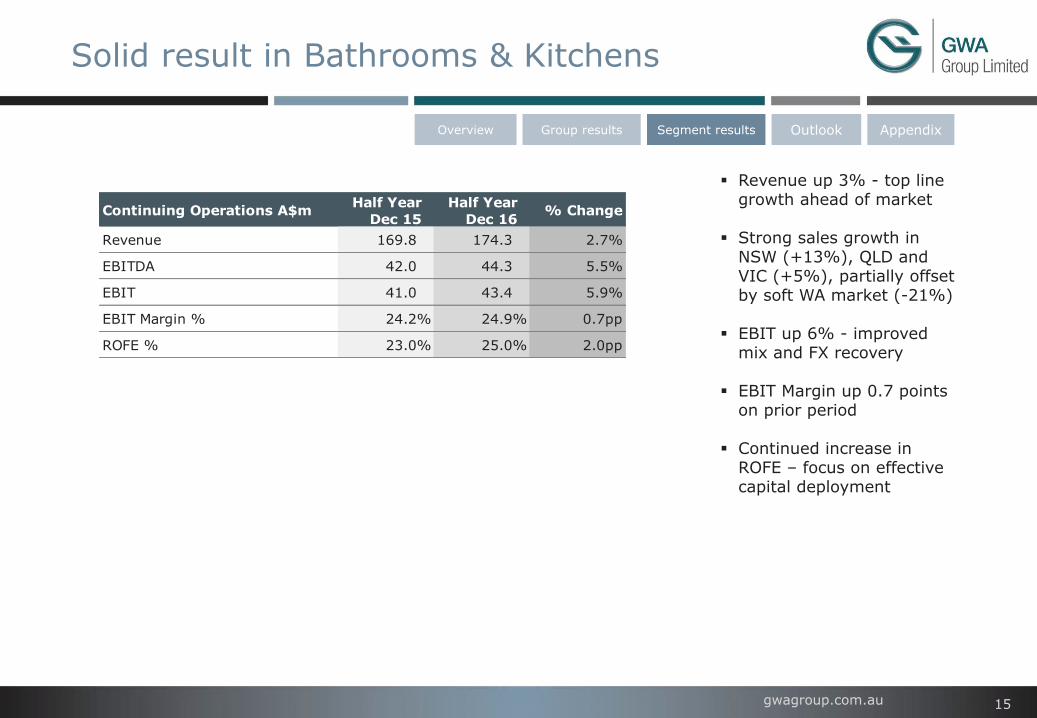
Solid result in Bathrooms & Kitchens
AppendixOutlookSegment resultsGroup resultsOverview
Revenue up 3% - top line growth ahead of market
Strong sales growth in NSW (+13%), QLD and VIC (+5%), partially offset by soft WA market (-21%)
EBIT up 6% - improved mix and FX recovery
EBIT Margin up 0.7 points on prior period
Continued increase in ROFE – focus on effective capital deployment
Continuing Operations A$mHalf Year
Dec 15
Half Year
Dec 16% Change
Revenue 169.8 174.3 2.7%
EBITDA 42.0 44.3 5.5%
EBIT 41.0 43.4 5.9%
EBIT Margin % 24.2% 24.9% 0.7pp
ROFE % 23.0% 25.0% 2.0pp
gwagroup.com.au 16
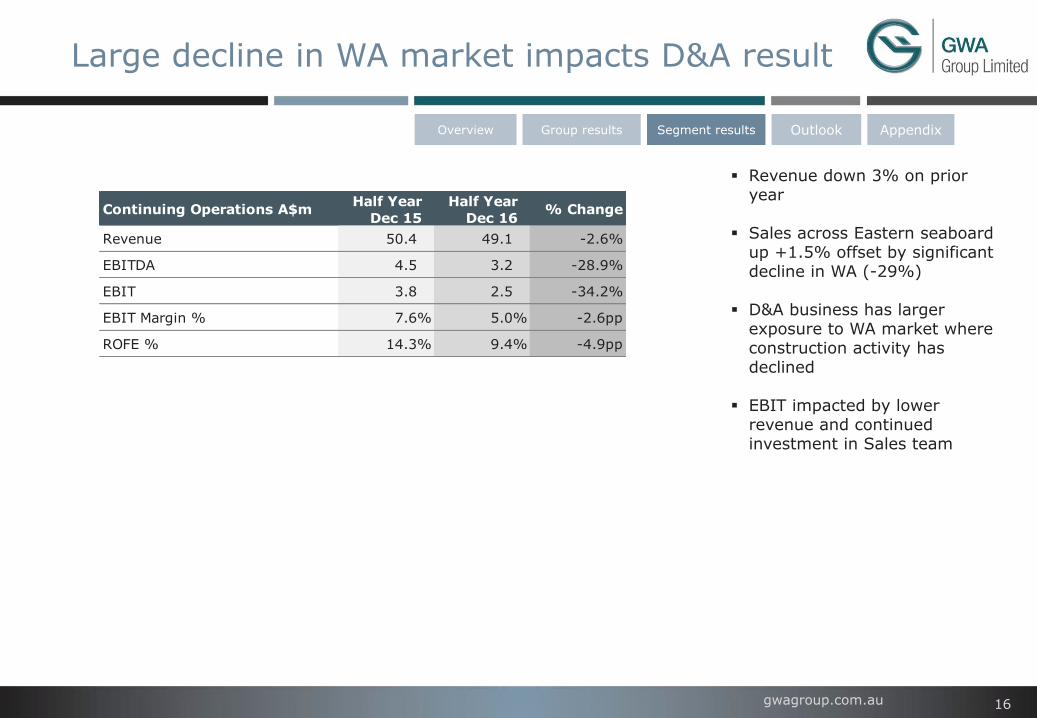
Large decline in WA market impacts D&A result
AppendixOutlookSegment resultsGroup resultsOverview
Revenue down 3% on prior year
Sales across Eastern seaboard up +1.5% offset by significant decline in WA (-29%)
D&A business has larger exposure to WA market where construction activity has declined
EBIT impacted by lower revenue and continued investment in Sales team
Continuing Operations A$mHalf Year
Dec 15
Half Year
Dec 16% Change
Revenue 50.4 49.1 -2.6%
EBITDA 4.5 3.2 -28.9%
EBIT 3.8 2.5 -34.2%
EBIT Margin % 7.6% 5.0% -2.6pp
ROFE % 14.3% 9.4% -4.9pp
gwagroup.com.au 17
Agenda
Overview Tim SaltManaging Director
Group financial results Patrick GibsonChief Financial Officer
Segment results Patrick Gibson
Summary and outlook Tim Salt
AppendixOutlookSegment resultsGroup ResultsOverview

gwagroup.com.au 18
Continuing to progress strategy
AppendixOutlookSegment resultsGroup resultsOverview
Leverage and build on core assets & brands to drive revenue and market share growth
Build an advantaged Supply Chain to deliver superior NPD, Quality and Service at best cost
Build “fit for future” culture, engagement and capability
Add value to customers through improved insights, analytics and processes
Drive cost out in SG&A and Supply Chain to improve profitability and allow selective reinvestment
• Corporate cost base re-aligned – continued focus on SG&A • New sea freight partner – lower costs, improved container yield• Implementing Asian consolidation supply centres • Remain on track for $13-15m cost reduction by FY19
• Dual-sourcing capability established for supply assurance• Integrated Business Planning now established across B&K and D&A• Implementing track and trace capability
• Launched talent plan – Get, Keep, Grow• Implement sales training/customer value proposition – focus on D&A • Business simplification – focus on agility and customer responsiveness
• Progressing joint business planning sessions with major customers• Tailored product innovation in partnership with major merchants • Increased visibility in customers’ showrooms
• Launch next range of Cleanflush 2HFY17• New consumer experience centres opening • Enhanced digital consumer engagement• NPD pipeline focused on R&R market
Strategic Priority Update on Progress
gwagroup.com.au 19
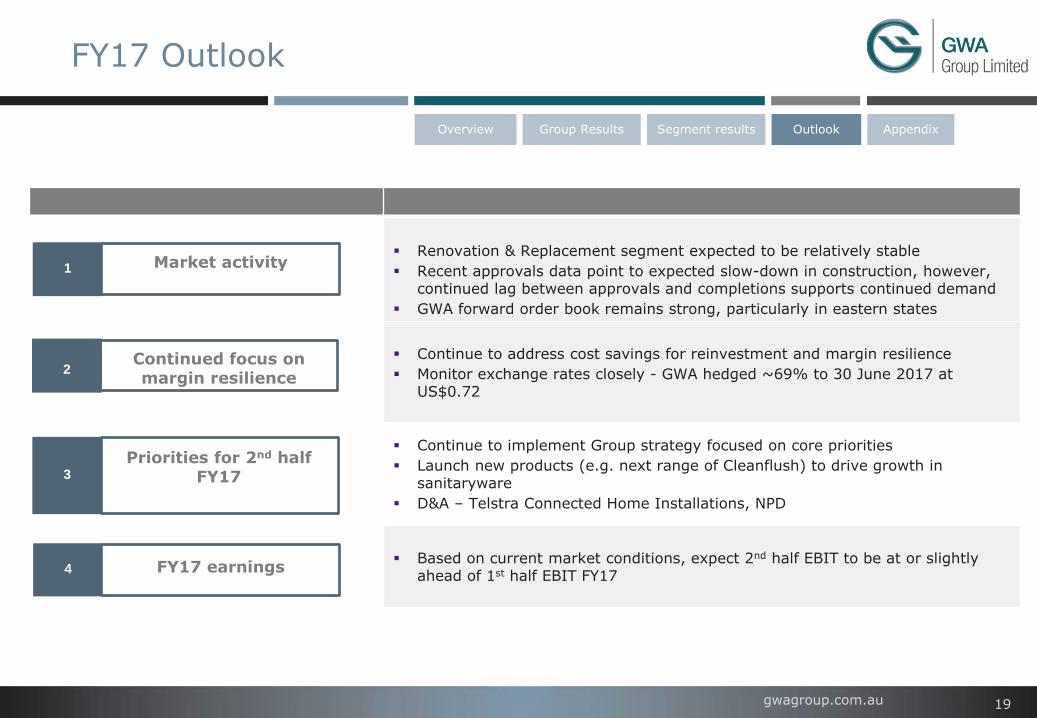
FY17 Outlook
Renovation & Replacement segment expected to be relatively stable
Recent approvals data point to expected slow-down in construction, however, continued lag between approvals and completions supports continued demand
GWA forward order book remains strong, particularly in eastern states
Continue to address cost savings for reinvestment and margin resilience
Monitor exchange rates closely - GWA hedged ~69% to 30 June 2017 at US$0.72
Continue to implement Group strategy focused on core priorities
Launch new products (e.g. next range of Cleanflush) to drive growth in sanitaryware
D&A – Telstra Connected Home Installations, NPD
Based on current market conditions, expect 2nd half EBIT to be at or slightly ahead of 1st half EBIT FY17
1 Market activity
3
Priorities for 2nd half FY17
4 FY17 earnings
AppendixOutlookSegment resultsGroup ResultsOverview
Continued focus on margin resilience
2

gwagroup.com.au
Results Presentation
20 February 2017
gwagroup.com.au
Appendix
gwagroup.com.au 22
AppendixOutlookSegment resultsGroup resultsOverview
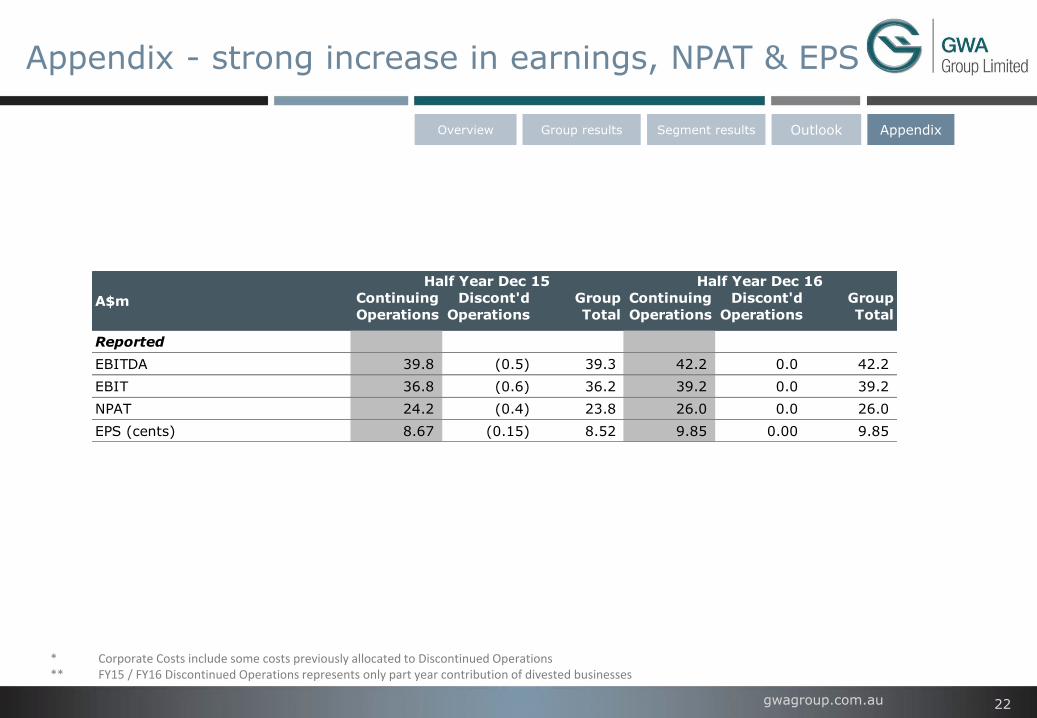
* Corporate Costs include some costs previously allocated to Discontinued Operations** FY15 / FY16 Discontinued Operations represents only part year contribution of divested businesses
Appendix - strong increase in earnings, NPAT & EPS
Continuing
Operations
Discont'd
Operations
Group
Total
Continuing
Operations
Discont'd
Operations
Group
Total
Reported
EBITDA 39.8 (0.5) 39.3 42.2 0.0 42.2
EBIT 36.8 (0.6) 36.2 39.2 0.0 39.2
NPAT 24.2 (0.4) 23.8 26.0 0.0 26.0
EPS (cents) 8.67 (0.15) 8.52 9.85 0.00 9.85
Half Year Dec 16
A$m
Half Year Dec 15
gwagroup.com.au 23
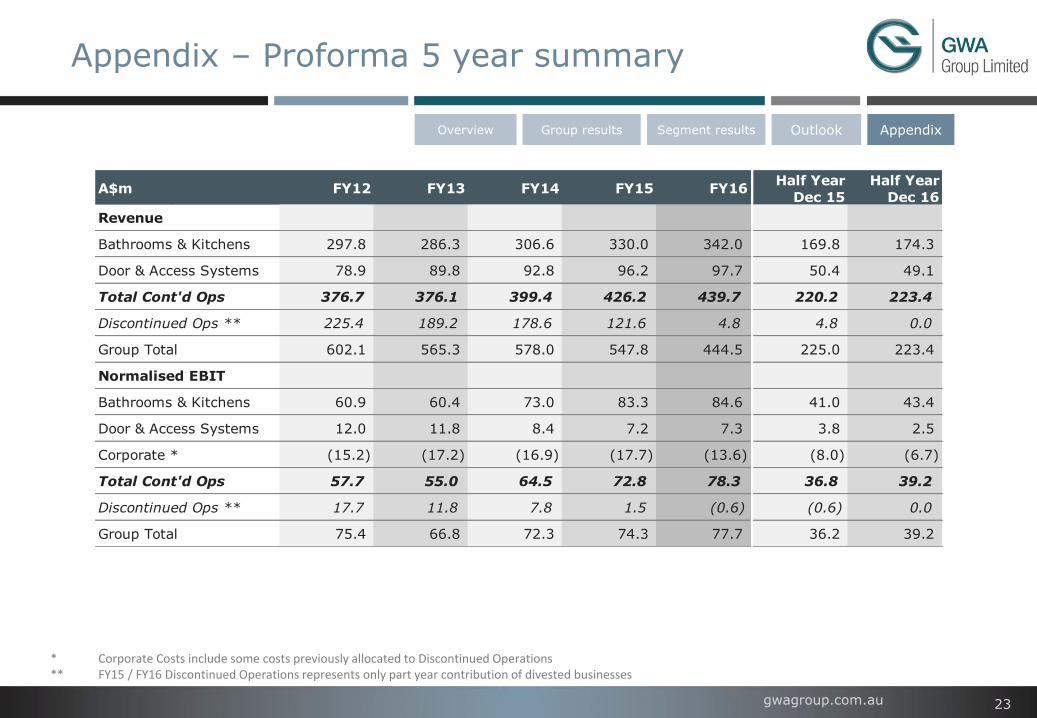
Appendix – Proforma 5 year summary
AppendixOutlookSegment resultsGroup resultsOverview
* Corporate Costs include some costs previously allocated to Discontinued Operations** FY15 / FY16 Discontinued Operations represents only part year contribution of divested businesses
A$m FY12 FY13 FY14 FY15 FY16Half Year
Dec 15
Half Year
Dec 16
Revenue
Bathrooms & Kitchens 297.8 286.3 306.6 330.0 342.0 169.8 174.3
Door & Access Systems 78.9 89.8 92.8 96.2 97.7 50.4 49.1
Total Cont'd Ops 376.7 376.1 399.4 426.2 439.7 220.2 223.4
Discontinued Ops ** 225.4 189.2 178.6 121.6 4.8 4.8 0.0
Group Total 602.1 565.3 578.0 547.8 444.5 225.0 223.4
Normalised EBIT
Bathrooms & Kitchens 60.9 60.4 73.0 83.3 84.6 41.0 43.4
Door & Access Systems 12.0 11.8 8.4 7.2 7.3 3.8 2.5
Corporate * (15.2) (17.2) (16.9) (17.7) (13.6) (8.0) (6.7)
Total Cont'd Ops 57.7 55.0 64.5 72.8 78.3 36.8 39.2
Discontinued Ops ** 17.7 11.8 7.8 1.5 (0.6) (0.6) 0.0
Group Total 75.4 66.8 72.3 74.3 77.7 36.2 39.2

gwagroup.com.au
Results PresentationHalf-year ended 31 December 2016
20 February 2017