results presentation - dmgt.com/media/files/d/dmgt/results 2018/hy18... · statements contained in...
TRANSCRIPT
Results Presentation
Thursday 24 May 2018
Half year ended 31 March 2018
Paul Zwillenberg, CEO
Tim Collier, CFO

© 2018 DMGT
Disclaimer
2
Certain statements in this presentation are forward looking statements. By their nature, forward looking statements involve a number of risks, uncertainties or assumptions that could cause actual results or events to differ materially from those expressed or implied by the forward looking statements. These risks, uncertainties or assumptions could adversely affect the outcome and financial effects of the plans and events described herein. Forward looking statements contained in this presentation regarding past trends or activities should not be taken as representation that such trends or activities will continue in the future. You should not place undue reliance on forward looking statements, which apply only as of the date of this presentation.
This presentation does not constitute or form part of any offer or invitation to sell, or any solicitation of any offer to purchase any shares in the Company, nor shall it or any part of it or the fact of its distribution form the basis of, or be relied on in connection with, any contract or commitment or investment decisions relating thereto, nor does it constitute a recommendation regarding the shares of the Company. Past performance cannot be relied upon as a guide to future performance.

© 2018 DMGT 3
Group underlying revenues +1%; stable underlying operating profit- Good B2B performance: underlying revenues +4% and margin improvement- Challenging Consumer Media conditions: underlying revenues –3%, margin 11%
Strategy on track and delivering against priorities
Strong balance sheet: - Net debt:EBITDA ratio of 1.2x including EDR* proceeds- ZPG Plc: recommended offer, c.£640m potential proceeds
Continued real dividend growth
Half Year 2018: Performance in line with expectations
Note: * EDR disposal proceeds received in April 2018.

Financial performanceTim Collier, CFO
4
2
© 2018 DMGT
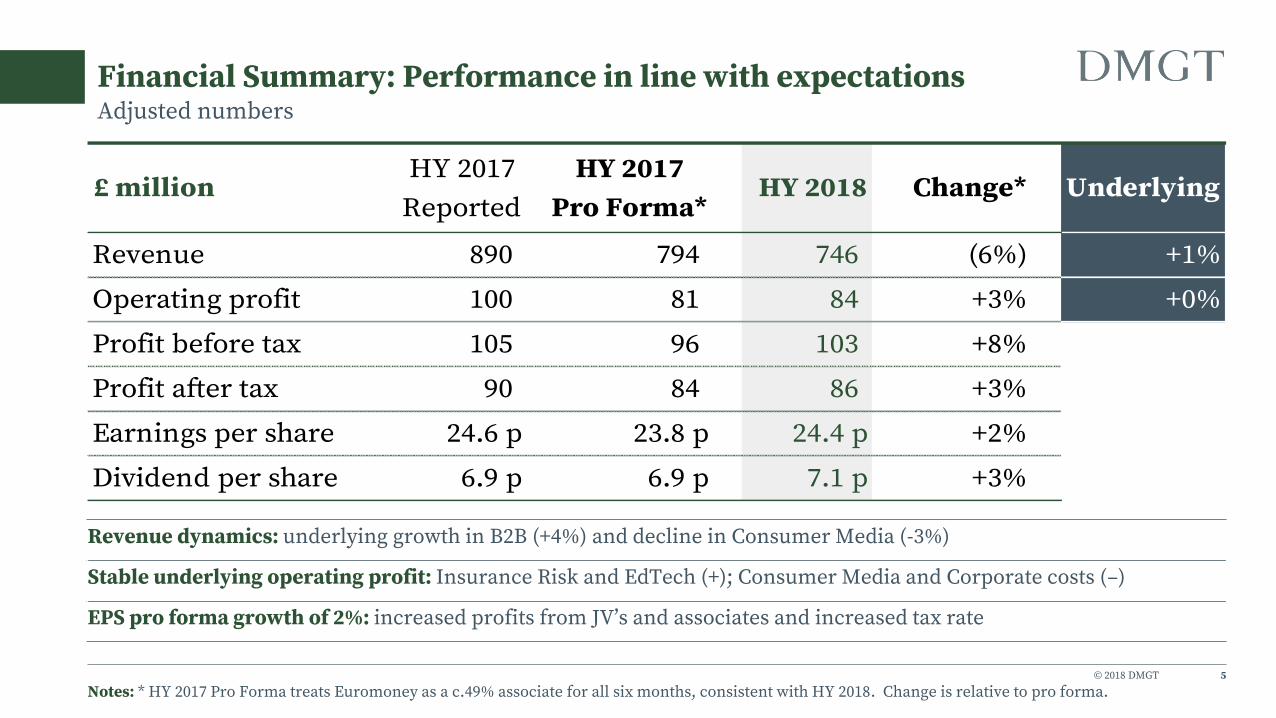
Financial Summary: Performance in line with expectations
5
Adjusted numbers
Revenue dynamics: underlying growth in B2B (+4%) and decline in Consumer Media (-3%)
Stable underlying operating profit: Insurance Risk and EdTech (+); Consumer Media and Corporate costs (–)
EPS pro forma growth of 2%: increased profits from JV’s and associates and increased tax rate
Notes: * HY 2017 Pro Forma treats Euromoney as a c.49% associate for all six months, consistent with HY 2018. Change is relative to pro forma.
£ millionHY 2017
Reported
HY 2017
Pro Forma*HY 2018 Change* Underlying
Revenue 890 794 746 (6%) +1%
Operating profit 100 81 84 +3% +0%
Profit before tax 105 96 103 +8%
Profit after tax 90 84 86 +3%
Earnings per share 24.6 p 23.8 p 24.4 p +2%
Dividend per share 6.9 p 6.9 p 7.1 p +3%

© 2018 DMGT
Financial Summary: Statutory numbers
6
HY 2017 profit for the period and EPS included benefit of gains on Euromoney transaction
Reduction in exceptional cash items in HY 2018
£ million HY 2017 HY 2018 Change
Revenue 794 746 (6%)
Operating profit 17 133 +675%
Profit before tax 41 113 +177%
Profit on sale of assets 530 41 (92%)
Profit for the period 550 117 (79%)
Earnings per share 155.8 p 32.2 p (79%)

7
B2B
© 2018 DMGT
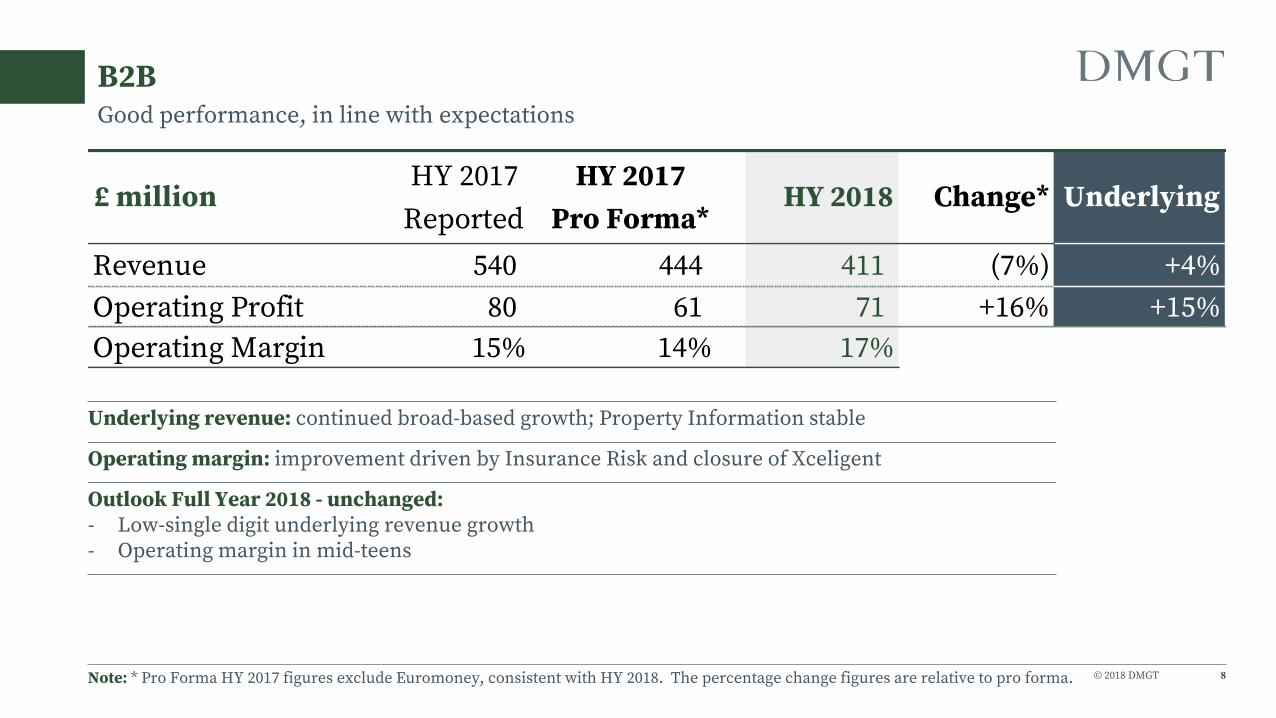
B2B
8
Good performance, in line with expectations
Underlying revenue: continued broad-based growth; Property Information stable
Operating margin: improvement driven by Insurance Risk and closure of Xceligent
Outlook Full Year 2018 - unchanged: - Low-single digit underlying revenue growth- Operating margin in mid-teens
Note: * Pro Forma HY 2017 figures exclude Euromoney, consistent with HY 2018. The percentage change figures are relative to pro forma.
£ millionHY 2017
Reported
HY 2017
Pro Forma*HY 2018 Change* Underlying
Revenue 540 444 411 (7%) +4%
Operating Profit 80 61 71 +16% +15%
Operating Margin 15% 14% 17%

© 2018 DMGT
Insurance Risk: RMS
9
Good performance, in line with expectations
Underlying revenue: continued growth; benefit of one-off project revenues
Margin benefited from timing benefits to cost base: not expected to repeat in H2
Strong model pipeline: 4 new HD models available in 2018; RiskLink18 to be released July 2018
RMS(one): modular approach being taken – greater flexibility for clients
£ million HY 2017 HY 2018 Change Underlying
Revenue 117 113 (4%) +6%
Operating Profit 16 20 +26% +52%
Operating Margin 13% 17%
© 2018 DMGT
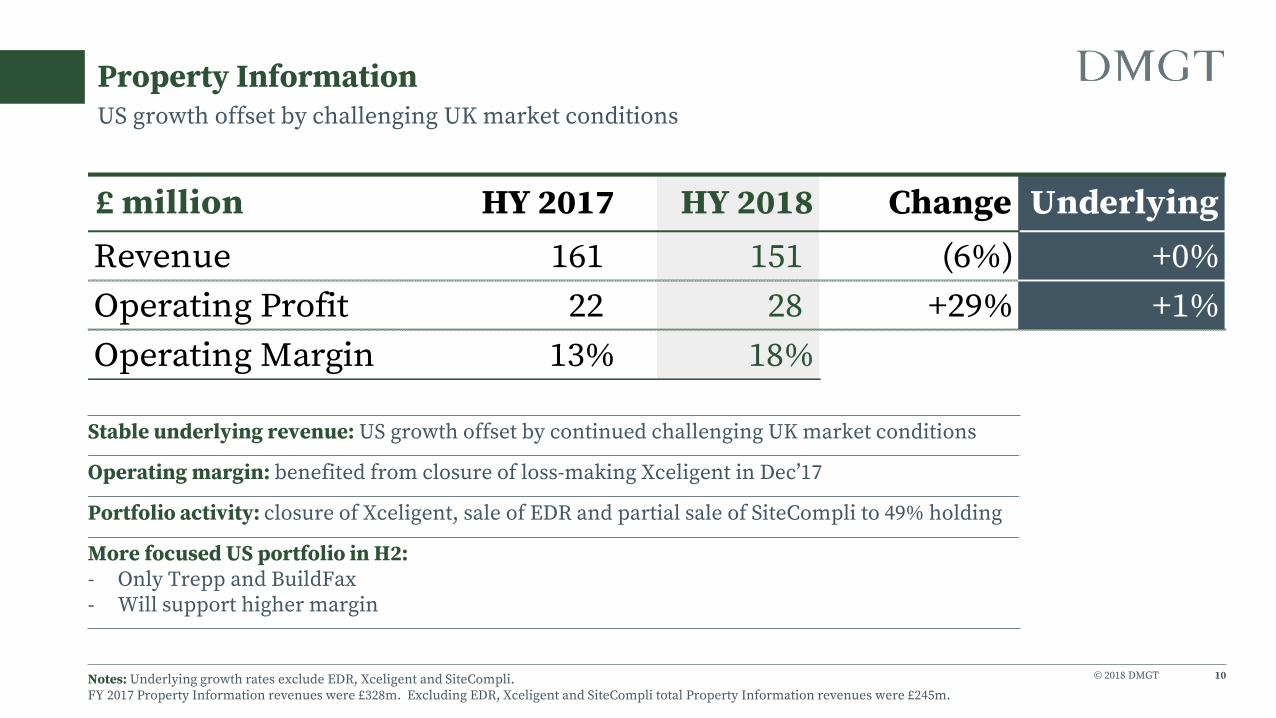
Property Information
10
US growth offset by challenging UK market conditions
Stable underlying revenue: US growth offset by continued challenging UK market conditions
Operating margin: benefited from closure of loss-making Xceligent in Dec’17
Portfolio activity: closure of Xceligent, sale of EDR and partial sale of SiteCompli to 49% holding
More focused US portfolio in H2: - Only Trepp and BuildFax - Will support higher margin
Notes: Underlying growth rates exclude EDR, Xceligent and SiteCompli. FY 2017 Property Information revenues were £328m. Excluding EDR, Xceligent and SiteCompli total Property Information revenues were £245m.
£ million HY 2017 HY 2018 Change Underlying
Revenue 161 151 (6%) +0%
Operating Profit 22 28 +29% +1%
Operating Margin 13% 18%

© 2018 DMGT
EdTech: Hobsons
11
Strong growth
Underlying revenue: continued growth across all three businesses - Naviance, Intersect and Starfish
Underlying operating profit: £4m year-on-year improvement, benefits of PIP
Impact of disposal of Hobsons’ Admissions and Solutions businesses: - Reduced revenue and margin in H1- More pronounced impact in H2, due to seasonality
Note: * The underlying operating profit performance has improved from a loss to a profit, with a £4m improvement.
£ million HY 2017 HY 2018 Change
Revenue 54 33 (40%) +10%
Operating Profit 3 3 +19% N/A *
Operating Margin 5% 10%
Underlying
© 2018 DMGT
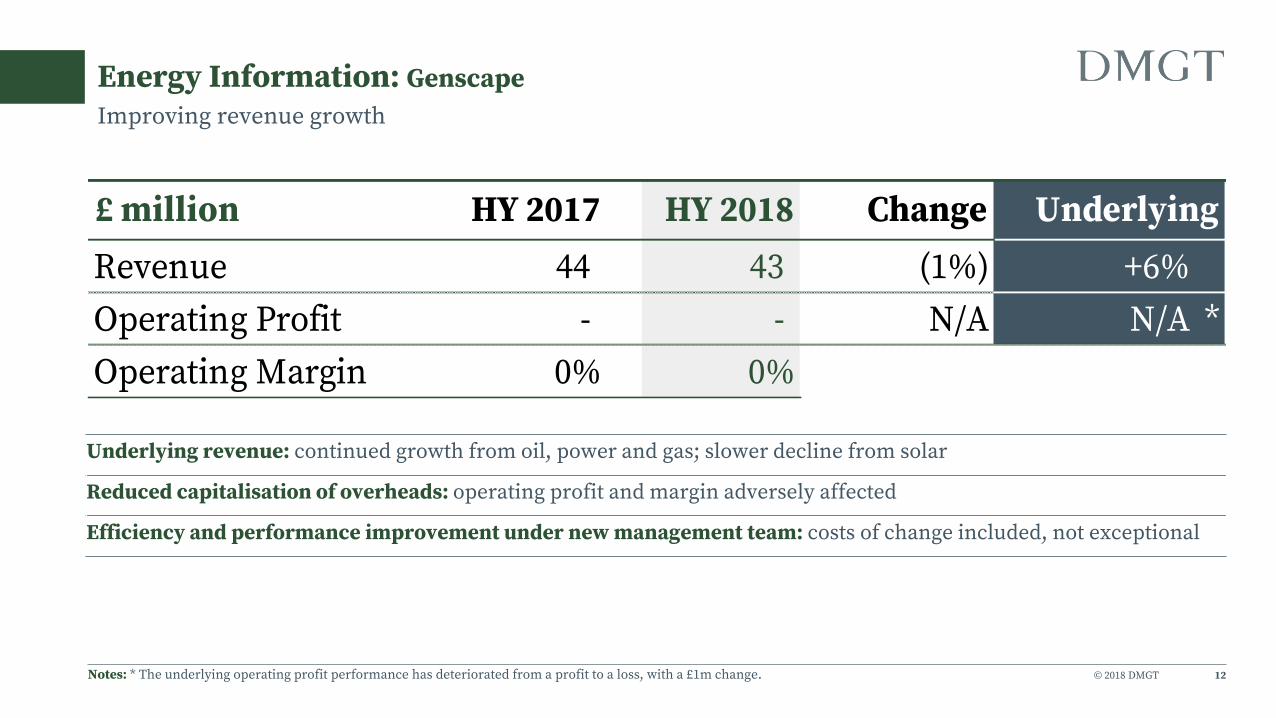
Energy Information: Genscape
12
Improving revenue growth
Underlying revenue: continued growth from oil, power and gas; slower decline from solar
Reduced capitalisation of overheads: operating profit and margin adversely affected
Efficiency and performance improvement under new management team: costs of change included, not exceptional
Notes: * The underlying operating profit performance has deteriorated from a profit to a loss, with a £1m change.
£ million HY 2017 HY 2018 Change
Revenue 44 43 (1%) +6%
Operating Profit - - N/A N/A *
Operating Margin 0% 0%
Underlying
© 2018 DMGT
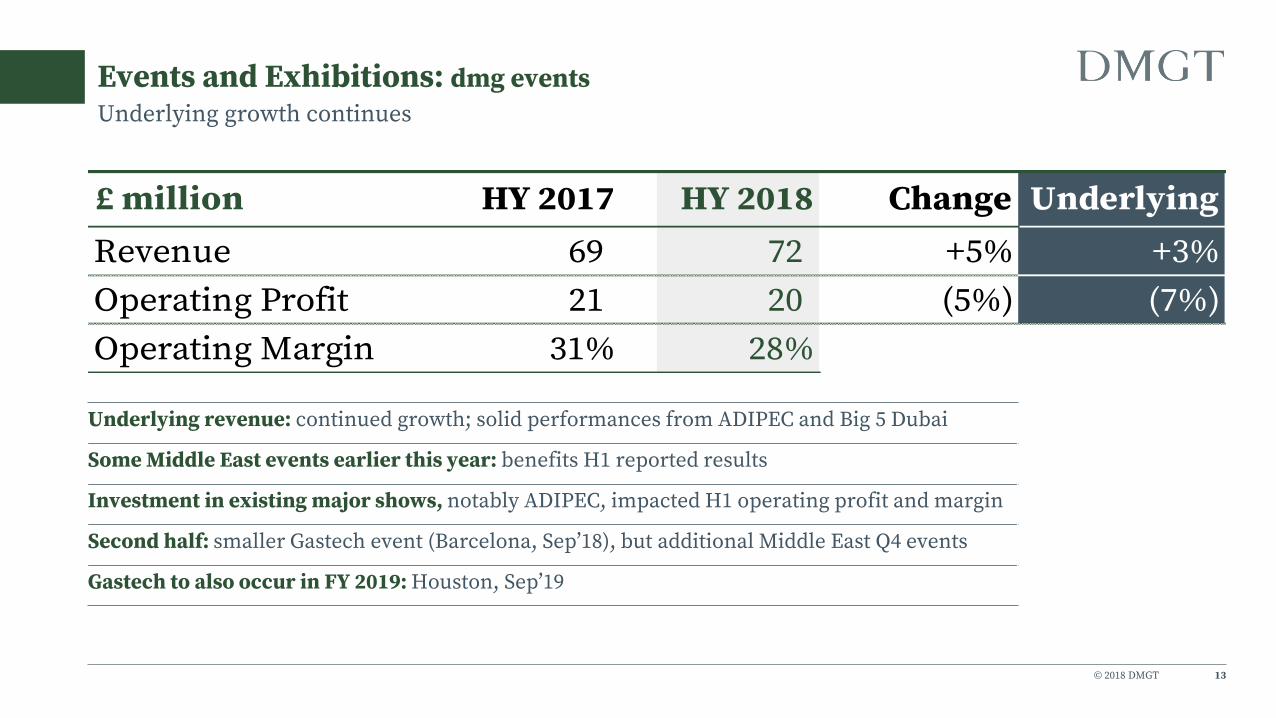
Events and Exhibitions: dmg events
13
Underlying growth continues
Underlying revenue: continued growth; solid performances from ADIPEC and Big 5 Dubai
Some Middle East events earlier this year: benefits H1 reported results
Investment in existing major shows, notably ADIPEC, impacted H1 operating profit and margin
Second half: smaller Gastech event (Barcelona, Sep’18), but additional Middle East Q4 events
Gastech to also occur in FY 2019: Houston, Sep’19
£ million HY 2017 HY 2018 Change Underlying
Revenue 69 72 +5% +3%
Operating Profit 21 20 (5%) (7%)
Operating Margin 31% 28%

14
Consumer Media

© 2018 DMGT
dmg media
15
Strong performance in challenging markets, in line with expectations
Underlying revenue: declining circulation (-6%) and stable advertising (digital +5%, print –3%)
MailOnline continued to grow direct audience; indirect traffic impacted by search and social platform dynamics
Profit benefit from Elite Daily disposal and 7 Days closure: - £4m impact, HY 2017 like-for-like operating margin of 12%; no year-on-year benefit in H2
Outlook Full Year 2018 - unchanged: - Mid-single digit underlying revenue decline; continued challenging advertising market- Operating margin around 10%
£ million HY 2017 HY 2018 Change Underlying
Revenue 350 335 (4%) (3%)
Operating Profit 36 38 +5% (8%)
Operating Margin 10% 11%

© 2018 DMGT
dmg media
16
Revenue
£ million HY 2017 HY 2018 Change Underlying
Daily Mail / The Mail on Sunday 234 219 (6%) (6%)
circulation 155 147 (6%) (6%)
advertising 71 64 (9%) (9%)
other 8 8 +0% +0%
MailOnline 60 61 +2% +5%
Mail Businesses 293 280 (5%) (4%)
Metro 34 37 +8% +8%
Newsprint & other 18 18 +2% +9%
Total Continuing 345 335 (3%) (3%)
Elite Daily & 7 Days 5 - (100%)
Total Revenue 350 335 (4%) (3%)
© 2018 DMGT
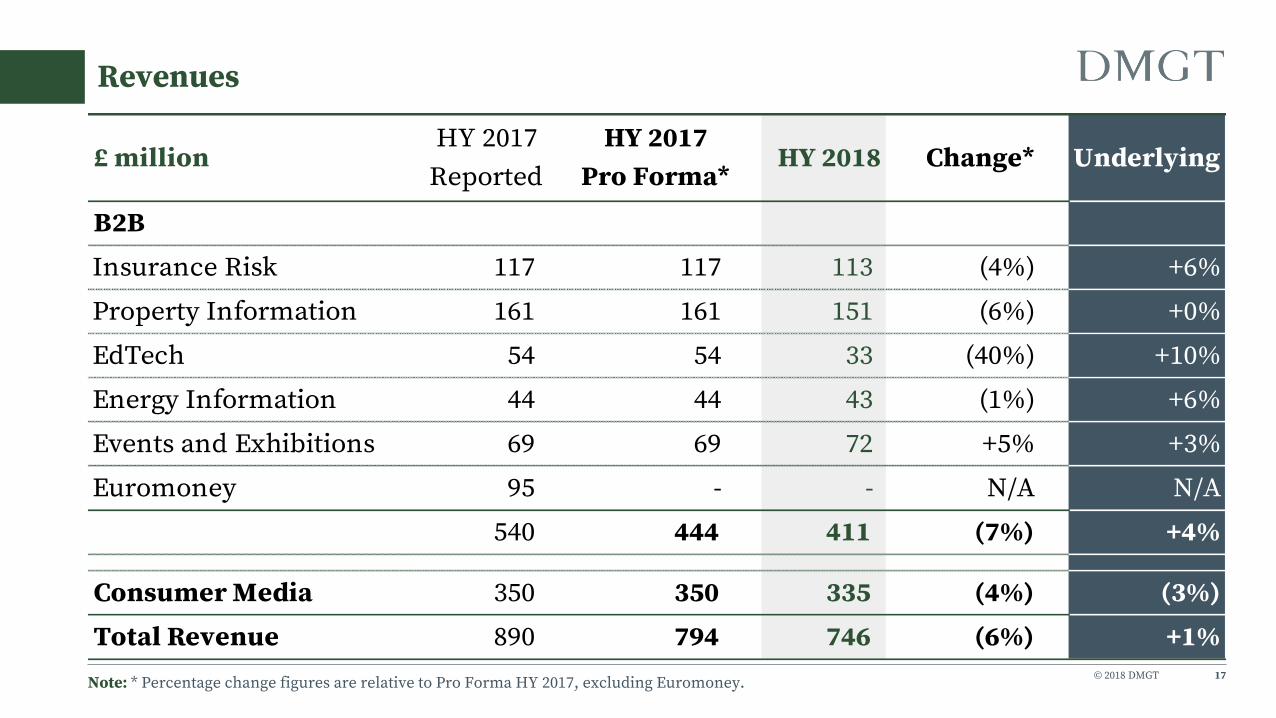
Revenues
17Note: * Percentage change figures are relative to Pro Forma HY 2017, excluding Euromoney.
£ millionHY 2017
Reported
HY 2017
Pro Forma*HY 2018 Change* Underlying
B2B
Insurance Risk 117 117 113 (4%) +6%
Property Information 161 161 151 (6%) +0%
EdTech 54 54 33 (40%) +10%
Energy Information 44 44 43 (1%) +6%
Events and Exhibitions 69 69 72 +5% +3%
Euromoney 95 - - N/A N/A
540 444 411 (7%) +4%
Consumer Media 350 350 335 (4%) (3%)
Total Revenue 890 794 746 (6%) +1%

© 2018 DMGT
Operating profit
18Notes: 1) Percentage change figures are relative to Pro Forma HY 2017, excluding Euromoney.2) EdTech underlying performance improved by c.£4m from loss to profit; Energy Information deteriorated by c.£1m from profit to loss.
£ millionHY 2017
Reported
HY 2017
Pro Forma¹HY 2018 Change¹ Underlying
B2B
Insurance Risk 16 16 20 +26% +52%
Property Information 22 22 28 +29% +1%
EdTech 3 3 3 +19% N/A²
Energy Information - - - N/A N/A²
Events and Exhibitions 21 21 20 (5%) (7%)
Euromoney 19 - - N/A N/A
80 61 71 +16% +15%
Consumer Media 36 36 38 +5% (8%)
Corporate costs (16) (16) (24) (54%) (32%)
Total operating profit 100 81 84 +3% +0%

© 2018 DMGT
Joint ventures & Associates
19
Euromoney: underlying revenues +4%, adjusted PBT +6%; sold Global Markets Intelligence Division in Apr’18
ZPG Plc: continued strong performance; revenue +33%, adjusted EBITDA +41%
Other JV’s & Associates: increased investment in early stage businesses, e.g. DailyMailTV (commissioned for 2nd season)
Full Year 2018 guidance unchanged: ≥£75m share of operating profits²
DMGT’s share of operating profits
Notes: 1) Pro Forma HY 2017 figures treat Euromoney as a c.49% associate for all six months, consistent with HY 2018.2) Guidance excludes any impact from ZPG Plc disposal occurring pre year end.
£ millionHY 2017
Reported
HY 2017
Pro Forma¹HY 2018
Euromoney 16 26 27
ZPG 12 12 17
Other (1) (2) (4)
Total JV's & Associates 26 36 41

© 2018 DMGT
Adjusted results
20Note: * Percentage change figures are relative to Pro Forma HY 2017, which treats Euromoney as a c.49% associate for all six months, consistent with HY 2018.
£ millionHY 2017
Reported
HY 2017
Pro Forma*HY 2018 Change*
Adjusted operating profit 100 81 84 +3%
Joint ventures and associates 26 36 41
Net finance costs (21) (21) (21)
Adjusted profit before tax 105 96 103 +8%
Taxation (15) (14) (16)
Minorities (3) 2 (0)
Adjusted earnings 87 84 86 +3%
Adjusted EPS 24.6 p 23.8 p 24.4 p +2%
Adjusted tax rate 14.6% 14.2% 15.8%
© 2018 DMGT
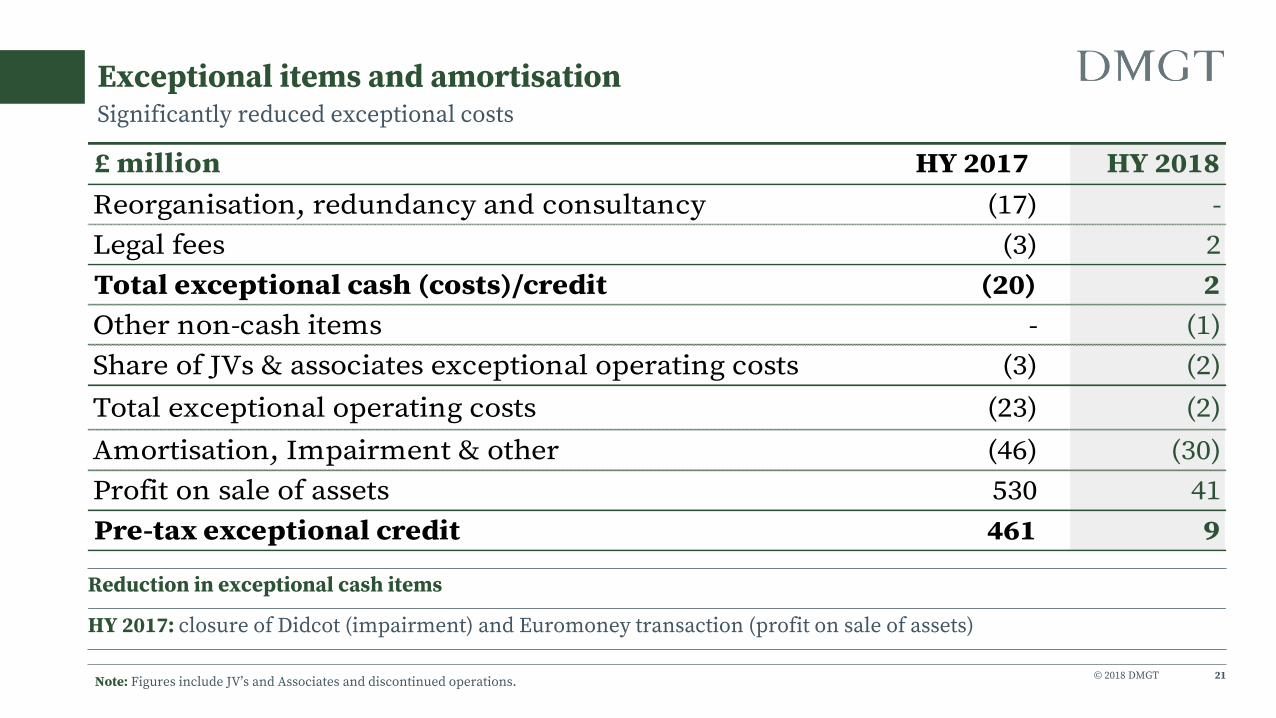
Exceptional items and amortisation
21
Significantly reduced exceptional costs
Note: Figures include JV’s and Associates and discontinued operations.
Reduction in exceptional cash items
HY 2017: closure of Didcot (impairment) and Euromoney transaction (profit on sale of assets)
£ million HY 2017 HY 2018
Reorganisation, redundancy and consultancy (17) -
Legal fees (3) 2
Total exceptional cash (costs)/credit (20) 2
Other non-cash items - (1)
Share of JVs & associates exceptional operating costs (3) (2)
Total exceptional operating costs (23) (2)
Amortisation, Impairment & other (46) (30)
Profit on sale of assets 530 41
Pre-tax exceptional credit 461 9

© 2018 DMGT
Net debt movement
22
464
388
1 13 17
56
17
146 24
11
350
400
450
500
550
600
Opening net debt Operating cash flow Taxation Pensions Interest Dividends M&A FX adjustment Closing net debt
£m
EDR Proceeds
534
Net debt:EBITDA 1.6x (vs. 1.6x Mar’17); 1.2x including Apr’18 EDR proceeds
Operating cash flow is stated after capex of £26m and exceptional operating items of c.£8m
Operating cash conversion 28% (vs. 22% HY 2017 pro forma); usual seasonal cash flows
Cash operating income of £87m: +4% on HY 2017 pro forma
£415m of new bank facilities to March 2023
Note: Operating cash conversion % = operating cash flow / adjusted operating profit

© 2018 DMGT 23
Clear capital allocation framework
Prioritise organic opportunities
Operating at scale: innovating at the core with pockets of growth capital
Focused growth: investment to drive revenue growth and/or margin
Early bets: disciplined seed capital
Dividend Commitment to dividend policy: real dividend growth
Balanced and flexible approach to
discretionary uses of capital
Acquisitions: structured & disciplined approach – no ‘deal fever’
Debt reduction / financial flexibility
Share buy-backs
Sustainable EPS growth underpinned by strong balance sheet

© 2018 DMGT 24
H1 performance in line with expectations
H2 considerations, as anticipated: • Challenging market conditions expected for UK property and
advertising (c.36%* of revenues)
• Disposals and closures: US Property Information, EdTech, Consumer Media
• Timing factors: Insurance Risk, Events and Exhibitions, ZPG Plc
• US$ / £ FX rate (FY 2017 $1.27 average)
Guidance unchanged
Financial Summary and H2 FY 2018 considerations
Note: * Share of FY 2017 Group revenues, adjusted to exclude businesses that have been sold or closed.

© 2018 DMGT
Revenue and profit outlook FY 2018
25
Corporate costs c.£45m
JV’s & Associates (pre-tax) ≥£75m²
Net finance costs c.£40m
Effective tax rate: c.18%
Notes: 1) Excluding Euromoney, Hobsons’ Admissions and Solutions businesses and EDR, the FY 2017 B2B revenues were £781m (at the FY 2017 FX rate of $1.27) and the operating margin was 13%. The total B2B revenues in FY 2017, including these businesses, was £976m and the margin was 16%.2) Guidance excludes any impact from ZPG Plc disposal occurring pre year end.
Outlook remains unchanged
Revenue MarginUnderlying revenue
growthMargin
B2B £781 m1 13%1 Low-single digit %¹ Mid-teens %
Consumer (dmg media) £683 m 11% Mid-single digit % decline Around 10%
FY 2017 Outlook FY 2018

Strategy and Business UpdatePaul Zwillenberg, CEO
26
3

© 2018 DMGT
Delivering sustainable returns over the long-term
27
Market leading positions
Sustained EPS and dividend
growth
Strong balance sheet
Growing, digitising
sectors
Intelligent Insights.
Consumer Connections
Revenue, profit and cash growth
Clear portfolio roles
Enabling balanced and flexible capital allocation
PerformanceImprovement Programme (PIP)
© 2018 DMGT
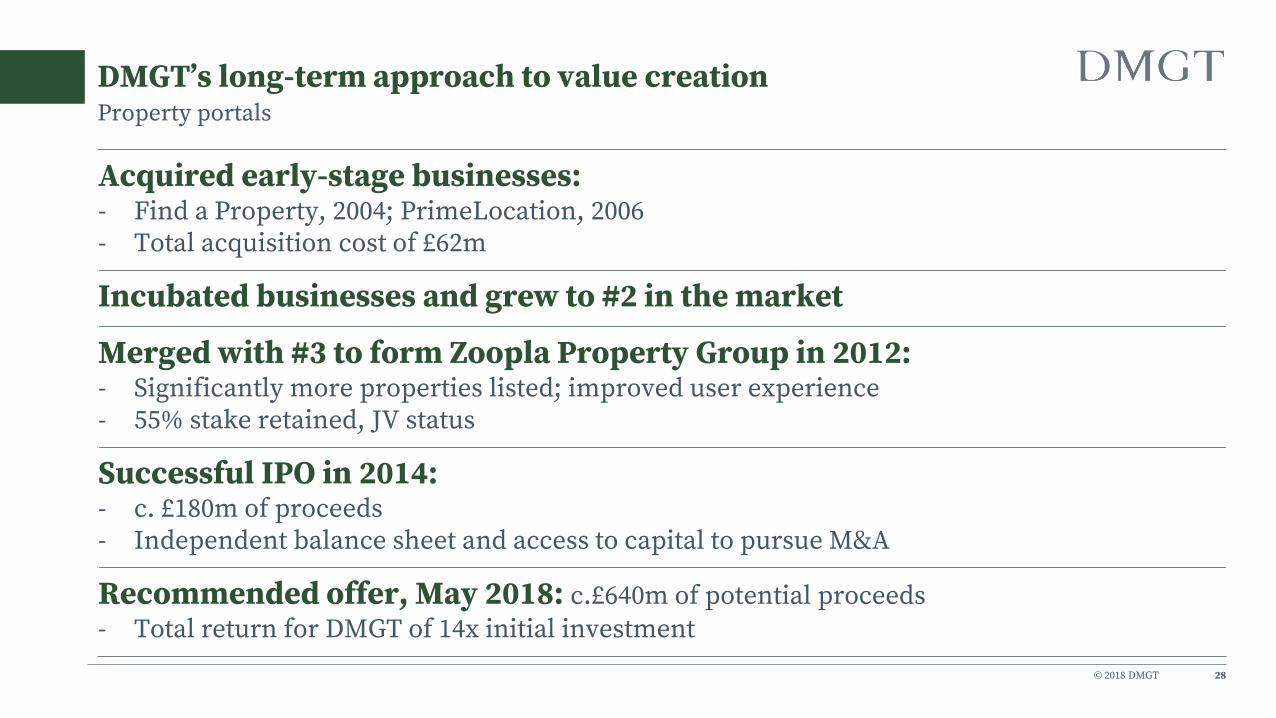
DMGT’s long-term approach to value creation
28
Acquired early-stage businesses:- Find a Property, 2004; PrimeLocation, 2006- Total acquisition cost of £62m
Incubated businesses and grew to #2 in the market
Merged with #3 to form Zoopla Property Group in 2012: - Significantly more properties listed; improved user experience- 55% stake retained, JV status
Successful IPO in 2014:- c. £180m of proceeds- Independent balance sheet and access to capital to pursue M&A
Recommended offer, May 2018: c.£640m of potential proceeds
- Total return for DMGT of 14x initial investment
Property portals

© 2018 DMGT 29
Intelligent Insights.
Consumer Connections
PerformanceImprovement Programme (PIP)
DMGT Strategy on track
Xceligent closure
EDR disposal
SiteCompli → associate
ZPG Plc expected disposal
Net debt:EBITDA 1.2xincluding EDR proceeds

© 2018 DMGT
Product
30
PIP delivery: HY 2018 initiatives
Commercial
Operations
Operating at scale Focused growth Early bets
People
Technology
Completed new TreppLoanCRE platform
Delivered new Naviance Student
Commenced migration to new SearchFlow platform
DailyMailTV renewed for 2nd season
Focused operational priorities for speed and scaling
Implemented Product Launch Pad governance
Integrated advertising operations
New CTO leveraging technology for next-gen event management
Shortened sales cycle by more than 33%
On-boarded new leadership with enterprise SaaS expertise
Accelerating development of machine learning in existing and
adjacent markets
Applying machine learning to improve predictive modelling performance and reduce costs

© 2018 DMGT
Summary
31
Performance continues in line with our expectations
We are delivering against our strategic priorities:• Increasing portfolio focus• Enhancing financial flexibility• Improving operational execution
Transition continues
Priority is to deliver on DMGT’s long-term potential

Questions
32
4
Appendix
33
5
© 2018 DMGT
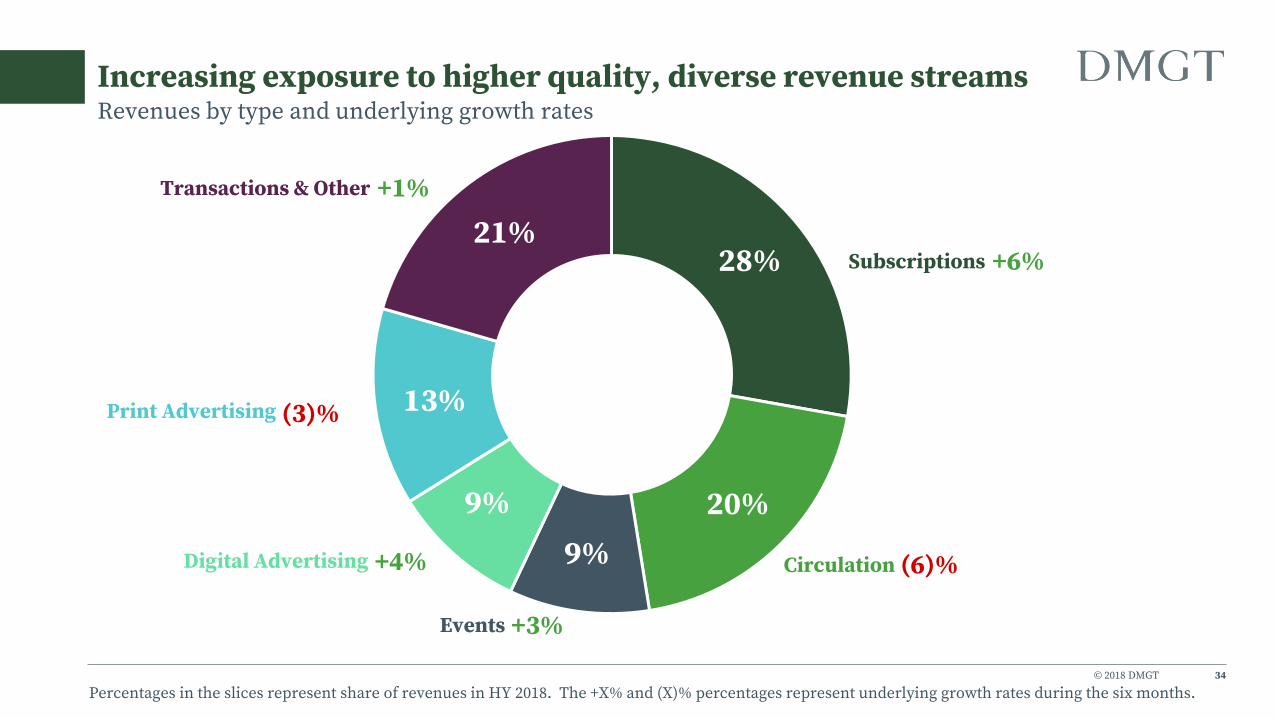
Increasing exposure to higher quality, diverse revenue streams
34
28%
20%
9%
9%
13%
21%
Circulation
Subscriptions
Events
Digital Advertising
Print Advertising
Transactions & Other
Percentages in the slices represent share of revenues in HY 2018. The +X% and (X)% percentages represent underlying growth rates during the six months.
Revenues by type and underlying growth rates
+6%
(6)%
+3%
+4%
+1%
(3)%

© 2018 DMGT
Geographical diversity
35
HY 2018 Revenues HY 2018 Profits
53%UK
29%North America
18%Rest of World
40%UK
31%North America
29%Rest of World
Revenues by destination and profits by source Rest of World revenues, 18%: 10% Rest of Europe, 8% Asia, Middle East, Caribbean, Africa and Latin America

© 2018 DMGT
Revenue dynamics
36
Continued subscription growth
Notes: * HY 2017 Pro Forma excludes Euromoney, consistent with HY 2018. Change is relative to pro forma.Share of revenues shown to nearest whole percentage.
£ million % of totalHY 2017
Reported
HY 2017
Pro Forma*HY 2018 Change* Underlying
Advertising - print 13% 111 104 100 (4%) (3%)
- digital 9% 74 72 68 (6%) +4%
Circulation 20% 155 155 147 (6%) (6%)
Subscriptions 28% 290 227 206 (9%) +6%
Events, conferences and training 9% 93 68 71 +5% +3%
Transactions & other 21% 166 168 154 (8%) +1%
Total Revenue 100% 890 794 746 (6%) +1%
+0%

© 2018 DMGT
Category analysis
37
Revenues by type
£ millionInsurance
Risk
Property
InformationEdTech
Energy
Information
Events and
Exhibitions
Consumer
MediaTotal
Advertising - print - - - - 1 99 100
- digital - - 7 1 - 61 68
Circulation - - - - - 147 147
Subscriptions 106 40 22 37 - - 206
Events - - - - 71 - 71
Transactions & other 6 111 4 6 - 27 154
113 151 33 43 72 335 746

© 2018 DMGT
Geographical analysis
38
Revenues by destination
This table shows the revenues based on the location of the client receiving the goods or services
£ millionInsurance
Risk
Property
InformationEdTech
Energy
Information
Events and
Exhibitions
Consumer
MediaTotal
Revenue
UK 30 73 0 3 1 287 394
North America 61 62 32 35 3 25 216
Rest of World 22 17 1 5 68 23 135
113 151 33 43 72 335 746

© 2018 DMGT
Underlying analysis
39
Revenues
Underlying results are adjusted for constant exchange rates, the exclusion of disposals and closures, the inclusion of the year-on-year organic growth from acquisitions and for the consistent timing of revenue recognition.
For events, the comparisons are between events held in the year and the same events held the previous time. For Consumer Media, underlying revenues exclude low margin newsprint resale activities.
Amounts are stated rounded to the nearest £1m, consequently totals may not equal the sum of the component integers.
£ million % Underlying M&A Exchange Other Actual Underlying M&A Other Actual
B2B
Insurance Risk +6% 107 - (10) - 117 113 - - 113
Property Information +0% 117 (38) (6) - 161 117 (34) - 151
EdTech +10% 30 (21) (4) - 54 33 - - 33
Energy Information +6% 41 - (3) - 44 43 - - 43
Events and Exhibitions +3% 70 1 (6) 6 69 72 - - 72
Euromoney N/A - (95) - - 95 - - - -
+4% 363 (153) (29) 6 540 377 (34) - 411
Consumer Media (3%) 326 (5) (2) (17) 350 318 - (17) 335
Total +1% 690 (158) (31) (11) 890 695 (34) (17) 746
HY 2017 HY 2018

© 2018 DMGT
Underlying analysis
40
Adjusted operating profit
‘Other’ includes adjustments for the timing of shows at dmg events. For FY 2017, central dmg information costs allocated to Property Information, EdTechand Energy Information are reclassified to Corporate costs, consistent with all US central costs being included in Corporate costs in FY 2018.
Amounts are stated rounded to the nearest £1m, consequently totals may not equal the sum of the component integers.
* The underlying performance improved by £4m for EdTech and deteriorated by £1m for Energy Information.
£ million % Underlying M&A Exchange Other Actual Underlying M&A Other Actual
B2B
Insurance Risk +52% 13 - (3) - 16 20 - - 20
Property Information +1% 27 4 (1) 2 22 27 (1) - 28
EdTech N/A* (1) (5) - 1 3 3 - - 3
Energy Information N/A* 1 - - 1 - - - - -
Events and Exhibitions (7%) 21 - (2) 2 21 20 - (1) 20
Euromoney N/A - (19) - - 19 - - - -
+15% 61 (19) (5) 5 80 69 (1) (1) 71
Consumer Media (8%) 41 4 - - 36 38 - - 38
Corporate costs (32%) (19) - - (3) (16) (24) - - (24)
Operating profit +0% 83 (15) (5) 2 100 82 (1) (1) 84
HY 2018HY 2017

© 2018 DMGT
Net finance costs
41
Increased share of associates’ interest payable
Outlook Full Year 2018: net finance costs c.£40m
£ million HY 2017 HY 2018
Net interest payable pre JV's and Associates 20 18
Share of JV's and Associates finance costs 2 3
Net interest payable 21 21
Items excluded from adjusted results:
IAS19(Revised) finance costs / (credit) 3 (1)
© 2018 DMGT
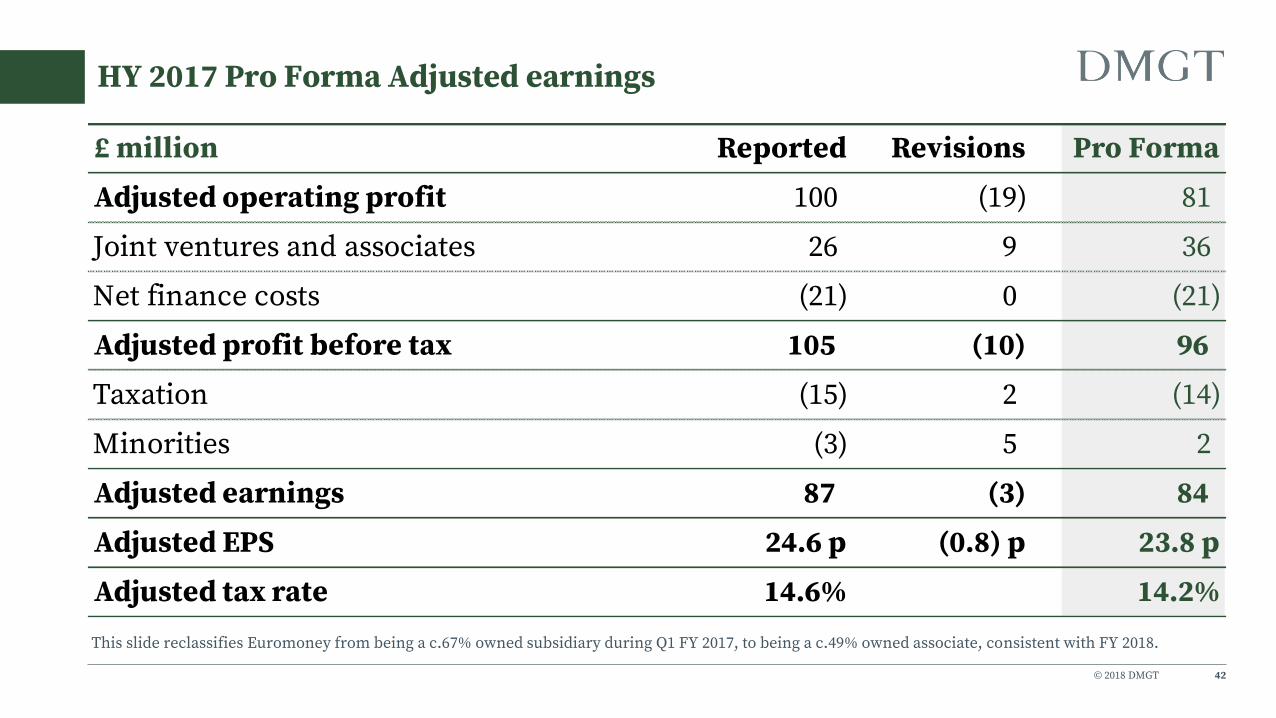
HY 2017 Pro Forma Adjusted earnings
42
This slide reclassifies Euromoney from being a c.67% owned subsidiary during Q1 FY 2017, to being a c.49% owned associate, consistent with FY 2018.
£ million Reported Revisions Pro Forma
Adjusted operating profit 100 (19) 81
Joint ventures and associates 26 9 36
Net finance costs (21) 0 (21)
Adjusted profit before tax 105 (10) 96
Taxation (15) 2 (14)
Minorities (3) 5 2
Adjusted earnings 87 (3) 84
Adjusted EPS 24.6 p (0.8) p 23.8 p
Adjusted tax rate 14.6% 14.2%

© 2018 DMGT
Exceptional items and amortisation
43
£ million HY 2017 HY 2018
Reorganisation, redundancy and consultancy (17) (0)
Legal fees (3) 2
Total exceptional cash (costs)/credit (20) 2
Other non-cash items - (1)
Exceptional operating (costs) / credit (20) 1
Share of JVs & associates exceptional operating costs (3) (2)
Total exceptional operating costs (23) (2)
Accelerated depreciation and impairment of plant (35) -
Impairment of intangible assets & goodwill (14) (2)
Amortisation of intangible assets (26) (19)
Profit on sale of assets 530 41
Other non-operating items 29 (9)
Pre-tax exceptional credit 461 9

© 2018 DMGT
Adjusting items
44
Reconciliation from statutory PBT to adjusted PBT
¹ The £530m profit on disposals in HY 2017 shown on slide 21 includes the profit on disposal of discontinued operations, which is excluded from statutory PBT as well as from adjusted PBT (since statutory results exclude discontinued operations). The profit on disposal of discontinued operations is effectively added in and then reversed back out in this reconciliation.
£ million HY 2017 HY 2018
Statutory Profit Before Tax - continuing operations 41 113
Add: Statutory PBT - discontinued operations 14 -
Add: Profit on disposal of discontinued operations ¹ 509 -
Statutory PBT including discontinued operations 564 113
Reverse: Pre-tax exceptional credit (slide 21) ¹ (461) (9)
Remove: IAS19(Revised) finance costs/(credit) (slide 41) 3 (1)
Adjusted Profit Before Tax 105 103
© 2018 DMGT
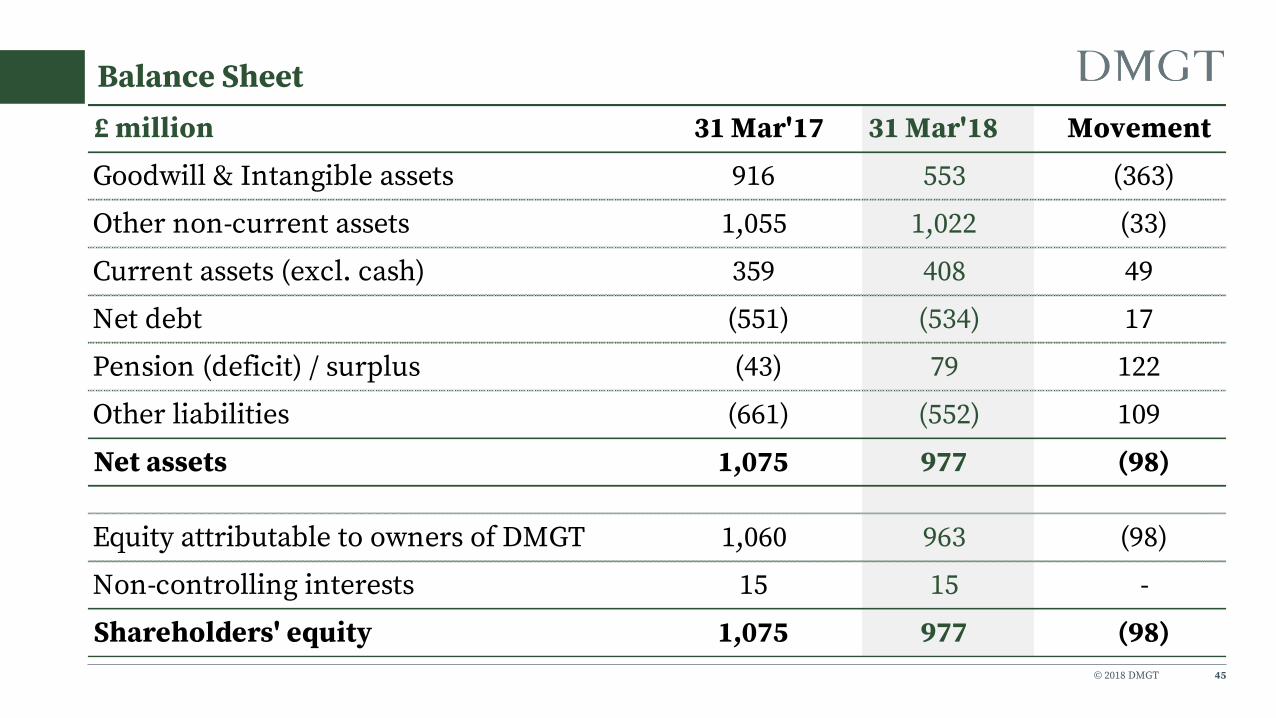
Balance Sheet
45
£ million 31 Mar'17 31 Mar'18 Movement
Goodwill & Intangible assets 916 553 (363)
Other non-current assets 1,055 1,022 (33)
Current assets (excl. cash) 359 408 49
Net debt (551) (534) 17
Pension (deficit) / surplus (43) 79 122
Other liabilities (661) (552) 109
Net assets 1,075 977 (98)
Equity attributable to owners of DMGT 1,060 963 (98)
Non-controlling interests 15 15 -
Shareholders' equity 1,075 977 (98)

© 2018 DMGT
Net debt
46
Strong funding position
£415m of new bank facilities to March 2023
Bonds Coupon £m
December 2018 5.75% 217
April 2021 10.0% 10
June 2027 6.375% 197
424
Net facilities, cash, other debt & derivatives 110
Net Debt 534

© 2018 DMGT
Pension deficit funding plan
47
• Funding plan agreed in Sep’16: c.£13m p.a. to FY 2019 and c.£16m p.a. from FY 2020 to FY 2027.• Additional £15-30m payable in FY 2022, dependent upon DMGT’s cash generation performance in FY 2020-22, less any contributions related to any
future share buy-backs.• Contributions cease once actuary agrees schemes are not in deficit.• IAS19 surplus at 31 March 2018 = £79m (£62m surplus at 30 September 2017)• Future payments in excess of £13m p.a. of minimum recovery plan payments to FY 2019 are dependent on share buy-backs plus other minor
contributions. • Agreed to contribute 20% of any future share buy-backs.
0
10
20
30
40
50
60
FY 2014 FY 2015 FY 2016 FY 2017 FY 2018 FY 2019
Northcliffe disposal
Share buy-back /
Other
Minimum recovery
payments
£ m
illi
on
s
£13m
£Xm£5m
£Xm
Total
Actual
Payments
Total
Recovery
Plan
Amounts
£29m £29m £29m
£19m
£8m
£13m
£50m £48m
£19m £34m
£5m
£13m £13m
£13m
£13m
H1 FY18
£13m

© 2018 DMGT 48
Gastech in September 2019
A Annual
18M 18 Months
Key
Event H1 H2 H1 H2 H1 H2 H1 H2 H1 H2 H1 H2 H1 H2
Gastech 18M 18M 18M 18M A TBC
Big 5 Dubai A A A A A A A
ADIPEC A A A A A A A
FY 2014 FY 2015 FY 2016 FY 2017 FY 2018 FY 2019 FY 2020
FY14 FY15 FY16 FY17
Revenues £m £m £m £m
Total for major events 42 36 61 70
Other events 58 59 44 47
100 95 105 117

© 2018 DMGT
Reporting calendar
49
Reporting dates for FY 2018
Release Provisional Date
Q3 Trading update 26 July 2018
Full year results 29 November 2018
© 2018 DMGT
0
2
4
6
8
10
12
14
16
18
20
22
24
Dividend Inflation1997 2017
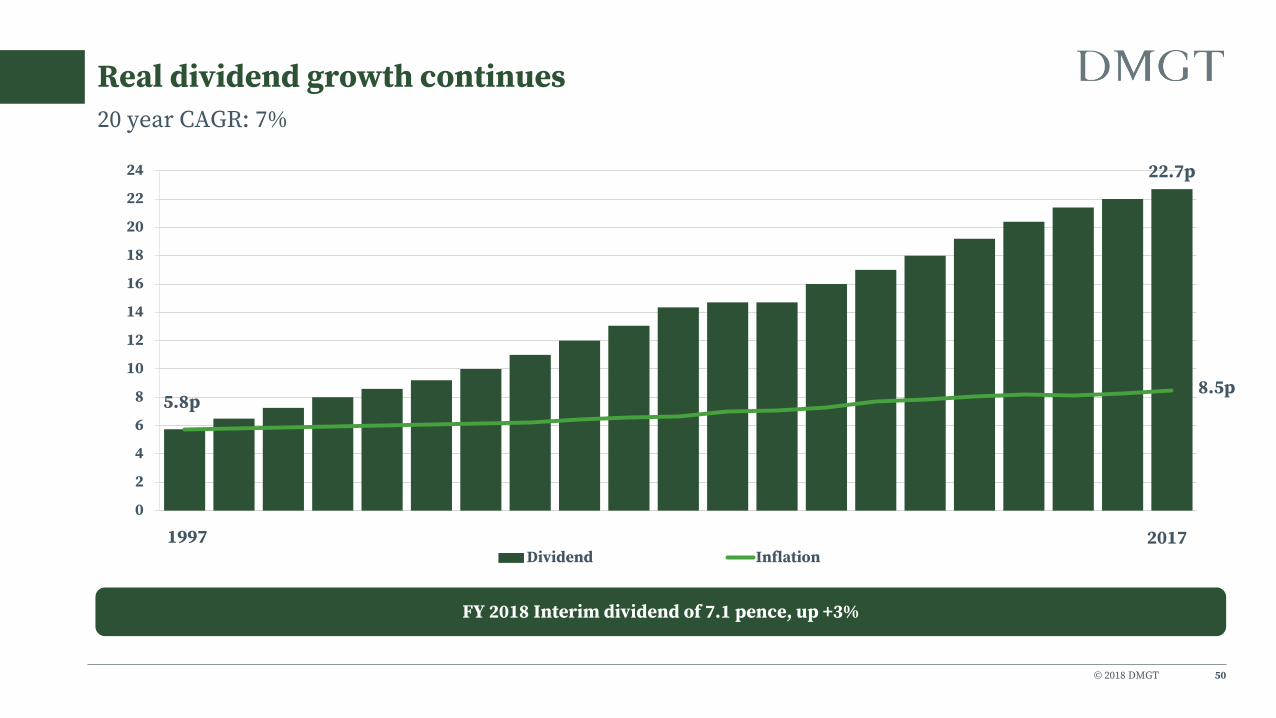
Real dividend growth continues
50
20 year CAGR: 7%
FY 2018 Interim dividend of 7.1 pence, up +3%
22.7p
8.5p5.8p
© 2018 DMGT
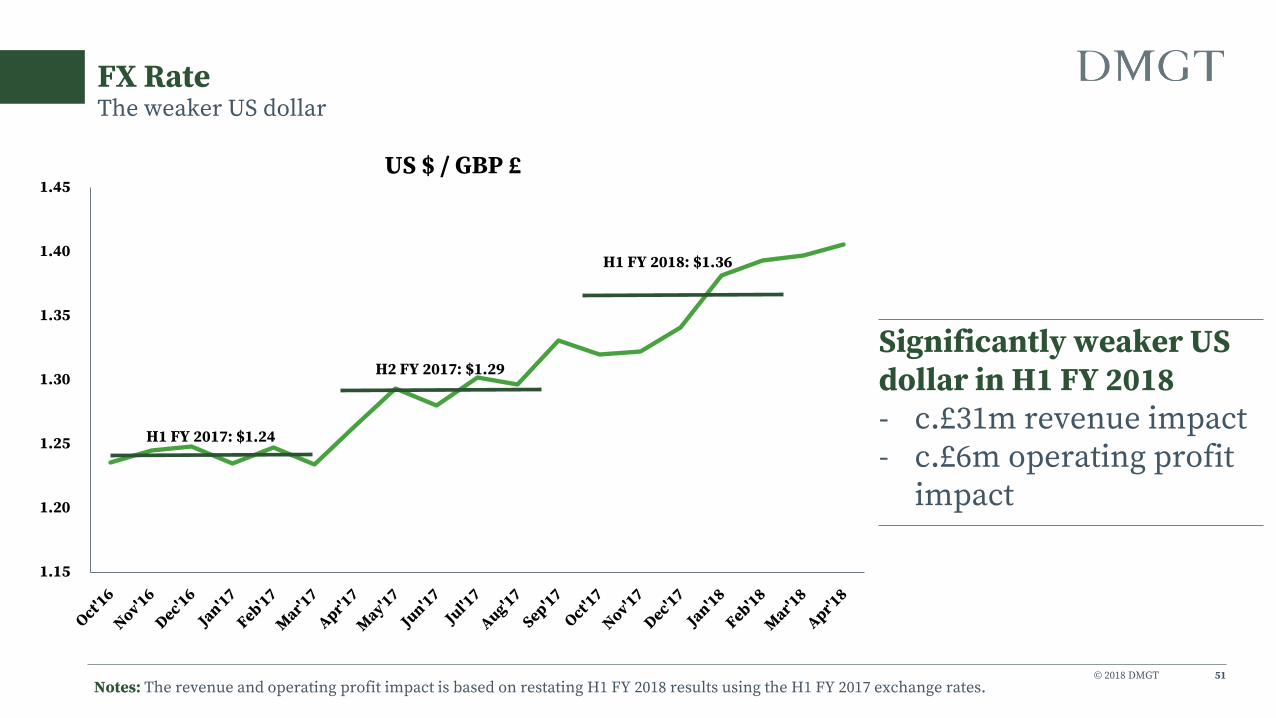
FX Rate
51
The weaker US dollar
1.15
1.20
1.25
1.30
1.35
1.40
1.45US $ / GBP £
H1 FY 2017: $1.24
H2 FY 2017: $1.29
H1 FY 2018: $1.36
Significantly weaker US dollar in H1 FY 2018- c.£31m revenue impact- c.£6m operating profit
impact
Notes: The revenue and operating profit impact is based on restating H1 FY 2018 results using the H1 FY 2017 exchange rates.

© 2018 DMGT
Share price performance
52
The 25 year view – excluding dividend reinvestmentM
ar-
93
Oc
t-9
3
Ma
y-9
4
De
c-9
4
Jul-
95
Fe
b-9
6
Se
p-9
6
Ap
r-9
7
No
v-9
7
Jun
-98
Jan
-99
Au
g-9
9
Ma
r-0
0
Oc
t-0
0
Ma
y-0
1
De
c-0
1
Jul-
02
Fe
b-0
3
Se
p-0
3
Ap
r-0
4
No
v-0
4
Jun
-05
Jan
-06
Au
g-0
6
Ma
r-0
7
Oc
t-0
7
Ma
y-0
8
De
c-0
8
Jul-
09
Fe
b-1
0
Se
p-1
0
Ap
r-1
1
No
v-1
1
Jun
-12
Jan
-13
Au
g-1
3
Ma
r-1
4
Oc
t-1
4
Ma
y-1
5
De
c-1
5
Jul-
16
Fe
b-1
7
Se
p-1
7
Ma
r-1
8
FTSE 'All Share'
DMGT 'A' Shares

© 2018 DMGT
Notes
53
Operating profit is stated before exceptional items, other gains and losses, impairment of goodwill and intangible assets, amortisation of intangible assets arising on business combinations, pension finance charges and fair value adjustments. These adjusted results include results from discontinued operations, specifically the Euromoney subsidiary. HY 2017 Pro forma results treat Euromoney as a c.49% associate for all six months, consistent with HY 2018.
Percentages are calculated on actual numbers to one decimal place.
Amounts are stated rounded to the nearest million pounds, consequently totals may not equal the sum of the component integers.
Underlying revenue or profit is revenue or operating profit on a like-for-like basis. Underlying results are adjusted for constant exchange rates, the exclusion of disposals and closures, the inclusion of the year-on-year organic growth from acquisitions and for the consistent timing of revenue recognition. For events, the comparisons are between events held in the year and the same events held the previous time. For Consumer Media, underlying revenues exclude low margin newsprint resale activities. For FY 2017, central dmg information costs allocated to Property Information, EdTech and Energy Information are reclassified to Corporate costs, consistent with all US central costs being included in Corporate costs in FY 2018.

Thank you