results presentation - coca-cola...
TRANSCRIPT

13 August 2015
RESULTS PRESENTATIONHALF-YEAR 2015

Forward looking statements
Unless otherwise indicated, the condensed consolidated interim financial statements and the financial and operating dataor other information included herein relate to Coca-Cola HBC AG and its subsidiaries (“Coca-Cola HBC” or the “Company”or “we” or the “Group”).
This document contains forward-looking statements that involve risks and uncertainties. These statements may generally,but not always, be identified by the use of words such as “believe”, “outlook”, “guidance”, “intend”, “expect”, “anticipate”,“plan”, “target” and similar expressions to identify forward-looking statements. All statements other than statements ofhistorical facts, including, among others, statements regarding our future financial position and results, our outlook for2015 and future years, business strategy and the effects of the global economic slowdown, the impact of the sovereigndebt crisis, currency volatility, our recent acquisitions, and restructuring initiatives on our business and financial condition,our future dealings with The Coca-Cola Company, budgets, projected levels of consumption and production, projected rawmaterial and other costs, estimates of capital expenditure, free cash flow, effective tax rates and plans and objectives ofmanagement for future operations, are forward-looking statements. By their nature, forward-looking statements involverisk and uncertainty because they reflect our current expectations and assumptions as to future events and circumstancesthat may not prove accurate. Our actual results and events could differ materially from those anticipated in the forward-looking statements for many reasons, including the risks described in the 2014 Integrated Annual Report for Coca-ColaHBC AG and its subsidiaries.
Although we believe that, as of the date of this document, the expectations reflected in the forward-looking statements arereasonable, we cannot assure you that our future results, level of activity, performance or achievements will meet theseexpectations. Moreover, neither we, nor our directors, employees, advisors nor any other person assumes responsibilityfor the accuracy and completeness of the forward-looking statements. After the date of the condensed consolidatedinterim financial statements included in this document, unless we are required by law or the rules of the UK FinancialConduct Authority to update these forward-looking statements, we will not necessarily update any of these forward-looking statements to conform them either to actual results or to changes in our expectations.
2

Half-year highlights
3
● Improving underlying volume trends
● Stable FX-neutral revenue per case, with pricing actions balancing deflationary pressures and affordability measures
● Net sales revenue decline due to FX headwinds
● Comparable EBIT up by 31% vs. prior year with 170bps margin expansion
● Working capital and operating profit improvements driving free cash flow growth
● Comparable earnings per share was €0.389 – a 44% increase on the prior-year period

Michalis ImellosChief Financial Officer
Financialreview

Financial performance overview
5
HY '15 HY '14 Ch.
Volume (m u.c.) 1,007 970 4%
Net Sales Revenue (€m) 3,151 3,183 -1%
FX-neutral NSR per case (€) 3.13 3.13 -
Comparable Gross Profit Margin 36.5% 35.8% 60 bps
Comparable OPEX % NSR 29.5% 30.6% -110 bps
Financial indicators on a comparable basis exclude the recognition of restructuring costs, unrealised commodity hedging results and non-recurring items.Certain differences in calculations are due to rounding.

Financial performance overview
6
HY '15 HY '14 Ch.
Comparable EBIT (€m) 219 167 31%
Comparable EBIT Margin 7.0% 5.2% 170 bps
Comparable Net Profit (€m) 142 99 43%
Comparable EPS (€) 0.389 0.271 44%
Free Cash Flow (€m) 219.2 94.8 NM
Financial indicators on a comparable basis exclude the recognition of restructuring costs, unrealised commodity hedging results and non-recurring items.Certain differences in calculations are due to rounding.

Stable FX-neutral net sales revenue per case
7
HY '15
Total CCH
Volume 3.8%
FX-neutral revenue per case -
Established Markets
Volume -0.2%
FX-neutral revenue per case -2.4%
Developing Markets
Volume 6.2%
FX-neutral revenue per case -2.0%
Emerging Markets
Volume 5.4%
FX-neutral revenue per case 4.3%

Favourable input cost environment
● FX-neutral input cost per case decreased by high single digits in the first half
● EU sugar costs continued to decrease year on year
● World sugar costs remained on a downward trend
● PET resin costs decreased significantly year on year
8

Cost management initiatives delivering results
9
HY '15 HY '14 Ch.
Net Sales Revenue (€m) 3,151 3,183 -1%
Comparable Operating Expenses (€m) 930 974 -4%
Comparable OPEX as % of NSR 29.5% 30.6% -110 bps
Comparable EBIT Margin 7.0% 5.2% 170 bps
Financial indicators on a comparable basis exclude the recognition of restructuring costs, unrealised commodity hedging results and non-recurring items.Certain differences in calculations are due to rounding.

Operating leverage and input cost benefits delivering profitability
HY comparable EBIT
€11m
€22m
€20m
€52m
0 20 40 60
Emerging
Developing
Established
Total CCH 167
84 64
45 23
90 79
219
HY ‘14HY’15
Financial indicators on a comparable basis exclude the recognition of restructuring costs, unrealised commodity hedging results and non-recurring items.Certain differences in calculations are due to rounding.
10

Restructuring update
● We incurred €22m in pre-tax restructuring costs in thefirst half
● Focus of the restructuring efforts were mostly Established and Emerging segments and to a lesser extent Developing
● We also reiterate our FY guidance :– pre-tax restructuring charges to the amount of €45m for 2015
– Total annualised benefits from 2015 initiatives of c.€30m
– Savings in 2015 from 2014 and 2015 initiatives of €44m
11

Solid free cash flow generation in the first half
12
€m HY '15 HY '14 Ch.
EBITDA 370 348 22
Working Capital change -12 -89 77
Net Capital Expenditure -117 -140 23
Free Cash Flow 219 95 124
Differences in the absolute year-on-year change are due to rounding

Debt maturity portfolio
$400m
€600m
€800m
2015September
2016November
2020June
Diversified financial profile
13
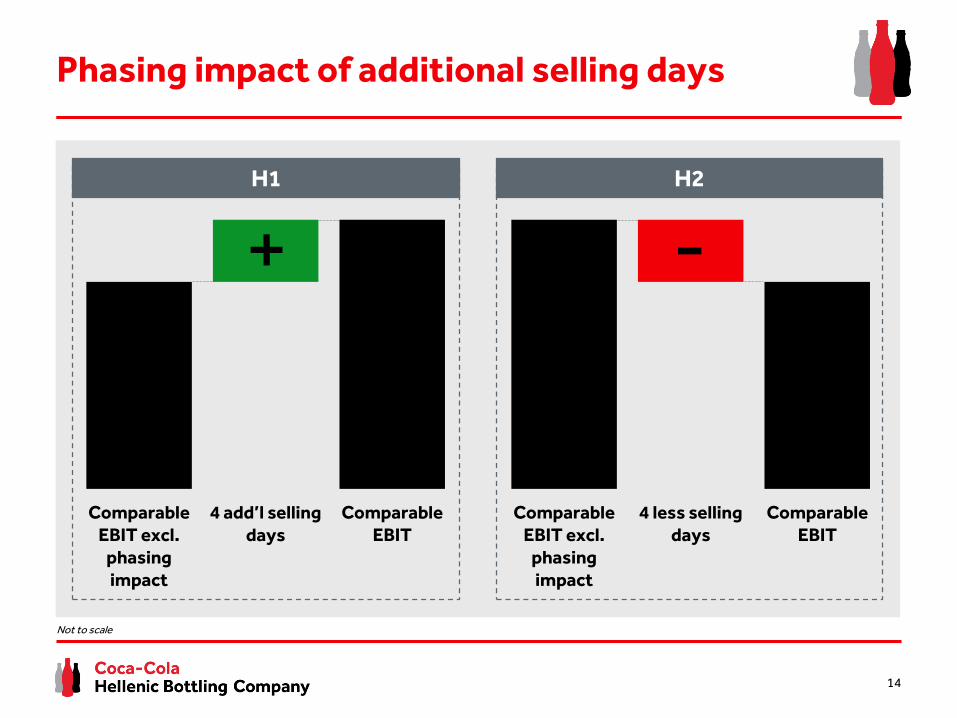
Phasing impact of additional selling days
14
Not to scale
ComparableEBIT excl.
phasingimpact
4 add’l selling days
ComparableEBIT
ComparableEBIT excl.
phasingimpact
4 less sellingdays
ComparableEBIT
+ -H1 H2

Dimitris LoisChief Executive Officer
Operational review andstrategy

HY volume by segment
Improving volume trends
-+6%
+5%
16
HY ’15Emerging
1,007 m UC
DevelopingHY ’14
970 m UC
Established

Growth in all categories gained pace in the first half
17
YoY growth
HY’15 HY’14
Sparkling 3% -4%
Trademark Coca-Cola 4% -3%
Coca-Cola Zero 16% 8%
Juice 18% 2%
Multon brands 34% 6%
Water 4% -2%
Energy 9% 2%
Tea -2% -8%

Established marketsBroadly stable volumes
TrademarkCoca-Cola
-
Coca-Cola Zero
+5%
Water
+3%
Volume
stable
Italy
Volume decline continues to moderate
Broadly stable performance in Sparkling
Challenging underlying conditions
Greece
Volume grew marginally
Performance driven by Still drinks
Macroeconomic environment remains uncertain
Switzerland
Low single-digit volume decline
Water volume up, helped by increased distribution
+
18
All figures refer to half-year 2015, unless otherwise stated
Currency-neutral net sales revenue per case
-2.4%
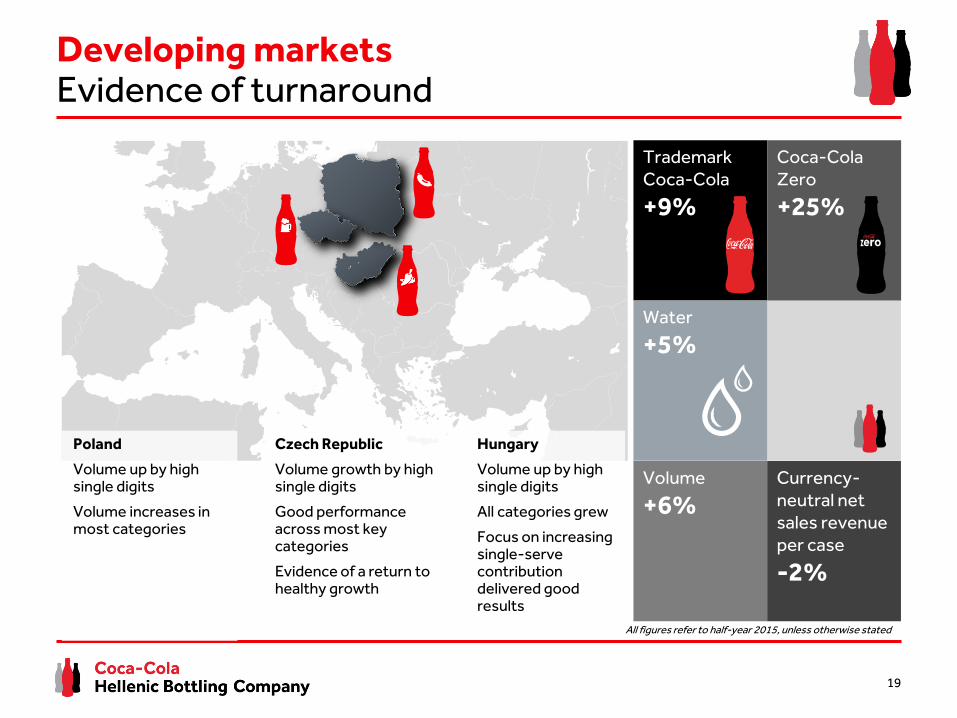
Developing marketsEvidence of turnaround
Poland
Volume up by high single digits
Volume increases in most categories
Hungary
Volume up by high single digits
All categories grew
Focus on increasing single-serve contribution delivered good results
Czech Republic
Volume growth by high single digits
Good performance across most key categories
Evidence of a return to healthy growth
TrademarkCoca-Cola
+9%
Coca-Cola Zero
+25%
Water
+5%
19
Volume
+6%Currency-neutral net sales revenue per case
-2%
All figures refer to half-year 2015, unless otherwise stated

Emerging marketsVery good performance in a volatile environment
TrademarkCoca-Cola
+6%
Juice
+27%
Water
+4%
Russia
Volume decline by low single digits in a volatile year
Excellent growth in Juice
Trademark Coke supported by the launch of Coke Zero
Nigeria
Robust growth momentum with mid-teens volume growth
Very good performance across all categories
Nigeria to remain a key growth engine
Romania
Volume growth by high single digits
Good performance across all categories
Improvement in package mix
20
Volume
+5%Currency-neutral net sales revenue per case
+4.3%
All figures refer to half-year 2015, unless otherwise stated

Looking ahead
21
We remain confident that 2015 will be a year of volume growth and progress on margins based on our expectations for
● volume growth in all segments
● a modest improvement in FX-neutral net sales revenue per case in the full year
● continued benign input costs
● reduction in operating expenses as a percentage of net sales revenue
● adverse FX impact of €155m, based on current spot rates

For further information on Coca-Cola Hellenic please visit our website at:
WWW.COCA-COLAHELLENIC.COM
Q&A
Or contact our investor relations [email protected]+30.210.6183 100
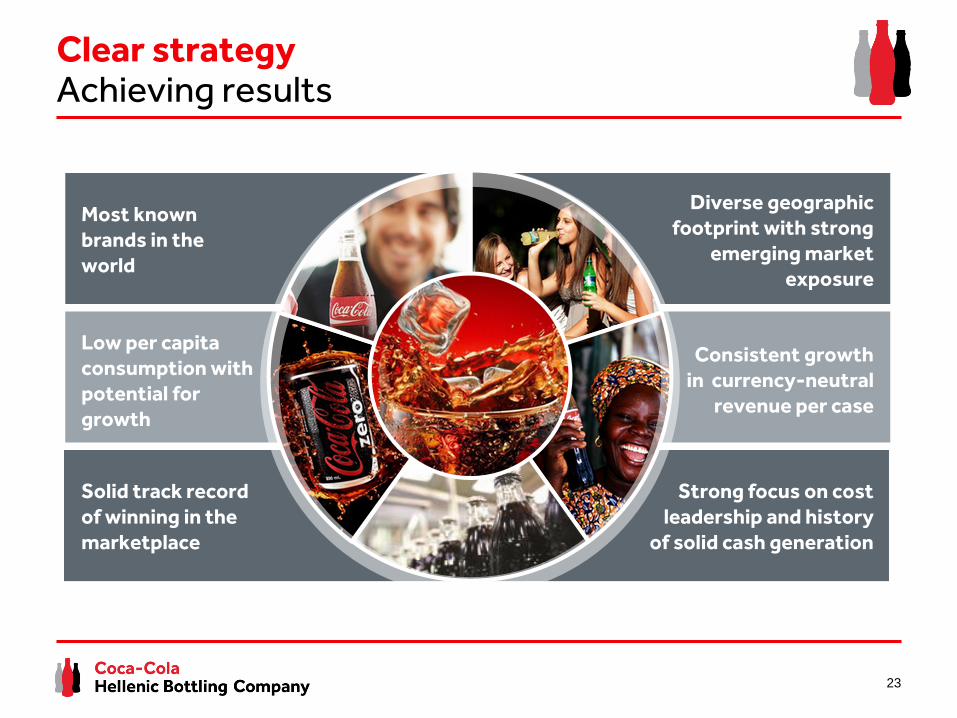
Clear strategyAchieving results
Most known brands in the world
Diverse geographic footprint with strong
emerging market exposure
Low per capita consumption with potential for growth
Solid track record of winning in the marketplace
Strong focus on cost leadership and history
of solid cash generation
Consistent growth in currency-neutral
revenue per case
23