results of the 2017 medical school enrollment survey · the 2017 aamc survey of medical school...
TRANSCRIPT
Association ofAmerican Medical Colleges
Results of the 2017 Medical School Enrollment Survey
May 2018
Learn
Serve
Lead
Association of American Medical CollegesWashington, D.C.
Results of the 2017 Medical School Enrollment Survey
May 2018

This is a publication of the Association of American Medical Colleges. The AAMC serves and leads the academic medicine community to improve the health of all. www.aamc.org.
© 2018 Association of American Medical Colleges. May be reproduced and distributed with attribution for educational and noncommercial purposes only.
Published May 2018.

Association of American Medical Colleges
Contents Acknowledgments 1
Executive Summary 2
Background 4
Survey Methodology 6
Results 7
Discussion 17
Appendix. New Schools Accredited Since 2002 or in the LCME Accreditation Process 19

Results of the 2017 Medical School Enrollment Survey
Association of American Medical Colleges1
Acknowledgments The 2017 AAMC Survey of Medical School Enrollment Plans would not have been possible without the collaboration of several people. The authors are especially grateful to the deans and administrators of the medical schools for their participation in the survey and to the AAMC’s John Prescott, MD; Ann Steinecke, PhD; Nicole Sweeney; and Kathleen Quinn for their assistance with outreach to the deans. Enrollment data for DO-granting schools were provided by Erik Guercio of the American Association of Colleges of Osteopathic Medicine.
The authors owe special thanks to the AAMC Communications team for their work on editing and design.
The AAMC welcomes your comments and suggestions for future editions of this report.
Janis Orlowski, MD, Chief Health Care Officer AAMC Health Care Affairs [email protected]
Michael Dill, Director AAMC Health Care Affairs, Workforce Studies [email protected]
Kara Fisher, Data Analyst AAMC Health Care Affairs, Workforce Studies [email protected]
Results of the 2017 Medical School Enrollment Survey
Association of American Medical Colleges2
Executive Summary This report examines first-year medical school matriculants over the past decade and projects first-year matriculants through 2025. The goal is to inform the academic medicine community, researchers, and policymakers about trends and issues related to U.S. medical school enrollment. The report is based on the 14th annual AAMC Survey of Medical School Enrollment Plans. Each fall, the survey is sent to deans at all MD-granting U.S. medical schools with preliminary accreditation or higher from the Liaison Committee on Medical Education (LCME). This most recent survey was conducted between November 2017 and March 2018.
Key findings include:
• U.S. medical school enrollment has grown 29% since 2002–2003, and 30% growth will be achieved by 2018–2019. In 2006, in response to concerns of a likely future physician shortage, the AAMC recommended a 30% increase in first-year medical school enrollment by the 2015–2016 academic year (over 2002–2003 levels). Using the baseline of the 2002–2003 first-year enrollment of 16,488 students, a 30% increase corresponds to an increase of 4,946 students. The survey results indicate that the 30% goal will be attained by 2018–2019 and exceeded in future years.
• Concern about the availability of graduate medical education opportunities at the state and national levels remains high. Medical schools reported concern about enrollment growth outpacing growth in graduate medical education (GME). Forty-four percent of medical schools reported concerns about their own incoming students’ ability to find residency positions of their choice after medical school. Concern about GME availability at the state and national levels remained high in 2017 compared with 2015 and 2016, but it is down from the peak in 2013. In 2017, 64% of schools reported concerns about GME in their state compared with 78% at the national level.
• A majority of schools are experiencing competition for clinical training sites from DO-granting schools and other health care professional programs. In 2017, 85% of respondents expressed concern about the number of clinical training sites, and 89% of respondents expressed concern about the supply of qualified primary care preceptors. Sixty-seven percent expressed concern about the supply of qualified specialty preceptors. A majority of schools experienced competition from DO-granting schools (54%) and other health care professional programs (58%). Forty-six percent of respondents reported feeling pressure to pay for clinical training slots, though 59% of schools currently do not pay for clinical training.
Results of the 2017 Medical School Enrollment Survey
Association of American Medical Colleges3
• Schools are dedicated to increasing diversity in their student body. Almost all respondents (99%) indicated that they had (or were planning to have within two years) specific programs or policies designed to recruit a diverse student body. The majority of respondents had established or expected to establish programs/policies geared toward minorities underrepresented in medicine, students from disadvantaged backgrounds, students from local underserved communities, and students from rural and urban underserved communities. Schools reported a variety of approaches, with a focus on outreach at high schools and local four-year universities and admission strategies such as holistic review.
• Enrollment increases at DO-granting schools continue to accelerate. First-year enrollment at DO-granting schools in 2017–2018 was 8,088, a 163% increase from 3,079 students in 2002–2003. Combined first-year enrollment at existing MD-granting and DO-granting schools increased by 9,859 students, a 50% increase compared with 2002–2003.

Results of the 2017 Medical School Enrollment Survey
Association of American Medical Colleges4
Background In 2006, in response to concerns of a future physician shortage, the AAMC recommended a 30% increase in enrollment at LCME-accredited medical schools by 2015.1 Using the first-year enrollment of 16,488 students in 2002–2003 as a baseline, a 30% increase would mean 21,434 first-year medical students, an increase of 4,946 students. The annual Survey of Medical School Enrollment Plans monitors progress toward this goal.
To meet the 30% goal, the AAMC recommended enrollment expansion at existing medical schools and the creation of new medical schools. In 2002, there were 125 LCME-accredited medical schools in the United States. As of March 2018, the LCME had granted full, provisional, or preliminary accreditation status to 26 more medical schools, for a total of 151 U.S. MD-granting schools.2 Additionally, the American Osteopathic Association’s Commission on Osteopathic College Accreditation (COCA) lists 34 DO-granting schools operating at 51 sites during the 2017–2018 academic year, an increase of 14 DO-granting schools since 2002–2003.3
1. Association of American Medical Colleges. Statement on the Physician Workforce. June 2006. www.aamc.org/download/55458/data/workforceposition.pdf. Accessed March 3, 2017.
2. Liaison Committee on Medical Education. Medical School Directory. 2018. www.lcme.org/directory/. Accessed March 19, 2018.
3. Commission on Osteopathic College Accreditation. Colleges of Osteopathic Medicine. March 2018. www.osteopathic.org/inside-aoa/accreditation/COM-accreditation/Documents/current-list-of-colleges-of-osteopathic-medicine.pdf. Accessed March 19, 2018.
Figure 1. New MD-granting schools accredited since 2002 or in the LCME accreditation process (as of March 2018).
UC Riverside
Western Michigan
Cooper Rowan
South Carolina Greenville
Quinnipiac-Netter
Arizona Phoenix
Oakland Beaumont
College of Henricopolis
Applicant or Candidate
School
Preliminarily Accredited
Provisionally Accredited
Fully Accredited
CUNY
Hofstra Northwell
University of Nevada, Las Vegas
WA State University
Florida Atlantic-Schmidt
TCU and UNTHSC
Central Florida
CA University of Science and
Medicine
Roseman University of Health Sciences
Texas Tech-Foster
UT-Rio Grande Valley
Virginia Tech Carilion
FIU-Wertheim
California NorthstateUniversity
Dell Medical Schoolat UT-Austin
San Juan Bautista (Puerto Rico)
Central Michigan
Seton Hall-Hackensack
GeisingerCommonwealth
Nova Southeastern
Carle IllinoisNew York– Long Island
Kaiser Permanente
Results of the 2017 Medical School Enrollment Survey
Association of American Medical Colleges5
The LCME lists an additional 5 schools as having applicant or candidate status (see Figure 1). Although preaccredited schools cannot yet enroll students, some will probably attain accreditation in time to enroll students before 2025–2026.
This report includes enrollment projections for only the 151 MD-granting schools and enrollment data for the 34 accredited DO-granting schools as of March 2018.

Results of the 2017 Medical School Enrollment Survey
Association of American Medical Colleges6
Survey Methodology The AAMC administered the 14th annual Survey of Medical School Enrollment Plans in November 2017 to the deans of 149 U.S. medical schools that were fully, provisionally, or preliminarily LCME-accredited at that time. An email introduction included a link to the web-based survey. Deans who did not initially respond received follow-up emails. Of the schools surveyed, 140 responded (94%). Survey information was provided by the dean of the medical school or a designated appointee, most often an associate dean.
Respondents were asked to provide their medical school’s number of first-year matriculants for the current year, as well as their anticipated number of first-year matriculants for the next five years, ending with the 2022–2023 academic year. For 8 of the 9 schools that did not provide enrollment plans on the 2017 survey, reported plans from the 2016 survey were used. For the one school that did not provide enrollment plans in 2016 or 2017, matriculant data for the 2017 academic year were substituted for each projected year. Historical matriculant data in this report are from the AAMC Student Records System.
The survey asked schools to report their concerns about clerkship opportunities and graduate medical education placements. Additionally, the survey included prompts about efforts to increase student diversity. This report presents trends over time using available data from previous surveys.
Data were also obtained from the American Association of Colleges of Osteopathic Medicine (AACOM) about enrollment plans at DO-granting schools and are included in Table 3 and Figure 11. Data were based on a survey of deans at DO-granting schools administered in spring 2018.

Results of the 2017 Medical School Enrollment Survey
Association of American Medical Colleges7
Results Current Enrollment and Projected Trends in the Next Five YearsFirst-year enrollment at LCME-accredited medical schools has increased by 29% from the 2002–2003 baseline level as of the 2017–2018 academic year, and it is projected to increase by 36% from the 2002–2003 baseline by 2022–2023. Of the 125 schools that were accredited as of 2002–2003, 28 (22%) plan to grow from 2018–2019 to 2022–2023. By comparison, 9 of the 26 schools accredited since 2002–2003 (35%) plan to grow during that period. Cumulatively, the currently accredited 151 medical schools are projected to reach the targeted 30% increase in enrollment by 2018–2019, with further increases in succeeding years (Table 1).
Enrollment Growth by Public/Private Status, Region, and Accreditation YearOn the basis of these reported projections, increases at the 125 schools that were LCME-accredited as of 2002–2003 would account for 61% of the projected growth in first-year enrollment between 2002–2003 and 2022–2023. The growth at new schools since 2002–2003 would account for the remaining 39% of the overall 2002–2022 growth. The majority (59%) of the projected growth in enrollment between 2002–2003 and 2022–2023 is expected to occur at public schools. Nationally, schools in the Southern region would account for the largest portion (42%) of the projected increase in enrollment between 2002–2003 and 2022–2023 (Figure 2).
Table 1. Summary of Baseline and Current First-Year Enrollment and Projected First-Year Enrollment Through 2022
Baseline Current Projected
Group 2002 2017 2018 2019 2020 2021 2022
Schools accredited as of 2002 (n=125) 16,488 19,486 19,647 19,780 19,943 20,084 20,153# Increase from 2002 2,998 3,159 3,292 3,455 3,596 3,665
% Increase from 2002 18.2% 19.2% 20.0% 21.0% 21.8% 22.2%Schools accredited after 2002 (n=26)* 1,852 2,079 2,150 2,233 2,268 2,327
All schools with preliminary accreditation or higher (n=151)** 16,488 21,338 21,726 21,930 22,176 22,352 22,480
# Increase from 2002 4,850 5,238 5,442 5,688 5,864 5,992 % Increase from 2002 29.4% 31.8% 33.0% 34.5% 35.6% 36.3%
* Note: Includes 22 medical schools that have matriculated students and 4 preliminary accredited medical schools that have not. These 4 medical schools are included in the enrollment projection displayed after 2017.
** Note: Includes 147 medical schools that have matriculated students and 4 preliminary accredited medical schools that have not. These 4 medical schools are included in the enrollment projection displayed after 2017.

Results of the 2017 Medical School Enrollment Survey
Association of American Medical Colleges8
Projections Beyond 2022
To project enrollment beyond 2022–2023, the last academic year for which enrollment data were requested on the survey, the rate of growth reported between the last two academic years of survey data for each school was applied. Six of the 125 schools accredited as of 2002–2003 and 3 of the 26 newly accredited schools projected that they would grow from 2021–2022 to 2022–2023. Most of the remaining schools projected no growth during that period, and one school projected a small decline. Overall, enrollment is expected to grow by a small fraction of a percent per year from 2022–2023 to 2025–2026 (Figure 3).
Figure 3. Projected first-year enrollment through 2025.
0
5,000
10,000
15,000
20,000
25,000
2002 2003 2004 2005 2006 2007 2008 2009 2010 2011 2012 2013 2014 2015 2016 2017 2018 2019 2020 2021 2022 2023 2024 2025
Actual enrollment Survey data Projections
n Original schools (n=125)n All schools with preliminary accreditation or higher (n=151)*
30% target increase (over 2002 enrollment)
* Includes 147 medical schools that have matriculated students and 4 preliminary accredited medical schools that have not. These 4 medical schools are included in the enrollment projections displayed after 2017.
Figure 2. Percentage of 2002–2022 growth by public/private status,* region,** and accreditation year.
34%
66%
22% 20%
42%
16%
61%
39%
Private Public Central Northeast Southern Western Schools accredited as of 2002
Schools accredited after 2002
* First-year enrollment in 2002 is based on 2002 public/private status, and 2022 numbers are based on current public/private status. Two schools have changed public/private status since 2002.
** Central: IA, IL, IN, KS, MI, MN, MO, ND, NE, OH, SD, WI; Northeast: CT, DC, DE, MA, MD, ME, NH, NJ, NY, PA, RI, VT Southern: AL, AR, FL, GA, KY, LA, MS, NC, OK, PR, SC, TN, TX, VA, WV, Western: AK, AZ, CA, CO, HI, ID, MT, NM, NV, OR, UT, WA, WY.

Results of the 2017 Medical School Enrollment Survey
Association of American Medical Colleges9
Graduate Medical Education Concerns
Starting in 2012, the survey included two questions addressing concerns about GME. The first question asked deans to consider their own students: “What is your level of concern about your incoming students’ ability to find a residency training position of their choice upon completion of medical school?” The second question broadened the scope to the state and national levels, asking, “Now thinking more broadly, what is your level of concern that the overall expansion in medical school enrollment could produce more graduates than graduate medical education can accommodate?” Response options were “no concern,” “minor concern,” “moderate concern,” and “major concern.”
The percentage of respondents who expressed “major” or “moderate” concern about their incoming students’ ability to find residency positions of their choice after medical school increased from 39% in 2016 to 44% in 2017 (Figure 4). Concerns about the impact of medical school enrollment expansion on GME at the state and national levels have stayed about the same since 2015, but they are down from the peak in 2013. In 2017, 64% of schools reported concerns about GME in their state compared with 78% at the national level.
Residency/Graduate Medical Education (GME): Medical training that occurs after receiving the MD or DO degree, typically three to seven years at teaching hospitals and their associated ambulatory settings. Completing a GME program is required to be licensed and practice independently in the United States.
The prevalence of concern about GME at the state and local levels was compared by geographic region, public/private status, and whether schools were accredited before or after 2002, but there were no statistically significant differences.
Figure 4. Percentage of schools concerned about graduate medical education, 2012–2017.
35%
47% 48% 50%
39%44%
67%
76%71%
62% 62%64%
84%
91%
86%
77%80% 78%
For my incoming students
2012 2013 2014 2015 2016 2017 2012 2013 2014 2015 2016 2017 2012 2013 2014 2015 2016 2017
In my state Nationally
n Major concern n Moderate concern
Results of the 2017 Medical School Enrollment Survey
Association of American Medical Colleges10
Clinical Training Opportunities for Students
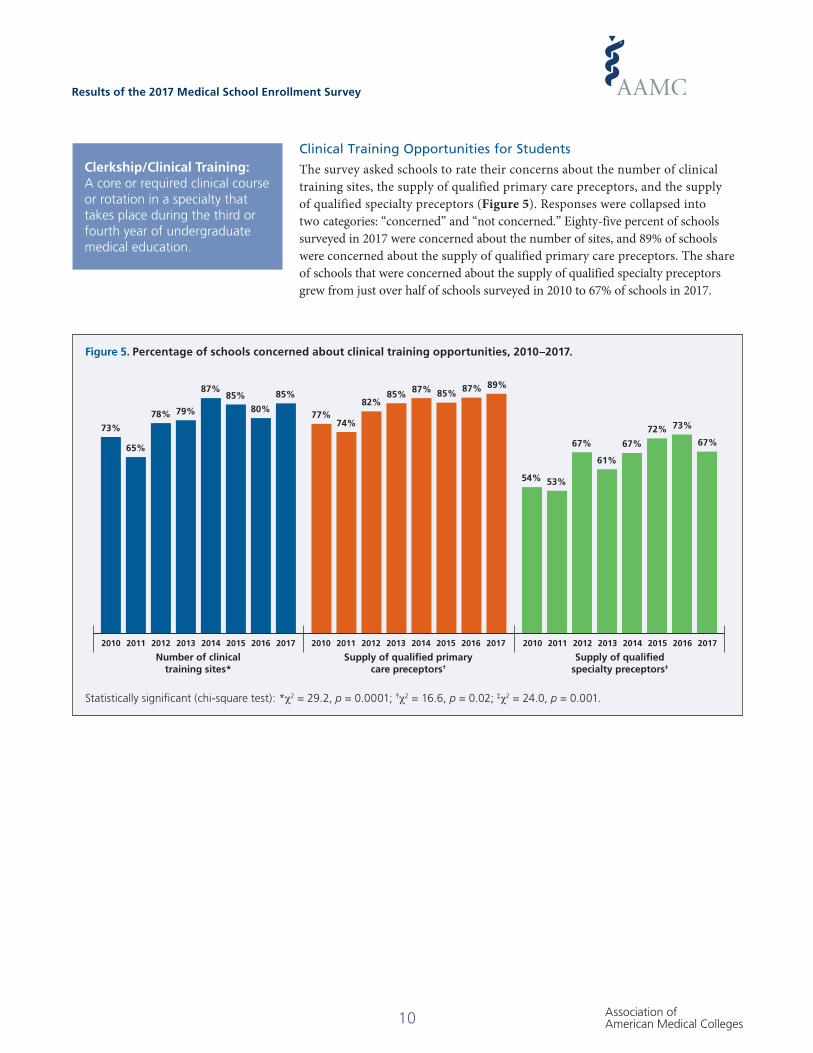
The survey asked schools to rate their concerns about the number of clinical training sites, the supply of qualified primary care preceptors, and the supply of qualified specialty preceptors (Figure 5). Responses were collapsed into two categories: “concerned” and “not concerned.” Eighty-five percent of schools surveyed in 2017 were concerned about the number of sites, and 89% of schools were concerned about the supply of qualified primary care preceptors. The share of schools that were concerned about the supply of qualified specialty preceptors grew from just over half of schools surveyed in 2010 to 67% of schools in 2017.
Clerkship/Clinical Training: A core or required clinical course or rotation in a specialty that takes place during the third or fourth year of undergraduate medical education.
Figure 5. Percentage of schools concerned about clinical training opportunities, 2010–2017.
73%
65%
78% 79%
87%85%
80%
85%
77%74%
82%85% 87% 85% 87% 89%
54% 53%
67%
61%
67%
72% 73%
67%
Number of clinical training sites*
2012 2013 2014 2015 2016 201720112010
Supply of qualified primary care preceptors†
2012 2013 2014 2015 2016 201720112010
Supply of qualified specialty preceptors‡
2012 2013 2014 2015 2016 201720112010
Statistically significant (chi-square test): *χ2 = 29.2, p = 0.0001; †χ2 = 16.6, p = 0.02; ‡χ2 = 24.0, p = 0.001.
Results of the 2017 Medical School Enrollment Survey
Association of American Medical Colleges11
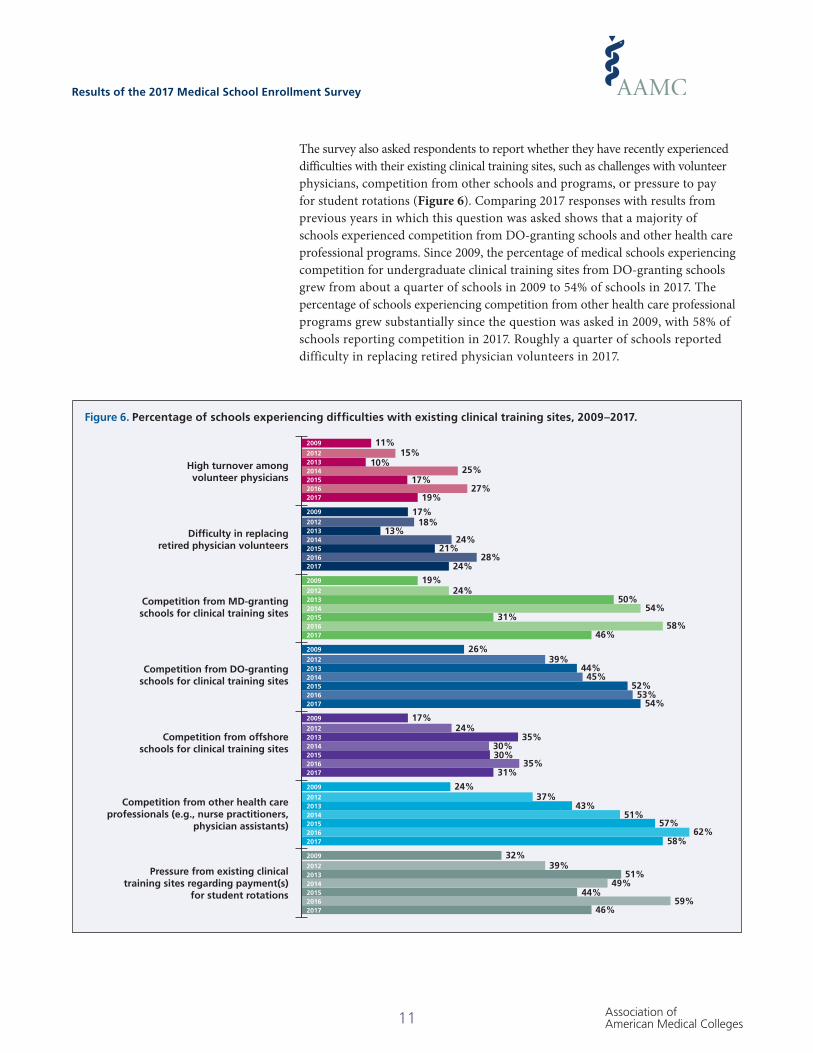
The survey also asked respondents to report whether they have recently experienced difficulties with their existing clinical training sites, such as challenges with volunteer physicians, competition from other schools and programs, or pressure to pay for student rotations (Figure 6). Comparing 2017 responses with results from previous years in which this question was asked shows that a majority of schools experienced competition from DO-granting schools and other health care professional programs. Since 2009, the percentage of medical schools experiencing competition for undergraduate clinical training sites from DO-granting schools grew from about a quarter of schools in 2009 to 54% of schools in 2017. The percentage of schools experiencing competition from other health care professional programs grew substantially since the question was asked in 2009, with 58% of schools reporting competition in 2017. Roughly a quarter of schools reported difficulty in replacing retired physician volunteers in 2017.
Figure 6. Percentage of schools experiencing difficulties with existing clinical training sites, 2009–2017.
High turnover among volunteer physicians
Difficulty in replacing retired physician volunteers
Competition from MD-granting schools for clinical training sites
Competition from DO-granting schools for clinical training sites
Competition from offshore schools for clinical training sites
Competition from other health care professionals (e.g., nurse practitioners,
physician assistants)
Pressure from existing clinical training sites regarding payment(s)
for student rotations
11%15%
10%25%
27%17%
19%
17%18%
13%24%
21%28%
24%
19%24%
50%54%
31%58%
46%
26%39%
44%45%
52%53%
54%
17%24%
35%30%30%
35%31%
24%37%
43%51%
57%62%
58%
32%39%
51%49%
44%59%
46%
2009
201220132014
20162015
2017
2009
201220132014
20162015
2017
2009
201220132014
20162015
2017
2009
201220132014
20162015
2017
2009
201220132014
20162015
2017
2009
201220132014
20162015
2017
2009
201220132014
20162015
2017

Results of the 2017 Medical School Enrollment Survey
Association of American Medical Colleges12
This year, the survey asked schools that experienced difficulties with their existing clinical training sites to report the level of difficulty they experienced (Figure 7). Of the schools that experienced pressure from existing clinical training sites regarding payments for student rotations, 78% reported this as a moderate or major difficulty. Of the schools that experienced competition from medical schools or other health professions for clinical training sites, about 60% of schools reported moderate or major difficulty.
Figure 7. Level of difficulty experienced with existing clinical training sites, by type of difficulty experienced, 2017.
High turnover among volunteer physicians (n=26)
Difficulty in replacing retired physician volunteers (n=33)
Competition from MD-granting schools for clinical training sites (n=70)
Competition from DO-granting schools for clinical training sites (n=76)
Competition from offshore schools for clinical training sites (n=43)
Competition from other health care professionals (e.g., nurse practitioners, physician assistants) (n=81)
Pressure from existing clinical training sites regarding payment(s) for student rotations (n=65)
15%
3%
16%
20%
21%
17%
38%
58%
73%
43%
37%
40%
43%
40%
27%
21%
41%
43%
40%
40%
22%
� Major Difficulty � Moderate Difficulty � Minor Difficulty

Results of the 2017 Medical School Enrollment Survey
Association of American Medical Colleges13
Payments for Clinical Rotations
Beginning in 2015, the survey asked the following question: “Do you currently pay for any of your students to have clinical rotations in either academic or nonacademic (i.e., community-based) training sites?” Respondents were allowed to select more than one option. While the majority of schools (59%) in 2017 reported that they do not pay for students to have clinical rotations, 22% of schools reported paying for one or more students to rotate at academic clinical sites and 29% reported paying for one or more rotations at nonacademic clinical sites (Figure 8). The survey asked schools that pay for rotations at clinical training sites to briefly describe their payment practices, and responses varied widely. Most schools reported either paying for infrastructure and personnel time or a fixed fee per student, and many schools commented that their payment practices were not uniform across all clinical training sites. Schools reported that payments to clinical training sites were more common at regional medical campuses. In addition, schools that reported limited clinical training opportunities in their local area noted paying for student housing and transportation for off-site locations.
Figure 8. Percentage of schools currently paying for clinical rotations, 2015–2017.
59%
64%
61%
12%
6%
10%
19%
13%
15%
10%
16%
14%
Do not pay
2017
2016
2015
Only academic
sites
Only nonacademic
sites
Both types of
sites
Pay

Results of the 2017 Medical School Enrollment Survey
Association of American Medical Colleges14
Diversity Recruitment Plans and Strategies
The survey included the following question: “Do you have (or are you planning to have within two years) specific programs or policies designed to recruit a diverse student body?” Subsequent questions asked respondents to describe the specific population groups included in their student recruitment policies and what measures they were taking to include these groups. Note that the percentages in Table 2 and Figures 9 and 10 may not sum to 100%, because they represent the percentage of all schools that responded to the survey, not just those that indicated they had targeted programs or policies. Respondents could select more than one group.
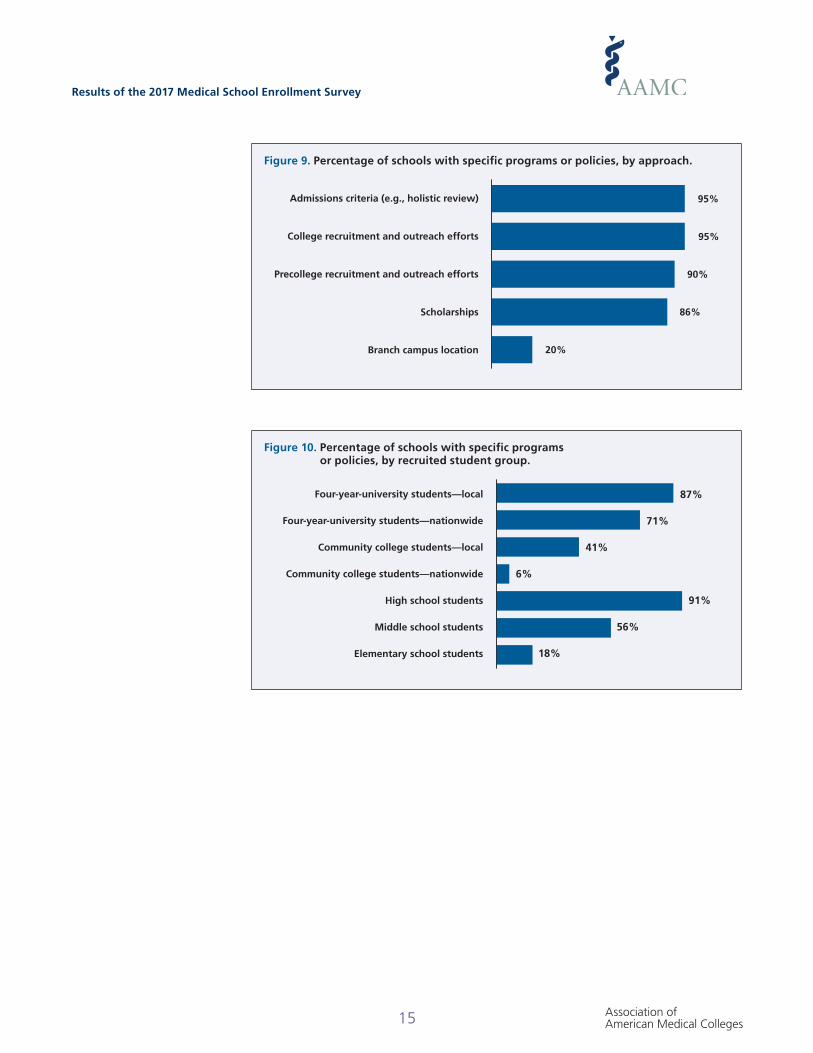
Of schools responding to the survey, 99% indicated that they had (or were planning to have within two years) specific programs or policies designed to recruit a diverse student body. All the schools that indicated that they had or plan to have these programs or policies also indicated that they have or plan to have specific programs or policies to recruit minority groups currently underrepresented in medicine, and the majority of schools have or plan to have programs or policies to recruit students from other groups (Table 2). The most common approaches included college recruitment and outreach and admission strategies such as holistic review (Figure 9). More than half of schools reported that recruitment and outreach efforts focused on middle school students, high school students, or four-year university students, with an overwhelming majority of schools focused on high school students or local four-year university students (Figure 10).
Table 2. Percentage of Schools with Programs or Policies That Include Specific Groups
Included group
Established (greater than or
equal to two years)
Recently implemented (less than two years)
Planned (within the next
two years)No plans
at this time
Minority groups currently underrepresented in medicine 89% 10% 1% 0%
Students with disadvantaged backgrounds (e.g., low income, recent immigrants) 82% 11% 1% 4%
Students from rural communities 54% 8% 4% 24%
Students from urban underserved communities 50% 6% 4% 27%
Students from local underserved communities 62% 9% 4% 16%
Results of the 2017 Medical School Enrollment Survey
Association of American Medical Colleges15
Figure 10. Percentage of schools with specific programs or policies, by recruited student group.
Four-year-university students—local
Four-year-university students—nationwide
Community college students—local
Community college students—nationwide
High school students
Middle school students
Elementary school students
91%
6%
18%
41%
56%
71%
87%
Figure 9. Percentage of schools with specific programs or policies, by approach.
Admissions criteria (e.g., holistic review)
College recruitment and outreach efforts
Precollege recruitment and outreach efforts
Scholarships
Branch campus location
95%
20%
86%
90%
95%
Results of the 2017 Medical School Enrollment Survey
Association of American Medical Colleges16
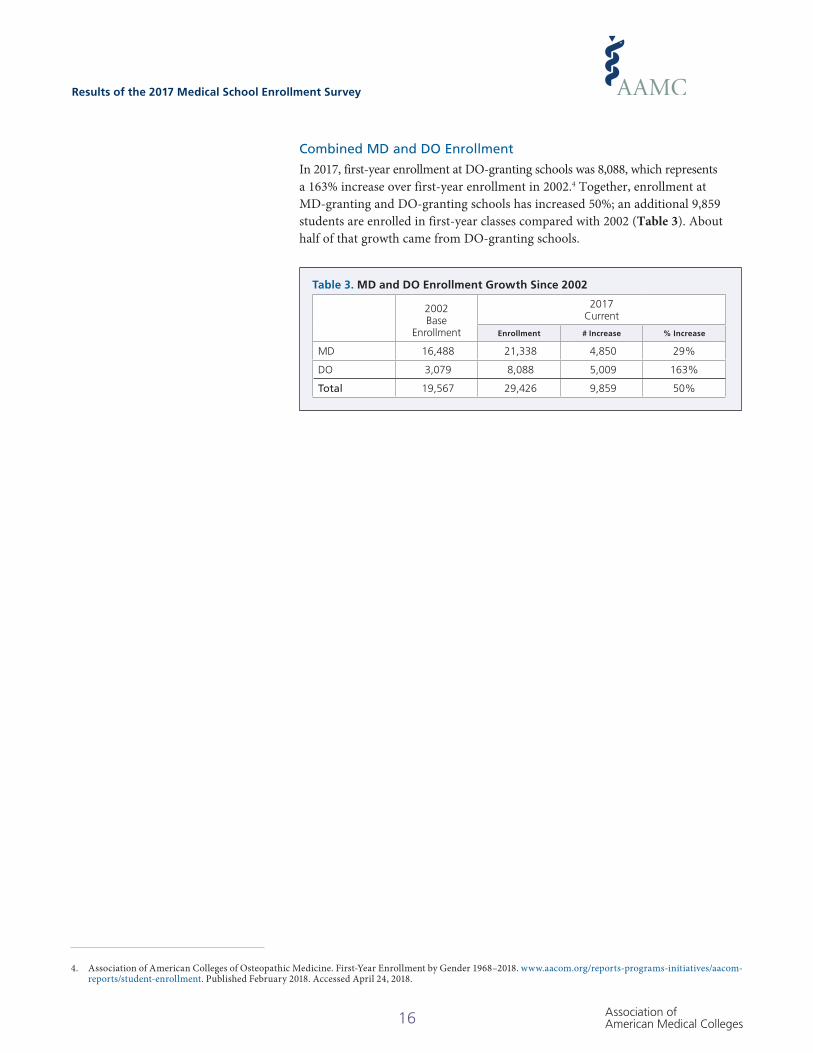
Combined MD and DO Enrollment
In 2017, first-year enrollment at DO-granting schools was 8,088, which represents a 163% increase over first-year enrollment in 2002.4 Together, enrollment at MD-granting and DO-granting schools has increased 50%; an additional 9,859 students are enrolled in first-year classes compared with 2002 (Table 3). About half of that growth came from DO-granting schools.
Table 3. MD and DO Enrollment Growth Since 2002
2002 Base
Enrollment
2017 Current
Enrollment # Increase % Increase
MD 16,488 21,338 4,850 29%
DO 3,079 8,088 5,009 163%
Total 19,567 29,426 9,859 50%
4. Association of American Colleges of Osteopathic Medicine. First-Year Enrollment by Gender 1968–2018. www.aacom.org/reports-programs-initiatives/aacom-reports/student-enrollment. Published February 2018. Accessed April 24, 2018.
Results of the 2017 Medical School Enrollment Survey
Association of American Medical Colleges17
Discussion Over the past decade, the medical education community has responded to the AAMC’s call for an increase in medical school enrollment to address a projected national shortage of physicians. Since 2002, the LCME has accredited 26 new medical schools, for a total of 151 LCME-accredited U.S. medical schools as of March 2018. Collectively, these schools expanded enrollment by 29% over 2002 levels as of the 2017–2018 academic year, just short of the AAMC’s 30% goal, which will be reached by 2018–2019 and exceeded in future years.
As student enrollment grows, school administrators are concerned about the number of available clerkship sites and the supply of preceptors. As other health professions are also growing, clerkship opportunities are proving to be more competitive. More than half of survey respondents reported experiencing competition with DO-granting schools and other health disciplines, such as physician assistant and nurse practitioner programs, up from only a quarter of schools in 2009. A large share of respondents continues to experience pressure to pay for clinical training slots, though the majority of schools currently do not pay for clinical training.
The nation’s medical schools are committed to developing a diverse student body. The majority of schools have specific programs or policies designed to increase the number of students from minority groups currently underrepresented in medicine, students from disadvantaged backgrounds, and students from rural and/or underserved communities.
Over the past three years, the AAMC has created new programs, initiatives, and publications that focus on embracing a broad definition of diversity and inclusion to support members’ efforts.5 In 2018, the AAMC released a report, Accessibility, Inclusion, and Action in Medical Education: Lived Experiences of Learners and Physicians With Disabilities, that explores the current state of medical education for medical students and physicians with disabilities.6 In 2015, the AAMC released Altering the Course: Black Males in Medicine, a detailed report on the decline in black males applying to and matriculating into medical school.7 The AAMC also released several resources on curricular and institutional climate changes to improve health care for individuals who are lesbian, gay, bisexual, transgender (LGBT), gender nonconforming (GNC), and/or born with differences of sex development (DSD) and resources to help design, evaluate, and assess cultural competence curricula.8, 9
5. Nivet MA. A diversity 3.0 update: are we moving the needle enough? Acad Med. 2015;90(12):1591–1593.
6. Meeks LM, Jain NR. Accessibility, Inclusion, and Action in Medical Education: Lived Experiences of Learners and Physicians With Disabilities. Washington, DC: Association of American Medical Colleges; 2018. https://members.aamc.org/eweb/upload/Accessibility,%20Inclusion,%20and%20Action%20in%20Medical%20Education--Lived%20Experiences%20of%20Learners%20and%20Physicians%20With%20Disabilities.pdf.
7. Association of American Medical Colleges. Altering the Course: Black Males in Medicine. Washington, DC: AAMC; 2015. https://members.aamc.org/eweb/upload/Black_Males_in_Medicine_Report_WEB.pdf.
8. Association of American Medical Colleges. Implementing Curricular and Institutional Climate Changes to Improve Health Care for Individuals Who Are LGBT, Gender Nonconforming, or Born with DSD: A Resource for Medical Educators. Washington, DC: AAMC; 2014. http://members.aamc.org/eweb/upload/LGBTDSD%20Publication.pdf.
9. Association of American Medical Colleges. Assessing Change: Evaluating Cultural Competence Education and Training. Washington, DC: AAMC; 2015. https://members.aamc.org/eweb/upload/Assessing%20Change%20-%20Evaluating%20Cultural%20Competence%20Education%20and%20Training.pdf.

Results of the 2017 Medical School Enrollment Survey
Association of American Medical Colleges18
Enrollment expansion alone will not resolve the expected shortage of between 42,600 and 121,300 physicians by 2030.10 Medical schools will soon reach the 30% goal in enrollment growth and continue to increase beyond that 30% growth goal in future years, but entry-level residency positions accredited by the Accreditation Council for Graduate Medical Education (ACGME) are continuing to grow at a rate of only about 1% per year.11 Forty-four percent of medical schools are concerned about their incoming students’ ability to find a residency training position of their choice upon completion of medical school, and federal caps on Medicare-funded residency training positions remain effectively frozen at 1996 levels.
In response to these challenges, the AAMC, working with the nation’s medical schools, teaching hospitals, and health systems, launched the Optimizing GME initiative in 2015.12 The goal of the initiative is to develop tools, data, and programs that will invest in future physicians; optimize the learning environment for learning, care, and discovery; and prepare the physician-scientist for the 21st century. On the basis of feedback from stakeholders across the academic medicine community, the AAMC continues to make progress on this effort, with a specific focus on two areas of critical concern: transition to residency;13 and the learning environment and the well-being of individuals in that environment.14 Continued monitoring of medical school enrollment is crucial to support these efforts to improve and optimize the graduate medical education system.
10. IHS Markit Ltd. The Complexities of Physician Supply and Demand: Projections from 2016 to 2030. 2018 update. Washington, DC: Association of American Medical Colleges; 2018. https://news.aamc.org/filer/media/1523468596/1186.
11. Jolly P, Erikson C, Garrison G. U.S. graduate medical education and physician specialty choice. Acad Med. 2013;88(4):468–474.
12. Association of American Medical Colleges. Optimizing Graduate Medical Education. www.aamc.org/initiatives/optimizinggme.
13. Association of American Medical Colleges. Transition to Residency. www.aamc.org/t2r.
14. Association of American Medical Colleges. Well-Being in Academic Medicine. www.aamc.org/wellbeing.

Results of the 2017 Medical School Enrollment Survey
Association of American Medical Colleges19
Appendix. New Schools Accredited Since 2002 or in the LCME Accreditation Process15–17
Fully Accredited Since 2002 (n = 15)
• Charles E. Schmidt College of Medicine at Florida Atlantic University (Florida) • Florida International University Herbert Wertheim College of Medicine (Florida) • University of Central Florida College of Medicine (Florida) • Oakland University William Beaumont School of Medicine (Michigan)• Donald and Barbara Zucker School of Medicine at Hofstra/Northwell (New York) • Geisinger Commonwealth Medical College (Pennsylvania) • San Juan Bautista School of Medicine (Puerto Rico) • Paul L. Foster School of Medicine Texas Tech University Health Sciences Center El Paso (Texas) • Virginia Tech Carilion School of Medicine (Virginia)• University of South Carolina School of Medicine, Greenville (South Carolina) • Frank H. Netter MD School of Medicine at Quinnipiac University (Connecticut) • Cooper Medical School of Rowan University (New Jersey) • University of Arizona College of Medicine–Phoenix (Arizona)• University of California, Riverside, School of Medicine (California)• Western Michigan University Homer Stryker M.D. School of Medicine (Michigan)
Schools with Provisional Accreditation (n = 1)
• Central Michigan University College of Medicine (Michigan)
Schools with Preliminary Accreditation (n = 10)
• California Northstate University College of Medicine (California) • CUNY School of Medicine (New York)• University of Texas at Austin Dell Medical School (Texas)• University of Texas Rio Grande Valley School of Medicine (Texas)• University of Nevada, Las Vegas School of Medicine (Nevada)• Nova Southeastern University Dr. Kiran C. Patel College of Allopathic Medicine (Florida)• Washington State University Elson S. Floyd College of Medicine (Washington)• California University of Science and Medicine¬–School of Medicine (California)• Carle Illinois College of Medicine (Illinois)• Hackensack-Meridian School of Medicine at Seton Hall University (New Jersey)
Schools with Candidate Status (n = 2)
• Kaiser Permanente School of Medicine (California)• TCU and UNTHSC School of Medicine (Texas)
Schools with Applicant Status (n = 3)
• College of Henricopolis School of Medicine (Virginia)• New York University Long Island School of Medicine (New York)• Roseman University of Health Sciences College of Medicine (Nevada)
15. As of March 2018.
16. View the Glossary of LCME Accreditation Terminology for full definitions of each accreditation status. www.lcme.org/glossary.
17 . Liaison Committee on Medical Education. Medical School Directory. 2018. www.lcme.org/directory. Accessed March 19, 2018.

18-042 (05/18)