results for announcement to the market fy16 full year report · fy15 moorebank sti 0.3 1.7 other...
TRANSCRIPT

24 August 2016
Results for Announcement to the Market FY16 Full Year Report We attach the following for the year ended 30 June 2016:
Financial Year Report (Appendix 4E)
Financial Report For further information, please contact: Paul White Paul Lewis Corporate Affairs Chief Financial Officer +61 417 224 920 +61 2 9080 1903

* The underlying information excludes certain non-cash and non-recurring items in order to more accurately reflect the underlying financial performance of Qube. References to ‘underlying ’information is to non-IFRS financial information prepared in accordance with ASIC Regulatory Guide 230 (Disclosing non-IFRS financial information) issued in December 2011. Non-IFRS financial information has not been subject to audit or review.
1
QUBE HOLDINGS LIMITED (ABN 14 149 723 053)
APPENDIX 4E Full Year Report 30 June 2016
Results for Announcement to the Market
Statutory Information
Set out below are the statutory results for Qube Holdings Limited (Qube) and its controlled entities for the year ended 30 June 2016.
FY 2016 $’m
FY 2015 $’m
Movement
Revenue from ordinary activities 1,332.5 1,459.3 -9%
EBITDA1 249.1 245.8 1%
Profit from ordinary activities after tax attributable to members
82.0 85.9 -5%
Net profit after tax attributable to members 82.0 85.9 -5%
Interim dividend per share (fully franked) 2.7 cents 2.7 cents -
Final dividend per share (fully franked) 2.8 cents 2.8 cents -
Basic Earnings per share (cents per share)2 7.3 8.1 -10%
Diluted Earnings per share (cents per share)2 7.2 8.0 -10%
1EBITDA is statutory net profit before tax adjusted to remove share of profit of associates, net finance costs, depreciation and amortisation. 2 Adjusted for entitlement offer.
Underlying Information*
Qube delivered a solid financial performance in what was a challenging operating environment for the year ended 30 June 2016.
Underlying information FY 2016 $’m
FY 2015 $’m
Movement
Underlying Revenue 1,319.7 1,432.0 -8%
Underlying EBITDA 246.3 267.5 -8%
Underlying EBITA 153.7 172.4 -11%
Underlying net profit for the year attributable to members
86.5 105.2 -18%
Underlying diluted earnings per share (cents per share)
7.6 9.8 -22%
Full year dividend per share (cents per share) 5.5 5.5 -

* The underlying information excludes certain non-cash and non-recurring items in order to more accurately reflect the underlying financial performance of Qube. References to ‘underlying ’information is to non-IFRS financial information prepared in accordance with ASIC Regulatory Guide 230 (Disclosing non-IFRS financial information) issued in December 2011. Non-IFRS financial information has not been subject to audit or review.
2
Underlying Information (continued)*
Further commentary on the performance of Qube and its operating businesses is set out in the financial statements and ASX announcement issued with this Appendix 4E.
A reconciliation of the statutory results to the underlying results for the year ended 30 June 2016 and the prior comparable period is presented below:
FY 2016 FY 2015
$’m $’m
Revenue from external customers 1,332.5 1,459.3
Fair value underlying adjustments (12.8) (27.1)
Other underlying adjustments - (0.2)
Underlying revenue 1,319.7 1,432.0
Net profit before income tax 128.1 127.5
Share of profit of associates (12.6) (10.4)
Net finance cost 32.1 25.2
Depreciation & amortisation 101.5 103.5
EBITDA 249.1 245.8
Impairment losses on investments in associates 21.3 -
Impairment on loan receivable from associate - 2.5
Impairment of property, plant and equipment - 42.4
Impairment reversal, property, plant and equipment (17.6) -
Cost of legacy incentive schemes - 2.2
Non-recurring restructure costs 2.9 -
Fair value gains (net) (12.8) (27.1)
FY15 Moorebank STI 0.3 1.7
Other 3.1 -
Underlying EBITDA 246.3 267.5
Depreciation (92.6) (95.1)
Underlying EBITA 153.7 172.4
Amortisation (8.9) (8.4)
Underlying EBIT 144.8 164.0
Underlying Interest expense (net) (32.1) (22.7)
Underlying share of profit of associates 14.1 10.4
Underlying net profit before income tax 126.8 151.7
Underlying Income tax expense (33.8) (42.4)
Underlying net profit for the year 93.0 109.3
Underlying non-controlling interests (6.5) (4.1)
Underlying net profit after tax attributable to members 86.5 105.2
Underlying diluted earnings per share (cents per share) 7.6 9.8
The table above has been extracted from note 2 of the financial statements but is un-audited.
Underlying information is determined as follows:
Underlying revenues and expenses are statutory revenues and expenses adjusted to exclude certain non-cash and non–recurring items such as fair value adjustments on investment properties, cost of legacy incentive schemes and impairments to reflect core earnings. Income tax expense is based on a prima-facie 30% tax charge on profit before tax and associates.

* The underlying information excludes certain non-cash and non-recurring items in order to more accurately reflect the underlying financial performance of Qube. References to ‘underlying ’information is to non-IFRS financial information prepared in accordance with ASIC Regulatory Guide 230 (Disclosing non-IFRS financial information) issued in December 2011. Non-IFRS financial information has not been subject to audit or review.
3
Dividend Information
Amount (cents per share)
Record Date
Final dividend - fully franked 2.8 13 September 2016
Payment date 11 October 2016
Qube paid a fully franked interim dividend of 2.7 cents per share for the half year ended 31 December 2015 on 6 April 2016. A fully franked final dividend of 2.8 cents per share for the year ended 30 June 2015 was paid on 7 October 2015. Dividend Reinvestment Plan
Qube operates a dividend reinvestment plan (DRP) that enables shareholders to elect to reinvest all, or a portion of, their dividends into additional shares in Qube. The DRP is available for the final dividend payable on 6 October 2016. Shares will be issued at a discount of 2.5% to the volume weighted average market price of shares sold on the ASX over the 10 trading days immediately following the record date for payment of the dividend. Lodgement of the election notice for participation in the DRP is due by 5:00pm on 14 September 2016. Net Tangible Asset Backing per Share
The net tangible asset backing per share is $1.01 (2015:$0.72 per share). Additional Information Additional Appendix 4E disclosures can be found in the notes to the Financial Report.
This Appendix 4E report is based on the 30 June 2016 Financial Report which has been subject to an audit by PwC, with an unqualified opinion.

Qube Holdings Limited Directors’ Report
for the year ended 30 June 2016
~ 1 ~
Directors’ Report
Your directors present their report on the consolidated entity consisting of Qube Holdings Limited and the entities it controlled (‘Qube’) at the end of, or during, the year ended 30 June 2016.
Directors
The following persons were directors of Qube Holdings Limited during the financial year and up to the date of this report, unless otherwise stated, as detailed below:
Name Position Appointed
Christopher Corrigan Non-executive Chairman 23 March 2011
Sam Kaplan Non-executive Deputy Chairman 23 March 2011
Maurice James Managing Director 23 March 2011
Ross Burney Non-executive Director 9 September 2011
Allan Davies Non-executive Director 26 August 2011
Peter Dexter Non-executive Director 1 September 2011
Robert Dove Non-executive Director 26 August 2011
Alan Miles Non-executive Director 1 April 2013
Åge Holm Alternate Director to Peter Dexter 7 November 2011
Simon Moore Alternate Director to Robert Dove 7 November 2011
Principal Activities
During the financial year the principal continuing activities of the Group consisted of providing comprehensive logistics solutions across multiple aspects of the import-export supply chain.
In addition, the Group is involved in the management and development of strategic properties with future development potential into inland rail terminals, bulk terminals and related logistics facilities.
Dividends provided or paid by the Company during the financial year:
Cents per share
Total $M
Franked percentage
Payment date
Ordinary Shares
Paid during the 2016 financial year
2015 Final dividend 2.8¢ 29.6 100% 7 October 2015
2016 Interim dividend 2.7¢ 28.6 100% 6 April 2016
Paid during the 2015 financial year
2014 Final dividend 2.7¢ 28.4 100% 3 October 2014
2015 Interim dividend 2.7¢ 28.5 100% 7 April 2015
Dividends declared by the Company after year end
2016 Final dividend 2.8¢ 40.5 100% 11 October 2016
Review of Operations
Overview
Qube achieved a number of key milestones during FY16 that will significantly enhance its ability to deliver long term shareholder value through improved supply chain efficiencies across the import and export logistics sector. The strategic assets secured by Qube during FY16 complement Qube’s existing assets and operations and significantly improve the overall quality of Qube’s business and future earnings.

Qube Holdings Limited Directors’ Report
for the year ended 30 June 2016
(continued)
Review of Operations (continued)
~ 2 ~
The highlights of the period (including agreements negotiated during the period but finalised post financial year end), include:
The acquisition of a 50% interest in the Patrick container terminals (Patrick) in conjunction with Brookfield Infrastructure Partners Limited and its partners (Brookfield) (who will own the other 50% of Patrick).
The agreement to acquire Aurizon Holdings Limited’s (Aurizon) 33% interest in the Moorebank land and related project, giving Qube a 100% ownership interest.
The agreement to acquire the remaining 50% of Australian Amalgamated Terminals (AAT) (subject to ACCC approval).
Completion of a $494 million entitlement offer to existing shareholders and a $306 million placement to the Canada Pension Plan Investment Board (CPPIB) to support the investment in Patrick.
Establishing new debt facilities within Patrick (non-recourse to Qube), and increasing Qube’s debt facilities, in each case on favourable terms and pricing to support the Patrick acquisition and Qube’s continued growth.
A reorganisation of Qube’s senior management team to support the above transactions, drive cost reductions and enhance Qube’s long term growth.
A reasonable financial result for FY16 with strong cashflows in spite of the continuation of the challenging operating environment and weakness in some of Qube’s markets.
Maintaining the full year dividend at 5.5 cents per share fully franked reflecting the strong cashflow generation and positive long term outlook despite lower earnings in FY16.
Financial Performance
Qube delivered a reasonable financial performance in what was a challenging operating environment. Underlying revenue and EBITDA both fell by around 8% to $1.3 billion and $246.3 million, respectively.
Qube’s underlying net profit after tax attributable to shareholders decreased by approximately 18% to $86.5 million and underlying earnings per share decreased by 22% to 7.6 cents. Underlying earnings per share pre-amortisation was 8.2 cents.
The reduced earnings were largely attributable to the Ports & Bulk division with the FY16 earnings reflecting the full year impact of the cessation or restructuring of four major contracts that occurred in the second half of FY15.
A contributor to the decline in earnings per share was the dilutionary impact of the entitlement offer completed in April 2016 to fund the Patrick acquisition. The earnings from the Patrick acquisition will only be recognised by Qube from the date of completion which occurred on 18 August 2016. If the dilutionary effect of the entitlement offer and the net financial impact of the Patrick acquisition (i.e. dividend income less net funding costs) were excluded, Qube’s underlying earnings per share for FY16 would be 8.2 cents and 8.8 cents on a pre-amortisation basis.
Statutory revenue decreased by around 9% to approximately $1.3 billion and profit after tax attributable to shareholders fell by around 5% to $82.0 million. Statutory diluted earnings per share were 7.2 cents, a 10% decline on the prior year.
The statutory result includes an impairment of Qube’s investment in Northern Stevedoring Services (NSS) of $22.8 million (inclusive of an impairment recognised by NSS itself), partly offset by the reversal of the previous impairment of Utah Point of $17.7 million and a fair value gain related to Qube’s Moorebank and Minto properties of $12.8 million (Qube’s share $8.7 million). The statutory result also includes costs of around $2.9 million resulting from exiting and/or restructuring certain parts of the business due to the sustained downturn and subdued outlook for the oil and gas sector.
The underlying financial information is based on the statutory information excluding certain non-recurring and non-cash items such as impairments and fair value adjustments in order to more clearly reflect the underlying earnings of the business.
A reconciliation between statutory and underlying results is provided in note 2 to these financial statements.
Dividend
The final dividend of 2.8 cents per share will be fully franked maintaining the full year dividend at 5.5 cents per share. Whilst this is above Qube’s target payout ratio of 50-60% of underlying earnings per share, the Board believes it is appropriate taking into account Qube’s strong cashflow, positive long term outlook and the dilutionary impact that the capital raising for the Patrick acquisition had on Qube’s FY16 earnings per share.

Qube Holdings Limited Directors’ Report
for the year ended 30 June 2016
(continued)
Review of Operations (continued)
~ 3 ~
Qube will continue to target a payout ratio of 50-60% of underlying earnings per share taking into account the cashflow generated by the businesses and other relevant considerations including Qube’s earnings outlook and capital expenditure requirements.
Acquisition of Patrick
A key highlight for the period was the agreement to acquire Patrick from Asciano Limited through a 50/50 joint venture with Brookfield. This acquisition was completed on 18 August following a lengthy, complex and competitive process lasting the majority of FY16.
Qube’s view is that Patrick is the most efficient, lowest cost container terminal operator in the country as a result of its two automated terminals in Brisbane and Sydney, has superior sites nationally and an experienced management team. Qube believes that there is a positive long term growth outlook for this business given both the structural tailwinds for container volumes through Australia’s ports as well as Patrick’s favourable competitive market positioning.
Qube has appointed the CEO of Patrick and will work closely with the Patrick management team and Brookfield to grow Patrick’s earnings by delivering a superior service to drive market share gains, and by delivering cost reductions and synergies through operational improvements and targeted capital expenditure.
In addition to the long term earnings growth from the Patrick investment, the transaction extends Qube’s supply chain capability to the port. This enhances Qube’s ability to provide efficient logistics solutions to its customers and is particularly important in maximising the efficiency of rail to and from the port which will be beneficial for Moorebank.
As part of the broader Asciano transaction, Qube also has the ability to acquire the 50% of Australian Amalgamated Terminals (AAT) that it does not presently own. AAT has long term port leases in NSW and Queensland used for automotive vehicle imports and is well placed to benefit from the expected increase in imported vehicles as a result of the closure of domestic vehicle manufacturing. Qube is working proactively with the ACCC to address any concerns and currently expects to complete the acquisition during FY17.
Progress with Moorebank Project
There were a number of important developments with the Moorebank project during the financial year and subsequent to year end.
In December 2015, an early lease surrender agreement was reached with the tenant on Qube’s majority owned Moorebank property. In addition to receiving a lease surrender payment, this agreement enabled Qube to commence the development of its site as well as start leasing the existing warehousing on its site to tenants that are suited to the future Moorebank project.
In August 2016, Qube reached agreement to acquire all of Aurizon’s interests in the Moorebank project for $98.9 million, which will give Qube 100% ownership of the project. In addition to delivering Qube 100% of the financial return from the Moorebank project, this simplified ownership structure is expected to enhance the deliverability of the project and maximise flexibility for Qube in terms of funding and partnering options as well as Qube’s ability to adopt a ‘whole of company’ approach covering warehousing and logistics when negotiating with prospective customers.
Qube currently expects financial close with the Commonwealth to occur shortly.
There has been strong tenant demand from national retail chains and logistics suppliers. Over 50,000m2 of area has already been leased by Qube and Qube is in discussions with a number of parties regarding the development and leasing of new warehousing.
Results from Operating Divisions
Qube’s two operating divisions delivered reasonable results in light of the challenging operating environment. The diversified nature of Qube’s activities was beneficial as strengths in certain markets helped mitigate the impact of weakness in other markets. Qube has also undertaken cost reduction initiatives to mitigate the impact of market conditions. This included a reorganisation of the senior management team with Paul Digney appointed to a newly created role of Chief Operating Officer to drive operational improvements across the entire organisation. There was also a focus on site consolidation and restructuring of activities relating to the oil and gas sector in the expectation of continued weakness in this sector.
Logistics
The full year underlying earnings (EBITDA) from the Logistics division increased by around 6.7% on the prior corresponding period (pcp) despite revenue being around 3.5% lower. The margin improvement reflected operational improvements and a focus on cost reductions and asset utilisation including the consolidation of activities previously undertaken at Somerton to the Vic Dock facility. The integration of the CRT acquisition was ahead of expectations and helped drive the margin improvement. Qube was successful in securing new customers in the period which helped offset the decline in volumes from its existing customer base.

Qube Holdings Limited Directors’ Report
for the year ended 30 June 2016
(continued)
Review of Operations (continued)
~ 4 ~
There was some weakness in Qube’s rail activities as a result of the drought in New South Wales and the delayed start of the Quattro Grain facility and the commencement of the rail contracts that Qube has with each of the grain traders in the Quattro Grain joint venture.
Qube’s past investment in facilities and infrastructure provide Qube with significant capacity to generate further margin improvement from increased volumes when economic conditions improve.
Ports & Bulk
The full year result from the Ports & Bulk division largely reflected a continuation of the first half trends with the second half earnings (EBITDA) slightly lower than the first half. For the full year, underlying revenue and EBITDA were down 13.9% and 26.7% respectively on FY15. As noted, this decline was largely due to the full year impact in FY16 of the cessation or restructuring of four major contracts that occurred in the second half of FY15. Although Qube was successful in securing new contracts to partly mitigate this, these contracts only made a minimal contribution in FY16 due to the lead time to source equipment and the initial training and induction costs.
There were strong volumes from activities including automotive stevedoring, forestry marshalling and bulk stevedoring. However, this was offset by the reduced oil and gas related activity as well as the mothballing of a mine by one of Qube’s largest customers. Qube has continued to deliver cost reductions directly and also through operational improvements that reduce the overall cost of providing the service. Qube has also restructured and/or closed several facilities and operations relating to the oil and gas sector.
As a result of the improved prospects for the Utah Point facility due to the more positive outlook for the iron ore price and Qube’s customer base at the facility, Qube has reversed the previous impairment of the Utah Point facility of $17.7 million in its statutory results which was partially offset by a small impairment of another asset of $0.1 million.
Associates
The associates had mixed results with a strong contribution from AAT (reflecting continued growth in motor vehicle imports) and Prixcar (reflecting the profit on sale of a property offsetting weaker operational performance following the loss of its major customer during the year) and a weaker result from NSS (reflecting market conditions in Townsville and Gladstone and weaker environment for new projects and contracts in its markets).
As a result of the weak medium-long term earnings outlook for NSS following the loss of several major customers and the challenging market conditions, the value of Qube’s investment has been impaired by $22.8 million (inclusive of an impairment recognised by NSS itself) to $24.5 million.
Quattro commenced operations in March 2016 which was later than expected. There was no material contribution in FY16 and an increased contribution is expected in FY17.
TQ Holdings continues to progress planning approvals for a fuel terminal at Port Kembla.
Funding
Qube successfully completed an entitlement offer in April 2016 raising around $494 million (excluding costs) from its existing shareholder base. Post the end of the financial year, Qube completed a $306 million placement to CPPIB (excluding costs). The proceeds raised from these capital raisings were used to fund the majority of Qube’s investment into Patrick, thereby ensuring that Qube retained a conservative balance sheet following completion of the acquisition.
During the period Qube, in conjunction with Brookfield, established around $1 billion in new debt facilities to assist with the funding for the acquisition of Patrick. These facilities have been provided to Patrick and are non-recourse to Qube and Brookfield. The terms and pricing of the new facilities reflect the quality of the Patrick business and associated cashflows it generates.
Qube increased its available debt facilities through the establishment of several new bi-lateral facilities totalling around $290 million to support further growth, all of which were undrawn at 30 June 2016. Additionally, Qube established a short term $150 million bridge facility, maturing in September 2016 that was used to partially fund the acquisition of the Asciano shares. Other than this facility Qube has no other near term debt maturities under its bank facilities and retains substantial headroom under its covenants.
Qube’s leverage ratio (net debt/net debt plus equity) decreased from approximately 27% at 30 June 2015 to around 24% at 30 June 2016 which remains below the bottom end of Qube’s target leverage range of 30-40%.
At 30 June 2016, Qube had net debt (being bank loans and finance lease liabilities less cash on hand) of approximately $601 million (2015: $519 million). Qube had available cash and undrawn debt facilities of around $615 million (2015: $260 million) providing Qube with substantial funding capacity to pursue further investment.

Qube Holdings Limited Directors’ Report
for the year ended 30 June 2016
(continued)
Review of Operations (continued)
~ 5 ~
Post completion of the Patrick acquisition, the purchase of Aurizon’s Moorebank interest and repayment of the $150 million facility, Qube will have cash and available facilities of around $260 million.
Qube is presently considering the issue of an ASX listed subordinated note in FY17 as part of its medium term funding initiatives to provide additional liquidity and extend the term of its funding.
Risk management
Qube’s framework for risk management involves an ongoing assessment of the key risks facing the business having regard to the following two key criteria:
1. The likelihood of a particular risk occurring; and
2. The impact on Qube if the risk did occur.
Qube’s risk management plan is focussed on trying to reduce both the likelihood of risks occurring and mitigate the financial and operational impact on Qube if it does.
Major risks to Qube’s earnings identified include:
● economic growth
● demand for commodities
● oil and gas activity (production and new projects)
● new vehicle sales
● container volumes
● equipment failure
● agri volumes/weather
● interest rate
● Australian dollar
● cyber security threats
Qube seeks to reduce the likelihood of these risks occurring, and the impact on its operations and earnings if it does occur through its detailed operating and financial policies and systems as well as by diversifying its activities by product, customer and geography. Qube also maintains a broad range of insurance cover to mitigate the financial impact of key risks should they occur.
Safety
Qube continues to drive its Zero Harm message throughout the business, focusing on 3 areas; Leadership, Culture and Governance. In FY16, Qube achieved the following;
- A significant improvement in safety results with a reduction in lost time injury frequency rate (LTIFR) of 19% from 3.2 to 2.6. This represents an 88% improvement since Qube commenced operations in 2007.
- Development of Qube Safety, Health and Environment (SHE) Standards and Due Diligence program, resulting in practical application framework and guide for officers and senior managers to discharge due diligence obligations.
- Implementation of an incident management system across all divisions, resulting in improved visibility, transparent and accurate SHE information.
- Introduction of corporate auditing program, to verify the effective implementation of SHE Management System.
- Review undertaken to validate good work practices and identify opportunities for improvements to policies, procedures, tools and processes for Chain of Responsibility compliance.
- Supporting Qube’s associates to develop and implement safety management systems to meet operational requirements. - Development of overall SHE management strategy in respect of the Moorebank Intermodal Logistics Precinct. - 25% reduction in number of environmental incidents.

Qube Holdings Limited Directors’ Report
for the year ended 30 June 2016
(continued)
Review of Operations (continued)
~ 6 ~
- Continued certification to ISO14001:2004, the international standard for Environmental Management Systems.
- Compliance with National Greenhouse and Energy Reporting Scheme.
Summary and Outlook
The 2016 financial year was a transformational year for Qube with the transactions negotiated or completed during the financial year significantly enhancing the quality of Qube’s business and long term earnings.
The acquisition of Patrick and the agreement for Qube to increase its ownership of the Moorebank project to 100% provides Qube with ownership of high quality infrastructure assets that complement Qube’s existing operations.
Qube’s existing businesses demonstrated the benefits of Qube’s diversified activities, strong market positions and strategic locations by delivering reasonable financial results and strong cashflow despite challenging economic conditions.
In FY17, Qube expects earnings growth in both its operating divisions although the extent of growth will be dependent on the broader economic conditions and activity levels and commodity pricing in Qube’s key markets.
Qube’s earnings will also benefit from the realisation of Qube’s pre-bid Asciano shareholding and its share of Patrick’s earnings which will be included from 18 August 2016.
The contribution from the Strategic Assets division is expected to reduce significantly in FY 17 following the negotiated lease surrender with the tenant at Moorebank in December 2015 which was necessary to facilitate the development of the broader Moorebank project.
Although Qube will earn rental income from leasing the existing warehousing on its site and from management fees for managing works on behalf of MIC in FY17, this is expected to be much lower than the rental income earned in FY16 and will be partly offset by expenses associated with the planning and development of the broader Moorebank project.
The earnings from Moorebank are expected to progressively increase over the medium term as the new warehousing is leased and the rail terminals become operational.
Overall, Qube presently expects to report increased underlying earnings in FY17 and does not expect any change to the challenging market conditions in FY17.

Qube Holdings Limited Directors’ Report
for the year ended 30 June 2016
~ 7 ~
Significant changes in state of affairs
Other than as stated above, no other matter or circumstance has arisen that has significantly affected the Group’s operations, results or state of affairs during the period.
Matters subsequent to the end of the financial year
Post the end of the financial year, the following significant events occurred:
On 2 August 2016, Qube completed a $306 million placement to the Canada Pension Plan Investment Board.
On 2 August 2016, Qube entered into an agreement to acquire Aurizon Holdings Limited’s interests in the Moorebank project for $98.9 million, thereby giving Qube a 100% interest.
On 18 August 2016, Qube and a Brookfield managed consortium acquired 100% of Patrick for total consideration of $2,915 million (excluding costs and adjustments).
The current available-for-sale financial asset held by Qube was used as part of the total consideration for this transaction and as such forms part of the non-current investment in the Patrick joint venture. Further, any remaining available-for-sale reserve balance relating to this asset will also be recycled through the income statement in FY17.
Except as noted above no matter or circumstance has arisen since the end of the financial year that has significantly affected, or may significantly affect the Group's operations, the results of those operations or the Group's state of affairs in future financial years.
Likely developments and expected results of operations
The Group will continue to pursue its policy of investing in and developing strategic logistics businesses focused on the import and export supply chains that can deliver a sustainable increase in earnings over the medium to long term.
Environmental regulation
The Group is subject to various state and federal environmental regulations in Australia and New Zealand.
The directors are not aware of any material non-compliance with environmental regulations pertaining to the operations or activities during the period covered by this report.
All Qube businesses continue to operate an integrated Safety, Health and Environment Management System ensuring that non-compliance risks and opportunities for environmental improvement are identified, managed and reported accordingly.

Qube Holdings Limited Directors’ Report
for the year ended 30 June 2016
(continued)
~ 8 ~
Information on directors
Christopher Corrigan Chairman – Non-executive Director
Experience and expertise
Mr Corrigan is the Chairman of Qube and has been involved in Qube’s strategic direction since its formation.
Mr Corrigan was Managing Director of Patrick Corporation Limited, Australia's largest stevedore company with interests in rail transportation and aviation through Virgin Blue, from March 1990 to May 2006. Prior to that, Mr Corrigan had a career with Bankers Trust spanning 20 years, including periods as Managing Director of Bankers Trust in Australia and for the Asia-Pacific region.
In 1990, Mr Corrigan sponsored the formation of a development capital business, Jamison Equity, which in December 1996 became a wholly owned subsidiary of the then publicly listed company Patrick Corporation Limited.
Mr Corrigan was appointed as a director of Qube on 23 March 2011.
Directorships of listed companies held during the last three years:
● Crown Limited – from 6 July 2007 to 29 November 2013
● Webster Limited – previously and from 15 October 2012 to current
Special responsibilities
Chairman of the Board
Sam Kaplan Deputy Chairman – Non-executive Director
Experience and expertise
Mr Kaplan is Managing Director of Kaplan Funds Management Pty Limited, the investment manager of Qube from its establishment in 2006 until the Qube Restructure in September 2011. Mr Kaplan was one of the founders of Qube.
Mr Kaplan is an alternate director and member of the Investment Committee of Maritime Super.
Mr Kaplan was one of the founders of Patrick Corporation Limited and was involved in strategic planning with the Company. During his tenure at Patrick Corporation Limited, Mr Kaplan was involved in a number of acquisitions including Pacific National and Virgin Blue.
Mr Kaplan was appointed as a director of Qube on 23 March 2011.
Directorships of listed companies held during the last three years:
None
Special responsibilities
Chair of Audit and Risk Management Committee

Qube Holdings Limited Directors’ Report
for the year ended 30 June 2016
(continued)
Information on directors (continued)
~ 9 ~
Maurice James Managing Director
Experience and expertise
Mr James has over 30 years’ extensive experience in engineering, ports and logistics industries.
His early career was spent at the Port of Melbourne Corporation commencing as a civil engineer and subsequently moving through various roles to Manager Commercial Operations.
Mr James was an integral part of the executive team of Patrick Corporation Limited between 1994 and 2006. His last position at Patrick was that of Executive Director Ports which included responsibility for Patrick’s container terminals and port logistics businesses.
Since 2007 Mr James has had various roles in the Qube related group of companies and, upon corporatisation of Qube on 1 September 2011, became Managing Director.
Mr James is a Director on the Board of the Australian Logistics Council and also sits on the NSW Freight Advisory Council.
Mr James holds a Bachelor of Engineering (Civil) and a Master of Business Administration.
Mr James was appointed as a director of Qube on 23 March 2011.
Directorships of listed companies held during the last three years:
None
Special responsibilities
Managing Director
Ross Burney Non-executive Director
Experience and expertise
Mr Burney is the Chief Executive of Hume Partners. He has over 25 years’ experience as an accountant and investment manager previously having worked for BDO Chartered Accountants, Brierley Investments Limited, Guinness Peat Group and Taverners Group.
Mr Burney was appointed as a director of Qube on 9 September 2011.
Directorships of listed companies held during the last three years:
● Oncard International Limited – from May 2010 to June 2015
● Ruralco Holdings Limited – from September 2014 to February 2016
Special responsibilities
Member of Audit and Risk Management Committee

Qube Holdings Limited Directors’ Report
for the year ended 30 June 2016
(continued)
Information on directors (continued)
~ 10 ~
Allan Davies Non-executive Director
Experience and expertise
Mr Davies has over 40 years’ mining experience in the Australian and international coal and metalliferous mining industries having worked in operational roles up to executive director.
From 2000 until early 2006, Mr Davies also worked for Patrick Corporation Limited as Director Operations. This position included responsibility for Patrick’s interest in Pacific National, Patrick Shipping, Patrick General Stevedoring and Patrick Autocare.
Mr Davies was a director of Pacific National from its initial acquisition by Toll and Patrick in 2001 until 2006.
Mr Davies was also a director of Queensland Rail and then QR National (predecessor to Aurizon) from 1 October 2008 until 13 December 2011.
Mr Davies was appointed as a director of Qube on 26 August 2011.
Directorships of listed companies held during the last three years:
● Non-executive Director of King Island Scheelite Limited from 30 September 2013 to current
Special responsibilities
Chair of Safety, Health and Environment Committee
Chair of Nomination and Remuneration Committee
Peter Dexter AM, FAICD Non-executive Director
Experience and expertise
Mr Dexter has over 40 years’ experience in the maritime and logistics industries in Australia and internationally.
Mr Dexter is a Non-executive Director of the ASX listed Royal Wolf Holdings Limited, Chairman of the Australian National Maritime Museum, and a director of Wilh. Wilhelmsen Investments Pty Ltd.
Prior to his non-executive roles, Mr Dexter was Regional Director and a member of the global management team of Wallenius Wilhelmsen Logistics.
Mr Dexter was appointed as a director of Qube on 1 September 2011.
Directorships of listed companies held during the last three years:
● Non-executive Director of Royal Wolf Holdings Limited – from April 2011 to current
Special responsibilities
Member of Safety, Health and Environment Committee
Member of Nomination and Remuneration Committee

Qube Holdings Limited Directors’ Report
for the year ended 30 June 2016
(continued)
Information on directors (continued)
~ 11 ~
Robert Dove Non-executive Director
Experience and expertise
Mr Dove is a Managing Director with The Carlyle Group in Washington DC and is head of Carlyle Infrastructure Partners, a $1.2 billion infrastructure fund that was raised in 2007.
Prior to joining Carlyle in 2006, Mr Dove was a Senior Vice President of Bechtel Group where he had responsibility for aspects of its project development and financing activities.
Mr Dove currently sits on the boards of a number of Carlyle’s infrastructure investments.
Mr Dove was appointed as a director of Qube on 26 August 2011.
Directorships of listed companies held during the last three years:
None
Special responsibilities
Member of Nomination and Remuneration Committee
Alan Miles Non-executive Director
Experience and expertise
Mr Miles is Managing Director of “K” Line (Australia) Pty Limited. Mr Miles has more than 35 years’ experience in the Australian shipping industry, including management roles of Bulk, Liner and PCC Shipping.
Mr Miles is also currently the Chairman of Prixcar Services Pty Limited and a director of Kawasaki Australia. He also is a director of other affiliated Kawasaki companies in Australia and a member of the Policy Council of Shipping Australia.
Mr Miles was appointed as a director of Qube on 7 November 2011.
Directorships of listed companies held during the last three years:
None
Special responsibilities
Member of Safety, Health and Environment Committee
Member of Audit and Risk Management Committee

Qube Holdings Limited Directors’ Report
for the year ended 30 June 2016
(continued)
Information on directors (continued)
~ 12 ~
Åge Holm Alternate Non-executive Director
Experience and expertise
Mr Holm is Vice President Finance and Investor Relations at Wilh. Wilhelmsen Holding ASA.
Mr Holm has 30 years’ experience from shipping and automotive logistics, including serving as CFO of Wallenius Wilhelmsen Logistics AS and as non-executive director of Group CAT and other European based vehicle logistics companies.
Mr Holm was appointed as an alternate director of Qube on 7 November 2011.
Directorships of listed companies held during the last three years:
None
Special responsibilities
Alternate Director to Peter Dexter
Simon Moore Alternate Non-executive Director
Experience and expertise
Mr Moore is a Managing Director with The Carlyle Group based in Sydney, Australia.
Prior to joining The Carlyle Group, Mr Moore was a Managing Director and Investment Committee Member of Investcorp International, Inc. based in New York. Prior to that, Mr Moore worked in private equity investments and investment banking at J.P. Morgan & Co. in New York, Hong Kong and Melbourne.
Mr Moore was appointed as an alternate director of Qube on 7 November 2011.
Other current directorships
● Chairman of Coates Hire
● Non-executive Director of Megaport Limited
● Non-executive Director of TPI Enterprises
Directorships of listed companies held during the last three years:
● Non-executive Director of Healthscope Limited
Special responsibilities
Alternate Director to Robert Dove

Qube Holdings Limited Directors’ Report
for the year ended 30 June 2016
(continued)
~ 13 ~
Interest in shares
The relevant interests of each director in the shares of the Company are disclosed in the Remuneration Report on page 26.
Chief Financial Officer
The Chief Financial Officer is Mr Paul Lewis. He has been involved with Qube since its establishment in 2006, responsible for managing the commercial and financial aspects of Qube’s interests. Prior to Qube, Mr Lewis was a senior executive at Patrick Corporation Limited where he was responsible for investments and acquisitions.
Company Secretary
The Company Secretary and General Counsel is Mr William Hara. Prior to joining Qube, Mr Hara worked as General Counsel and Company Secretary at Lend Lease from 2007 to 2012. In June 2016, Mr Hara was appointed as Director Strategic Assets Division.
Meetings of directors
The number of meetings of the Company's board of directors and of each board committee held during the year and the numbers of meetings each director was present were:
Meetings of committees
Full meetings
of directors Audit and Risk Management
Nomination and Remuneration
Safety, Health and Environment
A B A B A B A B
Christopher Corrigan1 9 9 2 2
Sam Kaplan2 9 9 5 5 2 2
Maurice James* 9 9 3 2
Ross Burney 9 8 5 4
Allan Davies3,4,5 9 9 1 1 4 4 3 3
Peter Dexter6 9 9 4 4 3 3
Robert Dove 9 9 6 5
Alan Miles7 9 8 4 3 3 3
Åge Holm
Simon Moore 1 1
A = Number of meetings held during the time the director held office or was a member of the committee during the year
B = Number of meetings attended
* = Not a non-executive director
Appointments and resignations
1-Resigned as member of the Nomination and Remuneration Committee effective 20 August 2015 2-Resigned as chairman of the Nomination and Remuneration Committee effective 25 November 2015 3-Appointed as a member of the Nomination and Remuneration Committee effective 8 October 2015 4-Appointed as chairman of the Nomination and Remuneration Committee effective 25 November 2015 5-Resigned as member of the Audit and Risk Management Committee effective 25 November 2015 6-Appointed as member of the Nomination and Remuneration Committee effective 25 November 2015 7-Appointed as member of the Audit and Risk Management Committee effective 25 November 2015

Qube Holdings Limited Directors’ Report
Remuneration Report for the year ended 30 June 2016
~ 14 ~
Remuneration Report
Contents
1. Message from the Nomination and Remuneration Committee 2. Remuneration summary 3. Governance 4. Take home pay of Managing Director and other KMP 5. Executive remuneration framework 6. Linking rewards, performance and strategy 7. Employment conditions 8. Non-executive directors 9. Director’s interests 10. Statutory remuneration disclosures
1. Message from the Nomination and Remuneration Committee
The Nomination and Remuneration Committee presents the Qube Remuneration Report for the year ended 30 June 2016 (FY16). This report has been audited in accordance with section 308(3C) of the Corporations Act 2001.
The Committee’s objective is to ensure Qube’s remuneration framework provides the foundation for retaining and incentivising talented employees to deliver the Group’s strategy and that it is aligned with shareholder wealth creation.
The Committee aims to communicate the remuneration outcomes with full transparency, demonstrate that the Qube Group’s remuneration platform is both market competitive and fair to all stakeholders, and has performance measures aligned to the achievement of Qube’s strategic objectives.
The Committee has engaged PwC to review Qube’s remuneration framework to ensure that it continues to be appropriate in FY17 and beyond and appropriately reflects the increased scale and complexity of Qube’s operations.

Qube Holdings Limited Directors’ Report
Remuneration Report for the year ended 30 June 2016
(continued)
~ 15 ~
2. Remuneration summary
This remuneration report sets out remuneration information for Qube’s non-executive directors, the Managing Director and other key management personnel (KMP) for FY16.
Directors and executives disclosed in this report
Name Position
Non-executive Directors
Christopher Corrigan Chairman, Non-executive Director
Sam Kaplan Deputy Chairman, Non-executive Director
Ross Burney Non-executive Director
Allan Davies Non-executive Director
Peter Dexter Non-executive Director
Robert Dove Non-executive Director
Alan Miles Non-executive Director
Åge Holm Alternate Director to Peter Dexter
Simon Moore Alternate Director to Robert Dove
Executive Directors
Maurice James Managing Director
Other key management personnel
Paul Digney Chief Operating Officer/former Managing Director Logistics Division
William Hara General Counsel and Company Secretary and Director Strategic Assets Division
Paul Lewis Chief Financial Officer
Don Smithwick Managing Director Ports & Bulk Division (retired 30 June 2016)

Qube Holdings Limited Directors’ Report
Remuneration Report for the year ended 30 June 2016
(continued)
~ 16 ~
2. Remuneration summary (continued)
Principles used to determine the nature and amount of executive remuneration
Qube’s guiding principle for remuneration is based on a mix of fixed and at-risk performance based remuneration that increases overall remuneration towards the upper end of comparable companies if the relevant performance hurdles are achieved. This is intended to align executive remuneration with long term value creation for Qube shareholders.
For FY16 the executive remuneration framework consisted of fixed remuneration, cash short-term incentives (with a deferral component) and long-term incentives.
Component Objective Performance condition
Fixed remuneration Reflects the market value of the role and the executive’s skills and experience.
Reviewed annually following individual performance review.
Short term incentive – at risk (STI)
Incentive for achievement of financial and non-financial objectives for the financial year.
Executives participate in an STI plan which assesses performance against financial and non-financial KPI’s over the financial year.
50% of any STI payment is deferred for 1 year.
Long term incentive – at risk (LTI)
Incentive for long term shareholder value creation and to assist in retention of key executives.
LTIs are in the form of performance rights and options that do not vest earlier than 3 years. The key performance conditions are as follows:
LTI Plan
● 25% of performance rights and options are subject to a relative total (share price and dividends) shareholder return (TSR) performance condition over the vesting period.
● 75% of performance rights and options are subject to a compound annual growth in earnings per share (CAGR EPS) performance condition over a minimum of 3 financial years.
Moorebank Plan
● 50% of performance rights and options are subject to an annual shareholder return (ASR) (share price and dividends) performance condition over the vesting period.
● 50% of performance rights and options are subject to assessment by the Qube Board based on overall achievement of the Moorebank target. The Moorebank targets include a number of non-market based hurdles.
3. Governance
Role of the Nomination and Remuneration Committee
The objective of the Committee is to assist the Board in fulfilling its responsibilities in regard to remuneration matters, including:
● the remuneration framework for non-executive directors;
● the remuneration framework, including any proposed equity incentive awards for the Managing Director and all executives that report directly to the Managing Director (Senior Executives);
● recommendations and decisions (as relevant) on remuneration including incentive awards for the Managing Director and other Senior Executives; and
● strategic human resources policies.
Use of remuneration advisers
During the financial year, Qube engaged PwC to provide a remuneration benchmarking report for the remuneration of the Managing Director and his direct reports as well as non-executive director fees. PwC also provided ad hoc advice with respect to remuneration items such as short and long term incentive plans. This engagement did not involve PwC providing a ‘remuneration recommendation’ as defined in section 9B of the Corporations Act 2001.

Qube Holdings Limited Directors’ Report
Remuneration Report for the year ended 30 June 2016
(continued)
~ 17 ~
4. Take home pay of Managing Director and other KMP
The following table sets out details of the take home pay of Qube’s Managing Director and other KMP i.e. the gross salary package and actual incentives earned in the 2016 financial year. This table has been included to give shareholders a better understanding of the amounts the Managing Director and other KMP actually received (or were entitled to receive) for each component of remuneration during the 2016 financial year. This information is not compliant with International Financial Reporting Standards (‘IFRS’) and is unaudited. The full statutory remuneration table (which is prepared in accordance with the accounting standards) can be found on page 27.
Accounting standards require that the expense relating to equity instruments granted in relation to remuneration arrangements be reflected over the ‘vesting period’, notwithstanding that the Managing Director and other executives may never receive any actual value from such a grant. For example, under Qube’s LTI arrangements, the value ultimately received will depend on the achievement of performance hurdles and the share price at the time the LTI vests. This disclosure, which shows only the total value of incentives that vested in the financial year, is in addition to that contained on page 27, section 10 of the Remuneration Report, which shows the full accounting expense for the financial year in accordance with the accounting standards.
Fixed annual remuneration Total STI
Moorebank
STI
Vested long-term incentives
Total take home pay
Performance related
remuneration
Name ($) ($) ($) ($) ($) (%)
Managing Director
Maurice James
2016
2015
800,000
800,000
500,000
587,500
300,000
300,000
71,222
288,333
1,671,222
1,975,833
52%
60%
Other key management personnel
Paul Digney
2016
2015
495,000
495,000
262,500
230,000
-
-
19,708
1,144,820
777,208
1,869,820
36%
74%
William Hara
2016
2015
415,974
415,411
237,500
280,000
155,000
155,000
39,417
78,833
847,891
929,244
51%
56%
Paul Lewis
2016
2015
415,974
415,411
237,500
275,000
70,000
70,000
19,708
75,889
743,182
836,300
44%
51%
Don Smithwick
2016
2015
625,975
625,183
187,500
397,500
-
-
19,708
414,242
833,183
1,436,925
25%
57%
1. Fixed annual remuneration is based on current gross salary package, which includes base salary, superannuation contributions and the value of non-monetary benefits provided to the executive (inclusive of all taxes) but excludes accrued leave.
2. STI amount represents the actual STI to be paid in September 2016 (being 50% of the FY15 and 50% of the FY16 STIs awarded). The remaining 50% of the FY16 STI awarded will be paid around September 2017 subject to certain conditions being met.
3. In FY15, those executives who were involved in negotiations with the Commonwealth Government for the development of the Moorebank Intermodal Terminal received a once-off bonus in addition to their regular STI. 50% was paid in September 2015 and the balance will be paid in September 2016.
4. Vested long-term incentives (except for the Legacy incentives which were cash settled) represents the value of long-term incentives (i.e. ELTIP) which have vested in the year based on the value of the equity instruments at the date of the grant. The value of the Legacy incentive is the amount of the total cash payment made to the employee in the period.

Qube Holdings Limited Directors’ Report
Remuneration Report for the year ended 30 June 2016
(continued)
~ 18 ~
5. Executive remuneration framework
The executive pay and reward framework has three components:
● fixed remuneration comprising base pay and benefits including superannuation;
● short-term incentives; and
● long-term incentives.
Senior Executives have a higher proportion of ‘at risk’ rewards. The combination of these comprises an executive's total remuneration and is set out below.
Remuneration mix
For FY16, the relative proportions of remuneration that are fixed and those that are linked to performance (at target) are as follows:
Name Fixed
remuneration At risk – STI At risk – LTI
Managing Director
Maurice James 22% 22% 56%
Other key management personnel
Paul Digney 26% 21% 53%
William Hara 20% 16% 64%
Paul Lewis 23% 19% 58%
Don Smithwick 44% 56% 0%
Fixed remuneration
Structured as a total employment cost package which may be delivered as a combination of cash and non-financial benefits.
Executives receive base pay comprising the fixed component of pay including contributions to superannuation plans. Base pay for executives is reviewed annually following an individual performance review and having regard to Qube’s remuneration principle based on a fixed component at the lower to median end of comparable executive pay levels.
Short-term incentives (STIs)
Eligible executives have a target STI opportunity depending on the accountabilities of the role and their ability to impact organisation or business unit performance.
Each year, the Committee considers the appropriate targets and key performance indicators (KPIs) to link the STI plan and the level of payment if targets are met. This includes setting any targets for payment under the short-term incentive plan and minimum levels of performance for the payment of short-term incentives.
STI arrangements for the Managing Director, the KMP and other senior executives include:
● a remuneration mix that is weighted towards at risk consistent with Qube’s growth oriented strategy and to align executive’s interests with those of our shareholders; and
● allowing executives to elect to take all or the deferred portion of any STI payment in Qube shares.

Qube Holdings Limited Directors’ Report
Remuneration Report for the year ended 30 June 2016
(continued)
~ 19 ~
5. Executive remuneration framework (continued)
Short-term incentives (STIs) (continued)
Managing Director: Other key management personnel*:
KPI Weighting Measure KPI Weighting Measure
Group Financial Performance
Note 1 ● Achieve and exceed Group underlying financial targets predominantly NPAT but also including Return on Average capital employed (ROACE).
Group Financial Performance
Note 1 ● Achieve and exceed Group underlying financial targets predominantly NPAT but also including Return on Average capital employed (ROACE).
Divisional Financial Performance
-% ● N/A Divisional Financial Performance
25-38% ● Achieve and exceed divisional underlying financial targets, which include the following metrics:
– EBIT
– ROACE
Strategy & Growth
80% ● Achievement of strategic objectives from major capital investment and acquisitions.
Strategy & Growth
25-63% ● Achievement of strategic objectives from major capital investment and acquisitions.
● Delivery on key divisional business projects including target growth in volumes and securing key contracts.
● Provide an effective contribution to Group-wide projects.
Business & Operations
20% ● Operational targets such as driving improvements and delivery against key priorities for Board committees.
● Effective stakeholder, Board and investor management.
Business & Operations
13-50% ● Role related operational targets such as driving improvements and delivery against key priorities from Board committees.
● Effective management of role related legal and financial reporting obligations.
● Effective stakeholder, Board and investor management.
Note 1 - There is a threshold requirement that Qube must achieve at least 90% of overall Group financial targets for an STI to be payable.
* Figures exclude Don Smithwick who retired on 30 June 2016 and ceased to be a KMP from that date onwards.
The Managing Director achieved 74% of his KPI’s while the other KMP achieved between 88% and 94% of their financial and non-financial targets.
Consistent with Qube’s existing STI plan, 50% of the STI will be paid in September 2016 and the other 50% will be paid in September 2017.

Qube Holdings Limited Directors’ Report
Remuneration Report for the year ended 30 June 2016
(continued)
~ 20 ~
5. Executive remuneration framework (continued)
Determination of FY16 STI Awards
Financial KPIs
Qube’s FY16 financial performance did not fully meet internal targets with 92% of the KPI relating to Group financial performance being achieved. The Managing Director of the Logistics division achieved 92% of his financial targets. The Managing Director of the Ports & Bulk division did not meet his financial targets as the main variation from target financial performance was in the Ports & Bulk division.
Non-Financial KPIs
The Managing Director achieved approximately 74% of the KPI relating to non-financial measures reflecting the effective management of growth projects, effective capital management and the management of various stakeholders.
The other KMP achieved approximately 91% of KPI relating to non-financial measures largely reflecting effective management of growth projects and delivery of key priorities from Board committees.
STI Pool
The available pool for payment of STI is based on the Company’s ability to pay. There is a threshold requirement that Qube must achieve at least 90% of overall Group financial targets for any STI to be payable. Although the threshold requirement was met and the Financial KPIs were met, Qube’s overall financial performance was lower compared to the prior year. The Committee decided that the STI Pool should be reduced and the KMP have agreed to forego around 19% of the STI to which they would otherwise be entitled for FY16. In the case of Mr Smithwick, he has agreed to forego any STI payment. To determine each executive’s STI Award, the Committee assessed the contribution of each individual in achieving the Group financial targets and where applicable divisional financial targets and their performance against Non-Financial KPIs.

Qube Holdings Limited Directors’ Report
Remuneration Report for the year ended 30 June 2016
(continued)
~ 21 ~
5. Executive remuneration framework (continued)
Long-term incentives (LTIs)
During FY16 Qube continued to grant Long-Term Incentives (LTIs) in the form of Performance Rights and Options to incentivise and retain key executives.
The key terms and conditions for the FY16 grant are described below:
Participation The Managing Director, other KMP and other executives who can directly influence the performance of Qube.
Valuation date 3 September 2015
Grant date 3 September 2015
Instrument Performance Right or Option (representing an entitlement to one ordinary Qube share) on achievement of certain performance conditions.
Performance condition
25% of Performance Rights and Options are subject to a Total Shareholder Return Hurdle (TSR Performance Rights and Options) and 75% are subject to an Earnings Per Share Hurdle (EPS Performance Rights and Options).
Exercise price Performance Rights - Nil
Options - $2.244 which is the 20 day VWAP up to and including 2 September 2015.
Performance period 3 years to 3 September 2018 (with retesting annually to 3 September 2020 for any EPS Performance Rights and Options that have not vested and tested over the extended period).
Vesting date 3 September 2018 (with retesting annually to 3 September 2020 for EPS Performance Rights and Options only).
Expiry date TSR Performance Rights and Options: 3 September 2018
EPS Performance Rights and Options: 3 September 2020
Dividends The holder is entitled to an amount equal to the dividends that would have been paid on the vested Performance Rights (as if they held Qube shares) for the period from the Grant date to the Vesting date. This amount is settled in Qube shares. No amount is payable for Performance Rights that do not vest.
TSR Hurdle The TSR Performance Rights and Options will vest depending upon Qube’s underlying total shareholder return during the relevant performance period.
The TSR Hurdle is based on Qube’s relative TSR performance as compared to the other companies in the S&P ASX 200 Index.
The vesting schedule is as follows:
● Nil – if Qube’s TSR ranks less than the 50th percentile
● 50% – if Qube’s TSR is equal to the 50th percentile
● Pro-rated between 50% and 100% – if Qube’s TSR ranks greater than the 50th percentile but less than the 75th percentile
● 100% – if Qube’s TSR ranks at the 75th percentile or higher
EPS Hurdle The EPS Performance Rights and Options will vest depending upon Qube’s underlying EPS performance during the relevant performance period. For the FY16 grant under the plan the maximum vesting opportunity was a CAGR of 6% in EPS. If Qube’s CAGR in EPS for the relevant performance period (based on the respective 30 June reported financial results) is:
● less than the minimum EPS target, no EPS Performance Rights and Options will vest;
● equal to, or greater than, the EPS target, 100% of the EPS Performance Rights and Options will vest; or
● greater than the minimum EPS target but less than the EPS target, the percentage of EPS Performance Rights and Options that vest will be pro-rated on a straight-line basis between 0% and 100%.
If any of the EPS Performance Rights and Options have not vested at the end of three years, they will be carried forward to the following year and retested based on a four year period. Any EPS Performance Rights and Options that remain unvested then will be carried forward and retested on the basis of a five year period. Any unvested EPS Performance Rights and Options will lapse at the end of the five years.

Qube Holdings Limited Directors’ Report
Remuneration Report for the year ended 30 June 2016
(continued)
~ 22 ~
5. Executive remuneration framework (continued)
Long-term incentives (LTIs) (continued)
During FY16 Qube granted a Moorebank specific Long-Term Incentives (LTIs) in the form of Performance Rights and Options to incentivise and retain key executives.
The key terms and conditions for the FY16 grant are described below:
Participation The Managing Director, other KMP and other executives who can directly influence the outcome of the Moorebank Project.
Valuation date 3 September 2015
Grant date 3 September 2015
Instrument Performance Right or Option (representing an entitlement to one ordinary Qube share) on achievement of certain performance conditions.
Performance condition
50% of Performance Rights and Options are subject to an Annual Shareholder Return Hurdle (ASR Performance Rights and Options) and 50% are subject to a Key Performance Indicator (KPI Performance Rights and Options).
Exercise price Performance Rights - Nil
Options - $2.244 which is the 20 day VWAP up to and including 2 September 2015.
Performance period 3 years to 3 September 2018 (with retesting annually to 3 September 2020 for any ASR Performance Rights and Options that have not vested and tested over the extended period).
Vesting date 3 September 2018 (with retesting annually to 3 September 2020 for ASR Performance Rights and Options only).
Expiry date ASR and KPI Performance Rights: 3 September 2020
ASR and KPI Options: 3 September 2022
Dividends The holder is entitled to an amount equal to the dividends that would have been paid on the vested Performance Rights (as if they held Qube shares) for the period from the Grant date to the Vesting date. This amount is settled in Qube shares. No amount is payable for Performance Rights that do not vest.
ASR Hurdle Vesting of the ASR Performance Rights and Options is subject to Qube achieving a cumulative 4.5% compound ASR over the relevant Performance Period.
ASR is the annual shareholder return and is measured by both the growth in Share price from the Award Date to the end of the relevant Performance Period and any dividends paid during this time.
The Share price will be based on the VWAP of a Share over the 20 trading days up to and including the day of the start and the end of the relevant Performance Period.
KPI Hurdle Achievement of the Moorebank Targets is to be assessed by the Board as a package. In assessing the overall achievement of the Moorebank Targets, the Board will have regard to the base case financial and operating models taking into account deviations (known and unknown). The Moorebank targets include a number of non-market based hurdles. Vesting of the Moorebank Performance Rights and Options will be assessed by the Board based on overall achievement of the Moorebank Targets as follows:
1. Overall did not meet Moorebank Targets: zero vesting
2. Overall met Moorebank Targets: 75% of the Moorebank Performance Rights and Options will vest
3. Overall exceeded Moorebank Targets: 100% of the Moorebank Performance Rights and Options
will vest.
Qube Holdings Limited Directors’ Report
Remuneration Report for the year ended 30 June 2016
(continued)
~ 23 ~
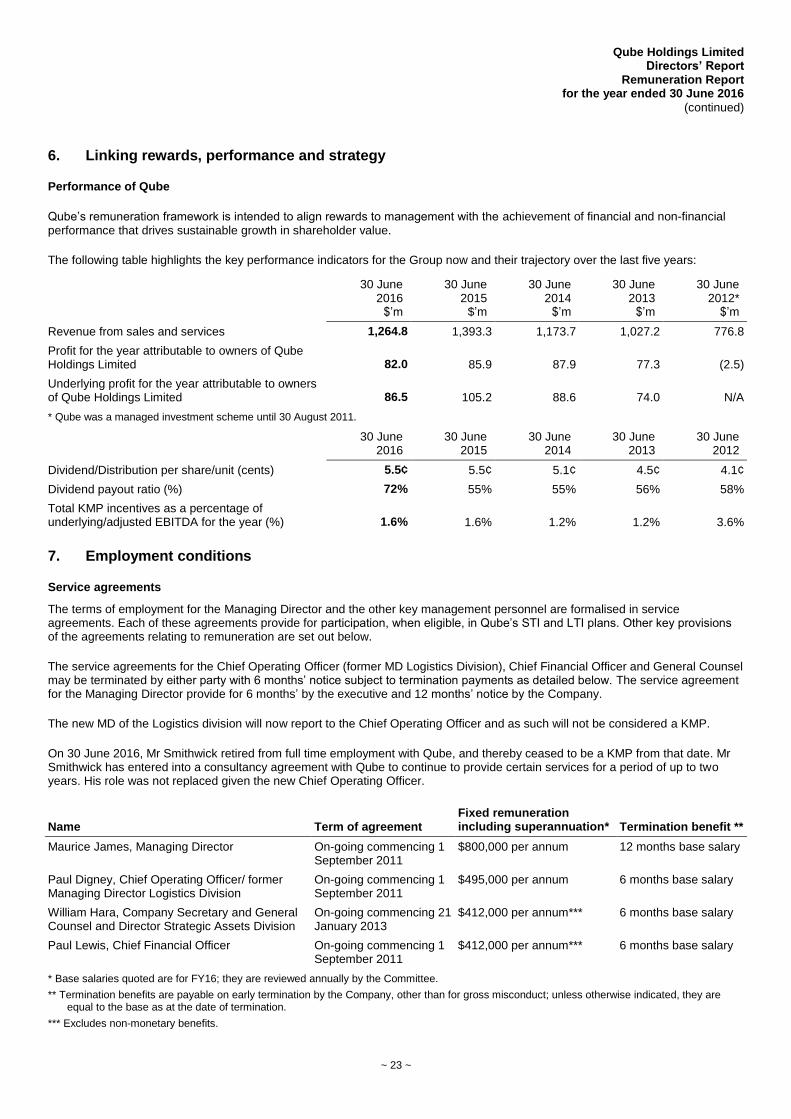
6. Linking rewards, performance and strategy
Performance of Qube
Qube’s remuneration framework is intended to align rewards to management with the achievement of financial and non-financial performance that drives sustainable growth in shareholder value.
The following table highlights the key performance indicators for the Group now and their trajectory over the last five years:
30 June 2016
$’m
30 June 2015
$’m
30 June 2014
$’m
30 June 2013
$’m
30 June 2012*
$’m
Revenue from sales and services 1,264.8 1,393.3 1,173.7 1,027.2 776.8
Profit for the year attributable to owners of Qube Holdings Limited 82.0 85.9 87.9 77.3 (2.5)
Underlying profit for the year attributable to owners of Qube Holdings Limited 86.5 105.2 88.6 74.0 N/A
* Qube was a managed investment scheme until 30 August 2011.
30 June 2016
30 June 2015
30 June 2014
30 June 2013
30 June 2012
Dividend/Distribution per share/unit (cents) 5.5¢ 5.5¢ 5.1¢ 4.5¢ 4.1¢
Dividend payout ratio (%) 72% 55% 55% 56% 58%
Total KMP incentives as a percentage of underlying/adjusted EBITDA for the year (%) 1.6% 1.6% 1.2% 1.2% 3.6%
7. Employment conditions
Service agreements
The terms of employment for the Managing Director and the other key management personnel are formalised in service agreements. Each of these agreements provide for participation, when eligible, in Qube’s STI and LTI plans. Other key provisions of the agreements relating to remuneration are set out below.
The service agreements for the Chief Operating Officer (former MD Logistics Division), Chief Financial Officer and General Counsel may be terminated by either party with 6 months’ notice subject to termination payments as detailed below. The service agreement for the Managing Director provide for 6 months’ by the executive and 12 months’ notice by the Company.
The new MD of the Logistics division will now report to the Chief Operating Officer and as such will not be considered a KMP.
On 30 June 2016, Mr Smithwick retired from full time employment with Qube, and thereby ceased to be a KMP from that date. Mr Smithwick has entered into a consultancy agreement with Qube to continue to provide certain services for a period of up to two years. His role was not replaced given the new Chief Operating Officer.
Name Term of agreement Fixed remuneration including superannuation* Termination benefit **
Maurice James, Managing Director On-going commencing 1 September 2011
$800,000 per annum 12 months base salary
Paul Digney, Chief Operating Officer/ former Managing Director Logistics Division
On-going commencing 1 September 2011
$495,000 per annum 6 months base salary
William Hara, Company Secretary and General Counsel and Director Strategic Assets Division
On-going commencing 21 January 2013
$412,000 per annum*** 6 months base salary
Paul Lewis, Chief Financial Officer On-going commencing 1 September 2011
$412,000 per annum*** 6 months base salary
* Base salaries quoted are for FY16; they are reviewed annually by the Committee.
** Termination benefits are payable on early termination by the Company, other than for gross misconduct; unless otherwise indicated, they are equal to the base as at the date of termination.
*** Excludes non-monetary benefits.

Qube Holdings Limited Directors’ Report
Remuneration Report for the year ended 30 June 2016
(continued)
~ 24 ~
8. Non-executive directors
On appointment to the Board, all non-executive directors enter into a service agreement with the Company in the form of a letter of appointment. The letter summarises the Board policies and terms, including compensation, relevant to the office of director.
To maintain their independence and impartiality, non-executive directors’ rewards do not have any at-risk components. Fees and payments to non-executive directors reflect the demands which are made on, and the responsibilities of, the directors. Non-executive directors' fees and payments are reviewed annually by the Committee.
Directors' fees
Non-executive director fees comprise a base fee plus additional fees for directors who chair, or are a member of, a committee.
Non-executive directors' fees are determined within an aggregate directors' fee pool limit, which is periodically recommended for approval by shareholders. At the 2012 AGM, shareholders approved the fee pool of $1,200,000 per annum.
The allocation of fees for FY16 based on responsibility per non-executive director are as follows:
Board Committee Fees
Board Fees Audit and Risk Management
Safety, Health and Environment
Nomination and Remuneration
Name
Chair
$
Deputy Chair
$
Base Director
$
Chair
$
Member
$
Chair
$
Member
$
Chair
$
Member
$
Total
$
Chris Corrigan
203,500 - - - - - - -
1,736
205,236
Sam Kaplan -
154,000 -
35,000 - - -
10,069 -
199,069
Ross Burney - -
93,500 -
17,500 - - - -
111,000
Allan Davies - -
93,500 -
7,049
25,000 -
14,931
1,632
142,112
Peter Dexter - -
93,500 - - -
12,500 -
7,465
113,465
Robert Dove - -
93,500 - - - - -
12,500
106,000
Alan Miles - -
93,500 -
10,451 -
12,500 - -
116,451
Åge Holm - - - - - - - - - -
Simon Moore - - - - - - - - - -
203,500
154,000
467,500
35,000
35,000
25,000
25,000
25,000
23,333
993,333
Retirement allowances for non-executive directors
Where appropriate, superannuation contributions required under the Australian Superannuation Guarantee Legislation are included in the directors' overall fee entitlements.

Qube Holdings Limited Directors’ Report
Remuneration Report for the year ended 30 June 2016
(continued)
~ 25 ~
8. Non-executive directors (continued)
Total amounts of remuneration for non-executive directors
Details of remuneration for each non-executive director and the figures for the corresponding period are set out in the table below:
Primary Post-employment
benefits
Name
Cash salary and fees
Non- monetary benefits Superannuation
Total
Remuneration
$ $ $ $
Non-executive Directors
Christopher Corrigan
2016
2015
152,727
162,557
38,000
38,000
14,509
15,443
205,236
216,000
Sam Kaplan
2016
2015
181,799
195,434
-
-
17,270
18,566
199,069
214,000
Ross Burney
2016
2015
101,370
101,370
-
-
9,630
9,630
111,000
111,000
Allan Davies
2016
2015
129,782
124,201
-
-
12,330
11,799
142,112
136,000
Peter Dexter
2016
2015
103,621
96,804
-
-
9,844
9,196
113,465
106,000
Robert Dove
2016
2015
106,000
106,000
-
-
-
-
106,000
106,000
Alan Miles
2016
2015
106,348
96,804
-
-
10,103
9,196
116,451
106,000
Åge Holm
2016
2015
-
-
-
-
-
-
-
-
Simon Moore
2016
2015
-
-
-
-
-
-
-
-

Qube Holdings Limited Directors’ Report
Remuneration Report for the year ended 30 June 2016
(continued)
~ 26 ~
9. Director’s interests
The relevant interests of each director in the shares of the Company during the financial year as notified to the ASX are as follows:
Name
Opening balance
as at 1 July 2015
Held at time of
becoming a director
Dividend reinvestment Disposed
Other changes
Balance as at 30 June 2016
Balance as at date of this
report
Christopher Corrigan
6,000,000 - - - - 6,000,000 6,000,000
Sam Kaplan 9,664,916 - - (3,500,000) 1,900,000 8,064,916* 8,064,916*
Maurice James 5,477,931 - - - 1,414,089 6,892,020 6,892,020
Ross Burney - - - - - - -
Allan Davies 2,609,947 - - (1,140,408) 1,733,578 3,203,117 3,203,117
Peter Dexter 186,793 - - - 6,755 193,548 193,548
Robert Dove - - - - - - -
Alan Miles 5,600 - - - - 5,600 -
Åge Holm - - - - - - -
Simon Moore 100,000 - - - - 100,000 100,000
This includes shares held in the name of spouse, superannuation fund, nominee and/or other controlled entities and deemed relevant interests.
* Includes shares in which Mr Kaplan has only deemed relevant interest under the Corporations Act from which Mr Kaplan may receive no economic benefit.
To ensure independence and impartiality is maintained, non-executive directors are not eligible to participate in any of the Group’s incentive arrangements including equity grants.
The Company has not issued any options to directors other than to the Managing Director.

Qube Holdings Limited Directors’ Report
Remuneration Report for the year ended 30 June 2016
(continued)
~ 27 ~
10. Statutory remuneration disclosures
Total amounts of remuneration
Details of the remuneration of key management personnel of the Group is set out in the following table:
Short-term employee benefits
Post- employment
benefits
Long- term
benefits Equity-based payments
Name
Cash salary
and fees
Bonus (cash and
shares)*
Moore-bank
STI
Non- monetary
benefits Super-
annuation
Long service
leave
LTI
Standard
LTI
Moorebank Legacy
schemes Total
$ $ $ $ $ $ $ $ $ $
Executive Directors
Maurice James
2016
2015
776,480
776,480
450,000
593,750
150,000
450,000
-
-
23,520
23,520
98,466
-
789,536
593,893
147,737
-
-
-
2,435,739
2,437,643
Other key management
personnel
Paul Digney
2016
2015
465,000
465,000
258,750
250,000
-
-
-
-
30,000
30,000
17,271
10,165
298,069
215,223
93,567
-
-
205,172
1,162,657
1,175,560
William Hara
2016
2015
392,692
393,217
221,250
275,000
77,500
232,500
3,975
3,411
19,308
18,783
-
-
258,409
195,646
147,737
-
-
-
1,120,871
1,118,557
Paul Lewis
2016
2015
382,000
382,000
218,750
275,000
35,000
105,000
3,975
3,411
30,000
30,000
31,597
9,881
250,590
177,764
94,595
-
-
-
1,046,507
983,056
Don Smithwick**
2016
2015
622,000
622,000
93,750
386,250
-
-
6,139
3,183
-
-
-
-
276,293
260,407
-
-
-
115,359
998,182
1,387,199
* Bonus represents 25% of the FY15 STI, plus 75% of the approved FY16 STI; the remaining 25% of the FY16 STI will be recognised in FY17 subject to certain conditions being met.
** Don Smithwick retired as Managing Director of the Ports & Bulk division effective 30 June 2016.
Of the cash bonuses to KMP, 50% are to be paid in September in the financial year immediately following the financial year to which the bonus relates. The remaining 50% is deferred for one year.
For shares issued under the 2013 ELTIP, or payments made under the legacy scheme included in the table above, the percentage of the available bonus or grant that was paid, or that vested, in FY16 is set out in the following pages.

Qube Holdings Limited Directors’ Report
Remuneration Report for the year ended 30 June 2016
(continued)
10. Statutory remuneration disclosures (continued)
~ 28 ~
Equity settled compensation
STI bonuses and rights to equity settled compensation
In FY16 Qube offered eligible senior executives the option to elect to take all or any portion of their FY16 STI payment in Qube shares. Eligible senior executives were required to make this election shortly after the offer was made.
To determine the maximum number of STI share rights to be granted under the STI to eligible senior executives, the maximum value of the STI, subject to the election, was divided by $2.244, being the volume weighted average price of Qube shares calculated over the 20 trading days prior to the final election date.
At the end of the financial year the actual STI to be awarded to the executive is calculated as a percentage of the maximum STI grant. Of the total STI share rights awarded 50% are subject to a service condition and the allocation is deferred until 12 months after the amount of the STI is determined.
Under the terms of the plan the eligible senior executives are also entitled to receive an amount equal to any dividends accrued on the vested shares over the period from election date to vesting date.
The value of the STI actually received by the eligible senior executives is therefore dependent on the Qube share price plus any dividends that have accrued on the shares over the period.
The information in the table below for the percentage of the FY16 STI forfeited includes the FY16 STI that was voluntarily foregone by the KMP as outlined in section 5.
Name Year
granted
Total STI opportunity
($) Forfeited
%
Value of STI award
($)
Expensed during the
year ($)*
Award vested
%
Value yet to vest
($)
Executive Directors
Maurice James 2016 800,000 50% 400,000 600,000 50% 200,000
2015 1,400,000 14% 1,200,000 900,000 50% 600,000
Other key management personnel
Paul Digney 2016 396,000 36% 255,000 258,750 50% 127,500
2015 396,000 32% 270,000 202,500 50% 135,000
William Hara 2016 330,000 38% 205,000 298,750 50% 102,500
2015 639,000 9% 580,000 435,000 50% 290,000
Paul Lewis 2016 330,000 39% 200,000 253,750 50% 100,000
2015 470,000 12% 415,000 311,250 50% 207,500
Don Smithwick 2016 800,000 100% - 93,750 - -
2015 498,000 25% 375,000 281,250 50% 187,500
* Comprises 75% of current year and 25% of prior year STI award.

Qube Holdings Limited Directors’ Report
Remuneration Report for the year ended 30 June 2016
(continued)
10. Statutory remuneration disclosures (continued)
~ 29 ~
Equity settled compensation (continued)
STI bonuses and rights to equity settled compensation (continued)
Details of STI share rights provided as remuneration to Qube directors and KMP are set out below.
Name
Financial years in which rights
may vest
STI award taken as
rights %
Value per right
($)
Total no. of rights taken
as STI award
No. of rights vested during
the year
Amount expensed during the
year ($)
Executive Directors
Maurice James FY16 - FY17 100% 2.2442 181,080 225,087 460,710
FY15 - FY16 54% 2.3889 269,095 134,551 482,130
Other key management personnel
Paul Digney FY16 - FY17 100% 2.2442 115,438 57,719 191,250
FY15 - FY16 - - - - -
William Hara FY16 - FY17 100% 2.2442 92,804 102,914 221,250
FY15 - FY16 52% 2.3889 113,023 56,511 202,500
Paul Lewis FY16 - FY17 50% 2.2442 45,270 80,193 143,750
FY15 - FY16 70% 2.3889 115,116 57,558 206,250
Don Smithwick FY16 - FY17 - - - - -
FY15 - FY16 - - - - -
Notes:
1. Figures exclude entitlement relating to dividends earned on shares over the vesting period.
2. Vesting of rights shown above are based on the anticipated position at the 3 September 2016 vesting date which is consistent with the STI accrual in the financial statements.
3. Comprises 50% of current year and 50% of prior year STI award.
4. Adjusted for the impact of the entitlement offer.

Qube Holdings Limited Directors’ Report
Remuneration Report for the year ended 30 June 2016
(continued)
10. Statutory remuneration disclosures (continued)
~ 30 ~
Equity settled compensation (continued)
LTI Plans – Performance Rights and Options
During FY16 Qube made a grant of Performance Rights and Options to eligible senior executives. The terms and conditions of the FY16 grant of Performance Rights and Options affecting remuneration in the current or a future reporting periods are as follows:
Grant date Vesting date Expiry date** Issue price
Value per right/option at grant date
Target hurdle for 100% vesting*
Performance achieved
% Vested
FY16 LTI Performance Rights (PR) and Options issue
TSR hurdle – 25% of issue
3 Sept 2015 3 Sept 2018 3 Sept 2018
3 Sept 2022
$2.244 $1.156 – PR
$0.298 - Option
TSR ranking at or above the 75th percentile at the end of the vesting period.
- -
EPS hurdle – 75% of issue
3 Sept 2015 3 Sept 2018 3 Sept 2020
3 Sept 2022
$2.244 $2.069– PR
$0.369- Option
Compound Annual Growth Rate (CAGR) over the vesting period in EPS of 6%.
- -
FY16 Moorebank Performance Rights and Options issue
ASR hurdle – 50% of issue
3 Sept 2015 3 Sept 2018 3 Sept 2020
3 Sept 2022
$2.244 $1.073 – PR
$0.333 - Option
Qube achieving a cumulative 4.5% compound ASR over the vesting period.
- -
KPI hurdle – 50% of issue
3 Sept 2015 3 Sept 2018 3 Sept 2020
2 Sept 2022
$2.244 $2.069 – PR
$0.369 - Option
Exceed overall Moorebank Project targets.
- -
* For the EPS hurdle it is for the financial year ended 30 June.
** Last possible vesting date.
The assessed fair value at the date the Performance Rights and Options were granted to the individual is allocated over the period from grant date to the vesting date, and the amount is included in the remuneration tables above. Fair values at grant date are independently determined in accordance with AASB 2 Share-based Payment and are as follows:
TSR & ASR Performance Rights and Options & EPS Performance Rights
For the TSR & ASR Performance Rights and Options & EPS Performance Rights a Monte Carlo simulation based model has been used to test the likelihood of attaining the relevant hurdle against the comparator group of entities (that is the constituents of the S&P ASX 200 Index). The Monte Carlo simulation model incorporates the impact of this market condition on the value of the relevant Performance Right or Option.
EPS Options & KPI Performance Rights and Options
For the EPS Options & KPI Performance Rights and Options the Black-Scholes-Merton model has been used to estimate the value at the valuation date. Consistent with the requirements of AASB 2, the development or application of an estimate indicating the likelihood of achieving the EPS and KPI Hurdle has not been included in the Black-Scholes-Merton calculation.

Qube Holdings Limited Directors’ Report
Remuneration Report for the year ended 30 June 2016
(continued)
10. Statutory remuneration disclosures (continued)
~ 31 ~
Equity settled compensation (continued)
Details of each type of equity settled compensation provided as remuneration under the various LTI plans to Qube directors and KMP is set out below:
Name
Financial year
granted LTI Plan Total LTIs granted
Total value of grant
($) Value per right
($)
No. of LTIs vested
during year
Executive Directors
Maurice James 2016*** Performance Rights & Options 2,178,406 691,690 PR - 1.308 O - 0.254 -
2016*** Performance Rights & Options (M)** 1,633,803 537,449 PR - 1.181 O - 0.274 -
2015*** Performance Rights 637,920 1,182,500 1.8537 -
2014*** Performance Rights 394,733 569,283 1.4422 -
2014 ELTIP 2,000,000 427,333 0.2137 333,334
2012 ELTIP 2,000,000 437,667 0.2188 -
8,844,862 3,845,922
333,334
Other key management personnel
Paul Digney 2016*** Performance Rights & Options 816,903 259,384 PR - 1.308 O - 0.254 -
2016*** Performance Rights & Options (M)** 1,034,743 340,385 PR - 1.181 O - 0.274 -
2015*** Performance Rights 216,892 402,049 1.8537 -
2014*** Performance Rights 195,197 281,513 1.4422 -
2013 ELTIP 500,000 118,250 0.2365 83,334
2012 Shadow Equity 444,444 600,000 1.3500 -
3,208,179 2,001,581
83,334
William Hara 2016*** Performance Rights & Options 780,595 247,855 PR - 1.308 O - 0.254 -
2016*** Performance Rights & Options (M)** 1,633,803 537,449 PR - 1.181 O - 0.274 -
2015*** Performance Rights 182,870 338,983 1.8537 -
2014*** Performance Rights 162,664 234,595 1.4422 -
2013 ELTIP 1,000,000 236,500 0.2365 166,666
3,759,932 1,595,382
166,666
Paul Lewis 2016*** Performance Rights & Options 780,595 247,855 PR - 1.308 O - 0.254 -
2016*** Performance Rights & Options (M)** 816,675 344,128 PR - 1.181 O - 0.274 -
2015*** Performance Rights 174,364 323,216 1.8537 -
2014*** Performance Rights 157,243 226,775 1.4422 -
2013 ELTIP 500,000 118,250 0.2365 83,334
2012 ELTIP 500,000 109,417 0.2188 -
2,928,877 1,369,641
83,334
Don Smithwick 2015*** Performance Rights 255,169 473,001 1.8537 -
2014*** Performance Rights 249,420 359,712 1.4422 -
2013 ELTIP 500,000 118,250 0.2365 83,334
2012 Shadow Equity 150,704 203,450 1.3500 -
1,155,293 1,154,413
83,334

Qube Holdings Limited Directors’ Report
Remuneration Report for the year ended 30 June 2016
(continued)
10. Statutory remuneration disclosures (continued)
~ 32 ~
Equity settled compensation (continued)
Name Financial
year granted Vested
(%) Vested number
Forfeited (%)
Financial years in
which rights may vest*
Value yet to vest ($)
Amount expensed
during the year ($)
Executive Directors
Maurice James 2016 0% - 0% FY19-FY21 691,690 190,136
2016 0% - 0% FY19-FY21 537,449 147,737
2015 0% - 0% FY18-FY20 1,182,500 390,972
2014 0% - 0% FY17–FY19 569,283 189,761
2014 100% 2,000,000 0% FY13-FY16 - 18,667
2012 100% 2,000,000 0% FY12-FY15 - -
4,000,000
2,980,922 937,273
Other key management personnel
Paul Digney 2016 0% - 0% FY19-FY21 259,384 71,301
2016 0% - 0% FY19-FY21 340,385 93,567
2015 0% - 0% FY18-FY20 402,049 132,930
2014 0% - 0% FY17–FY19 281,513 93,838
2013 100% 500,000 0% FY13-FY16 - -
2012 100% 444,444 0% FY13-FY16 - -
944,444
1,283,331 391,636
William Hara 2016 0% - 0% FY19-FY21 247,855 68,132
2016 0% - 0% FY19-FY21 537,449 147,737
2015 0% - 0% FY18-FY20 338,983 112,079
2014 0% - 0% FY17–FY19 234,595 78,198
2013 100% 1,000,000 0% FY13-FY16 - -
1,000,000
1,358,882 406,146
Paul Lewis 2016 0% - 0% FY19-FY21 247,855 68,132
2016 0% - 0% FY19-FY21 344,128 94,595
2015 0% - 0% FY18-FY20 323,216 106,866
2014 0% - 0% FY17–FY19 226,775 75,592
2013 100% 500,000 0% FY13-FY16 - -
2012 100% 500,000 0% FY12-FY15 - -
1,000,000
1,141,974 345,185
Don Smithwick 2015 0% - 0% FY18-FY20 473,001 156,389
2014 0% - 0% FY17–FY19 359,712 119,904
2013 100% 500,000 0% FY13-FY16 - -
2012 100% 150,704 0% FY13-FY17 - -
650,704
832,713 276,293
* Rights and Options with EPS and ASR hurdle are able to be retested for two years post vesting date.
** Relates to the Moorebank Project Long Term Incentive Plan.
*** Adjusted for entitlement offer.

Qube Holdings Limited Directors’ Report
Remuneration Report for the year ended 30 June 2016
(continued)
10. Statutory remuneration disclosures (continued)
~ 33 ~
Equity instruments held by key management personnel
The tables below and on the following pages show the number of:
(a) options and rights over ordinary shares in the Company, and
(b) shares in the Company
that were held during the financial year by key management personnel of the Group, including their close family members and entities related to them.
(a) Options and rights
Options
2016
Name
Balance at the
start of the year
Granted as compensation
(Standard)
LTI
Granted as compensation
(Moorebank) LTI Lapsed Exercised
Other changes*
Balance at the end of the year Unvested
Maurice James - 2,036,199 1,527,149 - - - 3,563,348 3,563,348
Paul Digney - 763,575 967,195 - - - 1,730,770 1,730,770
William Hara - 729,638 1,527,149 - - - 2,256,787 2,256,787
Paul Lewis - 729,638 678,733 - - - 1,408,371 1,408,371
Don Smithwick** - - - - - - - -
Rights
2016
Name
Balance at the
start of the year
Granted as compensation
(Standard)
STI
Granted as compensation
(Standard)
LTI
Granted as compensation
(Moorebank) LTI Lapsed Exercised
Other changes*
Balance at the end
of the year Unvested
Maurice James 1,285,535 178,238 133,678 100,258 - (134,551) 33,988 1,597,146 1,597,146
Paul Digney 405,620 113,626 50,129 63,497 - - 15,531 648,403 648,403
William Hara 453,133 91,346 47,901 100,258 - (56,511) 16,333 652,460 652,460
Paul Lewis 441,517 44,560 47,901 133,678 - (57,558) 13,237 623,335 623,335
Don Smithwick** 653,642 - - - - (156,976) (496,666) - -
* Includes adjustment for entitlement offer. ** Don Smithwick retired as Managing Director of the Ports & Bulk division effective 30 June 2016.
All vested options are exercisable at the end of the year.
(b) Ordinary share holdings
2016
Name Balance at the
start of the year
Received during the year
as part of an LTI scheme
Other changes
during the year
Balance at the end of the year
Maurice James 5,477,931 - 1,414,089 6,892,020
Paul Digney 500,205 - (250,000) 250,205
William Hara 1,000,000 - 447,650 1,447,650
Paul Lewis 450,000 - - 450,000
Don Smithwick 1,941,803 - (1,941,803) *
* Don Smithwick retired as Managing Director of the Ports & Bulk division effective 30 June 2016.

Qube Holdings Limited Directors’ Report
Remuneration Report for the year ended 30 June 2016
(continued)
10. Statutory remuneration disclosures (continued)
~ 34 ~
Loans to key management personnel
Details of loans made to directors of Qube Holdings Limited and other key management personnel of the Group, including their personally related parties, are set out below.
(i) Key management personnel with loans above $100,000 during the financial year
2016
Name
Balance at the start of the
year
Loans granted
during the year
Loans repaid during the
year
Interest paid/payable
for the year Interest not
charged
Balance at the end of
the year
Highest indebtedness
during the year
$ $ $ $ $ $ $
Maurice James 5,804,600 - - 220,000 - 5,804,600 5,804,600
Paul Digney 756,750 - (756,750) 27,500 - - 756,750
William Hara 1,513,500 - - 55,000 - 1,513,500 1,513,500
Paul Lewis 681,075 - - 24,750 - 681,075 681,075
Don Smithwick 756,750 - - 27,500 - 756,750 756,750
Total* 9,512,675 - (756,750) (354,750) - 8,755,925
* Number of KMP in the group at the end of the year is 5 including Don Smithwick who ceased to be a KMP on 30 June 2016 when he retired.
ELTIP Loans
Interest rate: The loan bears interest in an amount equal to the dividend paid on Plan Shares acquired with that loan, excluding any dividend characterised as a special dividend by the Board. Interest is payable within 3 business days of the date of payment of each dividend.
Maturity date: No loan in relation to the Plan Shares is repayable until the earlier of: (a) 2 years after the final vesting date for the relevant ELTIP issue, (b) settlement of the sale of the ELTIP shares, and (c) 3 months after written notice by the Company to repay the loan (in respect of vested shares). The loan is a limited recourse loan with the amount to be repaid limited to the lesser of the principal advanced and the price realised on sale of the Plan Shares.
No write-downs or allowances for doubtful receivables have been recognised in relation to any loans made to key management personnel.
This concludes the Remuneration Report.

Qube Holdings Limited Directors’ Report
for the year ended 30 June 2016
(continued)
~ 35 ~
Loans to directors and executives
Information on loans to directors and executives, including amounts, interest rates and repayment terms are set out on page 34.
Insurance of officers
During the financial year, Qube Holdings Limited paid a premium to insure the directors and secretaries of the Company and its Australian-based controlled entities, and the general managers of each of the divisions of the Group against liabilities that are permitted to be covered by Section 199B of the Corporations Act 2001. It is a condition on the insurance contract that its limits of
indemnity, the nature of the liability and the amount of the premium not be disclosed.
Indemnity of auditors
The Company has not indemnified the auditor under certain circumstances as permitted in the Corporations Act 2001.
Proceedings on behalf of the Company
No person has applied to the Court under section 237 of the Corporations Act 2001 for leave to bring proceedings on behalf of the Company, or to intervene in any proceedings to which the Company is a party, for the purpose of taking responsibility on behalf of the Company for all or part of those proceedings.
No proceedings have been brought or intervened in on behalf of the Company with leave of the Court under section 237 of the Corporations Act 2001.
Non-audit services
The Company may decide to employ the auditor on assignments additional to their statutory audit duties where the auditor's expertise and experience with the Group are important.
Details of the amounts paid or payable to the auditor (PwC) for non-audit services provided during the year are set out below.
The board of directors has considered the position and, in accordance with advice received from the Audit and Risk Management Committee, is satisfied that the provision of the non-audit services is compatible with the general standard of independence for auditors imposed by the Corporations Act 2001. The directors are satisfied that the provision of non-audit services by the auditor, as set out below, did not compromise the auditor independence requirements of the Corporations Act 2001 for the following reasons:
● all non-audit services have been reviewed by the Audit and Risk Management Committee to ensure they do not impact the impartiality and objectivity of the auditor
● none of the services undermine the general principles relating to auditor independence as set out in APES 110 Code of Ethics for Professional Accountants.
During the year the following fees were paid or payable for non-audit services provided by the auditor of the Group, its related practices and non-related audit firms:
2016 2015
Non-audit services $’000 $’000
Taxation services
PwC Australian firm:
Tax compliance services 98.7 220.0
Tax consulting services 400.6 324.7
Total remuneration for taxation services 499.3 544.7
Other services
Due diligence services 2,301.6 -
Other services 174.8 130.0
Total remuneration for non-audit services 2,975.7 674.7


Auditor’s Independence Declaration
As lead auditor for the audit of Qube Holdings Limited for the year ended 30 June 2016, I declare that to the best of my knowledge and belief, there have been:
1. no contraventions of the auditor independence requirements of the Corporations Act 2001 in relation to the audit; and
2. no contraventions of any applicable code of professional conduct in relation to the audit.
This declaration is in respect of Qube Holdings Limited and the entities it controlled during the period.
N R McConnell Sydney Partner 23 August 2016 PricewaterhouseCoopers
PricewaterhouseCoopers, ABN 52 780 433 757 Darling Park Tower 2, 201 Sussex Street, GPO BOX 2650, SYDNEY NSW 1171 T: +61 2 8266 0000, F: +61 2 8266 9999, www.pwc.com.au
Liability limited by a scheme approved under Professional Standards Legislation.

Qube Holdings Limited Consolidated statement of comprehensive income
for the year ended 30 June 2016
~ 38 ~
Consolidated statement of comprehensive income
2016 2015
Notes $m $m
Revenue from continuing operations
Revenue from sales and services 3 1,264.8 1,393.4
Other income 3 67.7 65.9
1,332.5 1,459.3
Direct transport and logistics costs (332.9) (376.5)
Repairs and maintenance costs (85.4) (83.0)
Employee benefits expense 4 (499.3) (506.9)
Fuel, oil and electricity costs (75.7) (106.1)
Occupancy and property costs (62.8) (66.2)
Depreciation and amortisation expense 4 (101.5) (103.5)
Professional fees (11.1) (10.8)
Impairment of non-current assets 4 (21.3) (44.9)
Reversal of impairment of non-current assets 4 17.6 -
Other expenses (12.5) (19.1)
Total expenses (1,184.9) (1,317.0)
Finance income 1.5 1.8
Finance costs 4 (33.6) (27.0)
Net finance costs (32.1) (25.2)
Share of net profit of associates accounted for using the equity method 12.6 10.4
Profit before income tax 128.1 127.5
Income tax expense 12 (35.6) (31.6)
Profit for the year 92.5 95.9
Other comprehensive income net of tax:
Exchange differences on translation of foreign operations 17(a) 4.1 (4.0)
Revaluation of available-for-sale financial assets 17(a) 7.0 -
Total comprehensive income for the year 103.6 91.9
Profit for the year is attributable to:
Owners of Qube Holdings Limited 82.0 85.9
Non-controlling interests 10.5 10.0
92.5 95.9
Total comprehensive income for the year is attributable to:
Owners of Qube Holdings Limited 93.1 81.9
Non-controlling interests 10.5 10.0
103.6 91.9
Earnings per share for profit attributable to the ordinary equity holders of the Company: Cents Cents
Basic earnings per share 5 7.3 8.1*
Diluted earnings per share 5 7.2 8.0*
* The comparative information has been restated to include the dilutive impact of the bonus element of the entitlement offer.
The above consolidated statement of comprehensive income should be read in conjunction with the accompanying notes.

Qube Holdings Limited Consolidated balance sheet
as at 30 June 2016
~ 39 ~
Consolidated balance sheet
2016 2015
Notes $m $m
ASSETS
Current assets
Cash and cash equivalents 19(a) 76.6 88.2
Trade and other receivables 6 203.7 221.1
Inventories 2.4 2.2
Current tax receivable 2.5 -
Available-for-sale financial assets 28 543.7 -
Total current assets 828.9 311.5
Non-current assets
Financial assets at fair value through profit or loss 1.0 1.0
Investments in associates 22 225.8 216.9
Property, plant and equipment 7 828.3 789.3
Investment properties 8 367.7 342.0
Intangible assets 9 630.7 635.3
Deferred tax assets 13 - 5.6
Other assets 9.2 0.8
Total non-current assets 2,062.7 1,990.9
Total assets 2,891.6 2,302.4
LIABILITIES
Current liabilities
Trade and other payables 10 100.1 115.3
Borrowings 18 159.4 12.3
Derivative financial instruments 28 0.7 0.8
Current tax payable - 6.3
Provisions 11 65.0 67.1
Total current liabilities 325.2 201.8
Non-current liabilities
Trade and other payables 10 2.2 5.5
Borrowings 18 513.6 589.7
Deferred tax liabilities 14 1.5 -
Derivative financial instruments 28 2.5 2.3
Provisions 11 9.3 14.8
Total non-current liabilities 529.1 612.3
Total liabilities 854.3 814.1
Net assets 2,037.3 1,488.3
EQUITY
Contributed equity 16 1,782.2 1,284.7
Reserves 17 (9.6) (28.7)
Retained earnings 17 166.5 141.5
Capital and reserves attributable to owners of Qube 1,939.1 1,397.5
Non-controlling interests 24 98.2 90.8
Total equity 2,037.3 1,488.3
The above consolidated balance sheet should be read in conjunction with the accompanying notes.

Qube Holdings Limited Consolidated statement of changes in equity
for the year ended 30 June 2016
~ 40 ~
Consolidated statement of changes in equity
Attributable to owners of Qube
Contributed
equity Reserves Retained earnings Total
Non-con- trolling
interests Total
equity
Notes $m $m $m $m $m $m
Balance at 30 June 2014 1,281.3 (30.9) 111.3 1,361.7 83.6 1,445.3
Profit for the year - - 85.9 85.9 10.0 95.9
Other comprehensive income - (4.0) - (4.0) - (4.0)
Total comprehensive income for the year - (4.0) 85.9 81.9 10.0 91.9
Transactions with owners in their capacity as owners:
Contributions of equity, net of transaction costs and tax 16(a) 14.6 - - 14.6 1.0 15.6
Acquisition of treasury shares 16(b) (11.2) - - (11.2) - (11.2)
Transactions with non-controlling interests - - - - (3.8) (3.8)
Dividends provided for or paid - - (55.7) (55.7) - (55.7)
Employee share scheme 17(a) - 6.2 - 6.2 - 6.2
3.4 6.2 (55.7) (46.1) (2.8) (48.9)
Balance at 30 June 2015 1,284.7 (28.7) 141.5 1,397.5 90.8 1,488.3
Profit for the year - - 82.0 82.0 10.5 92.5
Other comprehensive income - 11.1 - 11.1 - 11.1
Total comprehensive income for the year - 11.1 82.0 93.1 10.5 103.6
Transactions with owners in their capacity as owners:
Contributions of equity, net of transaction costs and tax 16(a) 499.6 - - 499.6 4.0 503.6
Acquisition of treasury shares, less shares transferred 16(b) (2.1) - - (2.1) - (2.1)
Transactions with non-controlling interests - - - - (7.1) (7.1)
Dividends provided for or paid - - (57.0) (57.0) - (57.0)
Employee share scheme 17(a) - 8.0 - 8.0 - 8.0
497.5 8.0 (57.0) 448.5 (3.1) 445.4
Balance at 30 June 2016 1,782.2 (9.6) 166.5 1,939.1 98.2 2,037.3
The above consolidated statement of changes in equity should be read in conjunction with the accompanying notes.

Qube Holdings Limited Consolidated statement of cashflows
for the year ended 30 June 2016
~ 41 ~
Consolidated statement of cash flows
2016 2015
Notes $m $m
Cash flows from operating activities
Receipts from customers (inclusive of goods and services tax) 1,467.8 1,575.2
Payments to suppliers and employees (inclusive of goods and services tax) (1,231.9) (1,336.3)
235.9 238.9
Dividends and distributions received 12.8 8.4
Interest received 1.5 1.7
Other revenue 0.2 1.9
Interest paid (33.5) (28.3)
Income taxes paid (34.6) (53.0)
Net cash inflow from operating activities 29(a) 182.3 169.6
Cash flows from investing activities
Payment for acquisition of businesses, net of cash acquired (14.8) (109.3)
Payments for property, plant and equipment (107.3) (199.6)
Payments for investment property development expenditure 8 (14.7) (6.1)
Payments for additional investment in associates (26.2) (20.4)
Payments for investment securities (541.6) -
Payments for settlement of contingent consideration (3.4) -
Loans to related entities - (1.7)
Loan repayments from related entities 5.0 2.5
Proceeds from sale of property, plant and equipment 9.1 5.6
Net cash outflow from investing activities (693.9) (329.0)
Cash flows from financing activities
Proceeds from issues of shares 16(a) 494.2 -
Proceeds from the issue of units to non-controlling interests 4.0 1.0
Share issue transaction costs (9.6) -
Payments for treasury shares 16(b) (3.2) (11.2)
Proceeds from borrowings 1,116.5 729.8
Repayment of borrowings (1,032.5) (520.9)
Finance lease payments (15.3) (15.0)
Dividends paid to Company's shareholders (44.8) (41.1)
Distributions paid to non-controlling interests (9.7) (5.7)
Net cash inflow from financing activities 499.6 136.9
Net decrease in cash and cash equivalents (12.0) (22.5)
Cash and cash equivalents at the beginning of the financial year 88.2 111.6
Effects of exchange rate changes on cash and cash equivalents 0.4 (0.9)
Cash and cash equivalents at end of year 76.6 88.2
Non-cash investing and financing activities 29(b) 12.3 14.6
The above consolidated statement of cash flows should be read in conjunction with the accompanying notes.

Qube Holdings Limited Notes to the consolidated financial statements
for the year ended 30 June 2016
~ 42 ~
Notes to the consolidated financial statements
Page
1. About this report 43
FINANCIAL RESULTS FOR THE YEAR
2. Segment information 45 3. Revenue and Other income 48 4. Expenses 49 5. Earnings per share 51
OPERATING ASSETS AND LIABILITIES
6. Trade and other receivables 52 7. Property, plant and equipment 54 8. Investment properties 56 9. Intangible assets 57 10. Trade and other payables 59 11. Provisions 60
INCOME TAXES
12. Income tax expense 61 13. Deferred tax assets 62 14. Deferred tax liabilities 62
CAPITAL AND BORROWINGS
15. Dividends 65 16. Contributed equity 66 17. Reserves and retained earnings 68 18. Borrowings 69
RISK MANAGEMENT
19. Financial risk management 71 20. Fair value measurement 74
GROUP STRUCTURE
21. Business combinations 78 22. Investments in associates 78 23. Significant investments in subsidiaries 82 24. Non-controlling interests 85
UNRECOGNISED ITEMS
25. Contingencies 86 26. Commitments 86 27. Events occurring after the reporting period 88
OTHER NOTES
28. Financial assets and liabilities 89 29. Reconciliation of profit after income tax to net cash inflow from operating activities 90 30. Remuneration of auditors 91 31. Related party transactions 92 32. Key management personnel disclosures 93 33. Share-based payments 95 34. Deed of cross guarantee 100 35. Parent entity financial information 102 36. Summary of other accounting policies 103
Qube Holdings Limited Notes to the consolidated financial statements
for the year ended 30 June 2016
(continued)
~ 43 ~
1. About this report
Qube Holdings Limited is a for-profit company limited by shares incorporated and domiciled in Australia whose shares are publicly traded on the Australian Securities Exchange. The consolidated financial statements, comprising the Company, Qube Holdings Limited (referred to as the ‘Company’ or ‘parent entity’) and its subsidiaries (collectively referred to as the ‘Group’ or ‘Qube’), for the year ended 30 June 2016 were authorised for issue in accordance with a resolution of the directors on 23 August 2016. The directors have the power to amend and reissue the financial statements.
The consolidated financial statements are general purpose financial statements which:
● have been prepared in accordance with the requirements of the Corporations Act 2001, Australian Accounting Standards and other authoritative pronouncements of the Australian Accounting Standards Board (AASB) and International Financial Reporting Standards (IFRS) as issued by the International Accounting Standards Board (IASB);
● have been prepared under the historical cost convention, as modified by the revaluation of financial assets and liabilities (including derivative instruments) at fair value through profit or loss and investment property;
● are presented in Australian dollars, which is Qube’s functional and presentation currency, with all amounts rounded to the nearest hundred thousand dollars, unless otherwise indicated, in accordance with ASIC Corporations Instrument 2016/191;
● adopts all new and amended Accounting Standards and interpretations issued by the AASB that are relevant to the Group and effective for reporting periods beginning on or before 1 July 2015. Refer to note 36(d) for further details; and
● equity accounts for associates listed at note 22.
The notes to the consolidated financial statements
The notes include information which is required to understand the financial statements and is material and relevant to the operations, financial position and performance of the Group. Information is considered material and relevant if, for example:
● the amount in question is significant because of its size or nature;
● it is important for understanding the results of the Group;
● it helps to explain the impact of significant changes in the Group’s business;
● it relates to an aspect of the Group’s operations that is important to its future performance.
In preparing these consolidated financial statements the Group has changed the layout and order of the notes to make them more relevant and easily understandable to shareholders. The notes have been grouped under the following sections and where relevant, include the accounting policies applied in producing these notes together with any critical judgements and estimates used:
● Financial results for the year: segment information, revenue & other income, expenses and earnings per share;
● Operating assets and liabilities: key balance sheet items;
● Income taxes: income tax expense and deferred tax balances;
● Capital and borrowings: shareholder returns, equity and reserves and debt funding of the Group;
● Risk management: the Group’s exposure to various financial risks, their effect on the Group and how they are managed;
● Group structure: business combinations, investments in associates and details of subsidiaries;
● Unrecognised items: items that that are not recognised in the financial statements but could potentially have a significant impact on the Group’s financial position and performance; and
● Other notes: items requiring disclosure to comply with Australian Accounting Standards and other regulatory pronouncements but are not considered critical in understanding the financial performance or position of the Group.
Critical accounting judgements and estimates
The preparation of financial statements requires the use of certain critical accounting estimates and also requires management to exercise its judgement in the process of applying the Group's accounting policies. These judgements and estimates are continually evaluated and are based on historical experience and other factors, including expectations of future events that may have a financial impact on the entity and that are believed to be reasonable under the circumstances. The resulting accounting estimates will, by definition, seldom equal the related actual results.
The areas involving a higher degree of judgement or complexity, or areas where assumptions and estimates are significant to the financial statements include impairment of goodwill, deferred income tax, fair value of investment properties, impairment of equity accounted investments and impairment of property, plant and equipment, and are disclosed separately in the relevant notes.

Qube Holdings Limited Notes to the consolidated financial statements
for the year ended 30 June 2016
(continued)
~ 44 ~
FINANCIAL RESULTS FOR THE YEAR
This section provides information on the financial results of the Group, including the performance at a segmental level, disclosures relevant to income and expenditure and earnings per share, along with the relevant accounting policies applied. Note Page
2. Segment information 45 3. Revenue and Other income 48 4. Expenses 49 5. Earnings per share 51

Qube Holdings Limited Notes to the consolidated financial statements
for the year ended 30 June 2016
(continued)
~ 45 ~
2. Segment information
Qube’s Board assesses the performance of the operating segments on a measure of underlying revenue, EBITDA and EBITA, which excludes certain non-cash and non-recurring items from the statutory results to reflect core earnings. This reflects the way the operating businesses are managed and assessed from a profit and loss perspective by the chief operating decision maker.
(a) Description of segments
Management has determined the operating segments based on the reports used by the Board to make strategic decisions.
Logistics
The primary focus of the Logistics division is on providing a broad range of services relating to the import and export of containerised cargo. The services currently provided include the physical and documentary processes and tasks of the import/export supply chain such as road and rail transport of containers to and from ports, operation of full and empty container parks, customs and quarantine services, warehousing, intermodal terminals, international freight forwarding and bulk rail haulage for rural commodities. The business operates nationally with strategic locations near the ports in key capital cities.
Ports & Bulk
This division has two core activities comprising port and bulk logistics. It provides a range of logistics services relating to the import and export of mainly non-containerised freight, with a major focus on automotive, bulk and break bulk products.
Qube’s port logistics activities are focused on the provision of an integrated logistics solution for the automotive industry, covering a range of activities including facilities management, stevedoring, processing and delivery. This division also provides stevedoring and related logistics services for the oil and gas industry, forestry products and project and general cargo. Qube’s bulk logistics activities are aimed at offering customers a comprehensive logistics solution from mine-to-ship covering activities including transport, stockpile management, ship loading facilities and stevedoring. Qube handles a diverse range of commodities including iron ore, copper, nickel concentrate and mineral sands. The main operations are located in Western Australia and Queensland.
Strategic Assets
This division currently comprises Qube’s interest in the Moorebank Industrial Property Trust (MIPT) (66.7%), which owns an 83 hectare parcel of land at Moorebank; a strategically located property at Minto in Sydney’s south west; a 37.5% interest in the Quattro Grain joint venture and a 50% shareholding in TQ Holdings Pty Limited, a joint venture with Japanese petroleum group TonenGeneral Sekiyu K.K. (‘Tonen’) to develop fuel storage facilities in Australia.
MIPT’s Moorebank property will be developed as part of a broader precinct development involving both MIPT’s land and a larger parcel of land owned by the Commonwealth Government. Qube will manage the development and operations of the overall project. This development will include port-shuttle and interstate rail terminals as well as substantial warehousing development targeting tenants that will also benefit from efficient rail and logistics services. In August 2016, Qube reached agreement to acquire all of Aurizon’s interests in the Moorebank project for $98.9 million, giving Qube 100% ownership of the project. The Quattro Grain joint venture has now completed construction of a grain storage and handling facility at Port Kembla in New South Wales and commenced operations in late FY16. TQ Holdings Pty Limited’s first project is the construction of a fuel storage facility at Port Kembla on land to be leased from NSW Ports. Subject to final approval, the storage facility has a potential capacity of 230 million litres with commissioning expected in mid to late 2017. Corporate and Other
Corporate and Other is the only non-operating segment reported to the Board. The primary focus of the corporate head office is to provide strategic, commercial and treasury support to the divisions as well as to develop and manage new growth opportunities that do not fall within one of the existing divisions. It also includes managing a broad range of reporting, safety, health and environment, corporate governance and other functions of the Group.
Costs relating to certain development projects in the planning and analytical phase, including assets, revenues and expenses associated with Qube’s proposal to acquire a 50% interest in Patrick’s until completion, are also reported within this segment.
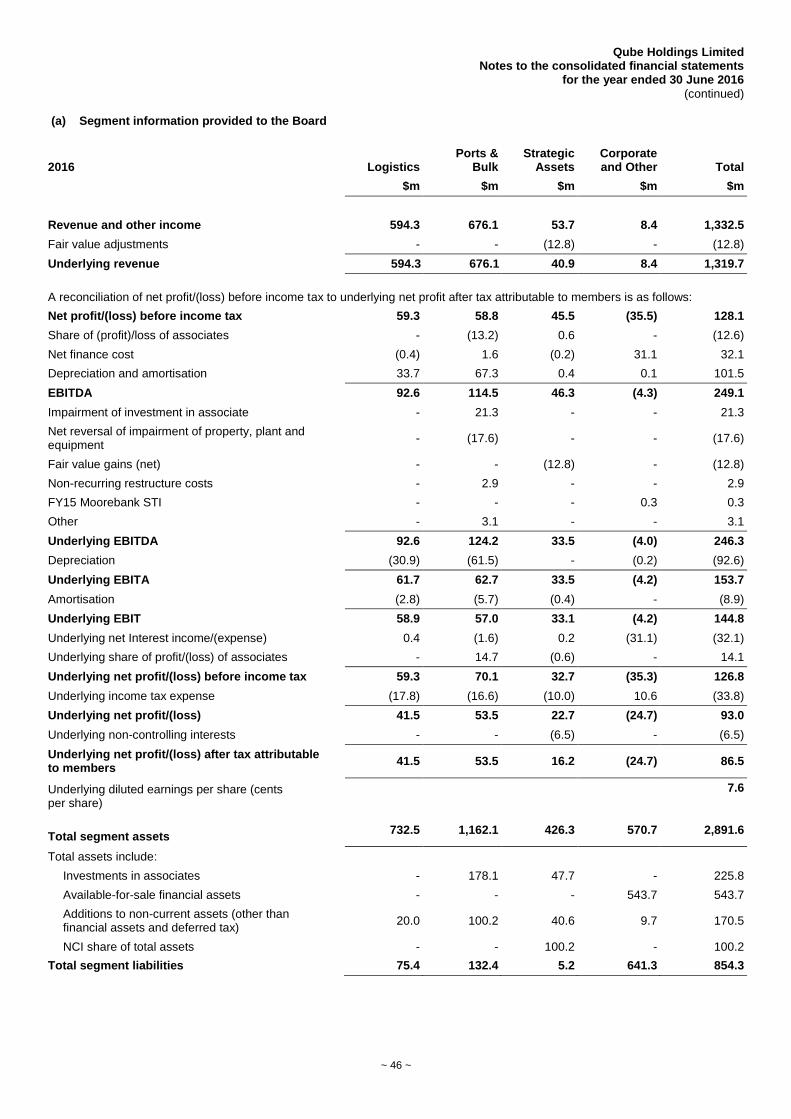
Qube Holdings Limited Notes to the consolidated financial statements
for the year ended 30 June 2016
(continued)
~ 46 ~
(a) Segment information provided to the Board
2016 Logistics Ports &
Bulk Strategic
Assets Corporate and Other Total
$m $m $m $m $m
Revenue and other income 594.3 676.1 53.7 8.4 1,332.5
Fair value adjustments - - (12.8) - (12.8)
Underlying revenue 594.3 676.1 40.9 8.4 1,319.7
A reconciliation of net profit/(loss) before income tax to underlying net profit after tax attributable to members is as follows:
Net profit/(loss) before income tax 59.3 58.8 45.5 (35.5) 128.1
Share of (profit)/loss of associates - (13.2) 0.6 - (12.6)
Net finance cost (0.4) 1.6 (0.2) 31.1 32.1
Depreciation and amortisation 33.7 67.3 0.4 0.1 101.5
EBITDA 92.6 114.5 46.3 (4.3) 249.1
Impairment of investment in associate - 21.3 - - 21.3
Net reversal of impairment of property, plant and equipment
- (17.6) - - (17.6)
Fair value gains (net) - - (12.8) - (12.8)
Non-recurring restructure costs - 2.9 - - 2.9
FY15 Moorebank STI - - - 0.3 0.3
Other - 3.1 - - 3.1
Underlying EBITDA 92.6 124.2 33.5 (4.0) 246.3
Depreciation (30.9) (61.5) - (0.2) (92.6)
Underlying EBITA 61.7 62.7 33.5 (4.2) 153.7
Amortisation (2.8) (5.7) (0.4) - (8.9)
Underlying EBIT 58.9 57.0 33.1 (4.2) 144.8
Underlying net Interest income/(expense) 0.4 (1.6) 0.2 (31.1) (32.1)
Underlying share of profit/(loss) of associates - 14.7 (0.6) - 14.1
Underlying net profit/(loss) before income tax 59.3 70.1 32.7 (35.3) 126.8
Underlying income tax expense (17.8) (16.6) (10.0) 10.6 (33.8)
Underlying net profit/(loss) 41.5 53.5 22.7 (24.7) 93.0
Underlying non-controlling interests - - (6.5) - (6.5)
Underlying net profit/(loss) after tax attributable to members
41.5 53.5 16.2 (24.7) 86.5
Underlying diluted earnings per share (cents per share)
7.6
Total segment assets 732.5 1,162.1 426.3 570.7 2,891.6
Total assets include:
Investments in associates - 178.1 47.7 - 225.8
Available-for-sale financial assets - - - 543.7 543.7
Additions to non-current assets (other than financial assets and deferred tax)
20.0 100.2 40.6 9.7 170.5
NCI share of total assets - - 100.2 - 100.2
Total segment liabilities 75.4 132.4 5.2 641.3 854.3

Qube Holdings Limited Notes to the consolidated financial statements
for the year ended 30 June 2016
(continued)
~ 47 ~
(b) Segment information provided to the Board (continued)
* The comparative information has been restated to include the dilutive impact of the bonus element of the entitlement offer.
Underlying Information is determined as follows:
Underlying revenues and expenses are statutory revenues and expenses adjusted to exclude certain non-cash and
non-recurring items such as fair value adjustments on investment properties, cost of legacy incentive schemes and impairments to reflect core earnings. Income tax expense is based on a prima-facie 30% tax charge on profit before tax and associates.
2015 Logistics Ports &
Bulk Strategic
Assets Corporate and Other Total
$m $m $m $m $m
Revenue and other income 615.9 785.1 57.0 1.3 1,459.3
Fair value adjustments - - (27.0) (0.1) (27.1)
Other adjustments - - - (0.2) (0.2)
Underlying revenue 615.9 785.1 30.0 1.0 1,432.0
A reconciliation of net profit/(loss) before income tax to underlying net profit after tax attributable to members is as follows:
Net profit/(loss) before income tax 51.8 62.8 46.3 (33.4) 127.5
Share of (profit)/loss of associates - (10.5) 0.1 - (10.4)
Net finance cost (0.1) 2.0 3.1 20.2 25.2
Depreciation and amortisation 31.0 72.1 0.4 - 103.5
EBITDA 82.7 126.4 49.9 (13.2) 245.8
Impairment of loan receivable from associate 2.5 - - - 2.5
Impairment of property, plant and equipment - 42.4 - - 42.4
Cost of legacy incentive scheme 1.6 0.6 - - 2.2
Fair value gains (net) - - (27.0) (0.1) (27.1)
Moorebank STI - - - 1.7 1.7
Underlying EBITDA 86.8 169.4 22.9 (11.6) 267.5
Depreciation (28.1) (67.0) - - (95.1)
Underlying EBITA 58.7 102.4 22.9 (11.6) 172.4
Amortisation (2.8) (5.2) (0.4) - (8.4)
Underlying EBIT 55.9 97.2 22.5 (11.6) 164.0
Underlying net Interest income/(expense) 0.1 (2.0) (2.7) (18.1) (22.7)
Underlying share of profit/(loss) of associates - 10.5 (0.1) - 10.4
Underlying net profit/(loss) before income tax 56.0 105.7 19.7 (29.7) 151.7
Underlying income tax expense (16.8) (28.6) (5.9) 8.9 (42.4)
Underlying net profit/(loss) 39.2 77.1 13.8 (20.8) 109.3
Underlying non-controlling interests - - (4.1) - (4.1)
Underlying net profit/(loss) after tax attributable to members
39.2 77.1 9.7 (20.8) 105.2
Underlying diluted earnings per share (cents per share)
9.8*
Total segment assets 749.6 1,177.7 371.1 4.0 2,302.4
Total assets include:
Investments in associates - 194.5 22.4 - 216.9
Additions to non-current assets (other than financial assets and deferred tax)
97.4 236.2 26.5 0.1 360.2
NCI share of total assets - - 91.6 - 91.6
Total segment liabilities 95.6 157.5 2.3 558.7 814.1

Qube Holdings Limited Notes to the consolidated financial statements
for the year ended 30 June 2016
(continued)
~ 48 ~
(b) Other segment information
Qube operates principally in Australia and has no single external customer for which revenues amount to 10% or more of total revenue.
(i) Segment assets
The amounts provided to the Board with respect to total assets are measured in a manner consistent with that of the consolidated financial statements. These assets are allocated based on the operations of the segment and the location of the asset.
(ii) Segment liabilities
The amounts provided to the Board with respect to total liabilities are measured in a manner consistent with that of the consolidated financial statements. These liabilities are allocated based on the operations of the segment.
The Group’s borrowings (excluding finance leases and debt facilities for ISO) are not considered to be segment liabilities but rather managed centrally by the treasury function.
ACCOUNTING POLICY
Operating segments are reported in a manner consistent with the internal reporting provided to the chief operating decision maker. The chief operating decision maker, who is responsible for allocating resources and assessing performance of the operating segments has been identified as the Board of Directors.
3. Revenue and Other income
2016 2015
$m $m
Revenue
Sales revenue - transport and logistics services rendered 1,264.8 1,393.4
Other income
Rental and property related income 21.6 34.2
Net lease surrender payment 23.2 -
Fair value gains on investment property 12.8 27.0
Dividends received 8.0 -
Other 2.1 4.7
67.7 65.9
ACCOUNTING POLICY
Recognition and measurement
Revenue
Revenue is measured at the fair value of the consideration received or receivable and is recognised (net of discounts, allowances and disbursements) as follows:
(i) Revenue earned from the provision of services is recognised on delivery of those services.
(ii) Revenue earned from provision of storage is recognised either on a per day or per week stored basis.
Rental income
Rent from investment property and lease income from operating leases are recognised in the statement of comprehensive income on a straight-line basis over the lease term. Rent not received at balance sheet date is reflected in the balance sheet as a receivable or if paid in advance, as rents in advance. Lease incentives granted are recognised over the lease term, on a straight-line basis, as a reduction of rent.

Qube Holdings Limited Notes to the consolidated financial statements
for the year ended 30 June 2016
(continued)
~ 49 ~
4. Expenses
2016 2015
$m $m
Profit before income tax includes the following specific expenses:
Depreciation
Buildings 2.6 1.1
Plant and equipment 82.7 72.7
Leasehold improvements 7.3 21.3
Total depreciation (refer note 7) 92.6 95.1
Amortisation
Customer contracts 8.5 8.0
Operating rights 0.4 0.4
Total amortisation (refer note 9) 8.9 8.4
Total depreciation and amortisation expense 101.5 103.5
Finance expense
Interest and finance charges paid/payable 32.2 22.2
Finance lease charges expensed 1.3 2.3
Syndicated debt facilities establishment fees written off - 1.3
Total interest and finance charges expense 33.5 25.8
Fair value adjustments – derivative instruments 0.1 1.2
Total finance costs expense 33.6 27.0
Rental expense relating to operating leases
Property 49.5 51.0
Motor vehicles 2.1 3.0
Plant and equipment 30.3 35.8
Total rental expense relating to operating leases 81.9 89.8
Employee benefits expense
Defined contribution superannuation expenses 32.1 29.2
Share-based payment expenses (refer note 33 c) 6.5 6.1
Other employee benefits expense 460.7 471.6
Total employee benefits expense 499.3 506.9
Other expenses includes:
Net reversal of impairment of property, plant and equipment (refer note 7) (17.6) -
Impairment of property, plant and equipment (refer note 7) - 42.4
Impairment of investment in associate (refer note 22) 21.3 -
Impairment of loan receivable from associate – Mackenzie Hillebrand - 2.5

Qube Holdings Limited Notes to the consolidated financial statements
for the year ended 30 June 2016
(continued)
~ 50 ~
ACCOUNTING POLICY
Borrowing costs
Borrowing costs are expensed over the life of the borrowing facility.
Rental expense
Leases in which a significant portion of the risks and rewards of ownership are retained by the lessor are classified as operating leases (note 26). Payments made under operating leases (net of any incentives received from the lessor) are charged to the profit or loss on a straight-line basis over the period of the lease.
Employee benefits
(i) Wages and salaries, annual leave and sick leave
Liabilities for wages and salaries, annual leave and accumulating sick leave expected to be settled within 12 months of the reporting date are recognised in provisions in respect of employees' services up to the reporting date and are measured at the amounts expected to be paid when the liabilities are settled.
(ii) Long service leave
The liability for long service leave is recognised in the provision for employee benefits and measured as the present value of expected future payments to be made in respect of services provided by employees up to the reporting date using the expected future wage and salary levels, experience of employee departures and periods of service. Expected future payments are discounted using market yields at the reporting date on corporate bonds with terms to maturity and currency that match, as closely as possible, the estimated future cash outflows.
(iii) Superannuation
Superannuation is paid to employees based on statutory rates or employment contracts where applicable. Staff who are members of a defined contribution fund receive fixed contributions from the Group and the Group’s legal or constructive obligation is limited to these contributions.
(iv) Bonus plans
The Group recognises a liability and an expense for bonuses where contractually obliged or where there is a past practice that has created or likely to create a constructive obligation.
(v) Employee benefit on-costs
Employee benefit on-costs are recognised and included in employee benefit liabilities and costs when the employee benefits to which they relate are recognised as liabilities. On-costs include payroll tax, worker’s compensation and superannuation where payment is expected.
(vi) Share-based payments
Share-based compensation benefits are provided to certain senior management via the Group’s two executive long-term incentive plans (LTIs) and, if the eligible employee elects to do so, via the Group’s short-term incentive plan (STI). The LTIs include both performance and service based hurdles. The fair value of the benefits under these schemes is expensed to the profit and loss over the period over which the employee incentive vests, with a corresponding increase in other equity reserves.
The STI plan includes both performance and service based hurdles and is expensed through the profit or loss over the relevant vesting period.

Qube Holdings Limited Notes to the consolidated financial statements
for the year ended 30 June 2016
(continued)
~ 51 ~
5. Earnings per share
2016 2015
Cents Cents
(a) Basic earnings per share
Total basic earnings per share attributable to the ordinary equity holders of the Company 7.3 8.1*
(b) Diluted earnings per share
Total diluted earnings per share attributable to the ordinary equity holders of the Company 7.2 8.0*
2016 2015
$m $m
(c) Earnings used in calculating earnings per share
Profit attributable to the ordinary equity holders of the Company used in calculating basic
and diluted earnings per share
82.0 85.9
2016 2015
Number Number
(d) Weighted average number of shares used as the denominator
Weighted average number of ordinary shares used as the denominator in calculating:
Basic earnings per share 1,129,175,050 1,064,438,852*
Diluted earnings per share 1,136,569,863 1,070,926,203*
* The comparative information has been restated to include the dilutive impact of the bonus element of the entitlement offer.
ACCOUNTING POLICY
(i) Basic earnings per share
Basic earnings per share is calculated by dividing the profit attributable to owners of the Company, excluding any costs of servicing equity other than ordinary shares, by the weighted average number of ordinary shares outstanding during the financial year adjusted for bonus elements in ordinary shares issued during the year and excluding treasury shares.
(ii) Diluted earnings per share
Diluted earnings per share adjusts the figures used in the determination of basic earnings per share to take into account the after income tax effect of interest and other financing costs associated with dilutive potential ordinary shares, and the weighted average number of additional ordinary shares that would have been outstanding assuming the conversion of all dilutive potential ordinary shares.

Qube Holdings Limited Notes to the consolidated financial statements
for the year ended 30 June 2016
(continued)
~ 52 ~
OPERATING ASSETS AND LIABILITIES
This section provides information about key balance sheet items, including the accounting policies applied and the critical judgements and estimates used, which are relevant to understanding these items.
Note Page
6. Trade and other receivables 52 7. Property, plant and equipment 54 8. Investment properties 56 9. Intangible assets 57 10. Trade and other payables 59 11. Provisions 60
6. Trade and other receivables
2016 2015
Current $m $m
Trade receivables 168.0 188.7
Provision for impairment of receivables (a) (9.7) (9.3)
158.3 179.4
Prepayments 14.8 13.4
Accrued revenue 20.8 20.2
Other 9.8 8.1
203.7 221.1
(a) Impaired trade receivables
As at 30 June 2016 current trade receivables of the Group with a nominal value of $9.7 million (2015: $9.3 million) were impaired. The amount of the provision was $9.7 million (2015: $9.3 million). The Group expects that a portion of the receivables may be recovered. The individually impaired receivables are mainly the result of a difficult global and domestic economic environment that has impacted Qube’s customers.
2016 2015
$m $m
The ageing of these receivables is as follows:
Up to 3 months (0.8) (3.2)
3 months and greater (8.9) (6.1)
(9.7) (9.3)
Movements in the provision for impairment of receivables are as follows:
Carrying amount at start of year (9.3) (4.3)
Provision for impairment recognised during the year (1.8) (6.7)
Receivables written off during the year as uncollectible 1.4 1.8
Provisions acquired as part of an acquisition - (0.1)
Carrying amount at end of year (9.7) (9.3)

Qube Holdings Limited Notes to the consolidated financial statements
for the year ended 30 June 2016
(continued)
~ 53 ~
(b) Past due but not impaired
As at 30 June 2016, current trade receivables of $23.6 million (2015: $18.6 million) were past due but not impaired. These relate to a number of customers for whom there is no recent history of default. The ageing analysis of these trade receivables is as follows:
2016 2015
$m $m
Up to 3 months 8.5 10.5
3 months and greater 15.1 8.1
23.6 18.6
The other classes within trade and other receivables do not contain impaired assets and are not past due. Based on the credit history of these other classes, it is expected that these amounts will be received when due. The Group does not hold any collateral in relation to these receivables.
(c) Fair value
For current trade receivables, due to the short-term nature, their carrying amount is assumed to approximate their fair value. The fair values of non-current receivables approximate their carrying values.
ACCOUNTING POLICY
Trade receivables are recognised initially at fair value and subsequently measured at amortised cost using the effective interest rate method (where discounting is material), less provision for impairment.
Receivables may include amounts for dividends, interest and trust distributions. Dividends and trust distributions are accrued when the right to receive payment is established. Interest is accrued at the reporting date from the time of last payment. Trade receivables are generally due for settlement within 30 days. They are presented as current assets unless collection is not expected for more than 12 months after the reporting date.
Collectability of trade receivables is reviewed on an ongoing basis. Debts which are known to be uncollectible are written off by reducing their carrying amount directly. An allowance account (provision for impairment of trade receivables) is used when there is objective evidence that the Group will not be able to collect all amounts due. The amount of the impairment allowance is the difference between the asset's carrying amount and the present value of estimated future cash flows, discounted at the original effective interest rate. Cash flows relating to short-term receivables are not discounted if the effect of discounting is immaterial.
The amount of any impairment loss is recognised in profit or loss within other expenses. When a trade receivable for which an impairment allowance had been recognised becomes uncollectible in a subsequent period, it is written off. Subsequent recoveries of amounts previously written off are credited against other expenses in profit or loss.

Qube Holdings Limited Notes to the consolidated financial statements
for the year ended 30 June 2016
(continued)
~ 54 ~
7. Property, plant and equipment
Land and buildings
Plant and equipment
Leasehold improvements Total
$m $m $m $m
Year ended 30 June 2015
Opening net book amount 85.4 419.8 134.7 639.9
Acquisition of business - 105.8 0.7 106.5
Additions 41.8 111.3 35.8 188.9
Disposals (0.1) (5.1) - (5.2)
Exchange differences - (3.2) (0.1) (3.3)
Reclassifications 0.3 (0.1) (0.2) -
Impairment loss - (23.5) (18.9) (42.4)
Depreciation charge (1.1) (72.7) (21.3) (95.1)
Closing net book amount 126.3 532.3 130.7 789.3
At 30 June 2015
Cost 140.6 781.1 170.6 1,092.3
Accumulated depreciation (14.3) (248.8) (39.9) (303.0)
Net book amount 126.3 532.3 130.7 789.3
Year ended 30 June 2016
Opening net book amount 126.3 532.3 130.7 789.3
Acquisition of business - 11.8 - 11.8
Additions 34.3 54.9 18.1 107.3
Disposals - (9.0) (0.3) (9.3)
Exchange differences - 4.2 - 4.2
Reclassifications (14.1) - 14.1 -
Net reversal of impairment loss (b) - 17.6 - 17.6
Depreciation charge (2.6) (82.7) (7.3) (92.6)
Closing net book amount 143.9 529.1 155.3 828.3
At 30 June 2016
Cost 160.6 841.4 205.5 1,207.5
Accumulated depreciation (16.7) (312.3) (50.2) (379.2)
Net book amount 143.9 529.1 155.3 828.3
(a) Leased assets
Plant and equipment includes the following amounts where the Group is a lessee under a finance lease:
2016 2015
$m $m
Leased equipment
Cost 37.1 54.9
Accumulated depreciation (21.1) (21.9)
Net book amount 16.0 33.0
These assets are pledged as security for the finance leases (refer note 18(a)).

Qube Holdings Limited Notes to the consolidated financial statements
for the year ended 30 June 2016
(continued)
~ 55 ~
(b) Net reversal of impairment loss
In FY15 Qube impaired the carrying value of its Utah Point facility by approximately $19.6 million.
Given Atlas’ (Qube’s main customer at the facility) improved financial position and outlook as a result of operational efficiencies and successful negotiations with their financiers, as well as Qube’s reduced cost base to operate the facility, Qube has revised its forecast for its Utah Point facility, and has decided to reverse the previous impairment net of depreciation that would have been booked if the asset had not been impaired of $17.7 million.
ACCOUNTING POLICY
Property, plant and equipment is stated at historical cost less depreciation. Historical cost includes expenditure that is directly attributable to the acquisition of the items. Land is not depreciated. Leasehold improvements are depreciated over the shorter of the useful life of the asset and the lease term.
Subsequent costs are included in the asset's carrying amount or recognised as a separate asset, as appropriate, only when it is probable that future economic benefits associated with the item will flow to the Group and the cost of the item can be measured reliably. The carrying amount of any component accounted for as a separate asset is derecognised when replaced. All other repairs and maintenance are charged to profit or loss during the reporting period in which they are incurred.
Depreciation on other assets is calculated using the straight-line method to allocate their cost, net of their residual values, over their estimated useful lives or as follows:
● Buildings 2.5% to 20.0%
● Leasehold improvements 2.5% to 10.0%
● Furniture, fittings and equipment 10.0% to 20.0%
● Plant and equipment 5.0% to 33.3%
The asset’s residual values and useful lives are reviewed, and adjusted if appropriate, at the end of each reporting period.
An asset's carrying amount is written down immediately to its recoverable amount if the asset's carrying amount is greater than its estimated recoverable amount.
Gains and losses on disposals are determined by comparing proceeds with carrying amount. These are included in profit or loss.
Leased assets
Leases of property, plant and equipment where the Group has substantially all the risks and rewards of ownership are classified as finance leases. Finance leases are capitalised at the lease’s inception at the lower of the fair value of the leased property and the present value of the minimum lease payments. The corresponding rental obligations, net of finance charges, are included in borrowings. Each lease payment is allocated between the liability and finance cost. The finance cost is charged to the profit or loss over the lease period so as to produce a constant periodic rate of interest on the remaining balance of the liability for each period. The property, plant and equipment acquired under finance leases are depreciated over the shorter of the asset’s useful life and the lease term.
Impairment
Assets are tested for impairment whenever events or changes in circumstances indicate that the carrying amount may not be recoverable. An impairment loss is recognised for the amount by which the asset's carrying amount exceeds its recoverable amount. The recoverable amount is the higher of an asset's fair value less costs to sell and value-in-use. For the purposes of assessing impairment, assets are grouped at the lowest levels for which there are separately identifiable cash inflows which are largely independent of the cash inflows from other assets or groups of assets (cash generating units). Assets that suffered an impairment are reviewed for possible reversal of the impairment at the end of each reporting period.
CRITICAL ACCOUNTING JUDGEMENTS AND ESTIMATES
Estimated impairment of property, plant and equipment
In accordance with the accounting policy stated above, the Group reviews the carrying values and remaining useful lives of items of property, plant and equipment to confirm they remain appropriate. Where indictors of impairment are present, the Group conducts assessments based on value-in-use calculations, where this is considered the highest and best use of the asset which require the use of assumptions. These assumptions can include: a suitable discount rate, cash flows expected to be generated from the use of these assets and the associated capital expenditures expected over the useful life of the asset. Alternatively a fair value less cost to sell valuation is applied to ascertain the recoverable amount.

Qube Holdings Limited Notes to the consolidated financial statements
for the year ended 30 June 2016
(continued)
~ 56 ~
8. Investment properties
2016 2015
$m $m
Opening balance at 1 July 342.0 308.5
Capitalised subsequent expenditure 14.7 6.1
Net gain from fair value adjustments 12.8 27.0
Straight-lining of operating lease rental income (1.8) 0.4
Closing balance at 30 June 367.7 342.0
(a) Measuring investment property at fair value
Investment properties, principally industrial assets held at strategic locations in Moorebank and Minto are currently held for rental yields and are not occupied by the Group. They are carried at fair value.
(b) Amounts recognised in profit or loss for investment properties
2016 2015
$m $m
Rental income 16.9 30.0
Net lease surrender payment 23.2 -
Direct operating expenses from property that generated rental income (2.5) (4.6)
Direct operating expenses from property that did not generate rental income (3.7) -
(c) Leasing arrangements
Investment properties are leased to tenants under operating leases with rentals payable monthly. Minimum lease payments receivable on leases of investment properties are as follows:
2016 2015
$m $m
Minimum lease payments not recognised in the financial statements under non-cancellable operating leases of investment properties are receivable as follows:
Within one year 3.1 25.6
Later than one year but not later than 5 years 3.1 42.1
Later than 5 years - -
6.2 67.7
ACCOUNTING POLICY
Investment properties principally comprise freehold land and buildings that are presently leased and not occupied by the Group. Investment properties are carried at fair value, based on active market prices, adjusted if necessary, for any difference in the nature, location or condition of the specific asset. If this information is not available, the Group uses alternative valuation methods such as recent prices in less active markets or discounted cash flow projections. Changes in fair values are recorded in the profit or loss as part of other income.
CRITICAL ACCOUNTING JUDGEMENTS AND ESTIMATES
Estimated fair values of investment properties
The Group obtains independent valuations at least annually or as otherwise required. At the end of each reporting period, the directors update their assessment of the fair value of each property, taking into account the most recent independent valuations. The key assumptions used in this determination are set out in note 20.

Qube Holdings Limited Notes to the consolidated financial statements
for the year ended 30 June 2016
(continued)
~ 57 ~
9. Intangible assets
Goodwill Operating
rights Customer contracts Total
$m $m $m $m
Year ended 30 June 2015
Opening net book amount 565.4 5.5 35.8 606.7
Finalisation of acquisition accounting 0.3 - - 0.3
Acquisition of business 24.4 - 13.9 38.3
Exchange differences (1.1) - (0.5) (1.6)
Amortisation charge - (0.4) (8.0) (8.4)
Closing net book amount 589.0 5.1 41.2 635.3
At 30 June 2015
Cost 589.0 7.6 67.3 663.9
Accumulated amortisation and impairment - (2.5) (26.1) (28.6)
Net book amount 589.0 5.1 41.2 635.3
Year ended 30 June 2016
Opening net book amount 589.0 5.1 41.2 635.3
Acquisition of business 2.9 - - 2.9
Exchange differences 1.0 - 0.4 1.4
Amortisation charge - (0.4) (8.5) (8.9)
Closing net book amount 592.9 4.7 33.1 630.7
At 30 June 2016
Cost 592.9 7.6 67.4 667.9
Accumulated amortisation and impairment - (2.9) (34.3) (37.2)
Net book amount 592.9 4.7 33.1 630.7
(a) Allocation of goodwill to CGUs
Goodwill is allocated to the Group’s cash generating units (CGUs) identified according to operating segments as presented below. The carrying amount of goodwill allocated to each CGU was recoverable at year end.
2016 2015
$m $m
Logistics 222.6 222.6
Ports & Bulk 370.3 366.4
592.9 589.0
(b) Impairment tests for goodwill
The recoverable amount of a CGU is determined based on value-in-use calculations, using cash flow projections based on financial budgets and forecasts prepared by management typically covering a three year period. Cash flows beyond a three year period are extrapolated using the estimated growth rates stated below. The growth rate does not exceed the long-term average growth rate for the business for which the CGU operates.

Qube Holdings Limited Notes to the consolidated financial statements
for the year ended 30 June 2016
(continued)
~ 58 ~
ACCOUNTING POLICY
(i) Goodwill
Goodwill on acquisitions of businesses is included in intangible assets and is measured as described in note 21. Goodwill is not amortised. Instead, goodwill is tested for impairment annually or more frequently if events or changes in circumstances indicate that it might be impaired, and is carried at cost less accumulated impairment losses. Gains and losses on the disposal of an entity include the carrying amount of goodwill relating to the entity sold.
Goodwill is allocated to CGUs for the purpose of impairment testing. The allocation is made to those CGUs or group of CGUs that are expected to benefit from the business combination in which the goodwill arose, identified according to operating segments (note 2).
(ii) Operating rights
Operating rights are carried at cost less accumulated amortisation and impairment losses. Amortisation is calculated using the straight-line method to allocate the cost of the operating rights over a 20 year period from 2008, when the rights were initially recognised.
(iii) Customer contracts
Customer contracts acquired as part of a business combination are recognised separately from goodwill. The customer contracts are carried at their fair value at the date of acquisition less accumulated amortisation and impairment losses. Amortisation is calculated based on the timing of projected cash flows of the contracts over their estimated useful life which is between 4 to 11 years.
Impairment
Goodwill and intangible assets that have an indefinite useful life are not subject to amortisation and are tested annually for impairment or more frequently if events or changes in circumstances indicate that they might be impaired. Other assets are tested for impairment whenever events or changes in circumstances indicate that the carrying amount may not be recoverable. An impairment loss is recognised for the amount by which the asset's carrying amount exceeds its recoverable amount. The recoverable amount is the higher of an asset's fair value less costs to sell and value-in-use. For the purposes of assessing impairment, assets are grouped at the lowest levels for which there are separately identifiable cash inflows which are largely independent of the cash inflows from other assets or groups of assets (CGUs). Non-financial assets other than goodwill that suffered an impairment are reviewed for possible reversal of the impairment at the end of each reporting period.
CRITICAL ACCOUNTING JUDGEMENTS AND ESTIMATES
Estimated impairment of goodwill
The CGU cash flow projections used for impairment testing assume no material adverse change to economic conditions for the 2017 to 2019 period. No significant changes to the methodology of the underlying models and assumptions have been made.
Terminal values after year three have been determined using a stable growth model, having regard to a post-tax discount rates and long-term growth rates. The equivalent pre-tax discount rate has been disclosed below. Management determined budgeted EBITDA margin based on past performance and its expectations for the future.
Long-term growth rate Discount rate
CGU 2016
%
2015
%
2016
%
2015
%
Logistics 2.5 2.5 12.3 12.3
Ports & Bulk 2.5 2.5 12.1 12.1
Impact of possible changes in critical assumptions
The base case long-term growth and discount rates used in the impairment testing of goodwill for each CGU where goodwill has been identified have been disclosed above.
If the discount rate increased by 0.5% or the EBITDA margin decreased by 5% in each year of the valuation and all other assumptions used in the valuation assessment remained unchanged, it would not result in an impairment of goodwill for either the Logistics or Ports & Bulk divisions.
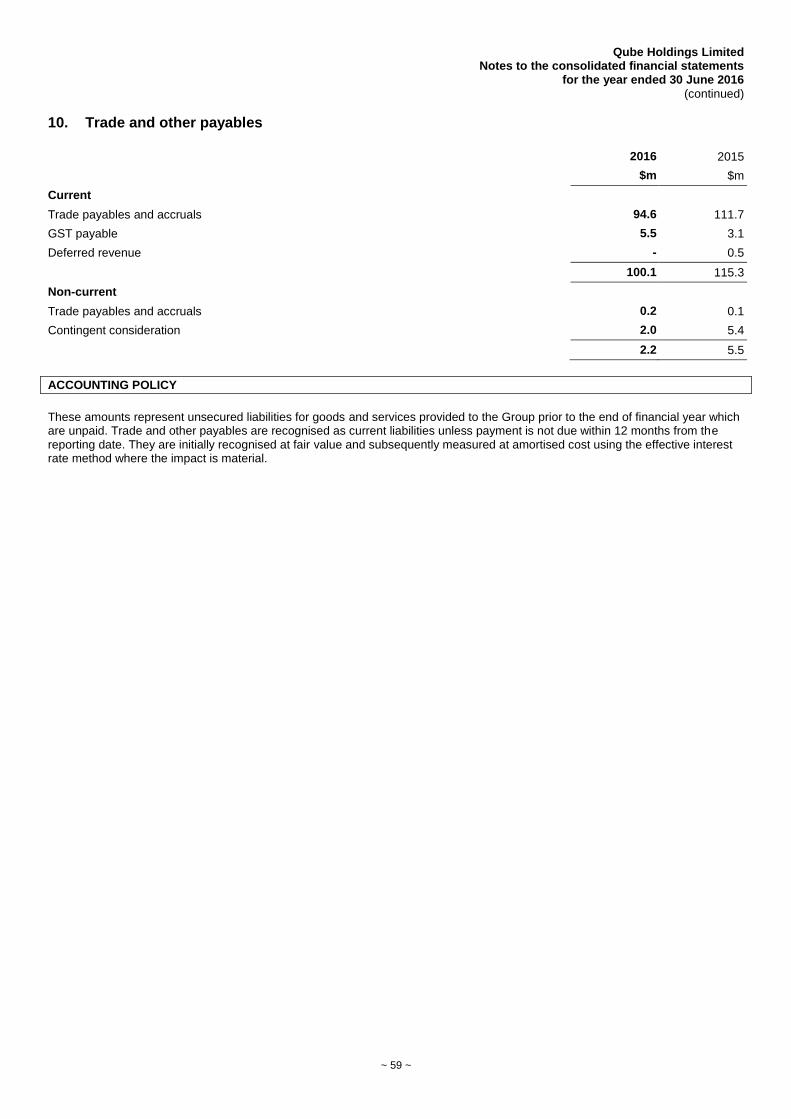
Qube Holdings Limited Notes to the consolidated financial statements
for the year ended 30 June 2016
(continued)
~ 59 ~
10. Trade and other payables
2016 2015
$m $m
Current
Trade payables and accruals 94.6 111.7
GST payable 5.5 3.1
Deferred revenue - 0.5
100.1 115.3
Non-current
Trade payables and accruals 0.2 0.1
Contingent consideration 2.0 5.4
2.2 5.5
ACCOUNTING POLICY
These amounts represent unsecured liabilities for goods and services provided to the Group prior to the end of financial year which are unpaid. Trade and other payables are recognised as current liabilities unless payment is not due within 12 months from the reporting date. They are initially recognised at fair value and subsequently measured at amortised cost using the effective interest rate method where the impact is material.

Qube Holdings Limited Notes to the consolidated financial statements
for the year ended 30 June 2016
(continued)
~ 60 ~
11. Provisions
2016 2015
Current Non-current Total Current Non-current Total
$m $m $m $m $m $m
Employee benefits 60.5 8.1 68.6 61.5 9.8 71.3
Onerous contract (property lease) 3.0 1.2 4.2 5.1 5.0 10.1
Provision for distribution 0.9 - 0.9 0.5 - 0.5
Other 0.6 - 0.6 - - -
65.0 9.3 74.3 67.1 14.8 81.9
(a) Movements in provisions
Movements in each class of provision during the financial year, other than employee benefits, are set out below:
Onerous contract
Provision for distribution Other Total
2016 $m $m $m $m
Carrying amount at beginning of year 10.1 0.5 - 10.6
Charged/(credited) to profit or loss
additional provisions recognised - 10.1 0.6 10.7
unused amounts reversed (0.6) - - (0.6)
Amounts used during the year (5.3) (9.7) - (15.0)
Carrying amount at end of year 4.2 0.9 0.6 5.7
(b) Amounts not expected to be settled within the next 12 months
The current provision for employee benefits includes accrued annual leave, vesting sick leave and long service leave. For long service leave it covers all unconditional entitlements where employees have completed the required period of service and also those where employees are entitled to pro-rata payments in certain circumstances. The amount of the provision where the Group does not have an unconditional right to defer settlement for any of these obligations is presented as current. However, based on past experience, the Group does not expect all employees to take the full amount of accrued leave or require payment within the next 12 months. The following amounts reflect leave that is not expected to be taken or paid within the next 12 months:
2016 2015
$m $m
Leave obligations expected to be settled after 12 months 15.7 15.3
ACCOUNTING POLICY
Provisions are recognised when the Group has a present legal or constructive obligation as a result of past events, it is probable that an outflow of resources will be required to settle the obligation and the amount has been reliably estimated. Provisions are not recognised for future operating losses. Provisions are measured at the present value of management's best estimate of the expenditure required to settle the present obligation at the end of each reporting period.
The discount rate used to determine the present value is a pre-tax rate that reflects current market assessments of the time value of money and the risks specific to the liability. The increase in a provision due to the passage of time is recognised as interest expense.
Provisions are classified as current liabilities unless the Group has an unconditional right to defer settlement of the liability for at least 12 months after the reporting period.

Qube Holdings Limited Notes to the consolidated financial statements
for the year ended 30 June 2016
(continued)
~ 61 ~
INCOME TAXES
This section provides information on the income tax charge for the year along with the reconciliation of the effective tax rate to the standard corporate tax rate, details of the deferred tax balances and movements in these balances during the year, including the relevant accounting policies applied and critical judgements and estimates used. Note Page
12. Income tax expense 61 13. Deferred tax assets 62 14. Deferred tax liabilities 62
12. Income tax expense
2016 2015
$m $m
(a) Income tax expense
Current tax 29.0 37.3
Deferred tax assets 6.8 (7.5)
Deferred tax liabilities - 1.9
Adjustments for current tax of prior periods (0.2) (0.1)
35.6 31.6
Deferred income tax expense included in income tax expense comprises:
Decrease/(increase) in deferred tax assets 6.8 (7.5)
Increase in deferred tax liabilities - 1.9
6.8 (5.6)
(b) Numerical reconciliation of income tax expense to prima facie tax payable
Profit before income tax expense 128.1 127.5
Tax at the Australian tax rate of 30% (2015: 30%) 38.4 38.2
Tax effect of amounts which are not deductible/(taxable) in calculating taxable income:
Non-assessable equity accounted profit (3.8) (3.1)
Deferred tax recognised in respect of investment properties - 4.2
Accounting fair value gain on investment properties (3.6) (8.0)
Fair value loss on impairment of an associate 6.4 -
Rebatable dividends (2.4) -
Share-based payments 0.3 0.4
Sundry items 0.3 (0.1)
Income tax expense 35.6 31.6
(c) Amounts recognised directly in equity
Aggregate current and deferred tax arising in the reporting period and not recognised in net profit or loss or other comprehensive income but directly debited or credited to equity:
Net deferred tax – debited directly to equity (0.1) -

Qube Holdings Limited Notes to the consolidated financial statements
for the year ended 30 June 2016
(continued)
~ 62 ~
13. Deferred tax assets
2016 2015
$m $m
The balance comprises temporary differences attributable to:
Employee benefits 21.2 21.9
Plant and equipment 7.2 9.9
Other 10.6 11.0
Total deferred tax assets 39.0 42.8
Set-off of deferred tax assets/liabilities pursuant to set-off provisions (39.0) (37.2)
Net deferred tax assets - 5.6
Deferred tax assets expected to be recovered within 12 months 26.9 27.8
Deferred tax assets expected to be recovered after more than 12 months 12.1 15.0
39.0 42.8
Movements in deferred tax assets: Employee
benefits Plant and
equipment Other Total
$m $m $m $m
At 1 July 2014 20.9 0.6 8.3 29.8
Credited/(charged)
● to profit or loss (0.1) 9.3 (1.7) 7.5
● to other comprehensive income - - (0.1) (0.1)
Acquisition of subsidiary 1.1 - 4.5 5.6
At 30 June 2015 21.9 9.9 11.0 42.8
Credited/(charged)
● to profit or loss (0.7) (2.7) (3.4) (6.8)
● directly to equity - - 2.9 2.9
● to other comprehensive income - - 0.1 0.1
At 30 June 2016 21.2 7.2 10.6 39.0
14. Deferred tax liabilities
2016 2015
$m $m
The balance comprises temporary differences attributable to:
Plant and equipment 20.5 17.0
Intangible assets 9.7 12.0
Investment property 4.3 4.2
Other provisions 6.0 4.0
40.5 37.2
Set-off of deferred tax assets/liabilities pursuant to set-off provisions (39.0) (37.2)
Net deferred tax liabilities 1.5 -
Deferred tax liabilities expected to be settled within 12 months 5.4 4.6
Deferred tax liabilities expected to be settled after more than 12 months 35.1 32.6
40.5 37.2

Qube Holdings Limited Notes to the consolidated financial statements
for the year ended 30 June 2016
(continued)
~ 63 ~
Movements in deferred tax liabilities:
Plant and equipment
Intangible assets
Investment property
Other provisions Total
$m $m $m $m $m
At 1 July 2014 17.7 10.6 - 1.8 30.1
Charged/(credited)
● to profit or loss (2.1) (2.4) 4.2 2.2 1.9
● to other comprehensive income (0.1) (0.2) - - (0.3)
Acquisition of subsidiaries 1.5 4.0 - - 5.5
At 30 June 2015 17.0 12.0 4.2 4.0 37.2
Charged/(credited)
● to profit or loss 3.4 (2.5) 0.1 (1.0) -
● directly to equity - - - 3.0 3.0
● to other comprehensive income 0.1 0.2 - - 0.3
At 30 June 2016 20.5 9.7 4.3 6.0 40.5
ACCOUNTING POLICY
The income tax expense or benefit for the consolidated entity for the year is the tax payable on the current year's taxable income based on the notional tax rate for each jurisdiction. This can also be adjusted by changes in deferred tax assets and liabilities attributable to temporary differences between the tax bases of assets and liabilities and their carrying amounts in the financial statements, and by unused tax losses.
Deferred income tax is determined using the liability method, being the temporary differences arising between the tax bases of assets and liabilities and their carrying amounts in the consolidated financial statements. Deferred tax assets are recognised for deductible temporary differences and unused tax losses only if it is probable that future taxable amounts will be available to utilise those temporary differences and losses. However, deferred income tax is also not accounted for if it arises from initial recognition of an asset or liability in a transaction other than a business combination that at the time of the transaction affects neither accounting nor taxable profit or loss.
Deferred income tax is determined using tax rates (and laws) that have been enacted or substantially enacted by the end of the reporting period and are expected to apply when the related deferred income tax asset is realised or the deferred income tax liability is settled.
The deferred tax liabilities in relation to investment properties that are measured at fair value is determined assuming the property will be recovered entirely through sale.
The consolidated entity may incur withholding tax imposed by certain countries on investment income. Such income is recorded gross of withholding tax in the statement of comprehensive income.
Deferred tax assets and liabilities are offset when there is a legally enforceable right to offset current tax assets and liabilities and when the deferred tax balances relate to the same taxation authority. Current tax assets and tax liabilities are offset where the entity has a legally enforceable right to offset and intends either to settle on a net basis, or to realise the asset and settle the liability simultaneously.
Qube Holdings Limited and its wholly-owned Australian controlled entities have implemented the tax consolidation legislation. As a consequence, these entities are taxed as a single entity and the deferred tax assets and liabilities of these entities are set off in the consolidated financial statements.
Current income tax assets and liabilities for the current period are measured at the amount expected to be recovered from or paid to the taxation authorities. The tax rates and tax laws used to compute the amount are those that are enacted or substantively enacted, at the reporting date in the countries where the Group operates and generates taxable income.
Current and deferred tax is recognised in profit or loss, except to the extent that it relates to items recognised in other comprehensive income or directly in equity. In this case, the tax is also recognised in other comprehensive income or directly in equity, respectively.

Qube Holdings Limited Notes to the consolidated financial statements
for the year ended 30 June 2016
(continued)
~ 64 ~
Investment allowances and similar tax incentives
Companies within the Group may be entitled to claim special tax deductions for investments in qualifying assets or in relation to qualifying expenditure. The Group accounts for such allowances as tax credits, which means that the allowance reduces income tax payable and current tax expense. A deferred tax asset is recognised for unclaimed tax credits that are carried forward as deferred tax assets.

Qube Holdings Limited Notes to the consolidated financial statements
for the year ended 30 June 2016
(continued)
~ 65 ~
CAPITAL AND BORROWINGS
This section provides information on shareholder returns, equity and reserves, and debt funding including all relevant accounting policies applied. Note Page
15. Dividends 65 16. Contributed equity 66 17. Reserves and retained earnings 68 18. Borrowings 69
15. Dividends
2016 2015
$m $m
(a) Ordinary shares
Final dividend for the year ended 30 June 2015 of 2.8 cents per fully paid share paid on 7 October 2015 (2014: 2.7 cents per share paid on 3 October 2014)
Fully franked based on tax paid at 30% 29.6 27.9
Interim dividend for the year ended 30 June 2016 of 2.7 cents per fully paid share paid on
6 April 2016 (2015: 2.7 cents per share paid on 7 April 2015)
Fully franked based on tax paid at 30% 28.6 27.8
58.2 55.7
(b) Dividends not recognised at the end of the reporting period
In addition to the above dividends, since the financial year end the directors have recommended the payment of a final dividend of (2.8 cents) per fully paid ordinary share, (2015: 2.8 cents) fully franked based on tax paid at 30%. The aggregate amount of the proposed dividend expected to be paid on 11 October 2016 (2015: 7 October 2015) out of retained earnings at 30 June 2016 (2015: 30 June 2015), but not recognised as a liability at the end of the year, is 40.5 29.6
(c) Franked dividends
The franked portions of the final dividends recommended after the financial year end will be franked out of existing franking credits or out of franking credits arising from the payment of income tax for the year ended 30 June 2016.
Consolidated Parent entity
2016 2015 2016 2015
$m $m $m $m
Franking credits available for subsequent financial years based on a tax rate of 30% (2015: 30%) 86.5 89.2 86.5 89.2
The above amounts represent the balance of the franking account as at the end of the reporting period, adjusted for:
(i) franking credits that will arise from the payment of the amount of the provision for income tax;
(ii) franking debits that will arise from the payment of dividends recognised as a liability at the reporting date; and
(iii) franking credits that will arise from the receipt of dividends recognised as receivables at the reporting date.
The consolidated amounts include franking credits that would be available to the parent entity if distributable profits of non-wholly owned subsidiaries were paid as dividends.

Qube Holdings Limited Notes to the consolidated financial statements
for the year ended 30 June 2016
(continued)
~ 66 ~
The impact on the franking account of the dividend recommended by the directors since the end of the reporting period, but not recognised as a liability at the end of each reporting period, will be a reduction in the franking account.
ACCOUNTING POLICY
Provision is made for any dividend declared that is appropriately authorised and no longer at the discretion of the entity, on or before the end of the reporting period but not distributed at the end of the reporting period.
16. Contributed equity
2016 2015 2016 2015
Notes Shares Shares $m $m
Share capital
Ordinary shares
Fully paid (a) 1,303,662,847 1,056,700,287 1,801.6 1,302.0
Less: Treasury shares (b) (8,500,479) (7,367,178) (19.4) (17.3)
Total contributed equity 1,295,162,368 1,049,333,109 1,782.2 1,284.7
(a) Movements in ordinary shares:
Date Details
Number of shares
Issue
price $m
1 July 2014 Opening balance 1,051,172,929 1,287.4
3 October 2014 Dividend reinvestment plan 3,255,147 $2.4939 8.1
7 April 2015 Dividend reinvestment plan 2,272,211 $2.8390 6.5
30 June 2015 Balance 1,056,700,287 1,302.0
7 October 2015 Dividend reinvestment plan 3,875,480 $1.9790 7.7
24 March 2016 Institutional entitlement offer 121,901,450 $2.0500 249.9
6 April 2016 Dividend reinvestment plan 2,035,182 $2.2377 4.6
8 April 2016 Retail entitlement offer 119,150,448 $2.0500 244.3
Less: Transaction costs arising on share issues, net of tax
(6.9)
30 June 2016 Closing balance 1,303,662,847 1,801.6
(b) Movements in treasury shares:
Date Details Number of
shares
Average purchase
price $m
1 July 2014 Opening balance (2,961,418) $2.0517 (6.1)
Treasury shares purchased (4,405,760) $2.5399 (11.2)
1 July 2015 Opening balance (7,367,178) $2.3437 (17.3)
Transfer of treasury shares 440,862 $2.3855 1.1
Treasury shares purchased (1,574,163) $2.0500 (3.2)
30 June 2016 Closing Balance (8,500,479) (19.4)

Qube Holdings Limited Notes to the consolidated financial statements
for the year ended 30 June 2016
(continued)
~ 67 ~
(c) Ordinary shares
Ordinary shares entitle the holder to participate in dividends and the proceeds on winding up of the Company in proportion to the number of and amounts paid on the shares held.
On a show of hands every holder of ordinary shares present at a meeting in person or by proxy, is entitled to one vote, and upon a poll each share is entitled to one vote.
Ordinary shares have no par value and the Company does not have a limited amount of authorised capital.
(d) Dividend reinvestment plan
The Company has established a dividend reinvestment plan under which holders of ordinary shares may elect to have all or part of their dividend entitlements satisfied by the issue of new ordinary shares rather than by being paid in cash. Shares issued under the plan may be at a discount (which is determined by the Board) to the market price.
(e) Employee share scheme
Information relating to the employee share schemes, including details of shares issued under these schemes is set out in note 33.
(f) Treasury shares
Treasury shares are shares in Qube Holdings Limited held by the Qube Employee Share Trust for the purpose of allocating shares that vest under the Performance Rights scheme. Details of the plan are set out in note 33.
(g) Capital risk management
The role of capital risk management at Qube is to support the creation of shareholder value having regard to risk. Qube’s capital risk management strategy, therefore, is to establish a framework that supports and facilitates the pursuit of Qube’s business strategy while minimising Qube’s costs of funding having regard to appropriate business risks.
Specifically, the components of Qube’s financial strategy are to:
● optimise the capital structure to reduce the cost of capital;
● provide sufficient financial flexibility to enable Qube to develop its businesses;
● maintain access to a broad range of funding sources and diverse tenor; and
● subject to the above, raise funds in the most cost effective manner possible.
Qube continues to maintain a conservative approach to its capital structure with a long-term target gearing range of 30-40%.
Qube monitors its net debt and available funding capacity through a range of measures including interest cover ratio and other gearing ratios.
Qube maintains adequate headroom to its covenant levels to provide it with financial flexibility to take advantage of opportunities and the ability to manage an unexpected downturn in earnings which is important given Qube’s leverage to economic activity.
ACCOUNTING POLICY
Ordinary shares are classified as equity. Incremental costs directly attributable to the issue of new shares are shown in equity as a deduction, net of tax, from the proceeds.
Where any Group company purchases the Company’s equity instruments, for example as the result of a share-based payment plan, the consideration paid, including any directly attributable incremental costs (net of income taxes) is deducted from equity attributable to the owners of Qube Holdings Limited as treasury shares until the shares are cancelled or reissued.
Where such ordinary shares are subsequently reissued, any consideration received, net of any directly attributable incremental transaction costs and the related income tax effects is included in equity attributable to the owners of Qube Holdings Limited.
Shares held by Qube Employee Share Accumulation Plan Pty Limited (Qube Employee Share Trust) are disclosed as treasury shares and deducted from contributed equity.

Qube Holdings Limited Notes to the consolidated financial statements
for the year ended 30 June 2016
(continued)
~ 68 ~
17. Reserves and retained earnings
2016 2015
$m $m
Reserves
Business combination reserve 28.4 28.4
Share-based payments reserve (5.6) (13.6)
Transactions with non-controlling interests reserve (39.5) (39.5)
Foreign currency translation reserve 0.1 (4.0)
Available-for-sale financial asset reserve 7.0 -
(9.6) (28.7)
(a) Movements in reserves:
Share-based payments reserve
Balance 1 July (13.6) (19.8)
Loans repaid 1.5 2.3
Employee share plan expense 6.5 3.9
Balance 30 June (5.6) (13.6)
Foreign currency translation reserve
Balance 1 July (4.0) -
Currency translation differences, net of tax 4.1 (4.0)
Balance 30 June 0.1 (4.0)
Available-for-sale financial asset reserve
Balance 1 July - -
Revaluation, net of deferred tax 7.0 -
Balance 30 June 7.0 -
(b) Nature and purpose of reserves
(i) Business combination reserve
The business combination reserve represents the difference between the consideration paid to acquire a non-controlling interest in a subsidiary, versus the carrying value of the shares acquired.
(ii) Share-based payments reserve
The share-based payments reserve is used to recognise the loans and value of share-based payments provided to employees under share-based payment schemes. The initial fair value of the benefit provided is recognised on a straight-line basis over the vesting period.
(iii) Transactions with non-controlling interests reserve
This reserve is used to record the differences which may arise as a result of transactions with non-controlling interests that do not result in a loss of control.
(iv) Foreign currency translation reserve
Exchange differences arising on translation of the foreign controlled entity are recognised in other comprehensive income as described in note 36 and accumulated in a separate reserve within equity. The cumulative amount is reclassified to profit or loss when the net investment is disposed of.

Qube Holdings Limited Notes to the consolidated financial statements
for the year ended 30 June 2016
(continued)
~ 69 ~
Retained earnings
2016 2015
Movements in retained earnings were as follows: $m $m
Balance 1 July 141.5 111.3
Net profit for the year 82.0 85.9
Dividends paid (57.0) (55.7)
Balance 30 June 166.5 141.5
18. Borrowings
2016 2015
$m $m
Current
Unsecured
Bank loans 150.0 -
Secured
Finance lease liabilities (note 26b(ii)) 9.4 12.3
Total current borrowings 159.4 12.3
Non-current
Unsecured
Bank loans 517.0 581.1
Less capitalised establishment costs (4.6) (5.0)
512.4 576.1
Secured
Finance lease liabilities ((note 26b(ii)) 1.2 13.6
Total non-current borrowings 513.6 589.7
Bank facilities
The following table provides details of components of the bank facilities:
2016 2015 Facility Maturity Facility Utilised* Facility Utilised Syndicated revolving facility Dec-19 750.0 480.0 750.0 560.0 Bilateral revolving facility Dec-19 40.0 37.0 30.0 21.0 Bilateral revolving facility Mar-19 150.0 - - - Bilateral revolving facility May-19 90.0 - - - Bilateral term facility July-19 50.0 - - - Bilateral bridge facility Sep-16 150.0 150.0 - - * Excludes bank guarantees drawn totaling $22.9 million (2015: $38.7 million) In order to fund its stake in Asciano the Company entered into additional bridging facilities totaling $500 million. $350 million of these bridging facilities were repaid from Qube's entitlement offer proceeds with the balance of the proceeds used to reduce existing revolving facilities. To provide the Company with sufficient funding to complete the Patrick acquisition and meet other future capital expenditure requirements during the year, the Company entered into additional bilateral facilities totaling $300 million including $10 million specifically for ISO to fund its acquisition of Quality Marshalling.
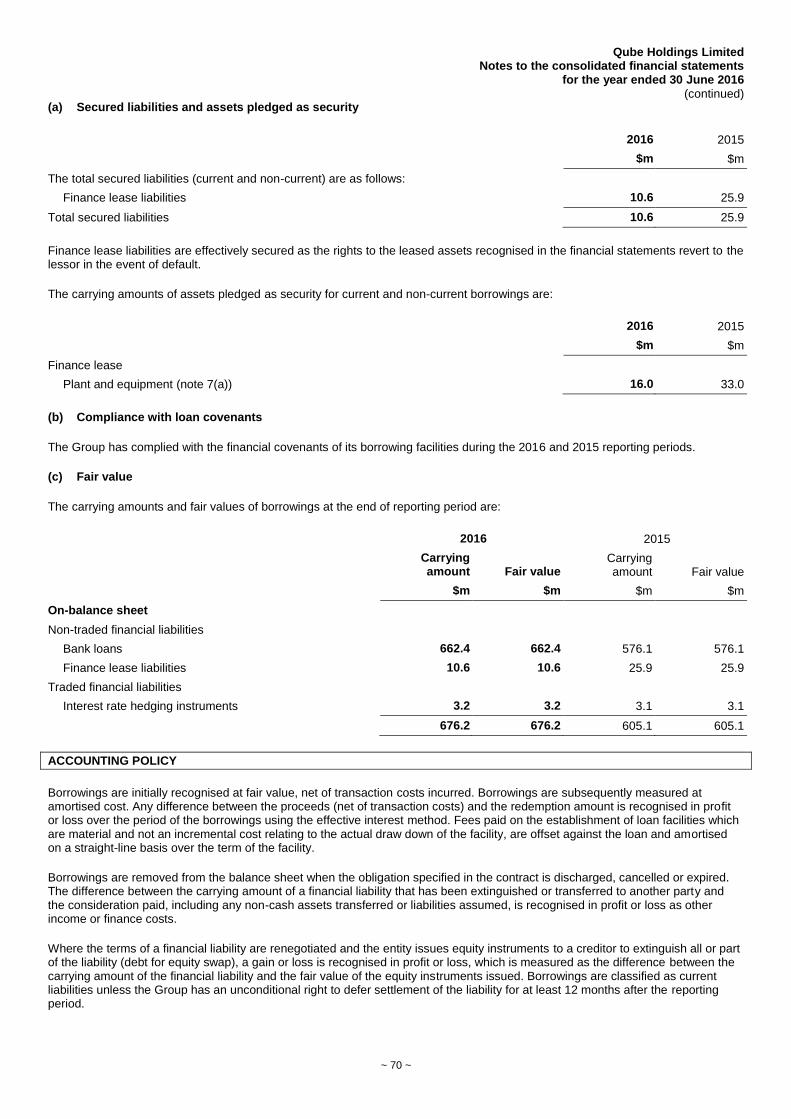
Qube Holdings Limited Notes to the consolidated financial statements
for the year ended 30 June 2016
(continued)
~ 70 ~
(a) Secured liabilities and assets pledged as security
2016 2015
$m $m
The total secured liabilities (current and non-current) are as follows:
Finance lease liabilities 10.6 25.9
Total secured liabilities 10.6 25.9
Finance lease liabilities are effectively secured as the rights to the leased assets recognised in the financial statements revert to the lessor in the event of default.
The carrying amounts of assets pledged as security for current and non-current borrowings are:
2016 2015
$m $m
Finance lease
Plant and equipment (note 7(a)) 16.0 33.0
(b) Compliance with loan covenants
The Group has complied with the financial covenants of its borrowing facilities during the 2016 and 2015 reporting periods.
(c) Fair value
The carrying amounts and fair values of borrowings at the end of reporting period are:
2016 2015
Carrying amount Fair value
Carrying amount Fair value
$m $m $m $m
On-balance sheet
Non-traded financial liabilities
Bank loans 662.4 662.4 576.1 576.1
Finance lease liabilities 10.6 10.6 25.9 25.9
Traded financial liabilities
Interest rate hedging instruments 3.2 3.2 3.1 3.1
676.2 676.2 605.1 605.1
ACCOUNTING POLICY
Borrowings are initially recognised at fair value, net of transaction costs incurred. Borrowings are subsequently measured at amortised cost. Any difference between the proceeds (net of transaction costs) and the redemption amount is recognised in profit or loss over the period of the borrowings using the effective interest method. Fees paid on the establishment of loan facilities which are material and not an incremental cost relating to the actual draw down of the facility, are offset against the loan and amortised on a straight-line basis over the term of the facility.
Borrowings are removed from the balance sheet when the obligation specified in the contract is discharged, cancelled or expired. The difference between the carrying amount of a financial liability that has been extinguished or transferred to another party and the consideration paid, including any non-cash assets transferred or liabilities assumed, is recognised in profit or loss as other income or finance costs.
Where the terms of a financial liability are renegotiated and the entity issues equity instruments to a creditor to extinguish all or part of the liability (debt for equity swap), a gain or loss is recognised in profit or loss, which is measured as the difference between the carrying amount of the financial liability and the fair value of the equity instruments issued. Borrowings are classified as current liabilities unless the Group has an unconditional right to defer settlement of the liability for at least 12 months after the reporting period.

Qube Holdings Limited Notes to the consolidated financial statements
for the year ended 30 June 2016
(continued)
~ 71 ~
RISK MANAGEMENT
This section provides information on the Group’s exposure to various financial risks, explains how they affect the Group’s financial position and performance and how the Group manages these risks. Note Page
19. Financial risk management 71 20. Fair value measurement 74
19. Financial risk management
Qube is exposed to credit risk, market risk including interest rate risk and price risk and liquidity risk arising from the financial instruments it holds.
The board of directors is tasked with the risk management process for Qube. The risk management process involves a detailed analysis of cash flows and forecasts. The board of directors undertakes a continuous review of the performance and prospects of Qube. This includes consideration of overall gearing levels and the impact of adverse movements in interest rates, the level and predictability of cash flows to meet debt obligations and capital expenditure, as well as any change in strategy that changes the underlying risk profile of the Group.
The carrying amounts of Qube's financial assets and liabilities at the balance sheet date approximate their fair value.
(a) Credit risk
Credit risk is the risk that a counterparty will fail to perform contractual obligations, either in whole or in part, under a contract.
Qube is exposed to credit risk as a result of its deposits with banks and money market securities. Qube mitigates credit risk arising from these investments by investing only in term deposits and money market securities issued by the major domestic banks. In relation to trade receivables, where possible, Qube only transacts with credit worthy customers and then continually reviews the outstanding amounts for impairment as set out in note 6.
Other than as set out in note 6 and 31(f) no financial assets are impaired nor past due but not impaired at 30 June 2016 (30 June 2015: Nil).
There were no significant concentrations of credit risk to counterparties at 30 June 2016 or 30 June 2015.
The carrying amounts of cash and cash equivalents, receivables, inventories, and money market securities best represent the maximum credit risk exposure at the balance sheet date. The credit quality of these securities is set out in the table below.
2016 2015
$m $m
Cash and cash equivalents
AA- 76.6 88.2
(b) Market risk
(i) Cash flow and fair value interest rate risk
Qube’s primary interest rate risk relates to its variable rate borrowings and cash held on deposit, which expose the Group to cash flow interest rate risk. Qube’s businesses are leveraged to the economy such that movements in interest rates, which typically reflect changes in economic conditions and outlook, are likely to correlate with movements in Qube’s earnings. The primary objectives of Qube’s interest rate risk management strategy therefore are to protect against very large unexpected adverse movements in interest rates which Qube cannot fully offset through its earnings via the use of floating-to-fixed interest rate caps, collars and swaps.

Qube Holdings Limited Notes to the consolidated financial statements
for the year ended 30 June 2016
(continued)
~ 72 ~
Qube's exposure to cash flow interest rate risk is set out in the following table:
2016 2015
$m $m
Bank loans 667.0 581.1
Cash (76.6) (88.2)
Net exposure to cash flow interest rate risk 590.4 492.9
Fair value interest rate risk is the risk that the value of a financial instrument will fluctuate due to changes in market interest rates. Qube's exposure to fair value interest rate risk relates primarily to interest rate hedging instruments referred to above. The Group analyses its interest rate exposure on a dynamic basis.
The sensitivities of Qube’s monetary assets and liabilities to interest rate risk is summarised in (ii) below. The analysis is based on the assumption that interest rates changed +/100 basis points (2015 – +/100 basis points) from the year end rates with all other variables held constant.
(ii) Sensitivity analysis
The following table summarises the sensitivity of Qube’s after tax operating profit and net assets attributable to shareholders to interest rate risk. The reasonably possible movements in the risk variables have been determined based on management’s best estimate, having regard to a number of factors, including historical levels of changes in interest rates, historical correlation of Qube's investments with the relevant benchmark and market volatility. However, actual movements in the risk variables may be greater or less than anticipated due to a number of factors, including unusually large market shocks resulting from changes in the performance of the economies, markets and securities in which Qube invests. As a result, historic variations in risk variables are not a definitive indicator of future variations in the risk variables.
Interest rate risk
-100 bps +100 bps
Profit Equity Profit Equity
2016 $m $m $m $m
Total increase/(decrease) 3.1 3.1 (3.4) (3.4)
2015
Total increase/(decrease) 1.9 1.9 (2.4) (2.4)

Qube Holdings Limited Notes to the consolidated financial statements
for the year ended 30 June 2016
(continued)
~ 73 ~
(c) Liquidity risk
Liquidity risk is the risk that Qube will experience difficulty in either realising assets or otherwise raising sufficient funds to satisfy commitments associated with financial instruments.
The Group manages liquidity risk by maintaining adequate cash reserves, banking facilities and undrawn borrowing facilities and by continuously monitoring forecast and actual cash flows, and where possible matching the maturity profiles of financial assets and liabilities. Set out below is a listing of undrawn facilities that the Group has at its disposal to further reduce liquidity risk.
Financing arrangements
The Group has access to the following undrawn borrowing facilities at the end of the reporting period:
2016 2015
Floating rate $m $m
Expiring within one year - -
Expiring beyond one year* 540.1 175.1
540.1 175.1
* Undrawn facilities adjusted for $22.9 million in bank guarantees (2015: $38.7 million) drawn under the working capital facilities.
Subject to the continuance of satisfactory covenant compliance, the bank loan facilities may be drawn down at any time and have an average maturity of 3.0 years (2015: 4.5 years).
Maturity of financial liabilities
The table below analyses Qube's financial liabilities into relevant maturity groupings based on the remaining period to the earliest possible contractual maturity date at the financial year end date. The amounts in the table are contractual undiscounted cash flows.
Less than 1 month
$m 1-6 months
$m 6-12 months
$m
Greater than 1 year
$m
Consolidated as at 30 June 2016
Trade and other payables 98.5 - - -
Financial liabilities at fair value through profit or loss - - 0.6 1.9
Borrowings 2.4 156.9 4.9 518.2
Total financial liabilities 100.9 156.9 5.5 520.1
Consolidated as at 30 June 2015
Trade and other payables 112.9 - - -
Financial liabilities at fair value through profit or loss - - 0.8 2.2
Borrowings 3.0 7.5 6.6 595.6
Total financial liabilities 115.9 7.5 7.4 597.8

Qube Holdings Limited Notes to the consolidated financial statements
for the year ended 30 June 2016
(continued)
~ 74 ~
20. Fair value measurement
(a) Fair value hierarchy
This section explains the judgements and estimates made in determining the fair values of the financial instruments and non-financial assets that are recognised and measured at fair value in the financial statements. To provide an indication about the reliability of the inputs used in determining fair value, the Group has classified its financial instruments and non-financial assets into the three levels prescribed under the Accounting Standards. An explanation of each level follows:
Level 1 – quoted prices (unadjusted) in active markets for identical assets or liabilities;
Level 2 – inputs other than quoted prices included within level 1 that are observable for the asset or liability, either directly or indirectly; and
Level 3 – inputs for the asset or liability that are not based on observable market data (unobservable inputs).
As a result of Qube’s recent acquisition of Aurizon’s interest in Moorebank, the property was valued on an arm’s length willing buyer willing seller basis. The property was therefore reclassified from Level 3 to Level 2 of the fair value hierarchy given its valuation inputs are now considered observable.
The following table presents the Group’s financial and non-financial assets and liabilities measured and recognised at their fair value at 30 June 2016 on a recurring basis:
Level 1 Level 2 Level 3 Total
At 30 June 2016 $m $m $m $m
Recurring fair value measurements
Assets
Investment properties - 296.7 71.0 367.7
Available-for-sale financial assets 543.7 - - 543.7
Financial assets at fair value through profit or loss 1.0 - - 1.0
Total assets 544.7 296.7 71.0 912.4
Liabilities
Contingent consideration payable - - 2.0 2.0
Derivatives used for hedging - 3.2 - 3.2
Total liabilities - 3.2 2.0 5.2
At 30 June 2015
Recurring fair value measurements
Assets
Investment properties - - 342.0 342.0
Financial assets at fair value through profit or loss 1.0 - - 1.0
Total assets 1.0 - 342.0 343.0
Liabilities
Contingent consideration payable - - 5.4 5.4
Derivatives used for hedging - 3.1 - 3.1
Total liabilities - 3.1 5.4 8.5
There were no transfers between levels 1 and 2 for recurring fair value measurements during the financial year. For transfers in and out of level 3 measurements see (c(iv)) below.
The Group’s policy is to recognise transfers into and transfers out of fair value hierarchy levels as at the end of the reporting period. The Group did not measure any assets or liabilities at fair value on a non-recurring basis as at 30 June 2016 or 30 June 2015.

Qube Holdings Limited Notes to the consolidated financial statements
for the year ended 30 June 2016
(continued)
~ 75 ~
(b) Valuation techniques used to determine fair values
Financial instruments
Specific valuation techniques used to value financial instruments include:
● the use of quoted market prices or dealer quotes for similar financial assets at fair value through profit or loss and available-for-sale financial assets.
● the fair value of interest rate hedging instruments is calculated as the present value of the estimated future cash flows based on observable yield curves.
● other techniques, such as discounted cash flow analysis are used to determine fair value for the remaining financial instruments such as contingent consideration.
All of the resulting fair value estimates are included in levels 1 and 2 except for contingent consideration payable explained in (c) below.
Non-financial assets
The Group obtains independent valuations for its investment properties at least annually. At the end of each reporting period, the directors update their assessment of the fair value of each property, taking into account the most recent valuations performed by an independent valuer who holds a recognised and relevant qualification and any other relevant factors. The directors determine a property’s value within a range of reasonable fair value estimates.
The best evidence of fair value is current prices in an active market for similar properties. Where such information is not available the directors consider information from a variety of sources including independent valuations prepared by third party valuers. These valuations typically include information such as:
● current prices in an active market for properties of different nature or recent prices of similar properties in less active markets, adjusted to reflect those differences;
● term and reversion calculations which reflect the certainty of income to lease expiry, the nature of any current property improvements and any deferred underlying land value and underlying re-development of a property;
● capitalised income projections based upon a property’s estimated net market income, and a capitalisation rate derived from an analysis of market evidence; and
● discounted cash flow projections based on reliable estimates of future cash flows.
The primary valuation methodology for the Group’s Minto investment property was the term and reversion approach, which resulted in fair value estimate for this property being included in level 3.
(c) Fair value measurements using significant unobservable inputs (level 3)
Financial instruments
(i) Transfers between levels 2 and 3 and changes in valuation techniques
There were no transfers between the levels of the fair value hierarchy for financial instruments in year ended 30 June 2016 (30 June 2015: Nil).
Further, in the current year there were also no changes made to any of the valuation techniques applied as of 30 June 2015.
(ii) Valuation inputs and relationships to fair value
Contingent consideration
Actual consideration payable is contingent on certain future conditions including financial results, warranty periods and volume related targets. The minimum amount payable is $nil, and the maximum is $25.8 million over the relevant period.
(iii) Valuation processes
The finance department of the Group performs the valuations of non-property assets required for financial reporting purposes, including level 3 fair values. This team reports directly to the Chief Financial Officer (CFO). Discussions of valuation processes and

Qube Holdings Limited Notes to the consolidated financial statements
for the year ended 30 June 2016
(continued)
~ 76 ~
results are held between the CFO and the Audit and Risk Management Committee at least once every six months, in line with the Group’s reporting dates.
The main level 3 inputs used by the Group in measuring the fair value of financial instruments are derived and evaluated as follows:
● discount rates: these are determined using the weighted average cost of capital model to calculate a post-tax rate that reflects current market assessments of the time value of money and the risks specific to the underlying business.
● contingent consideration payable – expected cash outflows: these are estimated based on the terms of the sale contract, the entity’s knowledge of the business and how the current economic environment is likely to impact it.
Material changes in level 2 and 3 fair values are analysed at each reporting date during the half yearly valuation discussion between the CFO, and the Audit and Risk Management Committee. As part of this discussion the CFO presents a report that explains the reason for the fair value movements.
Non-financial assets
The following table presents the changes in level 3 items for the period ended 30 June 2016 for recurring fair value measurements:
Investment properties
$m
Opening balance 1 July 2015 342.0
Depreciation and impairment -
Development expenditure capitalised 14.7
Straight-lining of operating lease rental income (1.8)
Gains recognised in other income* 12.8
Transfer to level 2 – Moorebank Property (296.7)
Closing balance 30 June 2016 71.0
* Unrealised gains recognised in profit or loss attributable to assets held at the end of the reporting period are included in other income.
(iv) Transfers between levels 2 and 3 and changes in valuation techniques
As a result of the Moorebank lease termination in December 2015, a change to the valuation technique that was previously applied to this property was made. This was based on advice received by management from an independent valuer. They recommended that a direct comparison of land value to recent sales would provide a better representation of fair value, taking into consideration expected use of the Moorebank site, recent sales evidence and the liquidity of this market.
The implied value based on the acquisition of Aurizon’s 33% interest is $296.7 million (100%), and given the transaction was at arm’s length with a willing buyer and willing seller, this value has been adopted as the fair value.
(v) Valuation inputs and relationships to fair value
The following table summarises the quantitative information about the significant unobservable inputs used in recurring level 3 fair value measurements. See below for the valuation techniques adopted:
Description
Fair value at 30 June 2016
$m Unobservable inputs
Range of inputs (probability –
weighted average) Relationship of unobservable inputs to fair value
Investment property
71.0 Discount rate 7.00% The higher the discount rate and terminal yield, the lower the fair value Terminal yield 8.25%
Capitalisation rate 8.00% The higher the capitalisation rate and expected vacancy rate, the lower the fair value
Expected vacancy rate -%
Rental growth rate 3.17% The higher the rental growth rate, the higher the fair value

Qube Holdings Limited Notes to the consolidated financial statements
for the year ended 30 June 2016
(continued)
~ 77 ~
(vi) Valuation processes
For level 3 assets, the Group engages external, independent and qualified valuers to determine the fair value of the Group’s investment properties at least annually. As at 30 June 2016, the fair value of investment properties have been determined by Savills.
The main level 3 inputs used by the Group are derived and evaluated as follows: Property assets – discount rates, terminal yields, expected vacancy rates and rental growth rates are estimated by Savills or management based on comparable transactions and industry data.
Changes in level 2 and 3 fair values are analysed at each reporting date during the half-yearly valuation discussion between the CFO and the Audit and Risk Management Committee. As part of this discussion the CFO presents a report that explains the reason for the fair value movements.

Qube Holdings Limited Notes to the consolidated financial statements
for the year ended 30 June 2016
(continued)
~ 78 ~
GROUP STRUCTURE
This section provides information on the Group structure and helps users understand how changes in the Group structure affect the financial position and performance of the Group, including relevant accounting policies applied and critical judgements and estimates used. Note Page
21. Business combinations 78 22. Investments in associates 78 23. Significant investments in subsidiaries 82 24. Non-controlling interests 85
21. Business combinations
On 27 May 2016, Qube acquired the business and assets of the Quality Marshalling, a forestry related marshalling business in New Zealand for a total purchase price of $10.6 million paid in cash (NZ$11.3 million). Goodwill of $2.9 million was recognised on the acquisition, none of which is expected to be deductible for tax purposes. The goodwill is attributable to the strategic advantages and market positioning this acquisition will provide Qube. The acquired business has been immediately integrated into Qube’s existing New Zealand based business from acquisition so it is impracticable and unreliable to report separate revenue and profit contributions for this acquisition.
ACCOUNTING POLICY
The acquisition method of accounting is used to account for all business combinations, regardless of whether equity instruments or other assets are acquired. The consideration transferred for the acquisition of a subsidiary comprises the fair values of the assets transferred, the liabilities incurred and the equity interests issued by the Group. The consideration transferred also includes the fair value of any asset or liability resulting from a contingent consideration arrangement and the fair value of any pre-existing equity interest in the subsidiary.
Acquisition related costs are expensed as incurred. Identifiable assets acquired and liabilities and contingent liabilities assumed in a business combination are, with limited exceptions, measured initially at their fair values at the acquisition date. On an acquisition- by-acquisition basis, the Group recognises any non-controlling interests in the acquiree either at fair value or at the non-controlling interests’ proportionate share of the acquiree’s net identifiable assets.
The excess of the consideration transferred and the amount of any non-controlling interests in the acquiree over the fair value of the Group's share of the net identifiable assets acquired is recorded as goodwill. If those amounts are less than the fair value of the net identifiable assets of the subsidiary acquired and the measurement of all amounts has been reviewed, the difference is recognised directly in profit or loss as a bargain purchase.
Where settlement of any part of cash consideration is deferred, the amounts payable in the future are discounted to their present value as at the date of exchange. The discount rate used is the entity's incremental borrowing rate, being the rate at which a similar borrowing could be obtained from an independent financier under comparable terms and conditions.
Contingent consideration is classified either as equity or a financial liability. Amounts classified as a financial liability are subsequently remeasured to fair value with changes in fair value recognised in profit or loss.
22. Investments in associates
2016 2015
$m $m
Investments in associates 225.8 216.9

Qube Holdings Limited Notes to the consolidated financial statements
for the year ended 30 June 2016
(continued)
~ 79 ~
(a) Movements in carrying amounts
Set out below are the associates and joint ventures of the Group as at 30 June 2016. The entities listed below have share capital/units consisting solely of ordinary shares/units, which are held directly by the Group. The country of incorporation or registration is also their principal place of business, and the proportion of ownership interest is the same as the proportion of voting rights held. All entities are accounted for using the equity method.
Name of entity
Place of business/country of incorporation
% ownership interest Carrying amount
2016 2015 2016 2015
% % $m $m
Australian Amalgamated Terminals Pty Ltd1 Australia 50 50 116.6 115.5
Northern Stevedoring Services Pty Ltd Australia 50 50 24.5 45.7
Prixcar Services Pty Ltd2 Australia 25 25 37.0 33.3
Quattro Grain Trust3 Australia 37.5 37.5 29.4 22.4
TQ Holdings Pty Limited3 Australia 50 - 18.3 -
225.8 216.9
1. Included within Australian Amalgamated Terminal’s liabilities is $49.0 million (2015: $52.5 million) in shareholder loans owed to Qube.
2. Prixcar investment held through Qube’s 50% interest in "K" Line Auto Logistics Pty Ltd.
3. The contribution from the Group’s investment in Quattro Grain Trust and TQ Holdings Pty Limited is considered individually immaterial and is discussed in part (d) below.
(b) Summarised financial information of associates
The tables below provide summarised statutory financial information for those associates that are material to the Group. The information disclosed reflects the amounts presented in the financial statements of the relevant associates and not Qube ’s share of those amounts. They have been amended to reflect the adjustments made by the entity when using the equity method, including fair value adjustments and modifications for differences in accounting policy where material.
Australian Amalgamated
Terminals Pty Ltd Northern Stevedoring
Services Pty Ltd
K Line Auto Logistics
Pty Ltd (Prixcar)
2016 2015 2016 2015 2016 2015
$m $m $m $m $m $m
Summarised balance sheet
Current assets 35.5 28.9 12.4 17.8 0.1 0.1
Non-current assets 79.2 87.2 43.6 47.8 74.0 66.6
Current liabilities (6.0) (9.5) (24.3) (22.6) (0.1) (0.1)
Non-current liabilities (98.9) (105.9) (1.9) (13.4) - -
Net assets 9.8 0.7 29.8 29.6 74.0 66.6
Reconciliation to carrying amounts
Opening net assets 1 July 0.7 2.3 29.6 24.9 66.6 65.4
Profit for the period 17.6 15.2 0.2 4.6 8.5 1.2
Dividends paid (8.5) (16.8) - - (1.1) -
Closing net assets 9.8 0.7 29.8 29.5 74.0 66.6
Group’s share in % 50% 50% 50% 50% 50% 50%
Group’s share in $ 4.9 0.3 14.9 14.8 37.0 33.3
Impairment charge - - (21.3) - - -
Loan to associates 49.0 52.5 - - - -
Goodwill 62.7 62.7 30.9 30.9 - -
Carrying amount 116.6 115.5 24.5 45.7 37.0 33.3
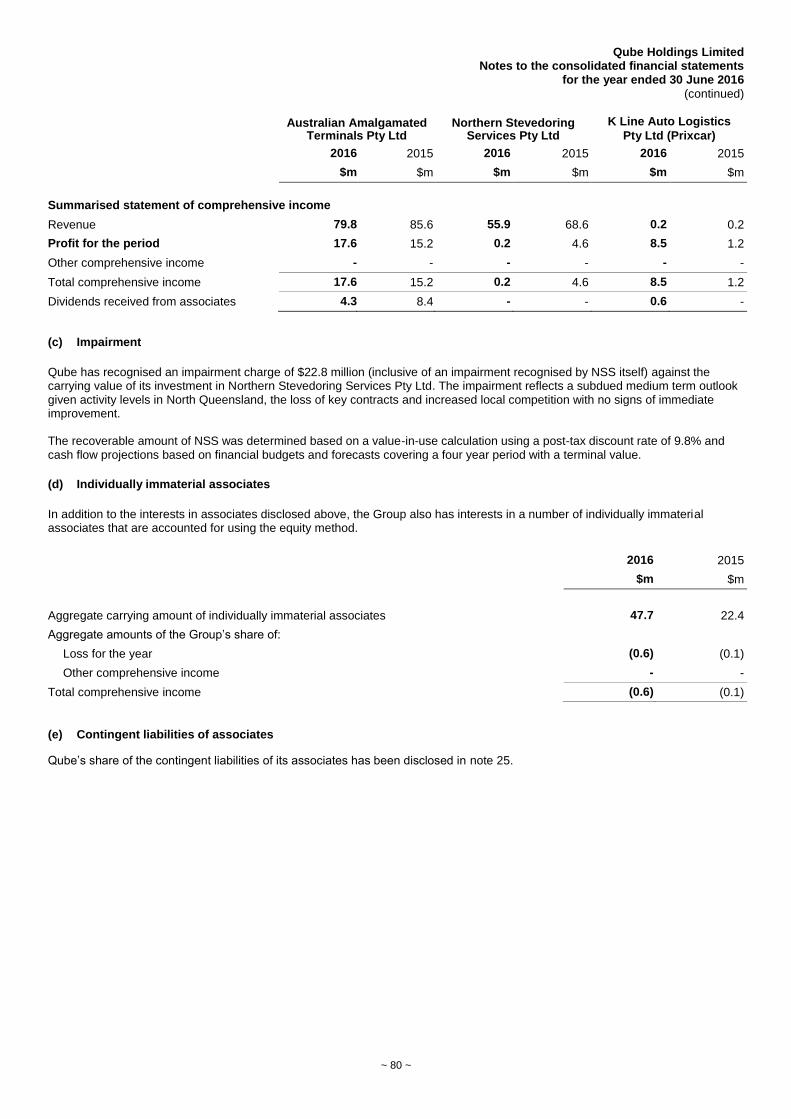
Qube Holdings Limited Notes to the consolidated financial statements
for the year ended 30 June 2016
(continued)
~ 80 ~
Australian Amalgamated
Terminals Pty Ltd Northern Stevedoring
Services Pty Ltd
K Line Auto Logistics
Pty Ltd (Prixcar)
2016 2015 2016 2015 2016 2015
$m $m $m $m $m $m
Summarised statement of comprehensive income
Revenue 79.8 85.6 55.9 68.6 0.2 0.2
Profit for the period 17.6 15.2 0.2 4.6 8.5 1.2
Other comprehensive income - - - - - -
Total comprehensive income 17.6 15.2 0.2 4.6 8.5 1.2
Dividends received from associates 4.3 8.4 - - 0.6 -
(c) Impairment
Qube has recognised an impairment charge of $22.8 million (inclusive of an impairment recognised by NSS itself) against the carrying value of its investment in Northern Stevedoring Services Pty Ltd. The impairment reflects a subdued medium term outlook given activity levels in North Queensland, the loss of key contracts and increased local competition with no signs of immediate improvement. The recoverable amount of NSS was determined based on a value-in-use calculation using a post-tax discount rate of 9.8% and cash flow projections based on financial budgets and forecasts covering a four year period with a terminal value.
(d) Individually immaterial associates
In addition to the interests in associates disclosed above, the Group also has interests in a number of individually immaterial associates that are accounted for using the equity method.
2016 2015
$m $m
Aggregate carrying amount of individually immaterial associates
47.7
22.4
Aggregate amounts of the Group’s share of:
Loss for the year (0.6) (0.1)
Other comprehensive income - -
Total comprehensive income (0.6) (0.1)
(e) Contingent liabilities of associates
Qube’s share of the contingent liabilities of its associates has been disclosed in note 25.

Qube Holdings Limited Notes to the consolidated financial statements
for the year ended 30 June 2016
(continued)
~ 81 ~
ACCOUNTING POLICY
Associates are all entities over which the Group has significant influence but not control or joint control, generally accompanying a shareholding of between 20% and 50% of the voting rights. Investments in associates are accounted for using the equity method of accounting, after initially being recognised at cost. The Group's investment in associates includes goodwill (net of any accumulated impairment loss) identified on acquisition.
The Group's share of its associates' post acquisition profits or losses is recognised in profit or loss and its share of post-acquisition other comprehensive income is recognised in other comprehensive income. The cumulative post acquisition movements are adjusted against the carrying amount of the investment. Dividends received or receivable from associates are recognised as reduction in the carrying amount of the investment.
When the Group's share of losses in an associate equals or exceeds its interest in the associate, including any other unsecured long-term receivables, the Group does not recognise further losses, unless it has incurred obligations or made payments on behalf of the associate.
Unrealised gains on transactions between the Group and its associates are eliminated to the extent of the Group's interest in the associates. Unrealised losses are also eliminated unless the transaction provides evidence of an impairment of the asset transferred. Accounting policies of associates have been changed where necessary to ensure consistency with the policies adopted by the Group.
CRITICAL ACCOUNTING JUDGEMENTS AND ESTIMATES
Estimated impairment of investments accounted for using the equity method
Where indicators of impairment exist, the Group has undertaken a valuation of its investments accounted for using the equity method based on its proportionate ownership of these businesses. The recoverable amount of each investment is determined using a discounted cash flow model which requires the use of assumptions that maybe subject to change. The general valuation assumptions include an average post tax discount rate of 9.6%.
Significant judgement: consolidation of entities with 50% ownership
The directors have concluded that where the Group holds 50% of the voting rights of an entity that this does not in itself confer that the Group has control of that entity. To establish whether control exists, the Group determines whether it is exposed to, or has the rights to, variable returns from its involvement with the entity and has the ability to affect those returns through its power to direct the activities of the entity. In the case of Australian Amalgamated Terminals Pty Ltd, Northern Stevedoring Services Pty Ltd and ’K’ Line Auto Logistics Pty Ltd, the Group does not have the ability to affect returns of these entities without the prior consent of the remaining shareholders.

Qube Holdings Limited Notes to the consolidated financial statements
for the year ended 30 June 2016
(continued)
~ 82 ~
23. Significant investments in subsidiaries
The consolidated financial statements incorporate the assets, liabilities and results of the following subsidiaries:
Name of entity Country of incorporation
Class of shares/units
Equity holding
2016 (%) 2015 (%)
Qube Holdings Limited* Australia Ordinary
Qube Terminals Pty Ltd* Australia Ordinary 100 100
Qube Employee Share Accumulation Plan Pty Ltd Australia Ordinary 100 100
Qube Terminals Investments Pty Ltd Australia Ordinary 100 100
Qube Property Management Services Pty Ltd* Australia Ordinary 100 100
Qube RE Services Pty Ltd Australia Ordinary 100 100
Qube Properties Pty Ltd* Australia Ordinary 100 100
Qube Logistics Trust* Australia Ordinary 100 100
Qube Equity Ltd* Australia Ordinary 100 100
Qube Agri Investments Pty Ltd* Australia Ordinary 100 100
Qube Bulk Liquids Pty Ltd* Australia Ordinary 100 100
KIL Property Investments Pty Ltd* Australia Ordinary 100 100
KFM Property Logistics 1 Pty Ltd* Australia Ordinary 100 100
Minto Properties Pty Ltd* Australia Ordinary 100 100
Moorebank Industrial Property Trust Australia Ordinary 66.67 66.67
KW Auto Logistics Pty Ltd* Australia Ordinary 100 100
K-NSS Pty Ltd* Australia Ordinary 100 100
Oversea & General Stevedoring Co Pty Ltd* Australia Ordinary 100 100
K-AA Terminals Pty Ltd* Australia Ordinary 100 100
P&O Wharf Management Pty Ltd* Australia Ordinary 100 100
Jingle SPV1 Pty Ltd Australia Ordinary 100 -
Jingle SPV2 Pty Ltd Australia Ordinary 100 -
Qube RE Services (No.2) Pty Ltd Australia Ordinary 100 -
Qube MB Warehousing Pty Ltd Australia Ordinary 100 -
Moorebank Intermodal Hold Trust Australia Ordinary 66.67 -
Moorebank Intermodal Investment Trust Australia Ordinary 66.67 -
Qube Moorebank Warehousing Trust Australia Ordinary 66.67 -
Moorebank Industrial Warehouse Hold Trust Australia Ordinary 66.67 -
Moorebank Industrial Warehouse Trust Australia Ordinary 66.67 -
Moorebank Industrial Terminals Asset Hold Trust Australia Ordinary 66.67 -
Moorebank Industrial Terminals Asset Trust Australia Ordinary 66.67 -
Moorebank Industrial Terminals Operations Hold Trust Australia Ordinary 66.67 -
Moorebank Industrial Terminals Operations Trust Australia Ordinary 66.67 -
Qube Ports & Bulk:
K-POAGS Pty Ltd* Australia Ordinary 100 100
KFM Logistics Investments 2 Pty Ltd* Australia Ordinary 100 100
Qube Ports Pty Ltd* Australia Ordinary 100 100
Qube Ports & Bulk subsidiaries:
Qube Ports (No 1) Pty Ltd* Australia Ordinary 100 100
Qube Bulk Pty Ltd* Australia Ordinary 100 100
Qube Energy Pty Ltd* Australia Ordinary 100 100
Markhaven Pty Ltd* Australia Ordinary 100 100
Qube Defence Logistics Pty Ltd* Australia Ordinary 100 100

Qube Holdings Limited Notes to the consolidated financial statements
for the year ended 30 June 2016
(continued)
~ 83 ~
Name of entity Country of incorporation
Class of shares/units
Equity holding
2016 (%) 2015 (%)
Stonecrest Enterprises Pty Ltd* Australia Ordinary 100 100
Giacci Holdings Pty Ltd* Australia Ordinary 100 100
Giacci Port Services Pty Ltd* Australia Ordinary 100 100
Giacci Limestone Pty Ltd* Australia Ordinary 100 100
Giacci Group Operations Pty Ltd* Australia Ordinary 100 100
Giacci SA Pty Ltd* Australia Ordinary 100 100
Giacci Bros. Pty Ltd* Australia Ordinary 100 100
Giacci Management Services Pty Ltd* Australia Ordinary 100 100
Giacci NT Pty Ltd* Australia Ordinary 100 100
Giacci Contracting Pty Ltd* Australia Ordinary 100 100
Jamlewin Enterprises Pty Ltd* Australia Ordinary 100 100
Qube Learning Pty Ltd Australia Ordinary 100 100
W Qube Port of Dampier Pty Ltd* Australia Ordinary 100 100
Beaumont Transport Pty Ltd* Australia Ordinary 100 100
BBH Services Pty Ltd* Australia Ordinary 100 100
Latot Pty Ltd* Australia Ordinary 100 100
Norsea Qube Logistics Pty Ltd Australia Ordinary 100 100
Oztran Aust Pty Ltd* Australia Ordinary 100 100
Oztran Assets Pty Ltd* Australia Ordinary 100 100
Stanton Oztran Pty Ltd* Australia Ordinary 100 100
Australian Heavy Logistics Pty Ltd* Australia Ordinary 100 100
ISO Marshalling Pty Limited Australia Ordinary 100 100
ISO Marshalling (Australia) LP Australia Ordinary 100 100
NZ Bidco Ltd New Zealand Ordinary 100 100
ISO Ltd New Zealand Ordinary 100 100
Cargo Marshalling Solutions Pty Ltd Australia Ordinary 100 100
Marshalling Associates Pty Ltd Australia Ordinary 100 100
Bulk Solutions Limited New Zealand Ordinary 50 50
Marshalling Solutions LLC United States Ordinary 100 100
International Stevedoring Operations Limited New Zealand Ordinary 100 100
ISO Marshalling Limited New Zealand Ordinary 100 100
ISO Solutions Limited New Zealand Ordinary 100 100
ISO Transport Limited New Zealand Ordinary 100 100
Cargo Marshalling Solutions Ltd New Zealand Ordinary 100 100
Marshalling Solutions Ltd New Zealand Ordinary 100 100
ISO Logistics Limited New Zealand Ordinary 100 100
ISO New Zealand Limited New Zealand Ordinary 100 100
ISO Stevedoring Limited New Zealand Ordinary 100 100
ISO Warehousing Limited New Zealand Ordinary 100 100
Qube International Pte Ltd Singapore Ordinary 100 -
Qube Logistics:
K-POTA Pty Ltd* Australia Ordinary 100 100
Qube Logistics (Aust) Pty Ltd* Australia Ordinary 100 100
Qube Logistics subsidiaries:
Qube Logistics (Qld) Pty Ltd* Australia Ordinary 100 100
Qube Logistics (Global) Pty Ltd* Australia Ordinary 100 100
POTA Global Management (NZ) Limited New Zealand Ordinary 100 100

Qube Holdings Limited Notes to the consolidated financial statements
for the year ended 30 June 2016
(continued)
~ 84 ~
Name of entity Country of incorporation
Class of shares/units
Equity holding
2016 (%) 2015 (%)
Qube Logistics (SB) Pty Ltd * Australia Ordinary 100 100
Qube Logistics (NSW) Pty Ltd* Australia Ordinary 100 100
Qube Logistics (QldT) Pty Ltd* Australia Ordinary 100 100
Qube Logistics (QldT1) Pty Ltd* Australia Ordinary 100 100
Qube Logistics (QldT2) Pty Ltd* Australia Ordinary 100 100
Qube Logistics (QldT3) Pty Ltd* Australia Ordinary 100 100
Qube Logistics (QldT4) Pty Ltd* Australia Ordinary 100 100
Qube Logistics (QldT5) Pty Ltd* Australia Ordinary 100 100
Qube Logistics (QldT6) Pty Ltd* Australia Ordinary 100 100
Qube Logistics (Vic) Pty Ltd* Australia Ordinary 100 100
Qube Logistics (WA) Pty Ltd* Australia Ordinary 100 100
Qube Logistics (WA1) Pty Ltd* Australia Ordinary 100 100
Qube Logistics (H&S) Pty Ltd* Australia Ordinary 100 100
Qube Logistics (Rail) Pty Ltd* Australia Ordinary 100 100
Qube Logistics (SA) Pty Ltd* Australia Ordinary 100 100
Qube Logistics (SA1) Pty Ltd* Australia Ordinary 100 100
Macarthur Intermodal Shipping Terminal Pty Ltd* Australia Ordinary 100 100
Independent Railways of Australia Pty Ltd* Australia Ordinary 100 100
Independent Railroad of Australia Pty Ltd* Australia Ordinary 100 100
Rail Equipment Leasing Pty Ltd* Australia Ordinary 100 100
Bowport All Roads Transport Pty Ltd* Australia Ordinary 100 100
Indy Equipment Pty Ltd* Australia Ordinary 100 100
Qube Logistics (WA2) Pty Ltd* Australia Ordinary 100 100
Qube Logistics (SL)Pty Ltd* Australia Ordinary 100 100
* These subsidiaries have taken advantage of relief from the necessity to prepare financial reports in accordance with ASIC Corporations instrument 98/1418 issued by the Australian Securities and Investments Commission. For further information refer to note 34.
ACCOUNTING POLICY
Principles of consolidation
Subsidiaries are all entities (including structured entities) over which the Group has control. The Group controls an entity when the Group is exposed to, or has rights to, variable returns from its involvement with the entity and has the ability to affect those returns through its power to direct the activities of the entity.
Subsidiaries are fully consolidated from the date on which control is transferred to the Group. They are de-consolidated from the date that control ceases.
The acquisition method of accounting is used to account for business combinations by the Group (refer to note 21).
Intercompany transactions, balances and unrealised gains on transactions between Group companies are eliminated. Unrealised losses are also eliminated unless the transaction provides evidence of the impairment of the asset transferred. Accounting policies of subsidiaries have been changed where necessary to ensure consistency with the policies adopted by the Group.
Non-controlling interests in the results and equity of subsidiaries are shown separately in the consolidated statement of comprehensive income, statement of changes in equity and balance sheet respectively.

Qube Holdings Limited Notes to the consolidated financial statements
for the year ended 30 June 2016
(continued)
~ 85 ~
Changes in ownership interests
The Group treats transactions with non-controlling interests that do not result in a loss of control as transactions with owners of the Group. A change in ownership interest results in an adjustment between the carrying amounts of the controlling and non-controlling interests to reflect their relative interests in the subsidiary. Any difference between the amount of the adjustment to non-controlling interests and any consideration paid or received is recognised in a separate reserve within equity attributable to owners of Qube.
When the Group ceases to have control, joint control or significant influence, any retained interest in the entity is remeasured to its fair value with the change in carrying amount recognised in profit or loss. The fair value is the initial carrying amount for the purposes of subsequently accounting for the retained interest as an associate, jointly controlled entity or financial asset. In addition, any amounts previously recognised in other comprehensive income in respect of that entity are accounted for as if the Group had directly disposed of the related assets or liabilities. This may mean that amounts previously recognised in other comprehensive income are reclassified to profit or loss. If the ownership interest in an associate is reduced, but significant influence is retained, only a proportionate share of the amounts previously recognised in other comprehensive income are reclassified to profit or loss where appropriate.
24. Non-controlling interests
(a) Non-controlling interests (‘NCI’) share of equity
2016 2015
$m $m
Interest in:
Share capital 111.8 107.8
Reserves - -
Retained losses (13.6) (17.0)
98.2 90.8
(b) Summarised financial information
Set out below is summarised financial information for each subsidiary that has non-controlling interests that are material to the Group. The amounts disclosed for each subsidiary are before intercompany eliminations.
2016 2015
Moorebank Industrial Property Trust $m $m
Summarised balance sheet
Current assets 3.9 2.7
Current liabilities (5.3) (1.5)
Current net (liabilities)/assets (1.4) 1.2
Non-current assets 296.7 272.0
Non-current liabilities - -
Non-current net assets 296.7 272.0
Net assets 295.3 273.2
Accumulated NCI 98.2 90.8
Summarised statement of comprehensive income
Revenue and other income 46.0 42.2
Profit for the period 40.4 35.4
Other comprehensive income - -
Total comprehensive income 40.4 35.4
Profit allocated to NCI 10.5 10.0
Distributions paid to NCI 10.1 5.7

Qube Holdings Limited Notes to the consolidated financial statements
for the year ended 30 June 2016
(continued)
~ 86 ~
2016 2015
Moorebank Industrial Property Trust $m $m
Summarised cash flows
Cash flows from operating activities 28.9 16.9
Cash flows from investing activities (11.6) (6.1)
Cash flows from financing activities (17.0) (14.0)
Net increase/(decrease) in cash and cash equivalents 0.3 (3.2)
UNRECOGNISED ITEMS
The section provides information about items that are not recognised in the financial statements but could potentially have a significant impact on the Group’s financial position and performance. Note Page
25. Contingencies 86 26. Commitments 86 27. Events occurring after the reporting period 88
25. Contingencies
Contingent liabilities
Guarantees
The parent entity has provided unsecured bank guarantees amounting to $28.9 million (2015: $38.7 million).
Qube has provided a guarantee on behalf of Northern Stevedoring Services Pty Limited for the lower of $6 million or 50% (2015: $6 million or 50%) of the funds advanced to them.
26. Commitments
(a) Capital commitments
Capital expenditure contracted for at the end of each reporting period but not recognised as liabilities is as follows:
2016 2015
$m $m
Payable:
Within one year 36.4 29.9
Later than one year but not later than five years - -
Later than five years - -
36.4 29.9
The above balance comprises capital expenditure for rolling stock and capital expenditure required for contracted works.

Qube Holdings Limited Notes to the consolidated financial statements
for the year ended 30 June 2016
(continued)
~ 87 ~
(b) Lease commitments – Group as lessee
(i) Non-cancellable operating leases
The Group has non-cancellable operating leases in relation to plant, equipment and motor vehicles expiring within one to five years. The leases have varying terms including fully-maintained or non-maintained, escalation clauses and renewal rights. On renewal, the terms of the leases are renegotiated.
It also has non-cancellable operating leases in relation to land, warehouses, rail terminals and offices expiring within one to twenty five years. The leases have varying terms, escalation clauses and renewal rights. Limited excess occupancy spaces are sub-let to third parties also under non-cancellable operating leases or on a casual rental basis.
2016 2015
$m $m
Commitments for minimum lease payments in relation to non-cancellable operating leases are payable as follows:
Within one year 54.2 61.1
Later than one year but not later than five years 139.9 134.0
Later than five years 119.8 134.5
313.9 329.6
Sub-lease payments
Future minimum lease payments expected to be received in relation to non-cancellable sub-leases of operating leases 2.0 2.6
(ii) Finance leases
The Group leases various plant and equipment with a carrying amount of $16.0 million (2015: $33.0 million) under finance leases expiring within three to five years. Under the terms of the leases, the Group has the option to acquire the leased assets for an agreed residual value on expiry of the leases.
2016 2015
$m $m
Commitments in relation to finance leases are payable as follows:
Within one year 6.6 13.5
Later than one year but not later than five years 4.4 14.1
Later than five years - -
Minimum lease payments 11.0 27.6
Future finance charges (0.4) (1.7)
Total lease liabilities 10.6 25.9
The present value of finance lease liabilities is as follows (note 18):
Current - within one year 9.4 12.3
Non-current - later than one year but not later than five years 1.2 13.6
Present value of minimum lease payments 10.6 25.9
There are no other outstanding contingent assets and liabilities or commitments as at 30 June 2016 (2015: Nil).
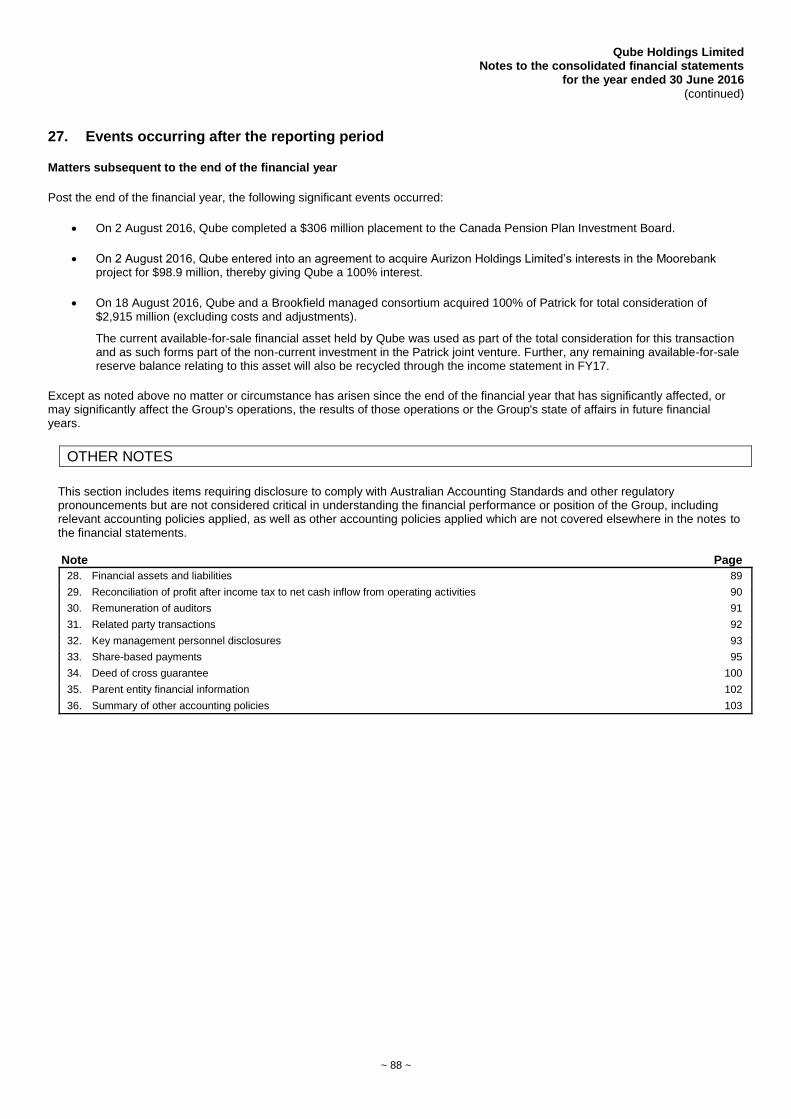
Qube Holdings Limited Notes to the consolidated financial statements
for the year ended 30 June 2016
(continued)
~ 88 ~
27. Events occurring after the reporting period
Matters subsequent to the end of the financial year
Post the end of the financial year, the following significant events occurred:
On 2 August 2016, Qube completed a $306 million placement to the Canada Pension Plan Investment Board.
On 2 August 2016, Qube entered into an agreement to acquire Aurizon Holdings Limited’s interests in the Moorebank project for $98.9 million, thereby giving Qube a 100% interest.
On 18 August 2016, Qube and a Brookfield managed consortium acquired 100% of Patrick for total consideration of $2,915 million (excluding costs and adjustments).
The current available-for-sale financial asset held by Qube was used as part of the total consideration for this transaction and as such forms part of the non-current investment in the Patrick joint venture. Further, any remaining available-for-sale reserve balance relating to this asset will also be recycled through the income statement in FY17.
Except as noted above no matter or circumstance has arisen since the end of the financial year that has significantly affected, or may significantly affect the Group's operations, the results of those operations or the Group's state of affairs in future financial years.
OTHER NOTES
This section includes items requiring disclosure to comply with Australian Accounting Standards and other regulatory pronouncements but are not considered critical in understanding the financial performance or position of the Group, including relevant accounting policies applied, as well as other accounting policies applied which are not covered elsewhere in the notes to the financial statements. Note Page
28. Financial assets and liabilities 89 29. Reconciliation of profit after income tax to net cash inflow from operating activities 90 30. Remuneration of auditors 91 31. Related party transactions 92 32. Key management personnel disclosures 93 33. Share-based payments 95 34. Deed of cross guarantee 100 35. Parent entity financial information 102 36. Summary of other accounting policies 103

Qube Holdings Limited Notes to the consolidated financial statements
for the year ended 30 June 2016
(continued)
~ 89 ~
28. Financial assets and liabilities
2016 2015
$m $m
Available-for-sale financial assets
Current assets - Listed equity securities 543.7 -
Derivative financial instruments
Current liabilities - Interest rate hedging contracts 0.7 0.8
Non-current liabilities - Interest rate hedging contracts 2.5 2.3
(i) Available-for-sale financial assets
Investments are designated as available-for-sale financial assets if they do not have fixed maturities and fixed or determinable payments. These securities relate to the Group’s investment in Asciano shares at 30 June 2016. These shares will be disposed of as part of the Patrick Terminals acquisition. Financial assets are presented as non-current assets unless they mature, or management intends to dispose of them within 12 months of the end of the reporting period.
(ii) Derivative instruments used by the Group
The Group is party to derivative financial instruments in the normal course of business in order to hedge exposure to fluctuations in interest rates in accordance with the Group’s financial risk management policies (refer to note 19).
Bank loans of the Group currently bear an average variable interest rate of 3.85% including margin and commitment fees. It is Group policy to protect part of the loans from exposure to increasing interest rates. Accordingly, the Group has entered into interest rate hedging instruments under which depending on the level of floating interest rates, it is obliged to pay interest at fixed rates. Instruments in place cover approximately 31.7% (2015: 39.4%) of the variable loan principal outstanding and have a weighted average minimum and maximum base rate of 2.55% and 4.33% respectively. The current weighted average base rate of the hedges is 2.56%.
Hedges with a notional principal totalling $70 million have forward start dates commencing in FY18. Excluding these forward starts hedging covered approximately 26% of the floating rate loan principal.
(iii) Risk exposures and fair value measurements
The maximum exposure to credit risk at the end of each reporting period is the carrying amount of each class of derivative mentioned above. Information about the Group’s methods and assumptions used in determining fair value is provided in note 20.
ACCOUNTING POLICY
Derivatives are initially recognised at fair value on the date a derivative contract is entered into and are subsequently remeasured to their fair value at the end of each reporting period. The accounting for subsequent changes in fair value depends on whether the derivative is designated as a hedging instrument, and if so, the nature of the item being hedged.
The Group does not look to designate its derivatives as hedging instruments for accounting purposes. Therefore changes in the fair value of these derivative instruments are recognised immediately in profit or loss and are included in other income or other expenses.
Available-for-sale financial assets are initially carried at fair value plus transaction costs. The Group assesses at the end of each reporting period whether there is objective evidence that the asset is impaired. A significant or prolonged decline in the fair value of the security below its cost is considered an indicator that the asset is impaired. Gains and losses arising from subsequent changes in fair value are recognised directly in the available-for-sale financial asset reserve in equity until the asset is derecognised or impaired, at which time the cumulative gain or loss is recognised in the income statement.

Qube Holdings Limited Notes to the consolidated financial statements
for the year ended 30 June 2016
(continued)
~ 90 ~
29. Reconciliation of profit after income tax to net cash inflow from operating activities
2016 2015
$m $m
(a) Net cash inflow from operating activities
Profit for the year 92.5 95.9
Depreciation and amortisation 101.5 103.5
Non-cash employee benefits expense – share-based payments 6.5 3.8
Fair value adjustment to investment properties (12.8) (27.0)
Fair value losses/(gains) on financial assets at fair value through profit or loss 0.1 (0.1)
Impairments of non-current assets 21.3 44.9
Reversal of impairment of property, plant and equipment (17.6) -
Loss/(profit) on sale of property plant and equipment 0.2 (0.5)
Share of profits of associates (net of dividends received) (7.8) (2.0)
Write-off of borrowing costs due to change in loan facility - 1.3
Change in operating assets and liabilities, net of effects from purchase of controlled entities:
Decrease/(increase) in trade debtors and other receivables 14.8 (0.4)
(Increase)/decrease in inventories (0.4) 0.7
Decrease in financial instruments at fair value through profit or loss - 1.2
Decrease/(increase) in deferred tax assets 6.7 (13.2)
Decrease in trade creditors (12.5) (1.5)
Increase/(decrease) in other operating liabilities 4.1 (27.5)
Decrease in provision for income taxes payable (5.8) (6.2)
Decrease in deferred tax liabilities - (1.9)
Decrease in other provisions (8.5) (1.4)
Net cash inflow from operating activities 182.3 169.6
(b) Non-cash investing and financing activities
The following items were financed through the issue of Qube shares:
Dividend reinvestment plan 12.3 14.6
12.3 14.6

Qube Holdings Limited Notes to the consolidated financial statements
for the year ended 30 June 2016
(continued)
~ 91 ~
30. Remuneration of auditors
During the financial year the following fees were paid or payable for services provided by the auditor of the parent entity, its related practices and non-related audit firms:
2016 2015
$’000 $’000
(a) PwC Australia
(i) Audit and other assurance services
- Audit and review of financial statements 605.6 581.7
- Audit of other subsidiary financial statements - 30.2
Total remuneration for audit and other assurance services 605.6 611.9
(ii) Taxation services
- Tax compliance services 98.7 220.0
- Tax advisory services 400.6 324.7
Total remuneration for taxation services 499.3 544.7
(iii) Other services
- Due diligence services 2,301.6 -
- Other services 174.8 130.0
Total remuneration for other services 2,476.4 130.0
Total remuneration of PwC Australia 3,581.3 1,286.6
(b) Non-PwC audit firms
(i) Audit and other assurance services – audit and review of financial statements 38.1 36.0
Total remuneration of non-PwC audit firms 38.1 36.0
Total auditors’ remuneration 3,619.4 1,322.6

Qube Holdings Limited Notes to the consolidated financial statements
for the year ended 30 June 2016
(continued)
~ 92 ~
31. Related party transactions
(a) Parent entity
The ultimate parent entity and ultimate controlling party of the Group is Qube Holdings Limited.
(b) Subsidiaries
Interests in subsidiaries are set out in note 23.
(c) Key management personnel
Disclosure relating to key management personnel are set out in note 32.
(d) Transactions with other related parties
The following transactions occurred with related parties:
2016 2015
$m $m
Stevedoring services
received from other related entities 38.6 42.1
paid to associates 33.6 40.6
Fuel services
paid to associates 10.1 -
Rental income
from associates 5.1 5.6
Dividend income
from associates 4.8 8.4
(e) Outstanding balances arising from sales/purchases of goods and services
The following balances are outstanding at the end of each reporting period in relation to transactions with related parties:
2016 2015
$m $m
Current receivables (provision of services)
Associates and other related parties 4.6 6.4
Current payables (payment for services)
Associates and other related parties 5.8 9.0

Qube Holdings Limited Notes to the consolidated financial statements
for the year ended 30 June 2016
(continued)
~ 93 ~
(f) Loans to related parties
2016 2015
$m $m
Loans from Qube Holdings Limited to key management personnel
Beginning of the year 9.5 10.3
Loans repaid (0.7) (0.8)
Interest charged 0.4 0.4
Interest paid (0.4) (0.4)
End of year 8.8 9.5
Loans to other associated entities are considered part of the Group’s investment in associates.
Loan repayments of $3.5 million (2015: Nil) were received from an associated entity during the year.
There is no allowance account for impaired receivables in relation to any outstanding balances.
(g) Terms and conditions
Transactions relating to dividends and subscription for new ordinary shares were on the same terms and conditions that applied to other shareholders.
All other transactions were made on normal commercial terms and conditions and at market rates.
32. Key management personnel disclosures
(a) Key management personnel compensation
2016 2015
$’000 $’000
Short-term employee benefits 5,076.9 6,128.7
Post-employment benefits 176.5 173.3
Long-term benefits 147.3 20.0
Share-based payments 2,356.5 1,763.5
7,757.2 8,085.5
Detailed remuneration disclosures are provided in the Remuneration Report.
(b) Equity instrument disclosures relating to key management personnel
The numbers of ordinary shares in the Company held during the financial year by each director of Qube Holdings Limited and other key management personnel of the Group, including their personally related parties, are set out below.
2016
Balance at the beginning of
the year
Received during the year as part
of ELTIP Other changes during the year
Balance at the end of the year
Directors of Qube Holdings Limited 24,045,187 - 414,014 24,459,201
Other key management personnel of the Group 3,892,008 - (504,076) 3,387,932
2015
Directors of Qube Holdings Limited 31,205,520 - (7,160,333) 24,045,187
Other key management personnel of the Group 5,053,525 - (1,161,517) 3,892,008

Qube Holdings Limited Notes to the consolidated financial statements
for the year ended 30 June 2016
(continued)
~ 94 ~
(c) Loans to key management personnel
Aggregates of loans made to directors of Qube Holdings Limited and other key management personnel of the Group, including their personally related parties, are set out below.
Balance
at the beginning of
the year
Loans granted
during the year
Loans repaid during
the year
Interest paid and payable for the year
Interest not charged
Balance at the end of
the year
Number in Group at the
end of the year
$’000 $’000 $’000 $’000 $’000 $’000
2016 9,512.7 - (756.8) 354.8 - 8,755.9 5*
2015 10,467.5 - (954.8) 368.1 - 9,512.7 5
* Includes Don Smithwick who ceased to be a KMP on 30 June 2016 when he retired.

Qube Holdings Limited Notes to the consolidated financial statements
for the year ended 30 June 2016
(continued)
~ 95 ~
33. Share-based payments
(a) Performance Rights and Options
Qube has granted Long-Term Incentives (LTIs) in the form of Performance Rights and Options to incentivise and retain key executives to achieve share value based objectives that are subject to performance conditions tied directly to shareholder wealth creation. During FY16 Qube granted a Moorebank specific Long-Term Incentives (LTIs) in the form of Performance Rights and Options to incentivise and retain key executives.
The key terms and conditions for the LTIs are described below:
Participation The Managing Director, other KMP and other executives who can directly influence the performance of Qube.
Instrument Performance Right or Option (representing an entitlement to one ordinary Qube share) on achievement of certain performance conditions.
Performance condition
25% of Performance Rights and Options are subject to a Total Shareholder Return Hurdle (TSR Performance Rights and Options) and 75% are subject to an Earnings Per Share Hurdle (EPS Performance Rights and Options).
Moorebank specific:
50% of Performance Rights and Options are subject to an Annual Shareholder Return Hurdle (ASR Performance Rights and Options) and 50% are subject to a Key Performance Indicator (KPI Performance Rights and Options).
Exercise price Nil
Options - 20 day VWAP up to and including one day prior to issue.
Performance period/vesting date
3 years after grant date (with retesting annually for another two years for any EPS Performance Rights and Options that have not vested over the extended period).
Moorebank specific:
3 years after grant date (with retesting annually for another two years for any ASR Performance Rights and Options that have not vested and tested over the extended period).
Expiry date TSR Performance Rights: 3 years after grant date.
EPS Performance Rights: 3 years after grant date (with retesting for another 2 years).
Moorebank specific:
ASR and KPI Performance Rights: 3 years after grant date
ASR and KPI Options: 3 years after grant date (with retesting for another 2 years).
Dividends The holder is entitled to an amount equal to the dividends that would have been paid on the vested Performance Rights (as if they held Qube shares) for the period from the Grant Date to the Vesting Date. This amount is settled in Qube shares. No amount is payable for Performance Rights that do not vest.
TSR Hurdle The TSR Performance Rights will vest depending upon Qube’s total shareholder return (share price increase and dividend) during the relevant performance period.
The TSR Hurdle is based on Qube’s relative TSR performance as compared to the other companies in the S&P ASX 200 Index.
The vesting schedule is as follows:
● Nil – if Qube’s TSR ranks less than the 50th percentile
● 50% – if Qube’s TSR is equal to the 50th percentile
● Pro-rated between 50% and 100% – if Qube’s TSR ranks greater than the 50th percentile but less than the 75th percentile
● 100% – if Qube’s TSR ranks at the 75th percentile or higher
EPS Hurdle The EPS Performance Rights will vest depending upon Qube’s underlying EPS performance during the relevant performance period. For both the FY14 and FY15 grants under the plan the maximum vesting opportunity was a CAGR of 9% in EPS. If Qube’s CAGR in EPS for the relevant performance period (based on the respective 30 June reported financial results) is:
● less than the minimum EPS target, no EPS Performance Rights will vest;
● equal to, or greater than, the EPS target, 100% of the EPS Performance Rights will vest; or
● greater than the minimum EPS target but less than the EPS target, the percentage of EPS Performance Rights that vest will be pro-rated on a straight-line basis between 0% and 100%.
If any of the EPS Performance Rights have not vested at the end of three years, they will be carried forward to the following year and retested based on a four year period. Any EPS Performance Rights that remain unvested then will be carried forward and retested on the basis of a five year period. Any unvested EPS Performance Rights will lapse at the end of the five years.

Qube Holdings Limited Notes to the consolidated financial statements
for the year ended 30 June 2016
(continued)
~ 96 ~
Moorebank specific hurdles:
ASR Hurdle Vesting of the ASR Performance Rights and Options is subject to Qube achieving a cumulative 4.5% compound ASR over the relevant Performance Period.
ASR is the annual shareholder return and is measured by both the growth in Share price from the Award Date to the end of the relevant Performance Period and any dividends paid during this time.
The Share price will be based on the VWAP of a Share over the 20 trading days up to and including the day of the start and the end of the relevant Performance Period.
KPI Hurdle Achievement of the Moorebank Targets is to be assessed by the Board as a package. In assessing the overall achievement of the Moorebank Targets, the Board will have regard to the base case financial and operating models taking into account deviations (known and unknown). The Moorebank targets include a number of non-market based hurdles. Vesting of the Moorebank Performance Rights and Options will be assessed by the Board based on overall achievement of the Moorebank Targets as follows:
1. Overall did not meet Moorebank Targets: zero vesting
2. Overall met Moorebank Targets: 75% of the Moorebank Performance Rights and Options will
vest
3. Overall exceeded Moorebank Targets: 100% of the Moorebank Performance Rights and Options
will vest.
Set out below are summaries of Performance Rights and Options granted under the scheme:
Grant date
Last possible
vesting date
Issue price
($)
Balance at the start of the year
(number)
Granted during the
year (number)
Entitlement offer adjust.
(number)
Vested/ transferable
during the year
(number)
Forfeited during
the year (number)
Balance at end of year
(number)
Vested and transferable
at the end of the year
(number)
9 Sept 2013 9 Sept 2018 1.87 2,897,110 - 46,214 - - 2,943,324 -
5 Sept 2014 5 Sept 2019 2.39 3,985,892 - 63,559 - - 4,049,451 -
3 Sept 2015 3 Sept 2020 2.24 - 1,626,419 66,347 - - 1,692,766 -
3 Sept 2015 3 Sept 2020 0.44* - 12,861,993 - - - 12,861,993 -
3 Sept 2015 3 Sept 2020 2.24 - 1,146,289 52,805 - - 1,199,094 -
3 Sept 2015 3 Sept 2020 0.44* - 10,989,823 - - - 10,989,823 -
* Options
Fair value of Plan Shares granted
The fair value at grant date is independently determined taking into account the following:
TSR & ASR Performance Rights and Options & EPS Performance Rights
For the TSR & ASR Performance Rights and Options & EPS Performance Rights a Monte Carlo simulation based model has been used to test the likelihood of attaining the relevant hurdle against the comparator group of entities (that is the constituents of the S&P ASX 200 Index). The Monte Carlo simulation model incorporates the impact of this market condition on the value of the relevant Performance Right or Option.
EPS Options & KPI Performance Rights and Options
For the EPS Options & KPI Performance Rights and Options the Black-Scholes-Merton model has been used to estimate the value at the valuation date. Consistent with the requirements of AASB 2, the development or application of an estimate indicating the likelihood of achieving the EPS and KPI Hurdle has not been included.

Qube Holdings Limited Notes to the consolidated financial statements
for the year ended 30 June 2016
(continued)
~ 97 ~
The model inputs for Performance Rights and Options expensed during the year ended 30 June 2016 included:
TSR condition Performance
Rights
EPS condition Performance
Rights
TSR condition Performance
Rights
EPS condition Performance
Rights
Vesting date 9 Sept 2016 9 Sept 2018 5 Sept 2017 5 Sept 2019
Grant date 9 Sept 2013 9 Sept 2013 5 Sept 2014 5 Sept 2014
Share price at grant date ($) $1.97 $1.97 $2.51 $2.51
Exercise price ($) $0.00 $0.00 $0.00 $0.00
Volatility of share (%) 30% 30% 27% 27%
Distribution yield (%) 3.36% 3.36% 2.50% 2.50%
Risk free rate (%) 2.87% 2.87% 2.70% 2.70%
Performance Right fair value at grant date ($) $1.22 $1.96 $1.62 $2.50
Expected life (years) 3.0 3.0 3.0 3.0
Correlation matrix * N/A * N/A
Probability of achievement 90% 81% 90% 81%
TSR condition Performance
Rights TSR condition
Options
EPS condition Performance
Rights EPS condition
Options
Vesting date 3 Sept 2018 3 Sept 2018 3 Sept 2020 3 Sept 2020
Grant date 3 Sept 2015 3 Sept 2015 3 Sept 2015 3 Sept 2015
Share price at grant date ($) $2.08 $2.08 $2.08 $2.08
Exercise price ($) $0.00 $2.24 $0.00 $2.24
Volatility of share (%) 26.5% 26.5% 26.5% 26.5%
Distribution yield (%) 2.45% 2.45% 2.45% 2.45%
Risk free rate (%) 1.75% 1.75% 1.91% 1.91%
Performance Right fair value at grant date ($) $1.16 $0.30 $2.07 $0.37
Expected life (years) 3.0 3.0 3.0 3.0
Correlation matrix * * N/A N/A
Probability of achievement 90% 90% 67% 67%
* Share prices are correlated and a correlation matrix is needed to describe that dependency. The correlation matrix has been derived taking into account historical share price correlation covering a period in line with the expected life of the Performance Rights.
The model inputs for Moorebank specific Performance Rights and Options expensed during the year ended 30 June 2016 included:
ASR condition Performance
Rights ASR condition
Options
KPI condition Performance
Rights KPI condition
Options
Vesting date 3 Sept 2020 3 Sept 2020 3 Sept 2018 3 Sept 2018
Grant date 3 Sept 2015 3 Sept 2015 3 Sept 2015 3 Sept 2015
Share price at grant date ($) $2.08 $2.08 $2.08 $2.08
Exercise price ($) $0.00 $2.24 $0.00 $2.24
Volatility of share (%) 26.5% 26.5% 26.5% 26.5%
Distribution yield (%) 2.45% 2.45% 2.45% 2.45%
Risk free rate (%) 1.91% 1.91% 1.75% 1.75%
Performance Right fair value at grant date ($) $1.07 $0.33 $2.07 $0.37
Expected life (years) 3.0 3.0 3.0 3.0
Probability of achievement 90% 90% 67% 67%

Qube Holdings Limited Notes to the consolidated financial statements
for the year ended 30 June 2016
(continued)
~ 98 ~
(b) Executive long-term incentive plan (ELTIP)
The key terms and conditions of the ELTIP are described below.
Qube does not intend to make further issuances under the ELTIP.
Participation Only those executives invited by the Board to apply are eligible to participate.
Instrument Plan Shares (ordinary shares with vesting subject to performance conditions).
Issue price The issue price for Plan Shares acquired is the volume weighted average price (VWAP) at which shares trade on ASX over the 20 trading days prior to the date of issue of the shares.
Performance period Maximum of 5 years and 3 months after issue date or any earlier date set by the Board at the time of offer of the Plan Shares.
Performance conditions
The performance conditions relate to financial performance and continued engagement with Qube. The financial performance criteria are based on improvements in the performance and profitability of the Company as measured by a combination of compound annual shareholder return and earnings per share growth. There is an additional condition requiring continued employment with Qube.
Method for assessing performance
Vesting of the Plan Shares is subject to Qube achieving performance conditions set by the Board linked to shareholder return. For the ELTIP award made for the year ended 30 June 2013 the performance hurdles comprise:
(a) a compound annual shareholder return (ASR), including share price growth and dividends of 10%; and
(b) a compound annual increase in the underlying earnings per share of 11%.
Vesting criteria The Plan Shares vest in 3 tranches. Once vested, the Plan Shares may be traded subject only to the repayment of the loan referrable to those Plan Shares and Qube’s Securities Trading Policy.
Lapsing and forfeiture Plan Shares will be forfeited, or sold by the Company to repay the loan if performance hurdles are not achieved, or the executive is no longer employed by Qube.
Dividends A participant in the ELTIP is entitled to receive any dividend or distribution paid in respect of Plan Shares.
Interest The loan will bear interest in an amount equal to the dividend paid on Plan Shares acquired with that loan. Interest is payable within 3 business days of payment of dividends. Interest is not payable in respect of any dividend characterised as a special dividend by the Board being a dividend derived other than from the ordinary course of business.
Expiry date No loan in relation to the Plan Shares is repayable until the earlier of:
(a) 2 years after the final vesting date for the relevant ELTIP issue;
(b) settlement of the sale of the ELTIP shares; and
(c) 3 months after written notice by the Company to repay the loan (in respect of vested shares).
The loan is a limited recourse loan with the amount to be repaid limited to the lesser of the principal advanced and the price realised on sale of the Plan Shares.
The making of limited recourse loans by Qube to participants to acquire shares under the ELTIP was approved by a resolution of the sole member of Qube for the purposes of section 260C of the Corporations Act.
Set out below are summaries of Plan Shares granted under the scheme:
Grant date Last possible
vesting date
Issue price
($)
Balance at the start of the year
(number)
Granted during the
year (number)
Vested/ transferable
during the year
(number)
Forfeited during the
year (number)
Sold during
the year (number)
Balance at the end of
the year (number)
Vested and transferable at the end of
the year (number)
1 Sept 2011 30 Nov 2014 1.3575 3,200,000 - - - (200,000) 3,000,000 3,000,000
29 Jun 2012 30 Nov 2015 1.5135 9,820,002 - 1,873,165 - (681,668) 9,138,334 9,138,334
14 Nov 2012 30 Nov 2015 1.5448 2,000,000 - 333,334 - - 2,000,000 2,000,000
Fair value of Plan Shares granted
The fair value at grant date was independently determined using a Monte Carlo simulation method that takes into account the likelihood of the Plan Shares attaining the performance hurdles, the term of the plan, the share price at grant date, expected price volatility, the expected dividend yield and the risk-free rate over the term.
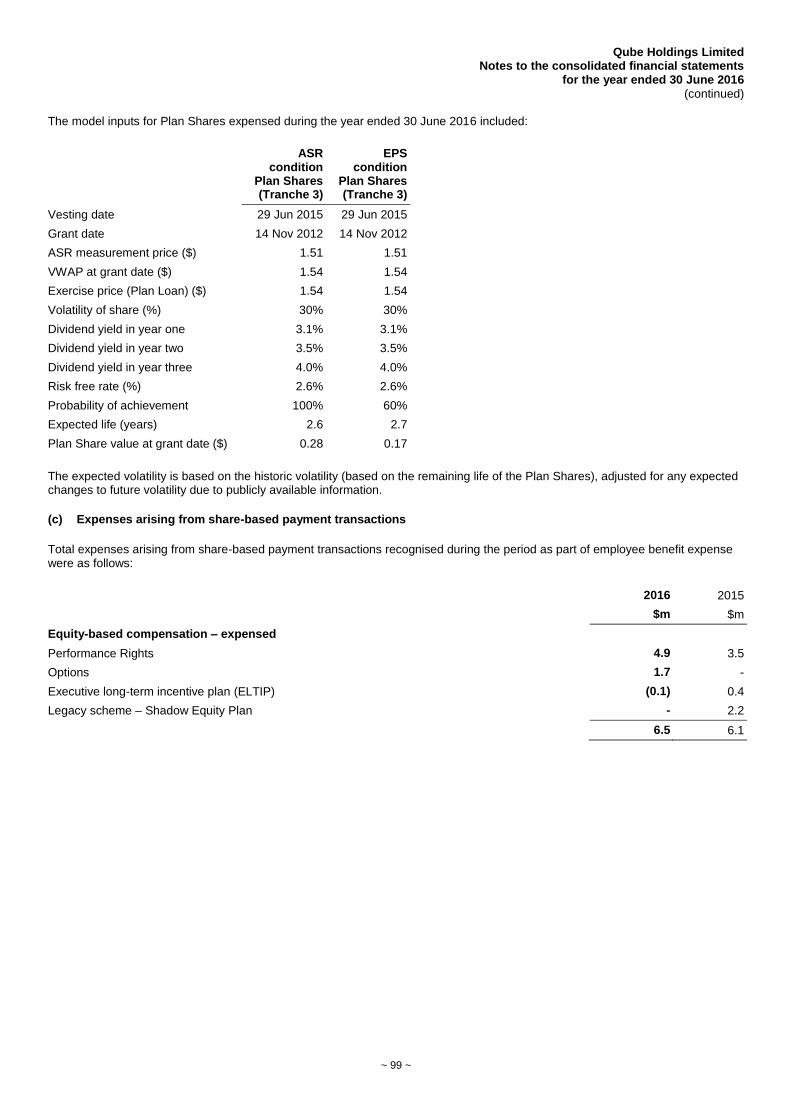
Qube Holdings Limited Notes to the consolidated financial statements
for the year ended 30 June 2016
(continued)
~ 99 ~
The model inputs for Plan Shares expensed during the year ended 30 June 2016 included:
ASR condition
Plan Shares (Tranche 3)
EPS condition
Plan Shares (Tranche 3)
Vesting date 29 Jun 2015 29 Jun 2015
Grant date 14 Nov 2012 14 Nov 2012
ASR measurement price ($) 1.51 1.51
VWAP at grant date ($) 1.54 1.54
Exercise price (Plan Loan) ($) 1.54 1.54
Volatility of share (%) 30% 30%
Dividend yield in year one 3.1% 3.1%
Dividend yield in year two 3.5% 3.5%
Dividend yield in year three 4.0% 4.0%
Risk free rate (%) 2.6% 2.6%
Probability of achievement 100% 60%
Expected life (years) 2.6 2.7
Plan Share value at grant date ($) 0.28 0.17
The expected volatility is based on the historic volatility (based on the remaining life of the Plan Shares), adjusted for any expected changes to future volatility due to publicly available information.
(c) Expenses arising from share-based payment transactions
Total expenses arising from share-based payment transactions recognised during the period as part of employee benefit expense were as follows:
2016 2015
$m $m
Equity-based compensation – expensed
Performance Rights 4.9 3.5
Options 1.7 -
Executive long-term incentive plan (ELTIP) (0.1) 0.4
Legacy scheme – Shadow Equity Plan - 2.2
6.5 6.1

Qube Holdings Limited Notes to the consolidated financial statements
for the year ended 30 June 2016
(continued)
~ 100 ~
34. Deed of cross guarantee
The parent entity and the companies noted in note 23 are parties to a deed of cross guarantee under which each company guarantees the debts of the others. By entering into the deed, the wholly-owned entities have been relieved from the requirement to prepare a financial report and director's report under Class Order 98/1418 (as amended) issued by the Australian Securities and Investments Commission. The above companies represent a ‘closed group' for the purposes of the Class Order, and as there are no other parties to the deed of cross guarantee that are controlled by the parent entity, they also represent the ‘extended closed group'.
(a) Consolidated income statement, statement of comprehensive income and summary of movements in consolidated retained earnings for the year ended 30 June 2016 of the closed group
Consolidated income statement 2016 2015
$m $m
Revenue from continuing operations 1,177.3 1,335.2
Other income 43.7 44.6
Direct transport and logistics costs (308.9) (352.4)
Repairs and maintenance costs (80.5) (86.1)
Employee benefits expense (464.1) (490.1)
Fuel, oil and electricity costs (72.9) (104.6)
Occupancy and property costs (58.7) (61.9)
Depreciation and amortisation expense (92.7) (99.4)
Professional fees (10.3) (9.9)
Other expenses (14.4) (61.5)
Total expenses (1,102.5) (1,265.9)
Finance income 1.6 3.7
Finance costs (32.9) (28.5)
Net finance costs (31.3) (24.8)
Share of net profit of associates accounted for using the equity method 12.6 10.4
Profit before income tax 99.8 99.5
Income tax expense 30.3 28.9
Profit for the year 69.5 70.6
Other comprehensive income net of tax:
Revaluation of available-for-sale financial assets 9.4 -
Total comprehensive income for the year 78.9 70.6
Total comprehensive income attributable to:
Owners of Qube 78.9 70.6
Non-controlling interests - -
78.9 70.6
Summary of movements in consolidated retained earnings
Retained earnings at the beginning of the financial year 120.6 105.6
Profit for the year 69.5 70.6
Dividends provided for or paid (53.9) (56.0)
Entities joining the closed group (2.1) 0.4
Retained earnings at the end of the financial year 134.1 120.6

Qube Holdings Limited Notes to the consolidated financial statements
for the year ended 30 June 2016
(continued)
~ 101 ~
(b) Consolidated balance sheet as at 30 June 2016 of the closed group
2016 2015 $m $m
ASSETS
Current assets
Cash and cash equivalents 67.7 80.3
Trade and other receivables 194.3 210.0
Inventories 2.4 2.2
Available-for-sale financial assets 543.7 -
Current tax receivable 3.1 -
Total current assets 811.2 292.5
Non-current assets
Financial assets at fair value through profit or loss 1.0 1.0
Investments in associates 225.8 216.9
Property, plant and equipment 749.9 739.8
Investment properties 71.0 70.0
Intangible assets 606.1 614.2
Other financial assets 64.1 54.8
Investment 181.8 166.0
Deferred tax assets 1.8 8.5
Other 1.0 0.8
Total non-current assets 1,902.5 1,872.0
Total assets 2,713.7 2,164.5
LIABILITIES
Current liabilities
Trade and other payables 92.2 108.6
Borrowings 159.4 12.3
Derivative financial instruments 0.7 0.8
Current tax payable - 5.8
Provisions 62.0 65.0
Total current liabilities 314.3 192.5
Non-current liabilities
Trade and other payables 2.2 5.5
Borrowings 476.6 568.4
Derivative financial instruments 2.5 2.3
Provisions 9.3 14.8
Total non-current liabilities 490.6 591.0
Total liabilities 804.9 783.5
Net assets 1,908.8 1,381.0
EQUITY
Contributed equity 1,783.9 1,284.7
Reserves (9.2) (24.3)
Retained earnings 134.1 120.6
Capital and reserves attributable to owners of Qube Holdings Limited 1,908.8 1,381.0
Non-controlling interests - -
Total equity 1,908.8 1,381.0

Qube Holdings Limited
Notes to the consolidated financial statements for the year ended 30 June 2016
(continued)
~ 102 ~
35. Parent entity financial information
(a) Summary financial information
The individual financial statements for the parent entity show the following aggregate amounts:
2016 2015
$m $m
Balance sheet
Current assets 569.4 15.0
Total assets 2,682.3 2,103.7
Current liabilities 161.3 9.6
Total liabilities 639.6 566.9
Shareholders' equity
Issued capital 1,944.9 1,445.3
Reserves – share-based payments (27.5) (35.8)
Retained earnings 125.3 127.3
2,042.7 1,536.8
Profit for the year 56.2 82.6
Total comprehensive income 56.2 82.6
(b) Guarantees entered into by the parent entity
There are cross guarantees given by the parent entity and the companies noted in note 23. No deficiencies of assets exist in any of these companies. No liability was recognised by the parent entity or the consolidated entity in relation to this guarantee given the low likelihood of it being called.
ACCOUNTING POLICY
The financial information for the parent entity has been prepared on the same basis as the consolidated financial statements, except as set out below.
(i) Investments in subsidiaries, associates and joint venture entities
Investments in subsidiaries, associates and joint venture entities are accounted for at cost in the financial statements of the parent entity. Dividends received from associates are recognised in the parent entity's profit or loss, rather than being deducted from the carrying amount of these investments.
(ii) Tax consolidation legislation
The parent entity and its wholly-owned Australian controlled entities have implemented the tax consolidation legislation.
The parent entity and the controlled entities in the tax consolidated group account for their own current and deferred tax amounts. These tax amounts are measured as if each entity in the tax consolidated group continues to be a standalone taxpayer in its own right.
In addition to its own current and deferred tax amounts, the parent also recognises the current tax liabilities (or assets) and the deferred tax assets arising from unused tax losses and unused tax credits assumed from controlled entities in the tax consolidated group.

Qube Holdings Limited
Notes to the consolidated financial statements for the year ended 30 June 2016
(continued)
~ 103 ~
The entities have also entered into a tax funding agreement under which the wholly-owned entities fully compensate the parent entity for any current tax payable assumed and are compensated by parent entity for any current tax receivable and deferred tax assets relating to unused tax losses or unused tax credits that are transferred to the parent entity under the tax consolidation legislation. The funding amounts are determined by reference to the amounts recognised in the wholly-owned entities' financial statements.
The amounts receivable/payable under the tax funding agreement are due upon receipt of the funding advice from the parent entity, which is issued as soon as practicable after the end of each financial year. The head entity may also require payment of interim funding amounts to assist with its obligations to pay tax instalments.
Assets or liabilities arising under tax funding agreements with the tax consolidated entities are recognised as current amounts receivable from or payable to other entities in the Group.
Any difference between the amounts assumed and amounts receivable or payable under the tax funding agreement are recognised as a contribution to (or distribution from) wholly-owned tax consolidated entities.
36. Summary of other accounting policies
(a) Other Income
(i) Asset sales
The gain or loss on disposal of assets is recognised when title has transferred on the assets.
(ii) Interest income
Interest income is recognised in the statement of comprehensive income for all debt instruments using the effective interest method. Interest income on assets held at fair value through profit or loss is included in the statement of comprehensive income.
The effective interest rate method is a method of calculating the amortised cost of a financial asset or financial liability and of allocating the interest income or expense over the relevant period. The effective interest rate is the rate that exactly discounts estimated future cash payments or receipts throughout the expected life of the financial instrument, or a shorter period where appropriate, to the net carrying amount of the financial asset or liability. When calculating the effective interest rate, Qube estimates cash flows considering all contractual terms of the financial instrument (for example, prepayment options) but does not consider future credit losses. The calculation includes all fees paid or received between the parties to the contract that are an integral part of the effective interest rate, transaction costs and all other premiums or discounts.
(iii) Dividends
Dividend income is recognised on the ex-dividend date with any related foreign withholding tax recorded as an expense.

Qube Holdings Limited
Notes to the consolidated financial statements for the year ended 30 June 2016
(continued)
~ 104 ~
(b) Foreign currency translation
(i) Functional and presentation currency
Items included in the financial statements of each of the Group's entities are measured using the currency of the primary economic environment in which it operates (the ‘functional currency’). The consolidated financial statements are presented in Australian dollars, which is Qube's functional and presentation currency.
(ii) Transactions and balances
Foreign currency transactions are translated into the functional currency using the exchange rate prevailing at the date of the transaction. Foreign exchange gains and losses resulting from the settlement of such transactions and from the translation at year end exchange rates of monetary assets and liabilities denominated in foreign currencies are recognised in the profit or loss, except when they are deferred in equity as qualifying cash flow hedges and qualifying net investment hedges or are attributable to part of the net investment in a foreign operation.
(iii) Group companies
The results and financial position of foreign operations (none of which has the currency of a hyperinflationary economy) that have a functional currency different from the presentation currency are translated into the presentation currency as follows:
● Assets and liabilities for each balance sheet presented are translated at the closing rate at the date of that balance sheet;
● Income and expenses for each income statement and statement of comprehensive income are translated at average exchange rates (unless this is not a reasonable approximation of the cumulative effect of the rates prevailing on the transaction dates, in which case income and expenses are translated at the dates of the transactions); and
● All resulting exchange differences are recognised in other comprehensive income.
On consolidation, exchange differences arising from the translation of any net investment in foreign entities, and of borrowings and other financial instruments designated as hedges of such investments, are recognised in other comprehensive income. When a foreign operation is sold or any borrowings forming part of the net investment are repaid, the associated exchange differences are reclassified to profit or loss, as part of the gain or loss on sale.
Goodwill and fair value adjustments arising on the acquisition of a foreign operation are treated as assets and liabilities of the foreign operation and translated at the closing rate.
(c) Goods and Services Tax (GST)
Revenues, expenses and assets are recognised net of the amount of associated GST unless the GST incurred is not recoverable from the taxation authority. In this case it is recognised as part of the cost of acquisition of the asset or as part of the expense.
Receivables and payables are stated inclusive of the amount of GST receivable or payable. The net amount of GST recoverable from, or payable to, the taxation authority is included with other receivables or payables in the balance sheet.
Cash flows are presented on a gross basis. The GST components of cash flows arising from investing or financing activities which are recoverable from, or payable to the taxation authority, are presented as operating cash flows.

Qube Holdings Limited
Notes to the consolidated financial statements for the year ended 30 June 2016
(continued)
~ 105 ~
(d) Adoption of standards
(i) New and amended standards adopted by the Group
The Group has applied the following standards and amendments for the first time for their annual reporting period commencing 1 July 2015:
● AASB 2013-3 Amendments to AASB 136 – Recoverable Amount Disclosures for Non-Financial Assets
● AASB 2013-4 Amendments to Australian Accounting Standards – Novation of Derivatives and Continuation of Hedge Accounting
● Interpretation 21 Accounting for Levies
● AASB 2014-1 Amendments to Australian Accounting Standards
The adoption of these standards did not have a material impact on the current period or any prior period and is not likely to affect future periods.
(ii) Early adoption of standards
The Group has not elected to apply any pronouncements before their operative date in the annual reporting period beginning 1 July 2015.
(e) New accounting standards and interpretations
Certain new accounting standards and interpretations have been published that are not mandatory for the 30 June 2016 reporting period and have not been early adopted by the Group. The Group’s assessment of the impact of these new standards and interpretations is set out below.
(i) AASB 9 Financial Instruments, AASB 2009-11 Amendments to Australian Accounting Standards arising from AASB 9 and AASB 2010-7 Amendments to Australian Accounting Standards arising from AASB 9 (December 2010).
AASB 9 Financial Instruments addresses the classification, measurement and derecognition of financial assets and financial
liabilities. Since December 2013, it also sets out new rules for hedge accounting. The standard is applicable for annual reporting periods beginning on or after 1 January 2018.
The derecognition rules have been transferred from AASB 139 Financial Instruments: Recognition and Measurement and have not been changed. When adopted, the standard will affect in particular the Group’s disclosure of its own credit risk adjustments for any financial liabilities that are designed at fair value through profit and loss.
The new hedging rules align hedge accounting more closely with the Group’s risk management practices. As a general rule it will be easier to apply hedge accounting going forward. The new standard also introduces expanded disclosure requirements and changes in presentation.
It is not expected that the application of this standard will have a material impact on amounts recognised in the financial statements but will require the disclosure of additional information.
(ii) AASB 15 Revenue from contracts with customers
AASB 15 Revenue from contracts with customers which replaces AASB 118 which covers contracts for goods and services and
AASB 111 which covers construction contracts, addresses the recognition of revenue. Revenue from Contracts with Customers clarifies the principles for recognising revenue from contracts with customers. It applies to all contracts with customers except leases, financial instruments and insurance contracts. The Group intends to apply the standard from 1 July 2018 (its effective date) and is still assessing the impact of the standard.
(iii) AASB 16 Leases
The AASB issued AASB 16 Leases to remove the balance sheet distinction between operating and finance leases for lessees.
Changes under AASB 16 will predominately affect lessees with almost all leases going on the balance sheet. The asset (the right to use the leased item) and a financial liability to pay rentals are recognized under the new standard with the only exemption being short-term and low-value leases. The new standard will be effective from 1 January 2019 but is available for early adoption. At this stage, the Group is not able to estimate the effect of the new rules on the financial statements. More detailed assessments of the effect will be made over the next twelve months .The Group does not expect to adopt the new standard before 1 January 2019.


Independent auditor’s report to the members of Qube Holdings Limited
Report on the financial report We have audited the accompanying financial report of Qube Holdings Limited (the company), which comprises the consolidated balance sheet as at 30 June 2016, the consolidated statement of comprehensive income, consolidated statement of changes in equity and consolidated statement of cash flows for the year ended on that date, a summary of significant accounting policies, other explanatory notes and the directors’ declaration for the Qube Holdings Limited Group (the consolidated entity). The consolidated entity comprises the company and the entities it controlled at year’s end or from time to time during the financial year.
Directors' responsibility for the financial report The directors of the company are responsible for the preparation of the financial report that gives a true and fair view in accordance with Australian Accounting Standards and the Corporations Act 2001 and for such internal control as the directors determine is necessary to enable the preparation of the financial report that is free from material misstatement, whether due to fraud or error. In Note 1, the directors also state, in accordance with Australian Accounting Standard AASB 101 Presentation of Financial Statements, that the financial statements comply with International Financial Reporting Standards.
Auditor’s responsibility Our responsibility is to express an opinion on the financial report based on our audit. We conducted our audit in accordance with Australian Auditing Standards. Those standards require that we comply with relevant ethical requirements relating to audit engagements and plan and perform the audit to obtain reasonable assurance whether the financial report is free from material misstatement.
An audit involves performing procedures to obtain audit evidence about the amounts and disclosures in the financial report. The procedures selected depend on the auditor’s judgement, including the assessment of the risks of material misstatement of the financial report, whether due to fraud or error. In making those risk assessments, the auditor considers internal control relevant to the consolidated entity’s preparation and fair presentation of the financial report in order to design audit procedures that are appropriate in the circumstances, but not for the purpose of expressing an opinion on the effectiveness of the entity’s internal control. An audit also includes evaluating the appropriateness of accounting policies used and the reasonableness of accounting estimates made by the directors, as well as evaluating the overall presentation of the financial report.
We believe that the audit evidence we have obtained is sufficient and appropriate to provide a basis for our audit opinion.
Independence In conducting our audit, we have complied with the independence requirements of the Corporations Act 2001.
PricewaterhouseCoopers, ABN 52 780 433 757 Darling Park Tower 2, 201 Sussex Street, GPO BOX 2650, SYDNEY NSW 1171 T: +61 2 8266 0000, F: +61 2 8266 9999, www.pwc.com.au
Liability limited by a scheme approved under Professional Standards Legislation.

Auditor’s opinion In our opinion:
(a) the financial report of Qube Holdings Limited is in accordance with the Corporations Act 2001, including:
(i) giving a true and fair view of the consolidated entity's financial position as at 30 June 2016 and of its performance for the year ended on that date; and
(ii) complying with Australian Accounting Standards and the Corporations Regulations 2001.
(b) the financial report and notes also comply with International Financial Reporting Standards as disclosed in Note 1.
Report on the Remuneration Report We have audited the remuneration report included in pages 14 to 34 of the directors’ report for the year ended 30 June 2016. The directors of the company are responsible for the preparation and presentation of the remuneration report in accordance with section 300A of the Corporations Act 2001. Our responsibility is to express an opinion on the remuneration report, based on our audit conducted in accordance with Australian Auditing Standards.
Auditor’s opinion In our opinion, the remuneration report of Qube Holdings Limited for the year ended 30 June 2016 complies with section 300A of the Corporations Act 2001.
PricewaterhouseCoopers
N R McConnell Sydney Partner 23 August 2016
~108~