responsive interactive applications by dynamic mapping of activation trees february 20, 1998 peter...
Post on 20-Dec-2015
218 views
TRANSCRIPT

Responsive Interactive Applications by Dynamic
Mapping of Activation TreesFebruary 20, 1998
Peter A. Dinda
http://www.cs.cmu.edu/~pdinda
School of Computer Science
Carnegie Mellon University

2
Outline• Responsive interactive applications
• Best effort real-time service – Dynamic mapping problem
• History-based prediction approach
• Statistical properties of host load
• Algorithms and evaluation for simplified problem
• Research plan– Application and network traces

3
Interactive Application Model
AperiodicUser Action
MessageMessageHandler
Feedback
Activation tree
mouse_click()

4
Acoustic Room Modeling
PhysicalSimulation
of Wave Eqn
impulse responses
Frequency response plots
Room model
Modify model
Speakers

5
Other Applications• Image editing
– The Adobe Photoshop universe
• Computer aided design– Quake design optimization (Malcevic-97)
• Computational steering– CUMULUS (Geist-96), CAVE (Disz-95), …
• Games– DIS
• Collaboration?– Collaborative Planning (Zinky-DUTC-95)

6
Responsiveness
• Timely feedback to individual user actions– Bound: response time tmax
• Jitter bound and resource usage hint– Bound: response time tmin
• Example: image editor drawing tool

7
A Best Effort Real-time Service
• Execute the activation tree rooted at procedure() so that tmintexectmax
• No guarantees
• Responsiveness spec: bounds [tmin,tmax]
• Performance metric: fraction of trees that meet their bounds
MAP procedure() IN [tmin, tmax]

8
Machine Model• Hosts on a LAN
– No centralized or coordinated scheduling, or reservations
– Other unrelated traffic exists– We are only a user
• Remote execution facility– Can execute any procedure on any host – RPC, DSM, DCE, CORBA, DCOM, ...
• Measurable - at least a good real-time clock exists (<1ms)

9
Execution Model
• Dynamically map nodes of the unfolding activation tree to the hosts
• At each procedure call, choose which host is best suited to execute the call in order to meet the bounds on the tree
[tmin,tmax]

10
Dynamic Mapping Problem
How do we map the nodes of the trees to the hosts so that the fraction of trees that satisfy their bounds is maximized?

11
Aspects of My Approach
• History-based prediction
• Decomposition of bounds
• Adaptation of mapping algorithms during tree traversal
Methods: Trace-driven simulation,
Iterative refinement

12
History-based Prediction
• For each host, H0 predicts whether it can meet the bounds, based on past local history and then chooses one where it is possible
• Execution times include both communication for remote call and the actual computation
H0H1
H2
[t’min,t’max]
time, duration, boundstime, duration, bounds
...time, duration, bounds
time, duration, bounds...time, duration, bounds
time, duration, bounds...
foo()
bar()
H0
foo() is executing on H0
and calls bar(), which can be mapped to H0, H1, or H2
H0 has a local history of execution times of bar() on each of the other hosts
[tmin,tmax]

13
Decomposition of Bounds
• Choice of [t’min,t’max] for bar() depends on unvisited portion of the tree
• Collect history of what fraction of time spent in foo() subtree was spent in bar() subtree
• Choose fraction of bounds to give to bar() based on that history and current time
[tmin,tmax]
[t’min,t’max]?
partially executed, known
unexecuted, known unexecuted, unknown
unexecuted, unknown
foo()
bar()

14
Adaptation of Mapping Algorithms During Tree Traversal
• Tune strategy to how deep we are in the tree and how far along in the traversal
• Explore more aggressively early in the traversal, when the effect of a bad decision is easiest to overcome– Find interesting new hosts
• Spend less time making mapping decision deep in the tree– More likely to remain on single host

15
Statistical Properties of Load
• Load traces
• First order properties of the traces
• Self-Similarity
• Epochal Behavior
Goal: modeling of load
16
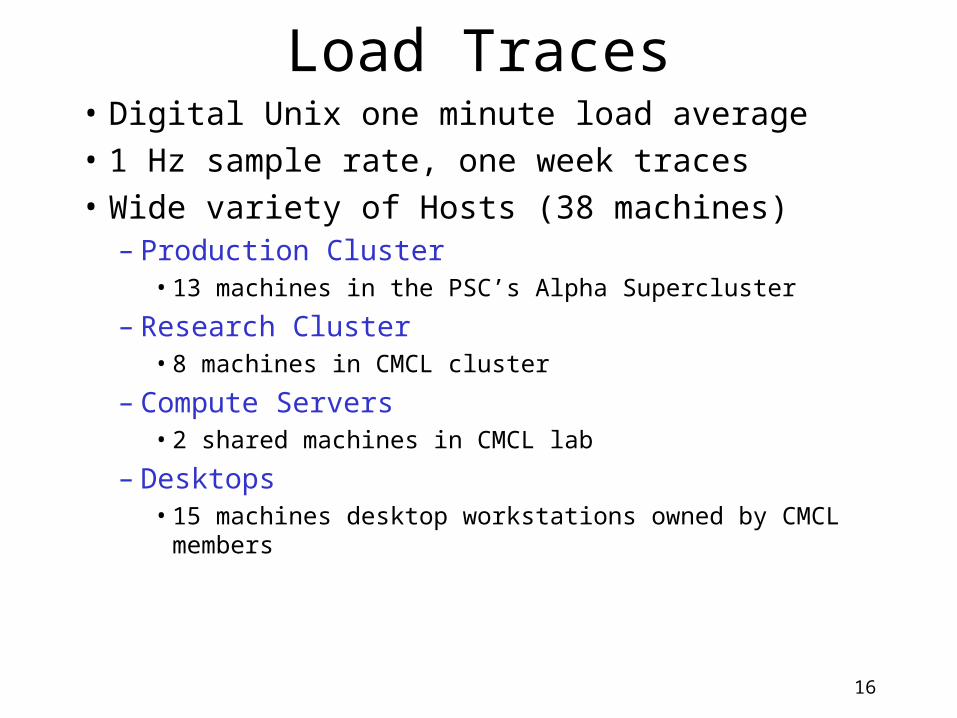
Load Traces• Digital Unix one minute load average• 1 Hz sample rate, one week traces• Wide variety of Hosts (38 machines)
– Production Cluster• 13 machines in the PSC’s Alpha Supercluster
– Research Cluster• 8 machines in CMCL cluster
– Compute Servers• 2 shared machines in CMCL lab
– Desktops • 15 machines desktop workstations owned by CMCL
members

17
Self-Similarity• Intuition: “looks the same” on all time scales
• Autocorrelations similar across time scales
• Power spectrum envelope decays differently from 1/f
• Characterization: Hurst parameter– H Ranges from 0 to 1
• H<0.5 : negative near neighbor correlation - “choppy”
• H=0.5 : no correlations
• H>0.5 : positive near neighbor correlation - “smooth”
• Methodology: Estimate Hurst Parameter– Four different, validated, estimators

18
Hurst Parameter Estimates
0
0.2
0.4
0.6
0.8
1
1.2
Host
Production Cluster ResearchCluster
Desktops
+SDev
-SDev
Mean

19
What does Self-Similarity Tell Us?
• Load is complex, but not random– History matters
• Smoothing may be misguided
• Load should frighten modelers– Conventional stochastic process models
are wrong– Long memory stochastic process models
are desirable but may be impractical

20
Epochal Behavior
• Local frequency content of load signal is stable for long periods of time with abrupt transitions– “Spectrogram shows wide vertical bands”
• Not the same as seasonality

21
Epochal Behavior Example
Title:axp7_tue_19.epsCreator:MATLAB, The Mathworks, Inc.Preview:This EPS picture was not savedwith a preview included in it.Comment:This EPS picture will print to aPostScript printer, but not toother types of printers.
Title:axp7_19_day_time.epsCreator:MATLAB, The Mathworks, Inc.Preview:This EPS picture was not savedwith a preview included in it.Comment:This EPS picture will print to aPostScript printer, but not toother types of printers.

22
Epoch Length Statistics
-200
0
200
400
600
800
1000
1200
Host
+SDev
-SDev
Mean
Production Cluster ResearchCluster
Desktops

23
What Does EpochalBehavior Tell Us?
• Suggests decomposition of load trace modeling problem– Segmentation problem to find epochs– Modeling problem within each epoch

24
Algorithms and Evaluation for Simplified Problem
•Map only leaf nodes
•Ignore communication
for I=1 to N doMAP leaf_procedure() IN [tmin,tmax]
end

25
RangeCounter(W): A Near Optimal Algorithm
• Each host has a quality level Q and a window of the last W execution times (W is small)
• Choose host with highest quality level, and age quality levels of all hosts: Q=Q-1
• If bounds are met, increase host’s quality level by the inverse of our confidence in it:
• If bounds are not met, reduce host’s quality level by half: Q=Q/2
Q Q
N t dtt
t
min
max
1
2( , , )

26
Load Trace-based Simulation• Exec time computed from load trace
using a simple, validated model
• Mapping algorithms are given bounds, select a host, then are told exec time
• Simulator computes performance of– Algorithm under test– Optimal (precognizant) algorithm– Random mapping– Individual host mappings

27
Scope of Evaluation
• 9 mapping algorithms
• 6 different groups of hosts– Chosen from 38 hosts– 1 week, 1 Hz load trace from each host
• 648 different cases– Combinations of nominal time and bounds
• 100,000 calls for each case

28
0
10
20
30
40
50
60
70
80
90
100
0.01 0.1 1 10 100
tnominal (seconds)
Random
Best Individual Host
Optimal (RC)
8MM

29
0
10
20
30
40
50
60
70
80
90
100
0.01 0.1 1 10 100
tnominal (seconds)
Random
Best Individual Host
RangeCounter(50)
Optimal (RC)
8MM
30
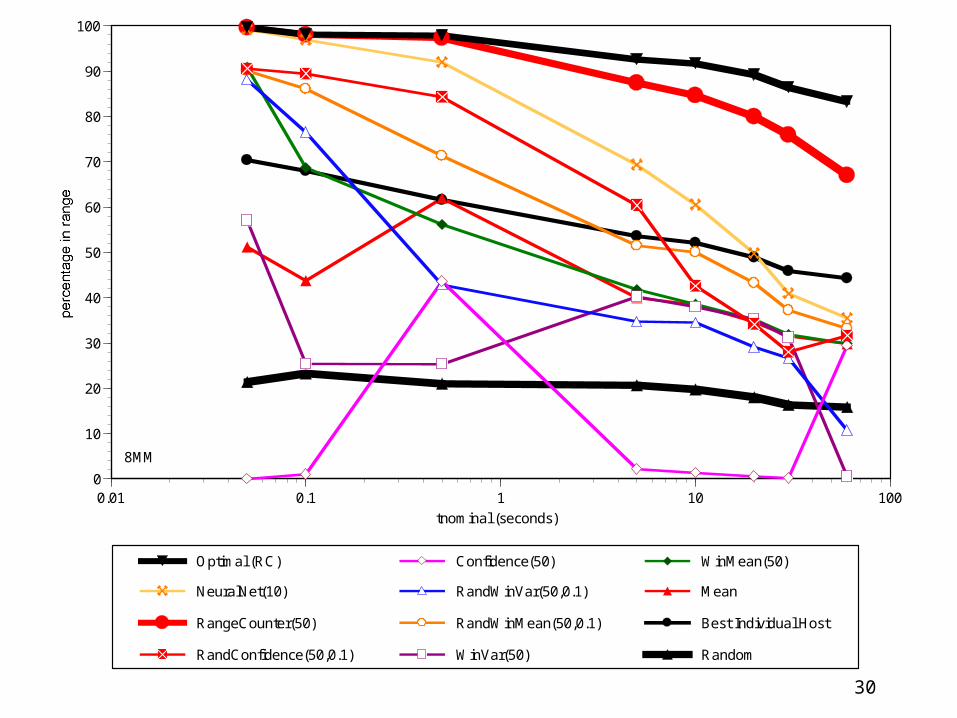
0
10
20
30
40
50
60
70
80
90
100
0.01 0.1 1 10 100
tnominal (seconds)
Random
Best Individual Host
Mean
WinMean(50)
WinVar(50)
RandWinMean(50,0.1)
RandWinVar(50,0.1)
Confidence(50)
RandConfidence(50,0.1)
RangeCounter(50)
NeuralNet(10)
Optimal (RC)
8MM

31
0
10
20
30
40
50
60
70
80
90
100
1 1.2 1.4 1.6 1.8 2 2.2 2.4 2.6 2.8 3
tmax/tnominal
Random
Best Individual Host
Optimal(RC)
8MM, tnominal=100ms

32
0
10
20
30
40
50
60
70
80
90
100
1 1.2 1.4 1.6 1.8 2 2.2 2.4 2.6 2.8 3
tmax/tnominal
Random
Best Individual Host
RangeCounter(50)
Optimal(RC)
8MM, tnominal=100ms

33
8MM
0
10
20
30
40
50
60
70
80
90
100
1 1.2 1.4 1.6 1.8 2 2.2 2.4 2.6 2.8 3
tmax/tnominal
Random
Best Individual Host
Mean
WinMean(50)
WinVar(50)
RandWinMean(50,0.1)
RandWinVar(50,0.1)
Confidence(50)
RandConfidence(50,0.1)
RangeCounter(50)
NeuralNet(10)
Optimal(RC)
8MM, tnominal=100ms

34
0
10
20
30
40
50
60
70
80
90
100
0.025 0.075 0.125 0.175 0.225 0.275 0.325
range [0,tmax]
Random
Best Individual Host
Optimal(RC)
8MM

35
0
10
20
30
40
50
60
70
80
90
100
0.025 0.075 0.125 0.175 0.225 0.275 0.325
range [0,tmax]
Random
Best Individual Host
RangeCounter(50)
Optimal(RC)
8MM

36
0
10
20
30
40
50
60
70
80
90
100
0.025 0.075 0.125 0.175 0.225 0.275 0.325
range [0,tmax]
Random
Best Individual Host
Mean
WinMean(50)
WinVar(50)
RandWinMean(50,0.1)
RandWinVar(50,0.1)
Confidence(50)
RandConfidence(50,0.1)
RangeCounter(50)
NeuralNet(10)
Optimal(RC)
8MM

37
Research Plan
• Extend simulation environment to include communication and activation trees• Trace collection (Activation trees, network)
» A trace for everything
• Trace characterization (models, benchmarks)• Simulator extension
• Develop algorithm• Evaluate with benchmarks• Incorporate into real system
Extend current results to the full dynamic mapping problem

38
Activation Tree Traces
• Representation of real program runs
• Each node annotated with compute time, and what data it references
• Delay requirements

39
Network Traces• Realistic communication times
• Packet traces on Ethernet with tcpdump– Simple broadcast networks seem too
limiting
• Remos
• Existing trace databases