responses of reinforced concrete pile group in two-layered
TRANSCRIPT

Su et al. / J Zhejiang Univ-Sci A (Appl Phys & Eng) 2015 16(2):93-104 93
Responses of reinforced concrete pile group in two-layered
liquefied soils: shake-table investigations*
Lei SU1,2, Liang TANG†‡1,2, Xian-zhang LING1, Neng-pan JU2, Xia GAO1 (1School of Civil Engineering, Harbin Institute of Technology, Harbin 150090, China)
(2State Key Laboratory of Geohazard Prevention and Geoenvironment Protection, Chengdu University of Technology, Chengdu 610059, China) †E-mail: [email protected]
Received Apr. 7, 2014; Revision accepted Aug. 12, 2014; Crosschecked Jan. 12, 2015
Abstract: During earthquakes, the response of pile foundations in liquefiable sand reinforced by densification techniques is still a very complex dynamic soil-structure interaction problem. Two shake-table experiments were conducted to investigate the be-havior of a reinforced concrete (RC) low-cap pile group embedded in liquefiable soils. Discussion is focused on the behavior of soil-pile-superstructure systems prior to and during liquefaction of the medium-dense and dense sand stratums, which are involved in restoring force characteristics at the superstructure and pile group effect. The test results demonstrated a stiffness reduction and dependent nonlinear behavior appearing in the liquefied medium-dense sand; however, an overall stiffening response was ob-served in liquefied dense sand. The pile group effect seemed insignificant in liquefied medium-dense sand, but was very signifi-cant in the liquefied dense sand.
Key words: Liquefaction, Dynamic behavior, Pile group effect, Pile group, Shake-table experiment doi:10.1631/jzus.A1400093 Document code: A CLC number: TU473.1
1 Introduction
Reinforced concrete (RC) low-cap pile founda-tions have been widely used in supporting bridges and other structural systems that are located in saturated loose sand. One of the most dramatic contributors of damage to the pile foundation of buildings, bridges, and waterfront structures in several major earth-quakes has been the development of liquefaction in deposits of loose sand (Sugimura et al., 2004; Audemard M. et al., 2005; Sonmez et al., 2008; Dash et al., 2009; Palermo et al., 2011; Yen et al., 2011; Wotherspoon et al., 2012).
To prevent earthquake damage to pile-supported structures, the risk of liquefaction and associated ground deformation in the saturated loose sand can usually be reduced by a densification technique as one of the most effective and common liquefaction miti-gation procedures. In general, the strength and stiff-ness of the sand stratum are higher when the particles are packed into a dense state rather than in a loose state. Therefore, the design of pile foundations in liquefied soil with a denser state improved by densi-fication becomes very important.
In the past four decades, many attempts have been made to extensively elucidate the effect of liq-uefaction of saturated loose sands on pile behaviors using dynamic centrifuge experiments (Abdoun, 1997; Wilson, 1998; Kutter et al., 2004; Brandenberg et al., 2005; Knappett and Madabhushi, 2008; González et al., 2009; Kirupakaran et al., 2010; Haigh and Madabhushi, 2011; Liu et al., 2011), shake-table experiments (Yao et al., 2004; Tokimatsu et al., 2005;
Journal of Zhejiang University-SCIENCE A (Applied Physics & Engineering)
ISSN 1673-565X (Print); ISSN 1862-1775 (Online)
www.zju.edu.cn/jzus; www.springerlink.com
E-mail: [email protected]
‡ Corresponding author
* Project supported by the National Natural Science Foundation of China (Nos. 51378161 and 51108134), and the National Basic Re-search Program (973 Program) of China (No. 2012CB026104)
ORCID: Lei SU, http://orcid.org/0000-0002-9312-4170; Liang TANG, http://orcid.org/0000-0003-0030-1850 © Zhejiang University and Springer-Verlag Berlin Heidelberg 2015

Su et al. / J Zhejiang Univ-Sci A (Appl Phys & Eng) 2015 16(2):93-104 94
Cubrinovski et al., 2008; Uzuoka et al., 2008; Chau et al., 2009; Motamed and Towhata, 2010; Tang et al., 2010; Gao et al., 2011; Zong et al., 2014), and full-scale field tests using blast-induced liquefaction (Rollins et al., 2005; Weaver et al., 2005; Ashford et al., 2006), in addition to various theoretical studies.
However, few experimental and numerical studies have been conducted to examine the behavior of an RC low-cap pile group in liquefied dense sand. Further study is required to improve our understand-ing of the effect of liquefied dense sand stratum due to densification on the pile behavior.
The shake-table experiment has been one of the tools used for identifying and quantifying the damage and failure mechanisms in pile foundations during earthquakes. Generally, piles may be damaged further when a liquefiable soil stratum is overlaid by a non-liquefied soil stratum (Abdoun, 1997; Sugimura et al., 2004). In the following sections, two shake- table experiments were performed to investigate the behavior of RC low-cap pile group in medium-dense and dense liquefied sand stratum with a non-liquefied crust stratum. The responses of the soil-pile- superstructure system model are presented. Restoring force characteristics at the superstructure and pile group effect are then discussed. Finally, insights and conclusions are drawn based on the reported results.
2 Shake-table experiments As indicated in Fig. 1, two shake-table experi-
ments (Models 1 and 2) were conducted at the Insti-tute of Engineering Mechanics (IEM), China Earth-quake Administration. The experiments employed a rigid soil container that was 3.8 m long, 2.0 m wide, and 1.6 m high. The sponges of 100 mm thickness were attached inside the end-walls of the rigid soil container to reduce the reflection waves. For water-proofing function, the sponges were coated with a plastic film. To clarify the effect of relative density on the response of the pile group, Models 1 and 2 main-tained the identical conditions with the exception of different relative densities of the sand stratum.
2.1 Model foundation
The model foundation in each experiment con-sisted of a horizontal two-layered soil configuration
with an upper 0.3 m-thick clay crust overlying a 1.2 m-thick saturated sand stratum. The upper clay crust employed a reconstituted silty clay with liquid and plastic limits of 42% and 26%, respectively.
The saturated sand stratum was formed through the sedimentation method (sand deposition in water), where its effectiveness of this method was confirmed in our preliminary shake-table experiments (Tang et al., 2010; Gao et al., 2011). Accordingly, the relative density and the saturated density were approximately 60%–65% and 1980 kg/m3 for Model 1, and ap-proximately 75%–80% and 2100 kg/m3 for Model 2.
The grain size characteristic of this sand is as follows: median grain size D50=0.38 mm, fine content Fc=3.5%, uniformity coefficient Cu=3.2, a maximum void ratio of 0.89, a minimum void ratio of 0.51, and a maximum diameter of 2 mm.
The water table was 0.3 m deep at the soil in-
terface between the liquefiable sand stratum and the overlying clay crust to make sure that the entire sand stratum was submerged.
2.2 Model structure
A separate four-pile group with low-cap and single column pier was used in each test. The pile in
Fig. 1 Experimental setup (unit: mm) (a) Model 1; (b) Model 2

Su et al. / J Zhejiang Univ-Sci A (Appl Phys & Eng) 2015 16(2):93-104 95
this pile group had a length of 1.35 m and a diameter of 0.08 m. The pile group was lined up in a 2×2 con-figuration with a spacing of 3.25 times the pile di-ameter. The cap was approximately 0.46 m long, 0.46 m wide, and 0.15 m high. The column pier was a height of 0.41 m and had a diameter of 0.16 m.
The RC piles, pile cap (i.e., low cap), and col-umn pier were fabricated with fine-aggregate con-crete and reinforcing steel bars. All of the bars em-bedded in the model structure were replaced by gal-vanized iron wire of varying diameters marked with the notation ‘Φ’ (i.e., plain bars). Vertical reinforce-ments were embedded in each pile with a diameter of 80 mm. Vertical reinforcements consisted of 12 Φ2 bars that were evenly distributed around a circle with a diameter of 70 mm. The vertical steel bars were confined by Φ1 bar spirals with a pitch of 20 mm, especially with a pitch of 10 mm within the range of 100 mm of the piles near the pile cap. Vertical rein-forcements of the column pier with a 160 mm diam-eter consisted of 32 Φ2 bars, which were evenly dis-tributed around a circle with a diameter of 150 mm. These bars were confined by Φ1 bar spirals with a pitch of 20 mm within the range of 100 mm of the pier bottom. A 5-mm concrete cover was maintained over the piles and column pier to protect the reinforcement bars. Based on the concrete material specimen tests, the fine-aggregate concrete had an average 28-d cube compressive strength of 24.3 MPa and a mass density of 2400 kg/m3.
Before the soil stratum was constructed, the piles were connected to the base to achieve a fixed base condition in two models. After constructing the model ground, an individual mass of 240 kg was applied to the column pier top to characterize the inertial effect of the bridge superstructure. The experiment super-structure modelled the typical simply-support bridge structure on pile foundations. The experimental model aimed to simulate pile foundations in similar soil stratums and the similitude law is not considered in the design of the model.
2.3 Instrumentation
A large number of sensors were deployed to record the values of the various parameters through-out the shaking (Fig. 1). Many accelerometers and pore pressure sensors were installed within the soil stratum during the model preparation. Data were
obtained for the acceleration and excess pore pressure (ue) of the soil, and the acceleration at the cap and superstructure. In addition, the bending strain was measured by installing many strain gauges on oppo-site sides of the piles (i.e., Pile 1 and Pile 2 in pile group) at the same elevations.
2.4 Test procedure
The models were first subjected to micro- amplitude white noise with a peak acceleration of 0.002g to find the dynamic characteristics of the pile-superstructure interaction system. Subsequently, the models were excited by a sinusoidal motion with a dominant frequency and amplitude of approximately 2 Hz and 0.135g, respectively. It is worth noting that a total of eight shake-table experiments were conducted within the scope of this research program. These shake-table experiments have a similar soil profile except for the structure, and the similar dynamic be-havior of the sand stratum can be obtained from each experimental setup. Therefore, the repeatability of the model technology was well validated.
2.5 Assessment of modal parameters
The natural frequency and damping ratio of Models 1 and 2 were evaluated under the white noise. According to the experimental results, the modal parameters of the pile-superstructure were calculated before liquefaction and investigated based on the previous study (Lombardi and Bhattacharya, 2014) at partial and full liquefaction of the sand stratums. This was done because the experiments were not per-formed with a higher amplitude of white noise.
In the experiment, the natural frequency was assessed through the frequency response function (FRF) before liquefaction. First, the accelerations of base excitation (input) and pier top (output) were measured, and then its power spectral density (PSD) was computed. The FRF can be obtained over a fre-quency range. The natural frequency was conducted using the peak-pick method, and the damping ratio was estimated by the half-power bandwidth method.
Fig. 2 presents the FRFs of the pile-superstructure for Models 1 and 2. From Fig. 2, before liquefaction, the measured natural frequencies of the pile- superstructure system, obtained by micro-amplitude white noise scanning, were about 10.2 Hz and 12.5 Hz

Su et al. / J Zhejiang Univ-Sci A (Appl Phys & Eng) 2015 16(2):93-104 96
for Models 1 and 2, respectively. The natural fre-quencies of the ground surface were about 8.5 Hz and 10.6 Hz for Models 1 and 2 prior to liquefaction. Overall, the stiffness of the test system in Model 2 was relatively great than that in Model 1.
Lombardi and Bhattacharya (2014) indicated that the natural frequency reduced by 20%–25% and 50%–60% at partial and full liquefaction, and the damping ratio increased by approximately 20% and 50% at partial and full liquefaction, respectively. The modal parameters of structure are listed in Table 1 at different stages of liquefaction.
3 Dynamic characteristic of ground
The results in Model 1 (model ground with the medium-dense sand) and Model 2 (model ground with the dense sand) are presented in terms of ue, acceleration, and displacement time histories, where
the displacement is obtained by double-integrating the measured acceleration in the vertical array. No lateral spreading phenomenon was observed in the two models. All the soil accelerations and displace-ments clearly demonstrated similar sinusoidal wave-form with the symmetric pattern in terms of peak positive and negative amplitudes during the loading.
3.1 Results of Model 1
Figs. 3–5 respectively display the recorded ac-celeration, ue, and displacement of the soil in Model 1. The accelerations of the medium-dense sand (Fig. 3) gradually decreased from the container bottom in the vertical direction. This means that the sand stratum had certain attenuation effects on the base motion. Nevertheless, the peak acceleration at the ground surface, reaching 0.255g, was 1.89 times that at the input motion, which displayed a noticeable level of amplification over the base motion.
The ue records (Fig. 4) at the depths of 0.4 and 0.8 m exhibited the same tendency, i.e., after an initial rise, their peak was achieved and then almost re-mained constant until the end of the shaking. The excess pore pressure ratio ru (the ratio of ue to the initial overburden vertical effective stresses) at these two depths reached 1.0 at approximately 8.5 and 9.7 s followed by the initial liquefaction state. According-ly, reduction in the soil strength and stiffness prior to the initial liquefaction was observed in the accelera-tion records. The soil acceleration reached the max-imum during the initial liquefaction state. Afterwards, the acceleration began to appear as a weakening re-sponse in a short time after the initial liquefaction until the shaking ended.
Close to the base at a depth of 1.2 m, ue always increased monotonously and eventually did not reach the initial liquefaction state throughout the shaking. The acceleration response was similar in shape and magnitude to the input motion, and no attenuation- spiky behavior appeared during the input excitation.
In Fig. 5, the maximum displacement, reaching 1.96 cm at about 9.5 s, occurred at the ground surface. The time, when the displacement of the upper two- third medium-dense sand (Fig. 1) reached its peak, appeared to lag behind that of the peak acceleration. Meanwhile, the soil response in the upper two-third soil stratum presented a higher natural period than the
Table 1 Frequencies and damping ratios of pile-superstructure in different stages of liquefaction
Stage Model 1 Model 2
Frequency (Hz)
Damping ratio
Frequency (Hz)
Damping ratio
Before lique-faction
10.2 0.178 12.5 0.172
Partial lique-faction*
7.7 0.214 9.4 0.206
Full liquefac-tion*
4.1 0.267 5.0 0.258
*25% and 60% reduction of natural frequency are used at partial and full liquefaction, respectively
Fig. 2 Frequency response functions between input (base acceleration) and output (pier top) measured before liq-uefaction: (a) Model 1; (b) Model 2
1
2
3
4
5
FR
F A
mpl
itud
e
(a)
3 6 9 12 15 18 21 24 27 301
2
3
4
5
6
Frequency ( Hz)
(b)
(Hz)
am
plitu
de

Su et al. / J Zhejiang Univ-Sci A (Appl Phys & Eng) 2015 16(2):93-104 97
lower soil stratum. This may indicate the importance of considering the behavior of the medium-dense sand, when evaluating the response of the super-structure over the low cap. As mentioned in Section 2.5, the natural periods of the pile-superstructure and ground increased as the soil liquefied. The results of Tokimatsu et al. (2005) show that if the natural period of the bridge superstructure Tb is less than that of the ground Tg, the ground displacement increased the shear force of the pile; otherwise, the ground dis-placement restricted the ability of the pile stress to increase. The study on the period behavior of the bridge superstructure and ground will be carried out in the future.
3.2 Results of Model 2
Figs. 6–8 respectively present the recorded ac-celerations, ue, and displacement of the soil in Model 2. The accelerations (Fig. 6) tended to increase in the vertical array from the base, and had certain
Fig. 5 Computed displacement time histories of soil in Model 1 (a) Ground surface; (b) 0.4 m depth; (c) 0.8 m depth; (d) 1.2 m depth; (e) Input motion
Fig. 3 Acceleration time histories of soil in Model 1 (a) Ground surface; (b) 0.4 m depth; (c) 0.8 m depth; (d) 1.2 m depth; (e) Input motion
(×g)
Fig. 4 Excess pore pressure time histories in Model 1 (a) 0.4 m depth; (b) 0.8 m depth; (c) 1.2 m depth. The initial effective vertical stresses for (a), (b), and (c) are 6.51, 10.35, and 14.19 kPa, respectively

Su et al. / J Zhejiang Univ-Sci A (Appl Phys & Eng) 2015 16(2):93-104 98
amplification effects on the base excitation. The maximum acceleration appeared at the ground surface and reached 0.307g, which was 2.27 times the base motion.
The ue records showed that the initial liquefaction took place at 0.4 and 0.8 m depths at about 9.7 and 11.7 s (Fig. 7). Accordingly, the acceleration exhibited a gradually increasing amplitude prior to the initial liquefaction and then maintained an approximately identical amplitude after the full liquefaction until the shaking ended. This seems to prove that the dense sand still obtained a considerably higher resistance against liquefaction. The ru at 1.2 m depth monoto-nously increased and almost did not reach the initial liquefaction state throughout the shaking. Further-more, the acceleration presented nearly scalar multi-ples of the base acceleration during the shaking.
The ground surface displacement was maxim-ized in the entire soil stratum. The time when the soil
Fig. 8 Computed displacement time histories of soil in Model 2 (a) Ground surface; (b) 0.4 m depth; (c) 0.8 m depth; (d) 1.2 m depth; (e) Input motion
Fig. 7 Excess pore pressure time histories in Model 2 (a) 0.4 m depth; (b) 0.8 m depth; (c) 1.2 m depth; the initial effective vertical stresses for (a), (b), and (c) are 6.67, 11.15, and 15.63 kPa, respectively
Fig. 6 Acceleration time histories of soil in Model 2 (a) Ground surface; (b) 0.4 m depth; (c) 0.8 m depth; (d) 1.2 m depth; (e) Input motion

Su et al. / J Zhejiang Univ-Sci A (Appl Phys & Eng) 2015 16(2):93-104 99
displacement reached its peak corresponded to the peak acceleration of the soil stratum. Furthermore, the maximum of the ground surface displacement (Fig. 8) reached 2.07 cm at about 11 s. The displacements of the upper fully liquefied dense sand continued to keep the highest value for a long time. This demonstrates that the cyclic mobility behavior of the dense sand stratum was more pronounced compared to the medium-dense sand stratum.
3.3 Comparison of Models 1 and 2
The measured ue at corresponding locations showed rather close similarity between Models 1 and 2 (with ue buildup being slightly higher in Model 2 than that in Model 1), and only the upper two-third sand stratum was completely liquefied by the end of the shaking.
The same trend was noted in the accelerations of the ground surface in the two models which exhibited certain noticeable amplification effects on the base motion, which may be attributed to the rigidity of the clay crust overlaid with liquefiable sand allowing for a large soil displacement or deformation.
Despite both models having attained high ue, their dynamic behaviors were noticeably different. At corresponding locations in the upper two-third sand, the softening induced initial amplification was ob-served in liquefied medium-dense and dense sand stratums before the initial liquefaction. The subse-quent gradual attenuation (i.e., loss of strength) was observed in the medium-dense sand stratum after the initial liquefaction. However, the strength and stiff-ness of the dense sand did not weaken even though the sand was fully liquefied.
In general, Model 2 behaved in a stiffer manner than Model 1 throughout the shaking. Note that the upper two-third sand stratum presented a longer pe-riod relative to the base motion in Model 1. However, a similar characteristic did not appear in Model 2. Although the dense sand stratum was liquefied in the upper stratum under the strong base excitation, the dense sand stratum still had a considerably higher liquefaction resistance than the medium-dense sand stratum. The liquefied medium-dense sand stratum did not completely lose the stiffness but appeared to exhibit a weakening characteristic.
4 Dynamic responses of pile and superstructure
4.1 Accelerations and displacements of pile cap and superstructure
The acceleration time histories of the pile cap and superstructure are illustrated in Fig. 9. Although the amplitude of the harmonic base motion was al-most kept constant, the acceleration amplitude of the pile cap and superstructure in Model 1 first increased gradually, and then tended to decrease until the shaking ended. In other words, the acceleration am-plitude of the pile cap and superstructure had a peak. The superstructure peak acceleration reaching 0.232g was 0.91 times the acceleration at the ground surface and 1.72 times that at the base.
However, the acceleration amplitude of the pile cap and superstructure in Model 2 always increased to a peak, and then almost remained constant as the shaking continued. The superstructure peak accelera-tion reached 0.292g, which was 0.95 times the ground surface acceleration and 2.16 times that at the base.
Fig. 9 Acceleration time histories of superstructure and pile cap (a) Superstructure of Model 1; (b) Pile cap of Model 1; (c) Superstructure of Model 2; (d) Pile cap of Model 2
(c)
(d)
(×g)
(a)
(b)
(×g)
Su et al. / J Zhejiang Univ-Sci A (Appl Phys & Eng) 2015 16(2):93-104 100
Upon careful inspection, almost identical base motions were found to produce larger accelerations of the pile cap and superstructure in Model 2 compared with Model 1, indicating that the pile cap and super-structure responded intensely in the dense sand. The accelerations of the ground surface in Models 1 and 2 were relatively large than those of the pile cap and superstructure. It implies that the low cap located in the upper clay stratum is capable of reducing the superstructure acceleration because of the restraint effect. More importantly, the motion of the super-structure is recognized to be closely related to the ground surface, but not very well related to the input motion.
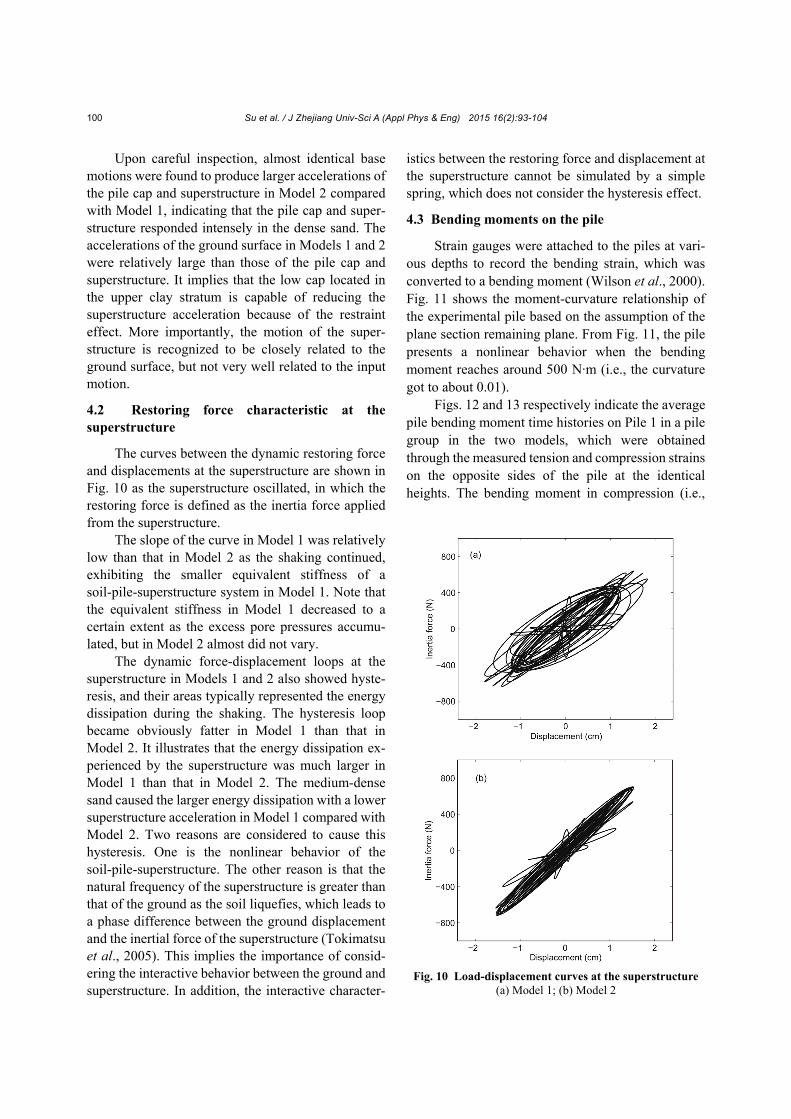
4.2 Restoring force characteristic at the superstructure
The curves between the dynamic restoring force and displacements at the superstructure are shown in Fig. 10 as the superstructure oscillated, in which the restoring force is defined as the inertia force applied from the superstructure.
The slope of the curve in Model 1 was relatively low than that in Model 2 as the shaking continued, exhibiting the smaller equivalent stiffness of a soil-pile-superstructure system in Model 1. Note that the equivalent stiffness in Model 1 decreased to a certain extent as the excess pore pressures accumu-lated, but in Model 2 almost did not vary.
The dynamic force-displacement loops at the superstructure in Models 1 and 2 also showed hyste-resis, and their areas typically represented the energy dissipation during the shaking. The hysteresis loop became obviously fatter in Model 1 than that in Model 2. It illustrates that the energy dissipation ex-perienced by the superstructure was much larger in Model 1 than that in Model 2. The medium-dense sand caused the larger energy dissipation with a lower superstructure acceleration in Model 1 compared with Model 2. Two reasons are considered to cause this hysteresis. One is the nonlinear behavior of the soil-pile-superstructure. The other reason is that the natural frequency of the superstructure is greater than that of the ground as the soil liquefies, which leads to a phase difference between the ground displacement and the inertial force of the superstructure (Tokimatsu et al., 2005). This implies the importance of consid-ering the interactive behavior between the ground and superstructure. In addition, the interactive character-
istics between the restoring force and displacement at the superstructure cannot be simulated by a simple spring, which does not consider the hysteresis effect.
4.3 Bending moments on the pile
Strain gauges were attached to the piles at vari-ous depths to record the bending strain, which was converted to a bending moment (Wilson et al., 2000). Fig. 11 shows the moment-curvature relationship of the experimental pile based on the assumption of the plane section remaining plane. From Fig. 11, the pile presents a nonlinear behavior when the bending moment reaches around 500 N·m (i.e., the curvature got to about 0.01).
Figs. 12 and 13 respectively indicate the average pile bending moment time histories on Pile 1 in a pile group in the two models, which were obtained through the measured tension and compression strains on the opposite sides of the pile at the identical heights. The bending moment in compression (i.e.,
Fig. 10 Load-displacement curves at the superstructure(a) Model 1; (b) Model 2

Su et al. / J Zhejiang Univ-Sci A (Appl Phys & Eng) 2015 16(2):93-104 101
the negative moment) controls the pile design and is investigated below. The peak bending moments along Piles 1 and 2 are compared and shown in Fig. 14.
The amplitude of the bending moments in Model 1 gradually increased prior to the initial liquefaction, then almost reached the maximum in a transient state to liquefaction, and decreased when the excess pore pressures moved to unity, a liquefaction state.
The maximum bending moment in Model 1 occurred at 0.35 m depth near the soil interface, and was 777.8 N·m at about 9.5 s. The time, when the maximum bending moment appeared, coincided with the critical time step of the maximum soil displace-ment (Fig. 5). This seems to illustrate that the soil deformation could remarkably influence the pile bending moments in the medium-dense sand stratum.
In Model 2, the bending moments gradually in-creased until the sand reached the initial liquefaction state, and then kept almost constant amplitude by the end of the shaking. It was found that they closely
(N·m
)
Fig. 12 Bending moment time histories on Pile 1 in Model 1(a) 0.15 m depth, Mmax=−721.0 N·m; (b) 0.35 m depth, Mmax=−777.8 N·m; (c) 0.5 m depth, Mmax=−570.1 N·m; (d) 0.9 m depth, Mmax=−425.3 N·m; (e) 1.3 m depth, Mmax= −153.4 N·m
Fig. 13 Bending moment time histories on Pile 1 in Model 2(a) 0.15 m depth, Mmax=−939.0 N·m; (b) 0.35 m depth, Mmax=−857.2 N·m; (c) 0.5 m depth, Mmax=−703.4 N·m; (d) 0.9 m depth, Mmax=−517.5 N·m; (e) 1.3 m depth, Mmax=−205.5 N·m
(N·m
)
Fig. 11 Moment-curvature relationship of the pile EI represents the initial flexural rigidity
(N·m
)
EI

Su et al. / J Zhejiang Univ-Sci A (Appl Phys & Eng) 2015 16(2):93-104 102
followed the superstructure accelerations. Their peak almost simultaneously corresponded to the peak ac-celeration at the superstructure.
The amplitude of the cyclic bending moment in Model 2 reached a maximum of 939 N·m, appearing at the pile head with the connection of the cap. The bending moments were larger in Model 2 than those in Model 1. It seems to present the significance of the inertial effect from the superstructure on the pile be-havior in the dense sand.
In summary, examination of the bending mo-ments (Figs. 12 and 13) shows that the largest bending moments in Models 1 and 2 happened around the time of the transient state to liquefaction. In Fig. 14, the position of the maximum pile bending moments was in accordance with the investigation of pile founda-tions in the past strong earthquakes, where the dam-age to piles mainly concentrated on the following two zones: (1) the soil interface and (2) the pile head.
4.4 Pile group effect
The pile group effect is explored through the comparison of the bending moments in Piles 1 and 2. Two piles behaved similarly within the group in Model 1. The largest bending moments in Piles 1 and 2 appeared at 0.35 m depth near the soil interface. As Pile 2 is similar with Pile 1 for bending moment, the bending moments in Pile 1 gradually increased from the container bottom, then reached the maximum of 790.9 N·m, and then decreased to 743.7 N·m. Thus, there is only a slight difference in these peak pile bending moments between Piles 1 and 2 (Fig. 13).
In Model 2, the peak bending moments on Piles 1 and 2 always increased from the pile tip and the largest bending moments appeared at the pile head. Pile 2 carried the maximum bending moment of 1033.9 N·m, and resisted the second largest bending moment of 932.1 N·m at 0.35 m depth near the soil interface. The apparent differences of the peak bending moments between Piles 1 and 2 were found despite having the same pile head displacement. The maximum bending moment on Pile 2 was about 11% larger than that on Pile 1.
Therefore, for liquefied medium-dense sand, the pile group effect on the pile bending moments may be negligible. Nevertheless, for liquefied dense sand, the pile group effect is relatively significant, and it no-ticeably affects the bending moment distributions on individual piles.
5 Conclusions
Two highly instrumented shake-table tests were performed to investigate the behavior of RC low-cap pile group in liquefiable medium-dense and dense sand stratums, which are both similarly improved grounds by densification for reducing the risk of liq-uefaction. In the investigated cases, the following conclusions can be drawn from the experiments:
1. Acceleration responses of the medium-dense and dense sand stratums gradually attenuated, but did not vanish after liquefaction. However, the accelera-tion of liquefied dense sand did not weaken with significant cyclic mobility even though the sand was completely liquefied. It was found that there was an overall stiffer response of liquefied dense sand than liquefied medium-dense sand.
2. The study showed that it was important to consider the behavior of the ground, in particular, the natural periods of the ground with soil liquefied, when evaluating the superstructure response in liq-uefied medium-dense sand stratum; however, the soil-structure interaction in liquefied dense sand stratum seemed insignificant.
3. A given shaking event produced larger su-perstructure acceleration and pile bending moments in liquefied dense sand stratum than in liquefied medium-dense sand stratum. This was consistent with both the de-amplification of ground motions and the
(N·m)
Fig. 14 Peak bending moments on Piles 1 and 2

Su et al. / J Zhejiang Univ-Sci A (Appl Phys & Eng) 2015 16(2):93-104 103
soil softening stiffness in liquefied medium-dense sand stratum, therefore imparting a less lateral load to the structure.
4. The bending moment in liquefied medium- dense and dense sand stratums reached the maximum during the transient state of liquefaction. Meanwhile, the maximum pile bending moment appeared near the soil interface in liquefied medium-dense sand; on the contrary, it occurred at the pile head in liquefied dense sand.
5. The intuitively obvious pile group effect was observed in liquefied dense sand stratum, but it was insignificant in liquefied medium-dense sand stratum.
6. The stiffness against the superstructure de-formation was reduced in the liquefied medium-dense sand stratum due to the level of the generated ue, but almost did not change in the liquefied dense sand stratum. Meanwhile, the more significant hysteresis behavior appeared in the liquefied medium-dense sand than in the dense sand.
7. In these two experiments, only the behaviors of 2×2 low-cap RC pile foundations embedded in two-layered liquefiable denser soils were considered. Therefore, additional shake-table experiments should be conducted to investigate other parameters, such as the soil, the pile, the superstructure, and the earth-quake parameters, which are useful for the seismic design of low-cap pile foundations in liquefied sand improved densification. The period characteristics of structure and soil stratum need to be further explored prior to and after liquefaction in future research.
Acknowledgements The authors acknowledge the useful ideas related to per-
forming the two shake-table experiments from Profs. Li-ping JING and Xiao-ming YUAN from the Institute of Engineering Mechanics (IEM), China Earthquake Administration.
References Abdoun, T., 1997. Modeling of Seismically Induced Lateral
Spreading of Multi-layered Soil and Its Effect on Pile Foundations. PhD Thesis, Rensselaer Polytechnic Insti-tute, Troy, New York.
Ashford, S.A., Juirnarongrit, T., Sugano, T., et al., 2006. Soil-pile response to blast-induced lateral spreading. I: field test. Journal of Geotechnical and Geoenvironmental Engineering, 132(2):152-162. [doi:10.1061/(ASCE)1090- 0241(2006)132:2(152)]
Audemard M., F.A., Gómez, J.C., Tavera, H.J., et al., 2005. Soil liquefaction during the Arequipa Mw 8.4, June 23, 2001 earthquake, southern coastal Peru. Engineering Geology, 78(3-4):237-255. [doi:10.1016/j.enggeo.2004. 12.007]
Brandenberg, S.J., Boulanger, R.W., Kutter, B.L., et al., 2005. Behavior of pile foundations in laterally spreading ground during centrifuge tests. Journal of Geotechnical and Geoenvironmental Engineering, 131(11):1378-1391. [doi:10. 1061/(ASCE)1090-0241(2005)131:11(1378)]
Chau, K.T., Shen, C.Y., Guo, X., 2009. Nonlinear seismic soil-pile-structure interactions: shaking table tests and FEM analyses. Soil Dynamics and Earthquake Engineer-ing, 29(2):300-310. [doi:10.1016/j.soildyn.2008.02.004]
Cubrinovski, M., Uzuoka, R., Sugita, H., et al., 2008. Predic-tion of pile response to lateral spreading by 3-D soil-water coupled dynamic analysis: shaking in the direction of ground flow. Soil Dynamics and Earthquake Engineer-ing, 28(6):421-435. [doi:10.1016/j.soildyn.2007.10.015]
Dash, S.R., Govindaraju, L., Bhattacharya, S., 2009. A case study of damages of the Kandla Port and Customs Office tower supported on a mat-pile foundation in liquefied soils under the 2001 Bhuj earthquake. Soil Dynamics and Earthquake Engineering, 29(2):333-346. [doi:10.1016/j. soildyn.2008.03.004]
Gao, X., Ling, X.Z., Tang, L., et al., 2011. Soil-pile-bridge structure interaction in liquefying ground using shake ta-ble testing. Soil Dynamics and Earthquake Engineering, 31(7):1009-1017. [doi:10.1016/j.soildyn.2011.03.007]
González, L., Abdoun, T., Dobry, R., 2009. Effect of soil permeability on centrifuge modeling of pile response to lateral spreading. Journal of Geotechnical and Geoenvi-ronmental Engineering, 135(1):62-73. [doi:10.1061/ (ASCE)1090-0241(2009)135:1(62)]
Haigh, S.K., Madabhushi, S.P.G., 2011. Centrifuge modelling of pile-soil interaction in liquefiable slopes. Geome-chanics and Engineering, 3(1):1-16. [doi:10.12989/gae. 2011.3.1.001]
Kirupakaran, K., Cerato, A., Liu, C., et al., 2010. Simulation of a centrifuge model test of pile foundations in CDSM im-proved soft clays. Proceedings of GeoFlorida 2010: Ad-vances in Analysis, Modeling & Design, West Palm Beach, Florida, USA, p.1583-1591. [doi:10.1061/41095 (365)160]
Knappett, J.A., Madabhushi, S.P.G., 2008. Liquefaction- induced settlement of pile groups in liquefiable and lat-erally spreading soils. Journal of Geotechnical and Ge-oenvironmental Engineering, 134(11):1609-1618. [doi:10. 1061/(ASCE)1090-0241(2008)134:11(1609)]
Kutter, B., Gajan, S., Manda, K., et al., 2004. Effects of layer thickness and density on settlement and lateral spreading. Journal of Geotechnical and Geoenvironmental Engi-neering, 130(6):603-614. [doi:10.1061/(ASCE)1090- 0241(2004)130:6(603)]
Liu, C., Soltani, H., Pinilla, J., et al., 2011. Centrifuge inves-tigation of seismic behavior of pile foundations in soft clays. Geo-Frontiers 2011: Advances in Geotechnical Engineering, Dallas, Texas, USA, p.585-594. [doi:10. 1061/41165(397)61]
Lombardi, D., Bhattacharya, S., 2014. Modal analysis of pile- supported structures during seismic liquefaction. Earth-quake Engineering & Structural Dynamics, 43(1):119- 138. [doi:10.1002/eqe.2336]
Motamed, R., Towhata, I., 2010. Shaking table model tests on
Su et al. / J Zhejiang Univ-Sci A (Appl Phys & Eng) 2015 16(2):93-104 104
pile groups behind quay walls subjected to lateral spreading. Journal of Geotechnical and Geoenviron-mental Engineering, 136(3):477-489. [doi:10.1061/ (ASCE)GT.1943-5606.0000115]
Palermo, A., Wotherspoon, L., Wood, J., et al., 2011. Lessons learnt from 2011 Christchurch earthquakes: analysis and assessment of bridges. Bulletin of the New Zealand Soci-ety for Earthquake Engineering, 44(4):319-333.
Rollins, K.M., Gerber, T.M., Lane, J.D., et al., 2005. Lateral resistance of a full-scale pile group in liquefied sand. Journal of Geotechnical and Geoenvironmental Engi-neering, 131(1):115-125. [doi:10.1061/(ASCE)1090- 0241(2005)131:1(115)]
Sonmez, B., Ulusay, R., Sonmez, H., 2008. A study on the identification of liquefaction-induced failures on ground surface based on the data from the 1999 Kocaeli and Chi-Chi earthquakes. Engineering Geology, 97(3-4):112- 125. [doi:10.1016/j.enggeo.2007.12.008]
Sugimura, Y., Karkee, M.B., Mitsuji, K., 2004. An investiga-tion on aspects of damage to precast concrete piles due to the 1995 Hyogoken-Nambu earthquake. Proceedings Third UJNR Workshop on Soil-structure Interaction, Menlo Park, California, USA, p.1-16.
Tang, L., Ling, X.Z., Xu, P.J., et al., 2010. Shake table test of soil-pile groups-bridge structure interaction in liquefiable ground. Earthquake Engineering and Engineering Vi-bration, 9(1):39-50. [doi:10.1007/s11803-009-8131-7]
Tokimatsu, K., Suzuki, H., Sato, M., 2005. Effects of inertial and kinematic interaction on seismic behavior of pile with embedded foundation. Soil Dynamics and Earthquake Engineering, 25(7-10):753-762. [doi:10.1016/j.soildyn. 2004.11.018]
Uzuoka, R., Cubrinovski, M., Sugita, H., et al., 2008. Predic-tion of pile response to lateral spreading by 3-D soil-water coupled dynamic analysis: shaking in the direction per-pendicular to ground flow. Soil Dynamics and Earth-quake Engineering, 28(6):436-452. [doi:10.1016/j. soildyn.2007.08.007]
Weaver, T.J., Ashford, S.A., Rollins, K.M., 2005. Response of 0.6 m cast-in-steel-shell pile in liquefied soil under lateral loading. Journal of Geotechnical and Geoenvironmental Engineering, 131(1):94-102. [doi:10.1061/(ASCE)1090- 0241(2005)131:1(94)]
Wilson, D.W., 1998. Soil-pile-superstructure Interaction in Liquefying Sand and Soft Clay. PhD Thesis, University of California, Davis, California.
Wilson, D.W., Boulanger, R.W., Kutter, B.L., 2000. Observed seismic lateral resistance of liquefying sand. Journal of Geotechnical and Geoenvironmental Engineering, 126(10):898-906. [doi:10.1061/(ASCE)1090-0241(2000) 126:10(898)]
Wotherspoon, L.M., Pender, M.J., Orense, R.P., 2012. Rela-tionship between observed liquefaction at Kaiapoi fol-lowing the 2010 Darfield earthquake and former channels of the Waimakariri River. Engineering Geology, 125:45- 55. [doi:10.1016/j.enggeo.2011.11.001]
Yao, S., Kobayashi, K., Yoshida, N., et al., 2004. Interactive
behavior of soil-pile-superstructure system in transient state to liquefaction by means of large shake table tests. Soil Dynamics and Earthquake Engineering, 24(5):397- 409. [doi:10.1016/j.soildyn.2003.12.003]
Yen, P., Chen, G., Buckle, I., et al., 2011. Bridge performance during the 2010 M8.8 Chile Earthquake. Structures Congress 2011, Las Vegas, Nevada, USA, p.1649-1659. [doi:10.1061/41171(401)144]
Zong, Z.H., Zhou, R., Huang, X.Y., et al., 2014. Seismic re-sponse study on a multi-span cable-stayed bridge scale model under multi-support excitations. Part I: shaking table tests. Journal of Zhejiang University-SCIENCE A (Applied Physics & Engineering), 15(5):351-363. [doi:10. 1631/jzus.A1300339]
中文概要
题 目:两层土液化场地混凝土群桩基础动力反应振动台
试验研究
目 的:探讨中密和密实砂液化场地混凝土低承台群桩和
地基动力响应存在的差异性,并揭示引起这种差
异性的原因,以期获得加密后砂土液化场地混凝
土低承台群桩和地基动力反应的基本特征与规
律。
创新点:1. 利用振动台试验,成功实施中密和密实砂液化
场地低承台群桩基振动台试验;2. 基于试验结
果,对比中密和密实砂层液化场地群桩和地基的
动力响应规律,考察两种液化场地条件下群桩效
应基本特征。
方 法:1. 通过对比白噪声扫频,获得中密砂和密实砂层
液化场地下体系模态参数的差异性(图 2和表 1);
2. 通过对比砂层孔压、加速度和位移(图 3–8),
获得中密砂和密实砂液化场地动力反应显著的
差异性;3. 基于上部结构和承台的位移与加速
度,讨论中密砂和密实砂液化场地上部结构动力
反应与回复力特性(图 9 和 10);4. 基于桩上记
录的应变时程,考虑桩的非线性,反算混凝土桩
的弯矩时程,对比两类场地群桩弯矩存在的差异
性,获得两类场地对群桩效应的影响效应
(图 12–14)。
结 论:1. 密实砂液化场地加速度在砂层液化后未出现弱
化现象,表现出明显的循环流动性,密实砂液化
场地比中密砂液化场地刚度更大;2. 上部结构动
力响应与砂土密实状态密切相关;3. 中密砂液化
场地桩的最大弯矩发生在土层分界处,而密实砂
液化场地中桩的最大弯矩发生在桩头处;4. 群桩
效应在密砂层中更显著,而在中密砂层并不显
著。
关键词:液化;动力反应;群桩效应;中密砂;密砂;振
动台试验