response to draft determination outcome delivery incentives odis.pdf · 1 response to draft...
TRANSCRIPT

1
Response to Draft Determination
Outcome Delivery Incentives
Our ODI response includes two sections. The first section consists of ten representations
where we believe Ofwat should reconsider their interventions in our plan. The areas where
we believe Ofwat should reconsider their adjustments are:
1. Asymmetric adjustment to penalty collar for leakage ODI
2. Removal of reward component of per capita consumption ODI
3. Restructuring of ODI mechanisms for asset health measures
4. 25% increase in penalty rates for a number of asset health measures
5. Introduction of odour complaints financial ODI
6. Introduction of renewable energy financial ODI
7. Introduction of wastewater treatment works p.e. compliance measure
8. Adjustments to serious pollution incidents ODI
9. Horizontal adjustments to performance commitments
10. Adjustments to category 1 to 3 pollution incidents performance commitments
The second section provides details of our proposals for the new ODIs Ofwat have required
us to introduce to protect customers against the non-delivery of four planned schemes for
2015-20, our revised proposal for our bathing waters ODI, any other additional minor
updates, and the full set of revised ODIs in Ofwat table format.
Section 1 – ODI representations
The ten representations are set out in the first section of this document. The overall impact
of Ofwat’s interventions which are addressed in this section has been to shift the balance of
risk further towards a greater likelihood of penalties than rewards.
In our December Business Plan we submitted a set of ODIs which allowed for a maximum
reward of £26.1m and a maximum penalty of £51.2m. In January 2014 Ofwat published
guidance on risk and reward that encouraged companies to increase the potential for
rewards through outperformance against ODI targets as a trade-off for a reduced weighted
average cost of capital. Since this date, there has been a continuous increase in the levels of
penalties associated with our ODIs and a decrease in the potential for rewards.
Following the interventions in the Draft Determination, we now face a maximum penalty of
£195.4m and a maximum reward of £29.8m. This is clearly out of line with Ofwat’s guidance
on risk and reward, which suggests that ODIs should be symmetrical between rewards and
penalties.

2
The set of ODIs we submitted before the Draft Determination already exceeded Ofwat’s
maximum penalty threshold of 2% of RoRE. This indicates that our ODIs included significant
protection for our customers. We believe that a number of the interventions Ofwat have
made unnecessarily increase the risk associated with our ODIs, to a level which is out of line
with the rest of the industry. In particular, Ofwat have:
Adjusted our asset health ODIs so that we face penalties for falling outside
deadbands in single years rather than two continuous years
Increased the penalty rates associated with a number of our ODIs by 25% without
any justification or analysis to support their intervention
Introduced wastewater treatment works percentage p.e. compliance as a sub-
measure to our asset health ODI, a measure which has not been imposed on any
other company
Introduced two additional ODIs which are associated with financial penalties only
Based on Ofwat’s own analysis we are one of only three companies whose maximum ODI
penalties exceeds the 2% RoRE threshold. Ofwat’s rationale for their interventions has
generally been to protect customers, but, since we are already in excess of the 2%
threshold, we believe that our ODIs already provided our customers with significant
protection, particularly compared with the rest of the industry.
Ofwat have also reduced the potential for rewards associated with our ODIs. The reward
components of both our per capita consumption and serious pollution incidents ODIs have
been removed. We believe that, on the basis of our new willingness-to-pay research carried
out by DJS (see Annex 1) and peer reviewed by RAND (see Annex 2), and to rebalance the
potential for risk and reward, the reward component of the per capita consumption ODI
should be reintroduced (although with a revised incentive rate – see representation 2).
Additionally, given that Ofwat have increased the potential for penalties associated with our
leakage ODI, and given that we are the industry leader on this measure, a symmetric ODI
would also improve the balance of risk and reward and provide stronger incentives for
outperformance (see representation 1).
The set of ODIs we submitted before the publication of our Draft Determination was already
heavily weighted towards a greater potential for penalties than rewards, and already
included a level of protection for our customers which exceeded the level provided by most
other companies. Despite this, Ofwat have intervened in our plan to further increase this risk.
These interventions have not been applied consistently across companies. Ofwat have also
reduced the reward potential, which has further increased the imbalance. Our ten ODI
representations provide the evidence for why many of these adjustments are inappropriate
and should be reconsidered.
For the avoidance of doubt, in all cases we assume that there is no change in the basis of
reporting, for example by the quality regulators. In the event of any such changes we would
discuss with Ofwat the appropriate adjustments to our performance commitments and ODIs.
In addition, we would expect Ofwat to take proper account of events related to extreme
weather, such as the unprecedented flooding experienced over the winter of 2013-14.

3
Annexes
Annex 1: DJS research final report: Willingness to Pay for Incentives
Annex 2: RAND peer review: Review of ‘Willingness to Pay for Incentives’ research

4
Response to Draft Determination
1. Outcome Delivery Incentives - Leakage
Issue
Ofwat have increased the penalty collar associated with our leakage ODI to 96 Ml/d in line with the industry average level (10% above the target). However, they have not made a similar adjustment to the reward cap meaning the incentives we face are highly skewed. We are not opposed to bearing more risk in this area through a higher penalty cap, but we believe a similar adjustment should be made to the reward cap. This is important to ensure that, as the industry-leading company on leakage, we continue to have strong incentives to outperform our target and set a new benchmark for the sector.
Remedy
The reward cap should be symmetrical with the penalty collar, so that the reward cap is increased to 10% below our target, or 78 Ml/d.

5
Summary of the evidence
1. Justification
Ofwat has intervened to increase the penalty collar for our leakage ODI, to align the potential penalty range with the industry average level. We believe a similar adjustment should be made to increase the reward cap in line with the increase in the penalty cap. Southern Water is currently the leading water and sewerage company in the industry on leakage and will be the leading company in the sector by 2019-20 if we achieve our leakage target. Our analysis shows that our incentives for outperformance based on the draft determination would be materially lower than the average. As the leading company in the industry on leakage, we believe it is important that we face strong incentives, at least as strong as the rest of the industry, to outperform and drive down the industry leakage level. This will deliver potential long-term benefits both for our customers through potential reductions in future operating costs and resource investment requirements as well as customers across the sector through the setting of a new industry benchmark.
2. Evidence
2.1 Comparative leakage levels in 2019-20 Southern Water currently has the lowest level of leakage per household of any of the water and sewerage companies. The target in our business plan would mean that by 2019-20 we would have the lowest level of leakage of all companies in the sector. This is shown in Table 1 below. That means that we would only be eligible for any rewards under our ODI if we further pushed the industry performance benchmark on leakage. This would have benefits directly for our customers and the sector as a whole.

6
Table 1. 2019-20 leakage targets
Company 2019-20 Leakage level (l/hh/d)
2019-20 target (Ml/d)
Reward cap (Ml/d)
Distance between target and cap
Anglian 90.6 192 177 7.81%
Welsh 120.4 169 no reward 0.00%
Northumbrian 102.9 203 157 22.66%
Severn Trent 121.8 424 no reward 0.00%
Southern 79.3 87 83.6 3.91%
South West 105.1 84 64 23.81%
Thames 163.9 606 582 3.96%
UU 141.2 457 427 6.56%
Wessex 111.3 66.5 62.5 6.02%
Yorkshire 127.5 287.1 no cap
Affinity 111.2 162.2 134.3 17.20%
Bristol 82.7 43 41 4.65%
Cambridge 100.1 13.5 11.1 17.78%
Dee Valley 90.8 90.8 60 33.92%
Portsmouth 96.3 29.8 17 42.95%
Bournemouth 98.0 20 17 15.00%
South East 97.7 88.1 82.1 6.81%
South Staffordshire
123.6 70.5 62.5 11.35%
Sutton East Surrey
84.6 24 23 4.17%
Industry average
107.8 n/a n/a 12.70%
2.2 Comparison of reward caps across the sector Table 1 above also shows the distance between the 2019-20 leakage target and the reward cap for each company. It also shows that the average distance between companies’ 2019-20 leakage targets and reward caps is 12.7%, compared with our own current gap of 3.9%. This means that we have a much weaker incentive to outperform our target than other companies. Given that Ofwat have increased our penalty range in line with the industry average level, and given that we are the industry leading company on this measure, it is appropriate that our reward range is also aligned with the industry average level. For simplicity, a reward cap which is symmetrical to the penalty collar, at 10% below the target, is an appropriate solution and would mean that our incentives were more closely aligned with the average level of 12.7%.

7
2.3 Benefits for customers from further leakage reduction Outperformance against this measure would reduce the total water demand and potentially allow us to defer some of our planned schemes in the WRMP into the future so customers would not have to pay for the abstraction and treatment of that water until it is needed at a later date. In the short term it would allow us to reduce operating costs by reducing the level of the bulk supply that we import from Portsmouth. In the longer term, we may be able to defer or reduce the operation of a planned desalination scheme which could deliver significant savings for customers. In addition to the direct benefits for our customers, a strong incentive to continue to innovate to push down the benchmark for leakage across the whole sector would deliver benefits for all water customers.
3. Board Engagement
The Board is supportive of our desire to remain the leading water and sewerage company on leakage and recognise the importance of ensuring that we are minimising leakage to support our key corporate messages on metering and water efficiency.
4. CCG
Our CCG were originally not in favour of our including an ODI for leakage, which was not a customer priority in the early research carried out for our Business Plan. However, subsequent research has shown greater support for the inclusion of leakage in our plan and the incentivisation of the target.
5. External Assurance
The data used to support our representations has all been assured by Halcrow. In particular
they have verified our analysis of comparative leakage levels.
8
Response to Draft Determination
2. Outcome Delivery Incentives - Per capita consumption
Issue
Ofwat have removed the reward component of our per-capita consumption ODI on the basis that we had not demonstrated that customers are willing to pay more for over-performance in this area. Since our July 2014 ODI update we have carried out an additional piece of quantitative research with our customers to understand their preferences for ODI rewards and penalties (see DJS report, Annex 1). For per capita consumption our customers’ willingness-to-pay is lower than the proxy value of £2.03 on the average bill that we had adopted in our July ODI update; however, it is still positive. On average, our customers are willing to pay £1.25 on top of the average bill if we can successfully reduce the average consumption level to 131.7 l/h/d during 2015-20. Given this new evidence, and the strong support from stakeholders for this incentive, we believe it is appropriate to retain the reward component of this ODI. However, we would now propose that the incentive rate should be reduced in line with our customers' preferences from the recent research. The reintroduction of the reward component will also help to balance the risk and reward potential associated with our ODIs.
Remedy
Ofwat should reinstate the reward element of our ODI for per capita consumption, using an incentive rate based on the new willingness-to-pay evidence.
The maximum reward would be £6.875m for reducing the average consumption level to 131.7 l/h/d, on average, during 2015-20. This is equal to £687,500 per l/h/d annually, compared with the incentive rate in the June Business Plan update of £1.1m per l/h/d.
The penalty rate would be reduced by the same amount as we did not obtain explicit estimates of customers' willingness-to-pay for the penalty component of this ODI through the DJS research, and so symmetrical rewards and penalties is the most logical outcome.
9
Summary of the evidence
1. Justification
Ofwat’s justification for the removal of the reward component of this ODI was that we had not “demonstrated that customers are willing to pay more for over-performance in this area.” Based on the evidence from the recent research carried out by DJS, and the strong stakeholder support for this incentive, we believe it should be reinstated at a level consistent with the findings of the latest willingness-to-pay research. This will deliver potential long-term benefits both for our customers through potential reductions in future operating costs and resource investment requirements as well as customers across the sector through the setting of a new industry benchmark. Analysis of other companies' Business Plans demonstrates that outperformance against our target would require performance beyond the upper quartile performance level, and so we would only earn the maximum reward for leading performance.
2. Evidence
2.1 Customer willingness-to-pay In August 2014 DJS carried out quantitative research with a representative sample of 1,252 of our household and business customers (see Annex 1 for full report). The objectives of the research were to understand customers’ willingness-to-pay for incentives, the appropriate level of incentive for over performance or early delivery in each of the priority areas, as well as the acceptable level of penalty for under delivery against the priority areas. The research indicated that our customers would support financial rewards for outperformance against this measure, but not at the level we had originally proposed. The research indicated that, on average, our household customers would be willing to pay £1.25 annually if we can successfully help them to reduce their consumption level to 131.7 l/h/d on average over AMP6. On the advice of our research consultants, to ensure we did not overcomplicate the research, customers were not given the option to adjust the incentive rate we proposed in our June Business Plan update for the penalty component of this ODI. 55% of our household customers believe that the incentive rate is acceptable. Of the remaining 45%, one-third felt it to be too high to be acceptable. Given this, we feel that the logical outcome is to align the reward and penalty rates at the reduced rate indicated by this research. Our previous customer research, carried out for us by Creative in March 2014 to inform our June Business Plan update (see June Business Plan update for full report), also showed support for financial rewards for outperformance against our per capita consumption target. Though this was a qualitative piece of research and we cannot infer statistically robust willingness-to-pay estimates from our customers' responses, consumption was high on customers’ priority list and we estimated that they would be willing to pay £1.10 per year for maximum outperformance against this target.
10
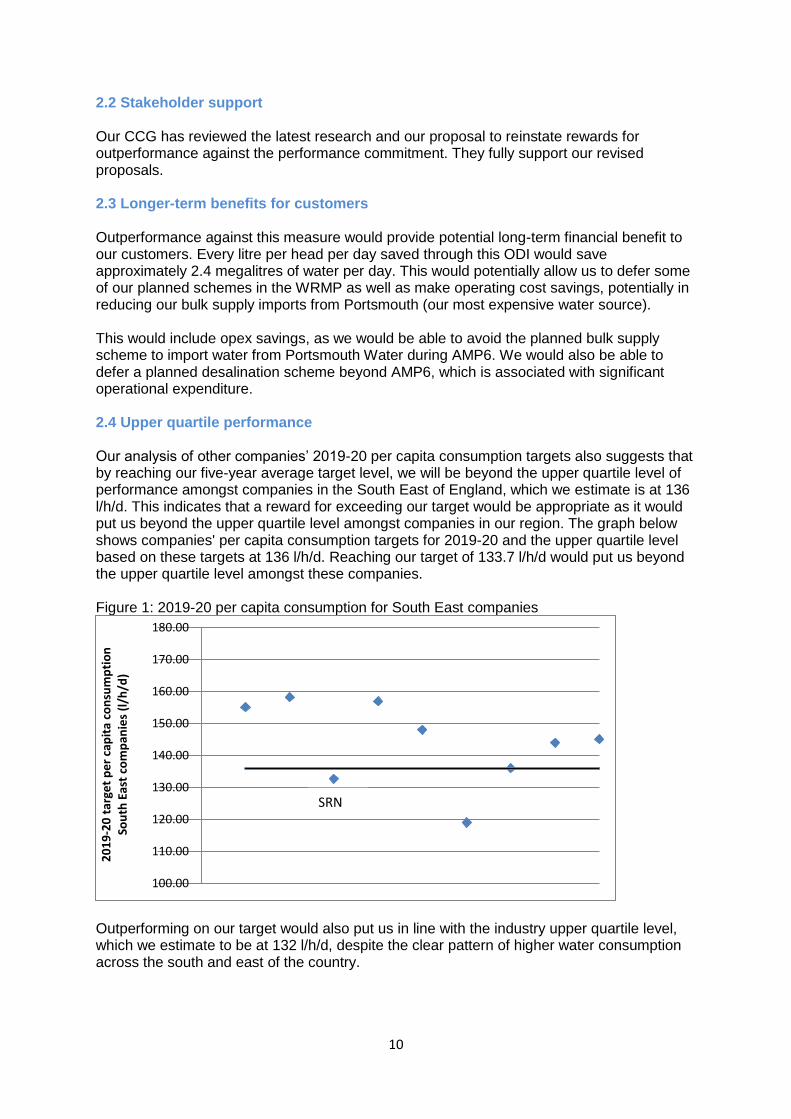
2.2 Stakeholder support Our CCG has reviewed the latest research and our proposal to reinstate rewards for outperformance against the performance commitment. They fully support our revised proposals. 2.3 Longer-term benefits for customers Outperformance against this measure would provide potential long-term financial benefit to our customers. Every litre per head per day saved through this ODI would save approximately 2.4 megalitres of water per day. This would potentially allow us to defer some of our planned schemes in the WRMP as well as make operating cost savings, potentially in reducing our bulk supply imports from Portsmouth (our most expensive water source). This would include opex savings, as we would be able to avoid the planned bulk supply scheme to import water from Portsmouth Water during AMP6. We would also be able to defer a planned desalination scheme beyond AMP6, which is associated with significant operational expenditure. 2.4 Upper quartile performance Our analysis of other companies’ 2019-20 per capita consumption targets also suggests that by reaching our five-year average target level, we will be beyond the upper quartile level of performance amongst companies in the South East of England, which we estimate is at 136 l/h/d. This indicates that a reward for exceeding our target would be appropriate as it would put us beyond the upper quartile level amongst companies in our region. The graph below shows companies' per capita consumption targets for 2019-20 and the upper quartile level based on these targets at 136 l/h/d. Reaching our target of 133.7 l/h/d would put us beyond the upper quartile level amongst these companies. Figure 1: 2019-20 per capita consumption for South East companies
Outperforming on our target would also put us in line with the industry upper quartile level, which we estimate to be at 132 l/h/d, despite the clear pattern of higher water consumption across the south and east of the country.
100.00
110.00
120.00
130.00
140.00
150.00
160.00
170.00
180.00
20
19
-20
tar
get
pe
r ca
pit
a co
nsu
mp
tio
n
Sou
th E
ast
com
pan
ies
(l/h
/d)
SRN

11
3. Board Engagement
The Board has reviewed and endorses this representation as part of their review of the overall Business Plan representations.
4. CCG
Our CCG has reviewed the latest research and our proposal to reinstate rewards for outperformance against the performance commitment. They fully support our revised proposals.
5. External Assurance
The data used to support our representations has all been assured by Halcrow. In particular they have verified our analysis of comparative consumption levels.

12
Response to Draft Determination
3. Outcome Delivery Incentives - Asset health
Issue
Ofwat have adjusted the structure of both our water and wastewater asset health measures so that penalties will apply for performance outside of the deadbands in a single year during AMP6, rather than in two consecutive years as we proposed in our submission. Ofwat have provided no justification for this adjustment other than to “ensure customers are protected in future” (pages 83 and 86 of our Draft Determination). The purpose of our asset health measures is to ensure our customers are protected from long-term deterioration in the health of our assets and are guaranteed a high level of service in the future. This is consistent with the findings of our extensive customer research, in which our customers prioritised the maintenance of services in the long-term. Ofwat’s adjustment does not increase the effectiveness of our asset health measures in meeting these objectives. Annual deviations from the target are not reflective of risk to long-term asset health if performance is recovered and therefore should not result in financial penalties. This adjustment has not been applied consistently across companies and is not consistent with the way Ofwat have applied the serviceability methodology in PR14 to calculate shortfall penalties.
Remedy
Ofwat should revert to our original proposal so that deadbands need to be breached in two consecutive years before financial penalties apply.
This should also apply to the sub-measures which were originally part of our asset health measures but which Ofwat have applied as separate ODIs for simplicity. These measures are 'interruptions to supply', 'Mean Zonal Compliance', 'water pressure', 'sewer blockages' and 'WWTW compliance'.
If the deadbands are breached for two consecutive years, a penalty will apply to both years so that customers are fully protected.
13
Summary of the evidence
1. Justification
Ofwat’s intervention to apply penalties for Asset Health measures following a single year deviation from our target increases the financial risk we would face without providing any additional protection to our customers from long-term deterioration in asset health, which is the purpose of the ODI. It is inconsistent with the way in which Ofwat has approached serviceability both historically and at PR14, which recognises that single year deviations are more likely to be related to weather events, other third party action, or other uncontrollable events, rather than failure to maintain our assets in good health. Furthermore, Ofwat has not applied the intervention consistently across all companies.
2. Evidence
2.1 The intervention is inconsistent with our customers' priorities The purpose of our asset health measures is to ensure our customers are protected from long-term deterioration in the health of our assets and are guaranteed a high level of service in the future. This is consistent with our customers' priorities expressed in the extensive research carried out for our December Business Plan. Our customers told us that they want us to provide "A reliable and effective wastewater service, now and in the future" and "A reliable water supply, now and in the future". The set of asset health measures we have developed is designed to highlight trends over time which indicate whether we are successfully delivering these outcomes. Short term variations in these measures reflect the impact of external conditions, such as weather, rather than the long-term health of our assets; measures outside of our asset health ODIs account for any short term impact on our customers and are linked to customers' clearly expressed priorities. Ofwat's intervention does not increase the effectiveness of our asset health measures in achieving their objectives. 2.2 Single year penalties are inconsistent with Ofwat's own views on Asset Health Ofwat's intervention is not consistent with their approach to serviceability either at PR14 or historically. In the application of the methodology for determining serviceability penalties for PR14, Ofwat have not applied shortfalls where companies recovered from unstable performance during the AMP period. Step four of Ofwat's shortfall process for Draft Determinations states "Where an indicator was stable in 2014 and the company recovered from a non-stable position, then no shortfall" (page 55 Ofwat Annex 3). Company performance could fall outside tramlines during the AMP but recovery before the end of the period would mean no financial penalty would apply. This methodology protects customers from long-term deterioration and risk of service failure into the future, but does not penalise companies for failure in individual years, recognising that single year deviations are more likely to be related to weather or other third party causes than failure to maintain our assets in good health.

14
2.3 Ofwat has not intervened in a consistent way across companies Ofwat have also not consistently made this adjustment across companies - out of all the water and sewerage companies, this intervention has only been applied to our own and Thames Water's plans. Table 1 below shows that, following Ofwat's interventions, half of the WASCs have asset health incentives which apply annually and half have mechanisms which allow them to recover from annual deviations without penalties applying. Table 1. Annual Asset Health measures
Company Annual asset health measure
Anglian Yes
Welsh No
Northumbrian No
Severn Trent No
Southern Yes
South West No
Thames Yes
United Utilities
Yes
Wessex Yes
Yorkshire No
There is no clear explanation as to why Ofwat have intervened in our plan and not in other companies who have asset health measures with similar structures to our original proposal. Ofwat's explanation for their intervention is to "ensure customers are protected in future". As described above, our asset health measures as they were originally proposed are better aligned with our customers' priority of stable long-term services and would already protect customers against future underperformance, making Ofwat's intervention unnecessary and unjustified.
3. Board Engagement
The Board has reviewed and endorses this representation as part of their review of the overall Business Plan representations.
4. CCG
Our CCG has reviewed this as part of our suite of Asset Health measures. However, they have not specifically commented on this adjustment, which they believe is a technical matter for Ofwat.
5. External Assurance
The data used to support our representations has all been assured by Halcrow. In particular
they have verified our analysis of the structure of asset health measures across companies.
15
Response to Draft Determination
4. Outcome Delivery Incentives - Increase in penalty rates by 25%
Issue
Ofwat have increased the incentive rates for all measures for which we will face a penalty for our performance during 2010-15 by 25%. This adjustment applies to the following measures:
Wastewater treatment works compliance
Wastewater treatment works p.e. compliance
Mains bursts
Sewer blockages
Category 1 to 3 pollution incidents
External flooding incidents (other causes)
Interruptions to supply Ofwat's justification for this adjustment is to "ensure customers are protected in future" following the imposition of shortfalls in the draft determination in relation to these measures. However, we note that this adjustment has only been applied it to Southern Water and Thames Water's plans. Ofwat have not provided an explanation for why they have intervened in this way inconsistently across companies, nor have they provided any justification for the increase being 25%, as opposed to any other scale of adjustment. Based on Ofwat's own analysis of risk, we are one of only three companies whose ODI penalty exceeds the 2% maximum RORE cap. This shows that our customers are already protected to a greater degree than customers of other companies and we face a greater degree of risk on our ODIs than most of the industry. Ofwat's intervention increases our risk further when it does not seem necessary to do this.
Remedy
Ofwat should recalibrate the penalty in line with our original proposals by revising the 25% uplift.

16
Summary of the evidence
1. Justification
Ofwat has increased the penalty rates associated with a number of our ODI measures by 25% to protect customers for our performance in 2010-15. However, this adjustment has not been applied consistently across companies who are facing such penalties and Ofwat have provided no rationale for this inconsistency. Ofwat's own analysis shows that we already face a greater ODI penalty potential than most of the rest of the industry and so this adjustment is not necessary or appropriate.
2. Evidence
Ofwat has applied this adjustment inconsistently across companies. Its stated rationale for making this adjustment is to protect customers in the future, in those areas where we are facing serviceability penalties. However, there are six companies facing serviceability penalties for their performance during 2010-15. Ofwat have only made this adjustment in two of those companies' Draft Determinations - Southern Water's and Thames Water's. There does not appear to be a consistent basis for making this adjustment to companies' plans. Based on Ofwat's analysis of risk, our customers are already protected from failure on ODIs, to a greater extent than other companies. The chart below shows that the maximum ODI penalties as a percentage of RORE across all water companies. We are only one of three companies who have reached the 2% RORE penalty cap maximum ODI penalty.
In light of the inconsistency of application and the existing balance of risk and reward in our ODIs Ofwat should remove the 25% uplift that has been applied.

17
3. Board Engagement
The Board has reviewed this representation as part of their review of the overall Business Plan representations.
4. CCG
Our CCG has reviewed this as part of our suite of Asset Health measures. However, they have not specifically commented on this adjustment, which they believe is a technical matter for Ofwat.
5. External Assurance
The data used to support our representations has all been assured by Halcrow.

18
Response to Draft Determination
5. Outcome Delivery Incentives - Odour complaints
Issue
Ofwat has introduced a penalty-only ODI for odour complaints to protect customers from the non-delivery of our two planned odour schemes for AMP6 at Portswood and Tonbridge WWTWs. The measure associated with the ODI is the total number of odour complaints from all of our facilities. Our analysis shows that the expected variation in the number of odour complaints greatly exceeds the planned reduction of 20 complaints per year. Therefore, attaching a financial penalty to the number of odour complaints would not successfully protect customers from the non-delivery of schemes. We could carry out the schemes and still fail to hit our target, or not carry out the schemes and hit our target due to external factors rather than the delivery of our planned schemes. We believe an ODI linked specifically to non-delivery of the schemes in question would be more effective in protecting customers from the risk of non-delivery. The total number of odour complaints would remain as a strong reputational ODI, linked to a clear promise in our Business Plan, on which we would report our performance annually to our Customer Advisory Panel, our customers and our stakeholders so they can hold us to account.
Remedy
A log-down ODI based on the costs associated with delivering the two planned odour reduction schemes would be simpler and more effective in protecting our customers against the non-delivery of these schemes.
We set out our revised proposals in section 2 where we provide the revised ODI in Ofwat's table format.

19
Summary of the evidence
1. Justification
Ofwat’s current proposal will not successfully ensure that we are incentivised to deliver the planned odour schemes in line with our Business Plan, due to the degree of natural variation in the data. In contrast, a more targeted ODI would ensure that we have the right incentives to deliver the schemes that customers are paying for.
2. Evidence
Our Business Plan target of a reduction of 20 complaints per year is based on the assumed removal of all complaints associated with our Portswood and Tonbridge wastewater treatment works, and a stable underlying level of complaints from all other facilities. However, this measure is susceptible to significant annual variation, caused by weather events such as long hot summers, which makes it inappropriate for use with a financial ODI (e.g. see UKWIR report 'Defining and incentivising outcomes and measures of success'). Table 1 below shows the number of complaints we have received in the last 11 years (the entire period for which comparable data is available) from all of our treatment works. Table 1. Odour complaints: 2003/04 to 2013/14
Year Number of complaints
2003/04 1016
2004/05 855
2005/06 807
2006/07 523
2007/08 491
2008/09 395
2009/10 528
2010/11 415
2011/12 415
2012/13 363
2013/14 473
The data show that over time there has been a decreasing trend, but from 2006-07 the trend has been relatively stable. The standard deviation in the data from 2006-07 to 2013-14 is 62 complaints pa. Given the observed variation in the number of complaints, it would be inappropriate to financially incentivise a reduction of 20 complaints, as the expected natural variation is much wider than this. This also means we would be exposed to an unacceptable level of financial risk in the event of a one-off event affecting one of our facilities, despite delivery of the schemes in our plan. A more targeted ODI which replicates the current log-down mechanism would better protect customers from the specific risk of non-delivery of the two funded odour reduction schemes. Alongside this we would retain our current reputational ODI to reduce the number of odour complaints, linked to a clear promise to our customers in our Business Plan. This will be published annually and challenged by our CAP, customers and stakeholders.

20
3. Board Engagement
The Board were supportive of our original proposals for ODIs which did not included a proposal for enhanced reporting on the odour schemes. They have reviewed and endorsed this representation as part of their review of the overall Business Plan representations.
4. CCG
The CCG are supportive of our proposal for a 'log-down' ODI, which will better protect customers from the risk of non-delivery of funded schemes.
5. External Assurance
The data used to support our representations has all been assured by Halcrow. In particular they have verified the analysis of odour complaints presented above.

21
Response to Draft Determination
6. Outcome Delivery Incentives - Proportion of energy from renewable sources
Issue
Ofwat has introduced a penalty-only financial ODI for this measure which would mean we would face a financial penalty for failing to achieve our 2019-20 target of generating renewable energy equivalent to 16.5% of our energy consumption. The rationale for Ofwat's intervention is to ensure customers are protected from non-delivery of planned improvements in AMP6. We do not believe this is an appropriate adjustment as Ofwat's cost models did not make any allowance, either explicitly or implicitly, for the two wind turbine schemes required to deliver the target. This is because this activity has historically been classified as non-regulated business and is therefore not taken account of in the data used to specify the models. The schemes are also below the materiality threshold of 0.5% of totex required for consideration of a special cost case. Since we are not being funded through the price control for our wind turbine schemes, we should not face any financial penalties for failure to deliver these schemes. We have made a promise to our customers to deliver these schemes and so face a strong reputational incentive to make the improvements. This is sufficient to protect our customers in this case.
Remedy
The ODI should be removed on the basis that customers are not funding the associated schemes through the totex allowance.
If the ODI is retained then an explicit adjustment of £9.15m should be made to our cost threshold to fund these schemes.

22
Summary of the evidence
1. Justification
The increase in the proportion of renewable energy generation included in our plan is driven by the installation of two wind turbines at our Weatherlees Hill and Peel Common sites during AMP6. Ofwat's cost models make no allowance (either implicit or explicit) for wind turbines. As we are not being funded for our planned wind turbine schemes within our cost allowance, a financial penalty linked to the cost of these schemes in our plan for failure to deliver is not appropriate or internally consistent. If the ODI is retained then an explicit adjustment of £9.15m should be made to our cost threshold to fund these schemes.
2. Evidence
The totex associated with renewable energy included in our plan consists of a mix of investment in further CHP plants to maintain the proportion of renewable energy in the face of increasingly energy-intensive treatment to meet rising quality standards, and two wind turbine schemes at two works designed to deliver a step change in the level of energy generation (see criteria 2.5 - Minimising carbon emissions, Wastewater Outcomes chapter, June Business Plan update). Table 1 shows the proposed output and cost of these wind turbine schemes (before adjustment for operating cost savings).
Scheme Scheme Description Cost Output
Weatherlees Hill A
1 x 2.3 MW wind turbine
£5.52m 7,000 MWh/annum
Peel Common 1 x 2.3 MW wind turbine
£5.52m 7,000 MWh/annum
Ofwat's cost models for AMP6 have been developed by analysis of cost driver and expenditure data for the period 2004-05 to 2012-13. During the period covered by this data Ofwat treated all wind turbine expenditure as non-regulated business; therefore there is none of this type of activity within the data used to specify the models. Ofwat stated in their PR09 guidance that “We define appointed activities as those which are integral to the business of a water company. Examples include combined heat and power (CHP) plants which are installed as an integral part of a sewage treatment works. A wind turbine, however, is not an integral part of the works and so would be classified as a non-appointed activity.” (see PR09/14). The value of the schemes at £9.15m (net of operational cost savings) is below Ofwat's materiality threshold of 0.5% for special cost allowance adjustments. It is therefore clear that Ofwat's models do not (either implicitly or explicitly) allow any funding for the schemes which will deliver the improvement set out in the ODI target. It is therefore inappropriate that the increase in our proportion of renewable energy, which will come about due to these schemes, is linked to a potential financial penalty.

23
If Ofwat retain the ODI then an explicit adjustment of £9.15m must be made to our cost threshold to fund the schemes to ensure that the price control is internally consistent.
3. Board Engagement
The Board were supportive of our original proposals for ODIs which did not included a proposal for enhanced reporting on the renewable energy schemes. They have reviewed this representation as part of their review of the overall Business Plan representations.
4. CCG
Our CCG acknowledge that it would be inconsistent for Ofwat to impose a financial penalty whilst not funding the associated investment.
5. External Assurance
The data used to support our representations has all been assured by Halcrow.

24
Response to Draft Determination
7. Outcome Delivery Incentives - Introduction of WWTW % population equivalent compliance as part of wastewater asset health measure
Issue
Ofwat has introduced wastewater treatment works (WWTW) % p.e. compliance as a sub-measure of our wastewater asset health ODI. Ofwat has introduced this measure to ensure that we remain incentivised to perform in this area, as it is an area where we are to be shortfalled for our performance during 2010-15. We recognise that this measure has been used as a serviceability measure for a number of years. However, we do not believe that it is an effective or well-targeted measure and its inclusion for Southern Water disadvantages us when compared with the rest of the industry. There are three key issues that arise with the inclusion of this sub-measure.
First, it is not an effective measure of the environmental impact of treatment works compliance failures. The majority of our large treatment works are coastal and typically discharge 1-3 km out to sea. This means any effluent quality deterioration will have a negligible impact on the environment. This is in contrast to small p.e. inland treatment works, that have little material impact on the percentage p.e. measure, but can significantly impact water courses if effluent quality deteriorates.
Second, the level at which the deadband has been set, which is based on the AMP5 serviceability upper control limit is much narrower than that which applied to other companies. The industry average upper control limit which applied in AMP5 is 400% higher than our limit. This means that a single failed treatment works is much more likely to cause a breach in our upper control limit compared with other companies. For example, based on our analysis of the number of large works across the industry, we would have been three times more likely than Thames Water and over ten times more likely than Anglian Water and Northumbrian Water to breach our upper control limit.
Third, Ofwat has not been consistent in applying this measure for all companies. Given the weaknesses of the measure, particularly as applied to our circumstances, we do not believe it is appropriate for Ofwat to require it for one company but not others.
Remedy
This sub-measure should be excluded from the wastewater asset health measure.
The potential financial penalty associated with this measure should be re-allocated to the WWTW numeric compliance sub-measure of the asset health ODI, in line with our original proposals.
If it is retained, it is essential that the target and deadband are set at the average level which applied to other companies in AMP5.

25
Summary of the evidence
1. Justification
The addition of WWTW % p.e. compliance as a sub-measure of our wastewater asset health is neither justified or appropriate. The measure is a poor indicator of environmental harm and the porposed target level, which has been based on the AMP5 serviceability reference level and tramlines, is too narrow, meaning that a single number of failures at our large works could cause a breach. Ofwat has not treated companies consistently in only adding this measure for Southern Water. All of these factors make the inclusion of this sub-measure in appropriate. However, if it is retained, it is essential that the target and deadband are set at the average level which applied to other companies in AMP5.
2. Evidence
2.1 The measure does not effectively reflect the impact of compliance failures on the environment The majority of our large treatment works are coastal and typically discharge 1-3 km out to sea. As such any effluent quality deterioration will have a negligible impact on the environment. This can be contrasted to small p.e. inland treatment works, that have little material impact on the percentage p.e. measure, but effluent quality deterioration can have devastating impacts on water courses. In particular for Southern Water:
Our eight largest treatment works (representing 40% of the population served), which if they individually failed, would all breach the deadband and incur a penalty, all discharge to sea.
Our 12 largest works (representing 50% of the population served), which if individually failed, would breach the UCL, all discharge to sea or tidal estuaries.
75% of the population are serviced by 29 treatment works, 24 of which discharge to sea or tidal estuaries.
This measure is therefore not effective at measuring the degree of environmental impact of failures from Southern Water's asset base. Neither is there any relevant customer detriment from such failures. On that basis it is a poor measure and does not deliver against any of our customers priorities. 2.2 The target and deadband have been set at an inappropriately low level The PR09 final determination applied a reference level of 0.1% and an upper control limit of 0.2%. Ofwat have used the same level for the asset health ODI sub-measure introduced in the Draft Determination. Table 1 below compares this with the rest of the industry.

26
Table 1. Comparison of AMP5 reference levels
The table shows that the highest upper control limit (company H) is 12.5 times higher than ours. The industry average upper control limit is 400% higher than the limit applied to us. We do not believe there is an objective justification for differences of this magnitude that clearly require Southern Water to achieve a much higher standard of performance than other companies. Comparison of AMP5 reference levels and control limits across the industry using the available data shows that if we had failed on a single large treatment works, we would face a three times greater risk than Thames Water and over ten times greater risk than Anglian Water and Northumbrian Water of breaching our upper control limit. This is due to our higher proportion of large treatment works, as shown in Table 2 below. Table 2. Comparison of AMP5 control limits and large works
2.3 Ofwat have not been consistent across companies For the reasons set out above, we did not include this measure as part of our asset health ODI. Ofwat has only included this measure in a limited number of companies' Draft Determinations. The evidence described above shows that it is not an appropriate measure, particularly for Southern Water. Since it is not a performance measure which has been required consistently across the industry, and given its ineffectiveness in measuring our own performance, it should be excluded from our set of ODIs. However, if it is retained, it is essential that the target and deadband are set at the average level which applied to other companies in AMP5.
% Large Works
(Table 17c definition)
Number of WTW's with
p.e >UCL
Expressed as %age of Total
No of WTW's
15 23 6.60%
11 68 18.40%
11 34 5.90%
6 Insufficient available data
6 18 4.40%
6 Insufficient available data
5 7 1.70%
4 17 1.50%
3 Insufficient available data
3 Insufficient available dataSouth West
Yorkshire
Anglian
Dwr Cymru
Northumbrian
Severn Trent
Company
Southern
Thames
United Utilities
Wessex

27
3. Board Engagement
The Board were supportive of our original proposals for ODIs, which did not included a proposal for reporting on WWTW p.e. compliance. They have reviewed this representation as part of their review of the overall Business Plan representations.
4. CCG
Our CCG have reviewed our overall submission on ODIs, but have not specifically been asked to review the adjustment presented here.
5. External Assurance
The data used to support our representations has all been assured by Halcrow.

28
Response to Draft Determination
8. Outcome Delivery Incentives - Serious pollution incidents
Issue
Ofwat has removed the reward component of our ‘serious pollution incidents’ ODI on the basis that it is not appropriate for companies to earn rewards for performance if they are still causing category 1 or 2 pollution incidents. We believe that, given new guidelines published in February 2014 by the Sentencing Council for judges and magistrates on sentencing for environmental offences, the penalty component of this ODI is also no longer necessary or appropriate and we propose that this should be retained as a reputational only ODI. Based on these new sentencing guidelines, large companies can expect penalties for offences resulting from negligence starting from £140,000, on a range of £60,000 to £750,000. A company of Southern Water's size can expect penalties for such offences starting at £300,000 for category 1 incidents and £140,000 for category 2 incidents. This is substantially higher than the level of fine that has been imposed to date,, which many stakeholders and customers saw as inadequete. This expected penalty greatly exceeds the willingness-to-pay valuation of £137,423 assigned to this measure by our customers. If a penalty for causing a pollution incident also applies through the ODI mechanism, we would be incentivised to allocate significantly more resources than is optimal to reduce the number of serious pollution incidents and be incentivised to spend more than our customers have told us they are willing to pay to avoid serious pollution incidents. This would not align with Ofwat's methodology on the use of willingness-to-pay evidence to inform incentive rates to ensure the optimal level of service is delivered for customers. In light of the new sentencing guidelines which are now being given effect by the Courts we now believe it is appropriate to remove the financial component of this ODI. Legislation will ensure that we face strong financial incentives to deliver this outcome, and our Business Plan promise to our customers to reduce the number of serious pollution incidents to zero by 2020 will ensure we face also face a strong reputational incentive.
Remedy
The penalty component of this ODI should also be removed and the performance commitment should be subject to a reputational rather than a financial incentive.

29
Summary of the evidence
1. Justification
Throughout our Business Plan research process our customers have strongly supported our ambition to reduce the number of serious pollution incidents we cause. We have obtained estimates of their willingness-to-pay in a number of engagement exercises since the beginning of our Business Plan research process. The expressed willingness-to-pay is greatly exceeded by the expected financial penalties through the Counts for causing a serious pollution incident under new guidelines published by the Sentencing Council. Additional financial penalties through the ODI mechanism would incentivise Southern Water to allocate significantly more resources to the reduction of serious pollution incidents than our customers have told us they are willing to pay for. Given these new guidelines, we believe the penalty component of this ODI should also be removed and the performance commitment should be subject to a reputational rather than a financial incentive.
2. Evidence
For our December Business Plan we estimated our customers' willingness-to-pay for a range of outcomes to understand their priorities and to inform incentive rates to ensure the delivery of the optimal level of service in each priority area. The research study, carried out by Accent in May 2013, indicated that our customers would be willing to pay £299,598 to avoid a category 1 pollution incident and £30,244 to avoid a category 2 pollution incident. Based on the historic ratio of category 1 and 2 pollution incidents, we estimated a weighted average WTP to avoid a serious pollution incident (category 1 or 2) of £137,423. Willingness-to-pay research carried out by DJS in August 2014 (see annex 1 for the full research report) showed that our household customers support the penalty component of this ODI at the level we proposed. 51% of our household customers found the level of penalty, at £137,423, to be acceptable. New guidelines for judges and magistrates on sentencing environmental offences published by the Sentencing Council in February 2014 require that significantly larger financial penalties are imposed on companies for causing pollution incidents. For offences resulting from negligence, the starting point for a large company (defined as a company having a turnover of £50 million and over) is £300,000 for a category 1 incident and £140,000 for a category 2 incident, within a range of £60,000 to £750,000. The guidelines also state that for very large companies, where a "…defendant company's turnover or equivalent very greatly exceeds the threshold for large companies…", the Courts may find it necessary to move outside the suggested range to achieve a proportionate sentence. In the case of Southern Water, whose turnover greatly exceeds the threshold for large companies, the expected starting point for such offences for Southern Water is £300,000 for category 1 incidents and £140,000 for category 2 incidents.
30
An additional penalty through the ODI mechanism would increase the incentive rate by a factor of approximately 2.5 times customers' willingness-to-pay. An incentive rate of this strength would incentivise us to spend far more than our customers want us to in order to avoid serious pollution incidents. This would not align with Ofwat's methodology on the use of willingness-to-pay evidence to inform incentive rates to ensure the optimal level of service is delivered for customers. Therefore, the penalty component of this ODI should also be removed and the performance commitment should be subject to a reputational rather than a financial incentive.
3. Board Engagement
The Board has reviewed this representation as part of their review of the overall Business Plan representations.
4. CCG
Our CCG recognised that the existence of double jeopardy in this instance would make it unreasonable for us to face a substantial ODI penalty.
5. External Assurance
The data used to support our representations has all been assured by Halcrow. In particular they have verified our analysis of the comparative number of pollution incidents caused.

31
Response to Draft Determination
9. Outcome Delivery Incentives - Horizontal adjustment to targets
Issue
Ofwat have carried out a horizontal analysis of companies' historic performance for a range of measures to estimate industry upper quartile performance levels. For a number of measures, these estimated upper quartile performance levels have been imposed across the industry. Companies were not given the opportunity to feed into the methods used in the horizontal audits, which would have enabled important points to be considered to be shared with Ofwat earlier. There are four areas where we do not think Ofwat's adjustments to our performance commitments based on the horizontal analysis are appropriate:
A significant reduction in the category 1 to 3 pollution incidents target to 156 by 2017-18 (see separate representation).
An increase in the Mean Zonal Compliance target to 100% by 2017-18.
A decrease in the deadband for interruptions to supply to 10 minutes per property.
A significant tightening of the deadband associated with sewer blockages. 2.1 Mean Zonal Compliance Ofwat has set the target for water quality Mean Zonal Compliance at 100% by 2017-18. While we, and the rest of the sector, share the aspiration to get to 100% compliance - and indeed we included this as an aspiration in our December business plan - in reality, historic evidence shows that achievement of this target is very rare and would require very significant investment to reliably achieve every year. Ofwat's historic analysis of companies' Mean Zonal Compliance shows that, out of 18 companies, only once in the last three years has a company achieved 100% compliance. This is shown in Table 1 below.

32
Table 1. Mean Zonal Compliance %
Company 2011 2012 2013 3 year average
ANH 99.96 99.96 99.96 99.96
NES 99.94 99.92 99.93 99.93
SRN 99.95 99.93 99.94 99.94
SVT 99.97 99.96 99.97 99.97
SWT 99.99 99.97 99.98 99.98
TMS 99.98 99.97 99.99 99.98
UU 99.95 99.95 99.97 99.96
WSH 99.96 99.96 99.97 99.96
WSX 99.98 99.98 99.97 99.98
YKY 99.98 99.93 99.98 99.96
AFW 99.98 99.95 99.99 99.97
BRL 99.96 99.99 99.97 99.97
DVW 99.94 99.93 99.93 99.93
PRT 99.98 99.96 99.97 99.97
SBW 99.98 99.99 99.96 99.98
SES 99.96 100.00 99.96 99.97
SEW 99.92 99.96 99.97 99.95
SSC 99.96 99.92 99.96 99.95
Source: Ofwat upper quartile analysis Setting an absolute target of 100% compliance is therefore, in our view unrealistic and unlikely to be achieved by most companies. That means that most of the sector will have to report to their customers that they have failed to meet targets for water compliance, despite achieving extremely high standards. Our very real concern is that all of the good work that has been done in engaging with customers during this price review could be undermined by a perception that performance on water quality is no longer adequate. This could cause serious reputational damage to both companies, Ofwat and the DWI. This could be a very real threat to the legitimacy of the sector as a whole, which we do not believe would fairly reflect real performance. We would therefore urge Ofwat to reconsider the inclusion of this target at 100%. 2.2 Interruptions to supply Ofwat has set a deadband across the industry for interruptions to supply at 10 minutes per property on the basis of its horizontal audits, so that we are aligned with the industry upper quartile level. This adjustment has been applied consistently across all companies. The deadband is very close to our Business Plan target of 9 minutes per property, which was set to be consistent with our historic performance and was consistent with our customers’ priority to maintain performance in this area in the long term. Given the target level and the fact that we are not seeking funding to improve this level, a deadband which is so close to the target is not appropriate because it takes almost no account of the natural historic variation in this measure. Because Ofwat has not accounted

33
for this natural variability, companies are at risk of being penalised for performance which is not within their control. The following chart illustrates the historic variability in this measure. Figure 1: Interruption to supply RC12 to RC14
Source: Industry datashare RC12, RC13 and RC14 Based on Figure 1 the average range for companies during the three years across the industry is 9.3 minutes. Setting the deadband at the upper quartile level does not take into account this variation. The deadband we initially proposed, at 14 minutes, was calculated using historic evidence to account for the impact of natural variation in the measure. There are also inconsistencies between companies in the measurement of interruptions to supply. As a result of these inconsistencies in measurement we are at a greater risk of facing penalties for adopting best practice. We require a minimum of 5m head in the system to declare an end to a customer supply
interruption. We are aware from reviewing reporters’ reports that this is not consistently
applied across the industry. Other companies deem that customers are back in supply once
the isolating valves are re-opened and a minimum of 1m head is reached.
An incident at Midanbury Lane in 2012-13 illustrates the very material impact of this inconsistency in reporting. Table 2 compares the number of properties affected based on the two different reporting methods. Table 2. Properties affected by Midbury Lane interruption to supply 2012-13
Area reference Number of properties affected (5m allowance)
Number of properties affected (1m allowance)
OD10 642 37
OD16 436 10
OD13 380 3
OD12 28 0
Total 1456 50
0.0
10.0
20.0
30.0
40.0
50.0
60.0
Min
ute
s lo
st
per
pro
pert
y
Variation in interuptions to supply
Max
Min
Range

34
For comparative assessment purposes, in particular for assessments which can increase the likelihood of financial penalties, a detailed review to ensure consistency of reporting is required prior to calculation of upper quartile performance levels. On the basis of our evidence on the expected variation in the number of minutes of lost supply, and the inconsistency in reporting methods across companies, we believe Ofwat should reinstate our proposed deadband at 14 minutes per property. 2.3 Interruptions to supply Ofwat has significantly tightened the deadbands associated with sewer blockages as compared with our July proposal. Since the adoption of private sewers in October 2011, the level of sewer blocks has grown significantly. There remains significant uncertainty around the reporting of incidents related to former private sewers and it is likely that we still do not know the underlying level of blocks experienced on these assets. We therefore suggest that Ofwat should revert to our original July proposals, which provide an appropriate balance of risk, in the light of this uncertainty.
3. Board Engagement
The Board has reviewed and endorsed this representation as part of their review of the overall Business Plan representations.
4. CCG
Our CCG have reviewed our overall submission on ODIs, but have not specifically been asked to review the adjustment presented here.
5. External Assurance
The data used to support our representations has all been assured by Halcrow. In particular they have verified our analysis of the variation in historic supply interruptions across companies and the comparative analysis of properties affected by the 2012-13 Midanbury Lane interruption.

35
Response to Draft Determination
10. Outcome Delivery Incentives - Category 1 to 3 pollution incidents (asset health)
Issue
Ofwat has adjusted our annual targets for this measure on the basis of its horizontal audits, so that we are aligned with the industry upper quartile level by 2017-18. This adjustment has been applied consistently across all companies. However, companies were not given the opportunity to feed into the methods used in the horizontal audits, which would have enabled a number of important points with respect to the pollution incidents target to be considered by Ofwat earlier. In this case, Ofwat's method to estimate the upper quartile uses the length of companies' sewer networks to normalise across companies. However, the number of pollution incidents is not only influenced by length of network but also the scale of monitoring and reporting. Although the level of self-reporting is improving over time, there are still some companies with low levels of self-reporting, which will reduce the upper quartile number of pollution incidents. There are also other factors, such as the receiving water sensitivity and dilution factors, which will affect the impact of pollution incidents, along with the level of past investment funded by the customers of some companies to improve performance. This must be taken account of in any future assessment when comparing performance across the industry on this measure. For these reasons we do not believe it is appropriate to align the target for pollution incidents across companies. Ofwat has also not taken any account of future incidents caused by private pumping stations in their calculation of the upper quartile level. Our analysis indicates that an additional 26 incidents can be expected per year. If the measure is retained, which we do not believe it should be, an appropriate adjustment must be made to the calculation of the upper quartile level.
Remedy
Our annual targets for category 1 to 3 pollution incidents should be reinstated to their original levels.
If Ofwat do retain a common target, their estimate of the upper quartile level should be adjusted to take account of the expected number of incidents from private pumping stations. This would result in a target of 182 category 1 to 3 pollution incidents from 2017-18 to 2019-20.
36
Summary of the evidence
1. Justification
Ofwat has adjusted the performance commitments for category 1-3 pollution incidents for all companies in line with its estimated industry upper quartile level. However, pollution incidents across the industry are not comparable because of varying self-reporting rates, different receiving water sensitivity and dilution factors across companies. Furthermore, the adjustment takes no account of previous funding for reducing pollution incidents, which customers of some companies will have paid for through their bills. Ofwat's calculated upper quartile level for this measure also does not take account of the number of incidents caused by private pumping stations, which we will assume responsibility for in October 2016. If the measure is retained it is essential that an adjustment is made to account for this.
2. Evidence
2.1 Lack of comparability of data
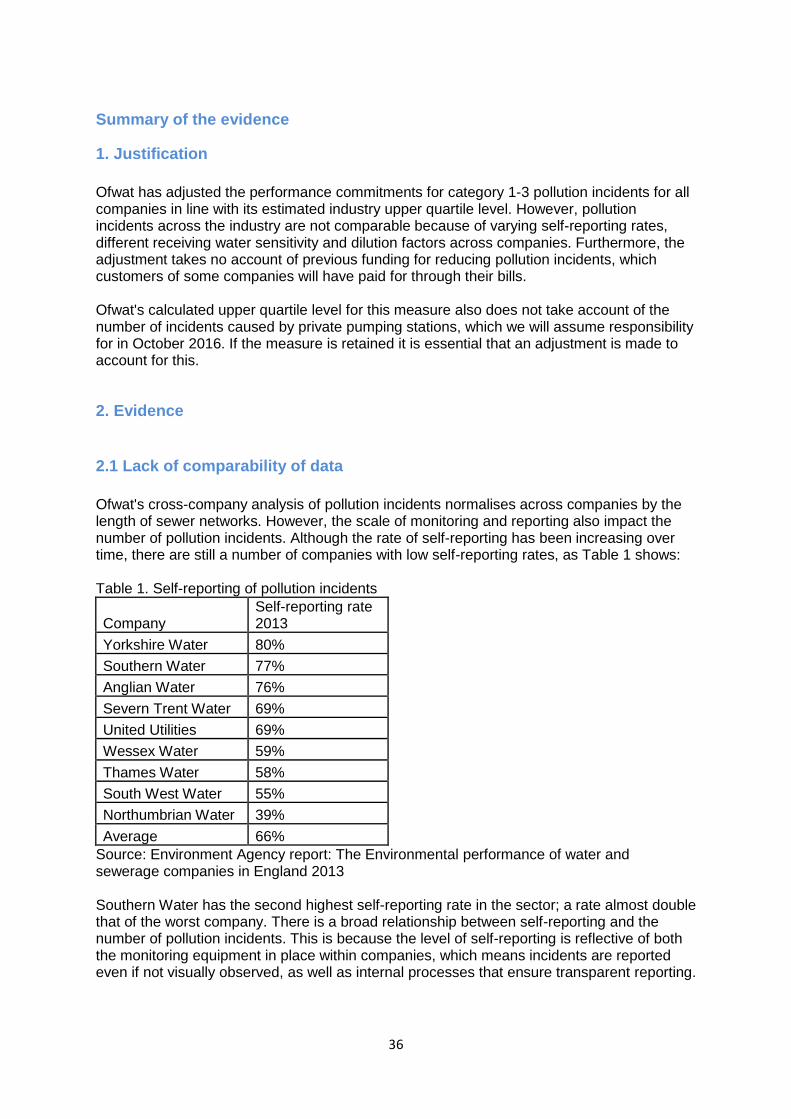
Ofwat's cross-company analysis of pollution incidents normalises across companies by the length of sewer networks. However, the scale of monitoring and reporting also impact the number of pollution incidents. Although the rate of self-reporting has been increasing over time, there are still a number of companies with low self-reporting rates, as Table 1 shows: Table 1. Self-reporting of pollution incidents
Company Self-reporting rate 2013
Yorkshire Water 80%
Southern Water 77%
Anglian Water 76%
Severn Trent Water 69%
United Utilities 69%
Wessex Water 59%
Thames Water 58%
South West Water 55%
Northumbrian Water 39%
Average 66%
Source: Environment Agency report: The Environmental performance of water and sewerage companies in England 2013 Southern Water has the second highest self-reporting rate in the sector; a rate almost double that of the worst company. There is a broad relationship between self-reporting and the number of pollution incidents. This is because the level of self-reporting is reflective of both the monitoring equipment in place within companies, which means incidents are reported even if not visually observed, as well as internal processes that ensure transparent reporting.
37
This lack of comparability of the data means that calculations of the upper quartile which do not normalise for these factors will be fundamentally distorted, and for a company like Southern Water, with a very high rate of self-reporting, mean that an unrealistically low target is set. There are also other factors, such as the receiving water sensitivity and dilution factors, which will affect the impact of pollution incidents, along with the level of past investment funded by customers of some companies to improve performance. Ofwat has not taken these factors into account in its analysis. We therefore believe it is inappropriate to impose a target based on a partial analysis. Our original target should be reinstated.
2.2 Adjustment for private pumping stations
In October 2016, wastewater companies will adopt all private pumping stations, following adoption of private sewers in October 2011. If the pollution incidents target is retained on the basis of comparative performance, then it is essential that an adjustment to the upper quartile measure is made to reflect the significant addition to the asset base. From MD109, over the last 12 years we have caused, on average, 98 category 1 to 3 pollution incidents per year from our public pumping stations. Across our region, we have an total of 2,385 public pumping stations and will adopt an estimated 642 private pumping stations in 2016. It is reasonable to assume that the ratio of pollution incidents is likely to be equal between private and public pumping stations. On that basis, we estimate that the adoption of these assets will result in an additional 26 category 1 to 3 pollution incidents. (Further details of our approach to the adoption of private pumping stations are set out in Chapter 3, Wastewater Outcomes, of our June business update.) This needs to be added to Ofwat's calculated upper quartile annual targets for category 1 to 3 pollution incidents. The annual targets from 2017-18 would be increased from 156 to 182 incidents, with a penalty collar at 287 incidents, compared with 261 in the draft determination.
3. Board Engagement
The Board has reviewed and endorsed this representation as part of their review of the overall Business Plan representations.
4. CCG
Our CCG has reviewed this measure as part of our suite of Asset Health measures. They have not specifically been asked to review the adjustment presented here.
5. External Assurance
The data used to support our representations has all been assured by Halcrow. In particular they have verified our analysis of pollution incidents from private pumping stations.

38
Section 2 – Revised ODI tables
This section provides the details of our updated proposals on ODIs in Ofwat’s table format.
Included are all the revisions which we have explained in our ten representations from
section one of this chapter. Also included are:
The updated proposals on the ODI to deliver ‘excellent’ standard bathing water
Four new log-down ODIs to ensure customers are protected against the non-delivery
of schemes funded for AMP6 delivery
Four additional minor adjustments to incentive mechanisms.
ODI representations
The details of our proposed adjustments described in the ten representations in section one
of this document are described in the tables in the following pages. These detail the ODI
structures which we believe should replace Ofwat’s proposals in our Draft Determination.
‘Excellent’ quality bathing water
We have revised our proposed ODI for delivering ‘excellent’ quality bathing waters during
AMP6. The revised proposals are detailed from page 54. The revised ODI mechanism is
formed of three component parts, as follows:
Part 1 – maintenance of the current level of beaches with ‘excellent’ bathing water
quality
This component of the ODI ensures that customers are protected from any deterioration in
the current level of ‘excellent’ quality bathing waters. Falling below our current level will
result in penalties equal to customers’ willingness-to-pay, adjusted for totex menu sharing, at
£291,500. Rewards will also apply where we outperform against our 2014-15 performance
level to ensure there is an incentive to outperform on our target where this is possible.
Rewards will reflect customers’ willingness-to-pay for improvements, adjusted for totex menu
sharing, at £246,750.
The current estimate of our 2014-15 performance level is 54 beaches with ‘excellent’ bathing
water quality. This will be confirmed and updated once Defra publish their annual bathing
water report, expected in autumn 2014. Based on the historic number of beaches with
‘excellent’ water quality from 2009 to 2014, excluding an outlier data point from 2013, we
have set deadbands at one standard deviation from the target and caps and collars at two
standard deviations. Our expected annual deadbands are at 48/60 beaches and the
expected caps and collars are at 42/66 beaches.
Year 2009 2010 2011 2012 2013 2014* Standard Deviation
No at ‘excellent’
48 38 46 47 61 54 5.95
Table 1 – bathing waters at ‘excellent’ quality on an annual basis (*based on bathing
water information prior to the conclusion of the 2014 bathing season)
39
Measurement of performance for this component of the ODI applies only to beaches which
are not targeted for specific investment under the Final Determination bathing water clean
seas enhancement programme.
Part 2 – Delivery of targeted bathing water improvements for AMP6
The second part ensures that customers are protected from the non-delivery of the seven
beaches which we are being funded to improve to ‘excellent’ standard. These seven
beaches will be chosen based on our selection criteria which we have agreed with our
customers (see Annex 2 for full set of criteria). To ensure that we correctly apply the criteria,
our selection of beaches will be independently assured and agreed with our Independent
Customer Advisory Panel.
Failure to deliver any of the agreed beaches by 2019-20 will result in financial penalties
equal to the incremental totex associated with delivering the beaches, adjusted for totex
menu sharing, at £2.25m per beach.
This component of the ODI also incentivises the early delivery of beaches where possible.
The willingness-to-pay research we have carried out indicates the benefit customers derive
from additional years of beaches with ‘excellent’ water quality. Early delivery of schemes will
therefore result in financial rewards equal to their annual willingness-to-pay, adjusted for
totex menu sharing, at £246,750.
Part 3 – Protection for customers from windfall gain
The third component of this ODI protects customers against any possible windfall gain which
could arise due to the current uncertainty around the costs of delivering additional beaches
to ‘excellent’ standard. This component of the ODI ensures that, if, following the
investigations, the actual costs associated with delivery of the programme are materially
different from the current estimated costs (defined as one standard deviation below the
estimated cost of £31.5m – hence the deadband at £24.56m), the difference will be returned
to our customers through the ODI mechanism.
Log-down ODIs
We have also included four additional ODIs to protect customers against the non-delivery of
four of our planned schemes for AMP6 – Woolmans Wood, Thanet sewers, Millbrook sludge
and Woolston WWTW. These are simple log-down mechanisms, which require that if the
planned schemes are not delivered by the planned dates, the allowed funding is returned to
our customers.
Additional adjustments
There are also four additional minor adjustments we have made to our ODIs.
The measure “Awareness of water hardness measures” has been moved to from wholesale
to retail, in line with our original plan, as this is a survey measure and relates to providing
better information to our customers to improve their awareness.
40
For our “internal flooding incidents” measure we had initially included an exclusion from
financial penalties if exceptional accounting costs were incurred. Under IFRS the concept
exceptional costs no longer exists so we have proposed reverting to a severe weather
exclusion in line with that used for the June Return previously.
On our WWTW compliance measure we have included two additional requirements:
Compliance is only required on numeric WRA/UWWTD permits
Compliance with NEP4 and NEP5 permits is based on funded schemes against
current known standards and not any subsequent revisions following the Final
Determination.
On renewable energy, we have adjusted the wording in the ‘Necessary detail on
measurement units’ section in line with our customer promise so that the percentage of
renewable energy generated out of total operational energy used is measured rather than
the total percentage sourced out of total operational energy used. This measure reflects the
planned improvements from 14.5% to 16.5%, as promised to our customers in our Business
Plan. If Ofwat retain the description as it is in the Draft Determination, the relevant starting
level is 12.3% and the target for 2019-20 is 14.1%.

41
Wholesale water outcome 1: A Constant Supply of High Quality Drinking Water
Performance commitment 1: Water Asset Health
Detailed definition of performance measure: Composite measure, consisting of
the following components:
Mains bursts
TIM distribution index
Discolouration contacts
Coliform compliance WSW
Coliform compliance WSR
Turbidity
Incentive type: Financial – penalty only.
Performance commitments
Starting
level
Committed performance levels
Unit 2014-15 2015-16 2016-17 2017-18 2018-19 2019-20
PC Stable Stable Stable Stable Stable
Penalty collar See below
Penalty
deadband
See below
Reward
deadband
n/a n/a n/a n/a n/a
Reward cap n/a n/a n/a n/a n/a
Incentive rates
Incentive type Performance levels Incentive rate (£/unit/year)
Lower Upper
Penalty mains
bursts
2865 bursts 2383 bursts £4,170 per burst
Penalty TIM 99.74% 99.82% £115,875 per 0.01%
Penalty
discolouration
contacts (nr/1000)
1.21 per 1000
properties
0.74 per 1000
properties
£5,710 per 0.01 contacts
Penalty coliform
compliance WSW
99.88% 99.92% £97,500 per 0.01%

42
Incentive type Performance levels Incentive rate (£/unit/year)
(%)
Penalty coliform
compliance WSR
(%)
98% 99% £250,000 per %
Penalty turbidity
(nr of sites)
10 6 £195,000 per site
Additional details
Necessary detail on
measurement units
Stable performance means that performance for all
components of the ODI is better than below the
higher performance level. Measurement to follow
guidelines as defined for the Ofwat KPIs in ‘Key
performance indicators – guidance’, IN 13/03
Frequency of PC measurement
and any use of averaging
Performance will be measured and reported annually.
Timing and frequency of
rewards/penalties
Penalties apply at the end of the AMP period.
Penalties will apply for underperformance (below
deadband) for two consecutive years during the
AMP. In this scenario, the penalty incentive rates will
apply for performance between the deadband and
collar in both underperforming years.
The impact of severe weather conditions will be taken
into account. As with the previous serviceability
mechanism, any extreme weather will be adjusted for
after the event, and any adjustments will be
independently assured.
Form of reward/penalty Revenue-based penalty which is to be funded
through an equivalent adjustment to the RCV.
Any other information or
clarifications relevant to correct
application of incentive
The components of this performance measure will be
assessed individually. An overall penalty will then be
imposed against the water asset health measure
based on the combined performance against these
individual commitments.

43
Performance commitment 3: Leakage
Detailed definition of performance measure: Megalitres per day of leakage, on
average, between 2015/16 and 2019/20.
Incentive type: Financial – reward and penalty.
Performance commitments
Starting
level
Committed performance levels
Unit 2014-15 2015-16 2016-17 2017-18 2018-19 2019-20
PC Ml/d (5-
yr ave)
88 87
Penalty collar Ml/d (5-
yr ave)
96
Penalty
deadband
Ml/d (5-
yr ave)
87
Reward
deadband
Ml/d (5-
yr ave)
85
Reward cap Ml/d (5-
yr ave)
78
Incentive rates
Incentive type Performance levels (Ml/d (5-yr
ave))
Incentive rate (£/(Ml/d)/year)
Lower Upper
Penalty 1 87 96 139,007
Penalty 2
Reward 78 87 112,304
Additional details
Necessary detail on
measurement units
Measure to be as defined for the Ofwat KPI in IN
13/03.
Frequency of PC measurement
and any use of averaging
Performance will be measured and reported annually
and at the end of the AMP period as a five-year
average.

44
Timing and frequency of
rewards/penalties
Rewards and penalties apply at the end of the AMP
based on performance against the five-year average
target.
Form of reward/penalty Revenue adjustment
Any other information or
clarifications relevant to correct
application of incentive
Performance commitment 4: Interruptions to supply
Detailed definition of performance measure: Minutes per property lost through
water supply interruptions (greater than 3 hours) between 2015/16 and 2019/20.
Incentive type: Financial – penalty only
Performance commitments
Starting
level
Committed performance levels
Unit 2014-15 2015-16 2016-17 2017-18 2018-19 2019-20
PC Minut
es/pro
perty
9 9 9 9 9 9
Penalty collar 20 20 20 20 20
Peanlty
deadband
14 14 14 14 14
Incentive rates
Incentive type Performance levels
(minutes/property)
Incentive rate
(£/minutes/property/year)
Lower Upper
Penalty 1 14 20 58,875

45
Additional details
Necessary detail on
measurement units
Measurement of performance will follow the
guidelines as defined for the Ofwat KPIs in ‘Key
performance indicators – guidance’, IN 13/03.
The impact of severe weather conditions will be taken
into account. As with the previous serviceability
mechanism, any extreme weather will be adjusted for
after the event, and any adjustments will be
independently assured.
Frequency of PC measurement
and any use of averaging
Performance will be measured and reported annually.
Timing and frequency of
rewards/penalties
Rewards and penalties apply at the end of the AMP
period. Penalties will apply for underperformance
(below deadband) for two consecutive years during
the AMP. In this scenario, the penalty incentive rates
will apply for performance between the deadband
and collar in both underperforming years.
Form of reward/penalty Revenue adjustment
Any other information or
clarifications relevant to correct
application of incentive
Performance commitment 5: Drinking water quality
Detailed definition of performance measure: Compliance with the Drinking Water
Inspectorate (DWI) regulations as measured by Mean Zonal Compliance.
Incentive type: Financial – penalty only
Performance commitments
Starting
level
Committed performance levels
Unit 2014-15 2015-16 2016-17 2017-18 2018-19 2019-20
PC % 99.94 99.95 99.95 100 100 100
Penalty collar 99.91 99.91 99.94 99.94 99.94
Penalty
deadband
99.93 99.93 99.96 99.96 99.96

46
Incentive rates
Incentive type Performance levels (%)) Incentive rate (£/0.01%/year)
Lower Upper
Penalty 1 99.91 99.96 225,000
Additional details
Necessary detail on
measurement units
Performance against this measure is published by
the DWI.
Frequency of PC measurement
and any use of averaging
Performance will be measured and reported annually.
Timing and frequency of
rewards/penalties
Rewards and penalties apply at the end of the AMP
period. Penalties will apply for underperformance
(below deadband) for two consecutive years during
the AMP. In this scenario, the penalty incentive rates
will apply for performance between the deadband
and collar in both underperforming years.
Form of reward/penalty Revenue adjustment
Any other information or
clarifications relevant to correct
application of incentive
Wholesale water outcome 3: Better Information and Advice
Performance commitment 9: Per capita consumption
Detailed definition of performance measure: litres/head/day water consumption,
on average, between 2015/16 and 2019/20.
Incentive type: Financial – rewards and penalties
Performance commitments
Starting
level
Committed performance levels
Unit 2014-15 2015-16 2016-17 2017-18 2018-19 2019-20
PC Ml/d (5-
yr ave)
147.2 133.7
Penalty collar Ml/d (5- 135.7

47
Starting
level
Committed performance levels
Unit 2014-15 2015-16 2016-17 2017-18 2018-19 2019-20
yr ave)
Penalty
deadband
Ml/d (5-
yr ave)
133.7
Reward
deadband
Ml/d (5-
yr ave)
133.7
Reward cap Ml/d (5-
yr ave)
131.7
Incentive rates
Incentive type Performance levels (l/h/d (5-yr
ave))
Incentive rate (£/(l/h/d)/year)
Lower Upper
Penalty 133.7 135.7 687,500
Reward 131.7 133.7 687,500
Additional details
Necessary detail on
measurement units
The unit of measurement is post-Maximum Likelihood
Estimation weighted average litres per person per
day on average over the year.
Frequency of PC measurement
and any use of averaging
Measurement will be measured and reported
annually and at the end of the AMP period as a five-
year average. Annual performance will also be
measured and published.
Timing and frequency of
rewards/penalties
Rewards and penalties apply at the end of the AMP
based on performance against five-year average
target.
Form of reward/penalty Revenue adjustment
Any other information or
clarifications relevant to correct
application of incentive

48
Wholesale wastewater outcome 1: A Reliable Wastewater Service
Performance commitment 1: Wastewater Asset Health
Detailed definition of performance measure: Composite measure, consisting of
the following components:
Sewer collapses
Pollution incidents (category 1 to 3)
External flooding – other causes
Incentive type: Financial – penalty only.
Performance commitments
Starting
level
Committed performance levels
Unit 2014-15 2015-16 2016-17 2017-18 2018-19 2019-20
PC Stable Stable Stable Stable Stable
Penalty collar See below
Penalty
deadband
See below
Reward
deadband
n/a n/a n/a n/a n/a
Reward cap n/a n/a n/a n/a n/a
Incentive rates
Incentive type Performance levels Incentive rate (£/unit/year)
Lower Upper
Penalty sewer
collapses
368 collapses 392 collapses £56,250 per collapse
Penalty pollution
incidents (cat 1 to
3)
458 incidents 563 incidents £20,571 incidents
Penalty external
flooding (other
causes)
10,974
incidents
13,004
incidents
£296 per incident

49
Additional profile for pollution incidents (cat 1 to 3):
Additional details
Necessary detail on
measurement units
Stable performance means all that performance for
all components of the ODI is better than below the
higher performance level. Measurement to follow
guidelines as defined for the Ofwat KPIs in ‘Key
performance indicators – guidance’, IN 13/03.
Frequency of PC measurement
and any use of averaging
Performance will be measured and reported annually.
Timing and frequency of
rewards/penalties
Penalties apply at the end of the AMP period.
Penalties will apply for underperformance (below
deadband) in two consecutive years during the AMP.
In this scenario, the penalty incentive rates will apply
for performance between the deadband and collar in
both underperforming years.
The impact of severe weather conditions will be taken
into account. As with the previous serviceability
mechanism, any extreme weather will be adjusted for
after the event, and any adjustments will be
independently assured.
Form of reward/penalty Revenue-based penalty which is to be funded
through an equivalent adjustment to the RCV.
Any other information or
clarifications relevant to correct
application of incentive
The components of this performance measure will be
assessed individually. An overall penalty will then be
imposed against the water asset health measure
based on the combined performance against these
individual commitments.
Starting
level
Committed performance levels
Unit 2014-15 2015-
16
2016-
17
2017-
18
2018-
19
2019-
20
Pollution incidents num
ber
355 355 355 355 355 355
Penalty collar 563 563 563 563 563
Penalty
deadband
458 458 458 458 458

50
Performance commitment 2: Internal flooding incidents
Detailed definition of performance measure: The total number of internal
flooding incidents (all causes, including private sewers) between 2015/16 and
2019/20.
Incentive type: Financial – rewards and penalties
Performance commitments
Starting
level
Committed performance levels
Unit 2014-15 2015-16 2016-17 2017-18 2018-19 2019-20
PC Incidents
(5-yr
total)
2755 2070
Penalty collar Incidents
(5-yr
total)
2440
Penalty
deadband
Incidents
(5-yr
total)
2215
Reward
deadband
Incidents
(5-yr
total)
2000
Reward cap Incidents
(5-yr
total)
1700
Incentive rates
Incentive type Performance levels (incidents
(5-yr total))
Incentive rate (£/incident)
Lower Upper
Penalty 1 2070 2440 75,260
Penalty 2
Reward 1700 2070 72,228

51
Additional details
Necessary detail on
measurement units
Measurement of performance will follow the
guidelines from the June Return reporting
requirements and definitions manual and will include
private sewers. It will exclude exceptional incidents
associated with severe weather as defined in the
June Return reporting requirements.
Frequency of PC measurement
and any use of averaging
Performance to be measured and reported annually
and at the end of the AMP as a five-year total.
Timing and frequency of
rewards/penalties
Rewards and penalties apply at the end of the AMP
based on performance against five-year total target.
Form of reward/penalty Revenue adjustment
Any other information or
clarifications relevant to correct
application of incentive
Performance commitment 4: Sewer blockages
Detailed definition of performance measure: The number of blockages per km of
sewer length, annually between 2015/16 and 2019/20.
Incentive type: Financial – penalty only
Performance commitments
Starting
level
Committed performance levels
Unit 2014-15 2015-16 2016-17 2017-18 2018-19 2019-20
PC Nr/k
m
0.58 0.58 0.58 0.58 0.58 0.58
Penalty collar 0.65 0.65 0.65 0.65 0.65
Penalty deadband 0.59 0.59 0.59 0.59 0.59

52
Incentive rates
Incentive type Performance levels
(number/km)
Incentive rate (£m/(nr/km))
Lower Upper
Penalty 1 0.65 0.59 16.276
Additional details
Necessary detail on
measurement units
Measurement of performance will follow the
guidelines as defined for the Ofwat KPIs in ‘Key
performance indicators – guidance’, IN 13/03.
Frequency of PC measurement
and any use of averaging
Performance will be measured and reported annually.
Timing and frequency of
rewards/penalties
Penalties apply at the end of the AMP period.
Penalties will apply for underperformance (below
deadband) in two consecutive years during the AMP.
In this scenario, the penalty incentive rates will apply
for performance between the deadband and collar in
both underperforming years.
Form of reward/penalty Revenue adjustment
Any other information or
clarifications relevant to correct
application of incentive
Performance commitment 5: Odour complaints
Detailed definition of performance measure: The number of customer complaints
relating to odour from Portswood and Tonbridge treatment works, annually, between
2015/16 and 2019/20.
Incentive type: Financial – penalty only

53
Performance commitments
Starting
level
Committed performance levels
Unit 2014-15 2015-16 2016-17 2017-18 2018-19 2019-20
PC num
ber
0 0 0 0 0 0
Penalty collar 0 0 0 20 20
Penalty deadband 0 0 0 0 0
Incentive rates
Incentive type Performance levels
(complaints)
Incentive rate (£/complaint)
Lower Upper
Penalty 0 20 79,000
Additional details
Necessary detail on
measurement units
WWTW compliance is reported by the Environment
Agency on MD109.
Frequency of PC measurement
and any use of averaging
Performance will be measured and reported annually.
Timing and frequency of
rewards/penalties
Penalties apply at the end of the AMP period.
Penalties will apply for 2018-19 and 2019-20 if the
outturn is greater than the deadband.
Form of reward/penalty Revenue adjustment
Any other information or
clarifications relevant to correct
application of incentive
Only odour complaints from Portswood and
Tonbridge WWTWs are included in the measurement
of odour complaints for this ODI. This is to protect
customers against the non-delivery of the planned
odour schemes at these two works.

54
Wholesale wastewater outcome 2: Looking after the Environment
Performance commitment 6: Wastewater Treatment Works compliance
Detailed definition of performance measure: Compliance with wastewater
treatment works regulation as reported by the Environment Agency on MD109.
Incentive type: Financial – penalty only
Performance commitments
Starting
level
Committed performance levels
Unit 2014-15 2015-16 2016-17 2017-18 2018-19 2019-20
PC % 98.6 98.6 98.6 98.6 98.6 98.6
Penalty collar 96.8 96.8 96.8 96.8 96.8
Penalty
deadband
97.7 97.7 97.7 97.7 97.7
Incentive rates
Incentive type Performance levels (%) Incentive rate (£/0.01%/year)
Lower Upper
Penalty 97.7 96.8 688,880
Additional details
Necessary detail on
measurement units
WWTW Compliance is reported by the Environment
Agency on MD109.
Frequency of PC measurement
and any use of averaging
Performance will be measured and reported annually.
Timing and frequency of
rewards/penalties
Penalties apply at the end of the AMP period.
Penalties will apply for underperformance (below
deadband) for two consecutive years during the
AMP. In this scenario, the penalty incentive rates will
apply for performance between the deadband and
collar in both underperforming years.
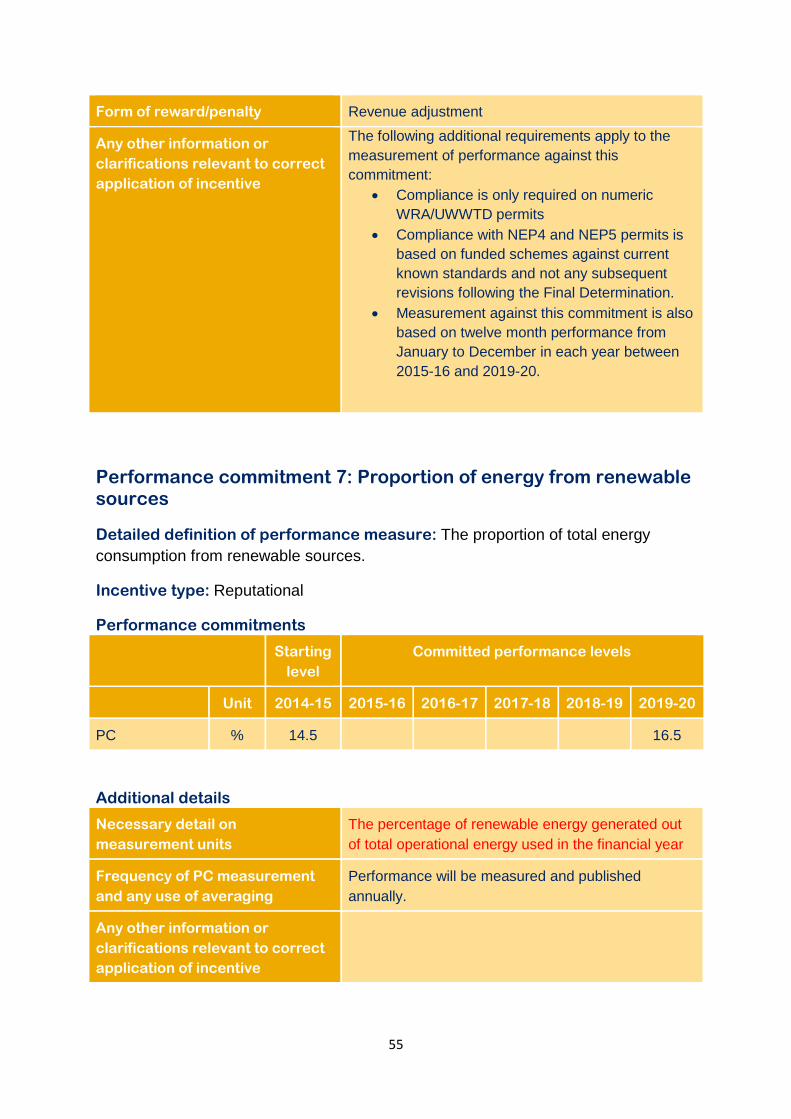
55
Form of reward/penalty Revenue adjustment
Any other information or
clarifications relevant to correct
application of incentive
The following additional requirements apply to the
measurement of performance against this
commitment:
Compliance is only required on numeric
WRA/UWWTD permits
Compliance with NEP4 and NEP5 permits is
based on funded schemes against current
known standards and not any subsequent
revisions following the Final Determination.
Measurement against this commitment is also
based on twelve month performance from
January to December in each year between
2015-16 and 2019-20.
Performance commitment 7: Proportion of energy from renewable sources
Detailed definition of performance measure: The proportion of total energy
consumption from renewable sources.
Incentive type: Reputational
Performance commitments
Starting
level
Committed performance levels
Unit 2014-15 2015-16 2016-17 2017-18 2018-19 2019-20
PC % 14.5 16.5
Additional details
Necessary detail on
measurement units
The percentage of renewable energy generated out
of total operational energy used in the financial year
Frequency of PC measurement
and any use of averaging
Performance will be measured and published
annually.
Any other information or
clarifications relevant to correct
application of incentive
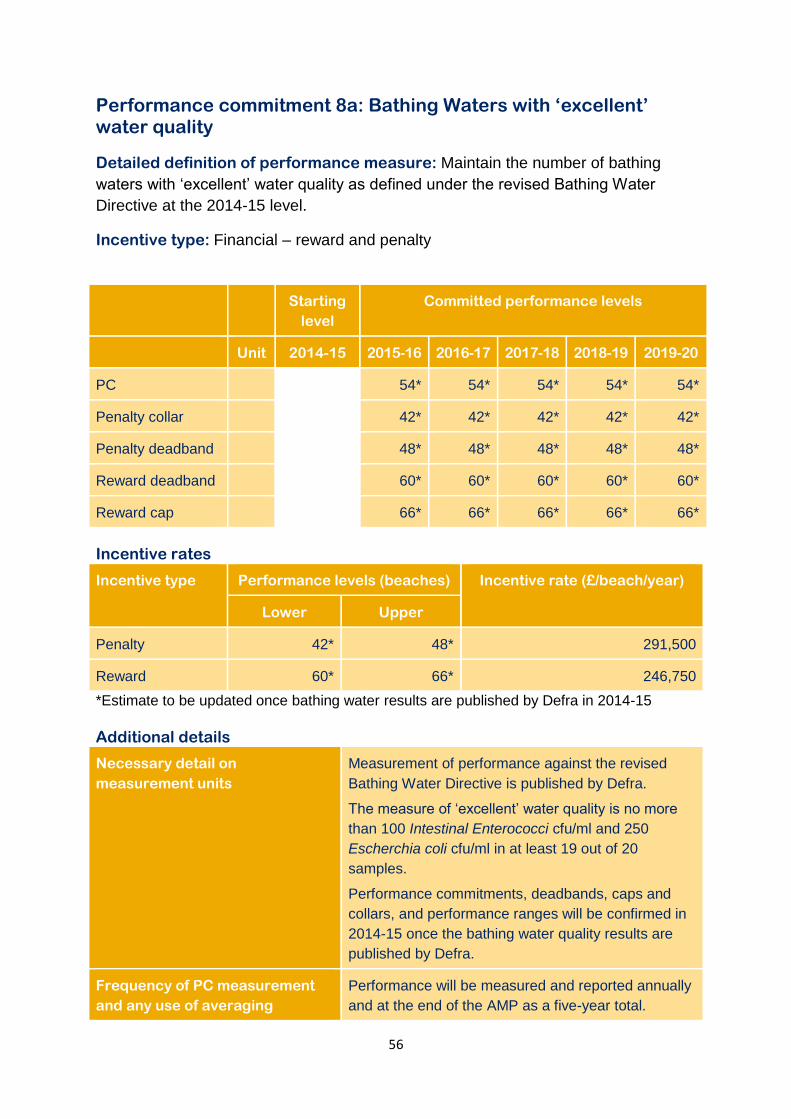
56
Performance commitment 8a: Bathing Waters with ‘excellent’ water quality
Detailed definition of performance measure: Maintain the number of bathing
waters with ‘excellent’ water quality as defined under the revised Bathing Water
Directive at the 2014-15 level.
Incentive type: Financial – reward and penalty
Starting
level
Committed performance levels
Unit 2014-15 2015-16 2016-17 2017-18 2018-19 2019-20
PC 54* 54* 54* 54* 54*
Penalty collar 42* 42* 42* 42* 42*
Penalty deadband 48* 48* 48* 48* 48*
Reward deadband 60* 60* 60* 60* 60*
Reward cap 66* 66* 66* 66* 66*
Incentive rates
Incentive type Performance levels (beaches) Incentive rate (£/beach/year)
Lower Upper
Penalty 42* 48* 291,500
Reward 60* 66* 246,750
*Estimate to be updated once bathing water results are published by Defra in 2014-15
Additional details
Necessary detail on
measurement units
Measurement of performance against the revised
Bathing Water Directive is published by Defra.
The measure of ‘excellent’ water quality is no more
than 100 Intestinal Enterococci cfu/ml and 250
Escherchia coli cfu/ml in at least 19 out of 20
samples.
Performance commitments, deadbands, caps and
collars, and performance ranges will be confirmed in
2014-15 once the bathing water quality results are
published by Defra.
Frequency of PC measurement
and any use of averaging
Performance will be measured and reported annually
and at the end of the AMP as a five-year total.

57
Timing and frequency of
rewards/penalties
Rewards and penalties apply at the end of the AMP
based on performance against the annual targets.
Form of reward/penalty Revenue adjustment
Any other information or
clarifications relevant to correct
application of incentive
The purpose of this component of the ODI is to
protect customers against any deterioration in the
current level of bathing waters with ‘excellent’ water
quality.
Rewards and penalties will apply for performance
against our 2014-15 level of bathing waters with
‘excellent’ water quality. Measurement applies only to
bathing waters which are not targeted for specific
investment under the Final Determination bathing
water clean seas enhancement programme.
Performance commitment 8b: Bathing Waters with ‘excellent’ water quality
Detailed definition of performance measure: Increase the number of bathing
waters with ‘excellent’ water quality as defined under the revised Bathing Water
Directive.
Incentive type: Financial – rewards and penalties
Performance commitments
Starting
level
Committed performance levels
Unit 2014-15 2015-16 2016-17 2017-18 2018-19 2019-20
target 0 0 0 0 7
Penalty collar 0 0 0 0 0
Penalty deadband 0 0 0 0 7
Reward deadband 0 0 0 0 7
Reward cap 7 7 7 7 7
Incentive rates
Incentive type Performance levels (beaches) Incentive rate (£/beach/year)
Lower Upper
Penalty 0 7 2,250,000

58
Incentive type Performance levels (beaches) Incentive rate (£/beach/year)
Reward 0 7 246,750
Additional details
Necessary detail on
measurement units
Measurement of performance against the revised
Bathing Water Directive is published by Defra.
The measure of ‘excellent’ water quality is no more
than 100 Intestinal Enterococci cfu/ml and 250
Escherchia coli cfu/ml in at least 19 out of 20
samples.
Frequency of PC measurement
and any use of averaging
Performance will be measured and reported annually
and at the end of the AMP as a five-year total.
Timing and frequency of
rewards/penalties
Rewards and penalties apply at the end of the AMP
based on performance against the annual targets.
Form of reward/penalty Revenue adjustment
Any other information or
clarifications relevant to correct
application of incentive
The purpose of this ODI is to protect customers from
the non-delivery of our programme to improve seven
bathing waters to ‘excellent’ standard in line with our
published selection criteria by 2019-20 (see Annex 2
for details of selection criteria).
Penalties will apply for failure to complete the seven
targeted beaches to ‘excellent’ standard by 2019-20
based on the unweighted application of our
independently assured selection criteria as described
in our Draft Determination representation.
Furthermore, the planned bathing waters will be
reviewed by the Independent Customer Advisory
Panel who will confirm whether we have
appropriately applied the bathing water selection
criteria.
Rewards will apply for the early delivery of the seven
targeted bathing waters to ‘excellent’ standard.

59
Performance commitment 8c: Bathing Waters with ‘excellent’ water quality
Detailed definition of performance measure: Estimated scheme costs of £31.5m
for our planned bathing water improvements
Incentive type: Financial – penalty only
Performance commitments
Starting
level
Committed performance levels
Unit 2014-15 2015-16 2016-
17
2017-18 2018-19 2019-20
PC £m n/a 31.5
Penalty collar £m 0
Penalty deadband £m 24.56
Incentive rates
Incentive type Performance levels (£m) Incentive rate (£m/£m/year)
Lower Upper
Penalty 0 24.56 0.5
Additional details
Necessary detail on
measurement units
The current estimated cost of delivering the Bathing Water programme is £31.5million. Once we have carried out the full scheme investigations, these costs will be re-estimated to determine whether they are materially different from the current expected cost.
Frequency of PC
measurement and any use of
averaging
The estimated costs will be compared once the
investigations have been completed during the AMP
period.
Timing and frequency of
rewards/penalties
Penalties will apply in 2019-20.
Form of reward/penalty RCV adjustment
Any other information or
clarifications relevant to
correct application of
incentive
This component of the ODI protects customers against any possible windfall gain which could arise due to the current uncertainty around the programme cost of delivering additional bathing waters to ‘excellent’ standard. This component of the ODI ensures that, if, following the investigations, the actual costs associated with delivery are materially different from the current estimated costs (defined as

60
one standard deviation below the estimated P50 cost of £31.5m, setting the deadband at £24.56m), the difference will be returned to our customers through the ODI mechanism.
Once we have the investigation results, the
programme costs will be re-estimated with more
informed solution costs. We will apply the bathing
water selection criteria following investigations, and if
the cost is less than that FD allowance, we will
calculate the windfall gain and return this to our
customers through the ODI mechanism.
The ‘performance commitment’ is an estimated cost
of £31.5m for the seven improvement schemes. If the
revised estimate following the investigations turns out
to be lower than the expected cost, for each £1m
below the deadband of £24.56m we will pay back
£0.5m to customers. They will get back the remaining
50% through cost performance incentives.
Performance commitment 9: Serious pollution incidents
Detailed definition of performance measure: The number of category 1 and 2
pollution incidents, as reported by the Environment Agency on MD109.
Incentive type: Reputational
Performance commitments
Starting
level
Committed performance levels
Unit 2014-15 2015-16 2016-17 2017-18 2018-19 2019-20
PC incid
ents
7 8 6 4 2 0
Additional details
Necessary detail on
measurement units
Measurement of performance will reflect the incidents
reported by the Environment Agency on MD109.
Frequency of PC measurement
and any use of averaging
Performance will be measured and reported annually.
Any other information or
clarifications relevant to correct
application of incentive

61
Wholesale retail outcome 2: Better Information and Advice
Performance commitment 10: Awareness of water hardness measures
Detailed definition of performance measure: The proportion of customers with
awareness of how to deal with hard water, measured by surveys.
Incentive type: Reputational
Performance commitments
Starting
level
Committed performance levels
Unit 2014-15 2015-16 2016-17 2017-18 2018-19 2019-20
PC % improve improve improve improve improve improve
Additional details
Necessary detail on
measurement units
Performance to be measured by customer surveys,
the first of which was carried out in 2013/14. Targets
to ‘improve’ on 2013/14 estimated performance of
67.1%. This estimate will be retested following the
June Business Plan update and the performance
commitments will be updated if necessary.
Frequency of PC measurement
and any use of averaging
Performance against this measure will be published
annually.
Any other information or
clarifications relevant to correct
application of incentive
Performance commitment: Woolmans Wood
Detailed definition of performance measure: Delivery of Woolmans Wood
scheme to achieve compliance with DWI undertaking by 31/03/2020.
Incentive type: Financial – penalty only

62
Performance commitments
Starting
level
Committed performance levels
Unit 2014-15 2015-16 2016-17 2017-18 2018-19 2019-20
PC n/a Delivere
d
Penalty collar Not
delivere
d
Penalty deadband Delivere
d
Incentive rates
Incentive type Performance levels Incentive rate (£m)
Lower Upper
Penalty Not delivered Delivered 4.93
Additional details
Necessary detail on
measurement units
Failure to deliver the scheme by 31/03/2020 will
result in a financial penalty of £4.93m.
Customers will get the remaining £4.93m
scheme costs through cost performance
incentives.
Frequency of PC
measurement and any use of
averaging
Performance will be measured following the
expected scheme completion date on
31/03/2020.
Timing and frequency of
rewards/penalties
Penalties will apply following the expected
scheme completion date on 31/03/2020.
Form of reward/penalty RCV adjustment
Any other information or
clarifications relevant to
correct application of
incentive

63
Performance commitment: Thanet sewers
Detailed definition of performance measure: Delivery of Thanet Sewers scheme
to deliver Phase 2 Statutory Obligation (NEP4) by 31/03/2020.
Incentive type: Financial – penalty only
Performance commitments
Starting
level
Committed performance levels
Unit 2014-15 2015-16 2016-17 2017-18 2018-19 2019-20
PC n/a Delivere
d
Penalty collar Not
Delivere
d
Penalty deadband Delivere
d
Incentive rates
Incentive type Performance levels Incentive rate (£m)
Lower Upper
Penalty Not delivered Delivered 25.64
Additional details
Necessary detail on
measurement units
Failure to deliver the scheme by 31/03/2020 will
result in a financial penalty of £25.64m.
Customers will get back the remaining £25.64m
scheme costs through cost performance
incentives.
Frequency of PC measurement
and any use of averaging
Performance will be measured following the
expected scheme completion date on
31/03/2020.
Timing and frequency of
rewards/penalties
Penalties will apply following the expected
scheme completion date on 31/03/2020.
Form of reward/penalty RCV adjustment
Any other information or
clarifications relevant to
correct application of incentive

64
Performance commitment: Woolston STW
Detailed definition of performance measure: Delivery of Woolston STW scheme
in accordance with requirements set out in the National Environment Programme or
as agreed with the Environment Agency by 31/03/2020.
Incentive type: Financial – penalty only
Performance commitments
Starting
level
Committed performance levels
Unit 2014-15 2015-16 2016-17 2017-18 2018-19 2019-20
PC n/a Delivere
d
Penalty collar Not
delivere
d
Penalty deadband Delivere
d
Incentive rates
Incentive type Performance levels (£m) Incentive rate (£m)
Lower Upper
Penalty Not delivered Delivered 20.2
Additional details
Necessary detail on measurement
units
Failure to deliver the scheme by
31/03/2020 will result in a financial penalty
of £20.2m. Customers will get back the
remaining £20.2m scheme costs through
cost performance incentives.
Frequency of PC measurement and
any use of averaging
Performance will be measured following
the expected scheme completion date on
31/03/2020.
Timing and frequency of
rewards/penalties
Penalties will apply following the expected
scheme completion date on 31/03/2020.
Form of reward/penalty RCV adjustment

65
Any other information or
clarifications relevant to correct
application of incentive
Performance commitment: Millbrook sludge
Detailed definition of performance measure: Delivery of Millbrook sludge scheme
for removal of 6,000 tonnes of dry solids spent by 31/03/2020.
Incentive type: Financial – penalty only
Performance commitments
Starting
level
Committed performance levels
Unit 2014-15 2015-16 2016-17 2017-18 2018-19 2019-20
PC Ton
nes
n/a 6000
Penalty collar Ton
nes
0
Penalty deadband Ton
nes
6000
Incentive rates
Incentive type Performance levels (tonnes) Incentive rate (£/tonne)
Lower Upper
Penalty 0 6000 1,658
Additional details
Necessary detail on
measurement units
Failure to deliver the scheme by 31/03/2020 will
result in a financial penalty of £1,658 per tonne.
Customers will get back the remaining scheme
costs through cost performance incentives.
Frequency of PC
measurement and any use of
averaging
Performance will be measured following the
expected scheme completion date on
31/03/2020.
Timing and frequency of
rewards/penalties
Penalties will apply following the expected
scheme completion date on 31/03/2020.
Form of reward/penalty RCV adjustment

66
Any other information or
clarifications relevant to
correct application of
incentive
pe
Annual Tracking Survey 2011
Report Prepared for:
March 2012
Prepared by:
Ali Sims, Research Director & Lyn Allen, Senior Research Executive
Tel: 01663 732721
Email: [email protected]
Email: [email protected]
Website: http://www.djsresearch.co.uk
Willingness to Pay for Incentives Report Prepared for:
September 2014 Prepared by: Ali Sims, Research Director and David Marchant, Research Manager Tel: 01663 767857 Email: [email protected]; [email protected] Website: http://www.djsresearch.co.uk
Follow us: � � �
67

1.
Table of Contents
1. Executive Summary ................................................................................................ 1
2. Introduction ............................................................................................................. 4
2.1 Background ................................................................................................................................... 4
2.2 Research Objectives ..................................................................................................................... 4
2.3 Methodology .................................................................................................................................. 5
2.4 Overall Sample .............................................................................................................................. 6
2.4.1 Household Sample .................................................................................................................... 6
2.4.2 Business Sample....................................................................................................................... 6
2.5 About This Report ......................................................................................................................... 7
3. Satisfaction with Southern Water .......................................................................... 8
3.1 Water Services .............................................................................................................................. 8
3.1.1 Satisfaction with the Services ................................................................................................... 8
3.1.2 Satisfaction with the Value for Money ....................................................................................... 9
3.2 Wastewater Services .................................................................................................................... 9
3.2.1 Satisfaction with the Services ................................................................................................... 9
3.2.2 Satisfaction with the Value for Money ....................................................................................... 9
4. Penalties ................................................................................................................ 11
4.1 Reaction to Individual Penalties .................................................................................................. 11
4.1.1 Reasons for Considering the Penalties to be Unacceptable .................................................. 14
4.2 Reaction to the Total Level of Penalty if all service targets are not met ..................................... 15
4.3 Preference for Penalty Use ......................................................................................................... 16
5. Willingness to Pay ................................................................................................ 18
5.1 Willingness to Pay - Householders ................................................................................................ i
5.2 Willingness to Pay - Businesses .................................................................................................... i
5.3 Adjusted Willingness to Pay ........................................................................................................ 32
6. Conclusions .......................................................................................................... 34
7. Appendices ........................................................................................................... 35
68

69

Willingness to Pay for Incentives 1
1. Executive Summary
Background and objectives
Southern Water Services (SWS) has carried out its largest ever programme of research as part
of developing its business plan. Part of this research included a Willingness to Pay study which
was designed to research and understand customers’ priorities for particular levels of service,
as provided via investment programmes. The business plan allows performance to be
incentivised, i.e. where SWS delivers more than the level of service and improvement detailed
in its business plan, it can earn a financial reward and if it does not meet these promises it can
be financially penalised.
SWS wanted to understand customers’ Willingness to Pay for incentives, the level of incentive
for over performance or early delivery in each of the priority areas, as well as the expected level
of penalty for under delivery against the priority areas.
Methodology
A sample of 1,033 household customers were asked to participate in the research online, with
some hard-to-reach groups being interviewed face-to-face. Business customers were
interviewed by telephone as well using a face-to-face methodology. The respondents were
selected to allow a representative spread of customer types, of age and socio-economic groups,
including hard–to-reach customers, as well as business sizes.
Key findings
The majority of Southern Water’s customers were satisfied with their water (73%) and
wastewater (66%) services (much more so than with the Value for Money for either of those
services). In the main, a larger proportion of business customers were more satisfied with
Southern Water’s services than household customers.
Business customers were less likely than householders to accept the proposed level of penalty
for any given service area. Only in the areas of Sewer Flooding Incidents (51%) and Bathing
Water Quality (57%) did a slight majority of businesses consider the suggested penalties to be
acceptable. A majority of householders considered the penalties in all service areas - with the
exception of Water Leakage (49%) - to be acceptable.
A significant majority of businesses (>80%) and householders (>68%) who considered the
penalties to be unacceptable, reasoned that the level of penalty was too low.
Household customers generally preferred the penalties be used to lead to a reduction in
customer bills (58%). Businesses were more ambiguous in their preference, with a slightly
more respondents preferring that the penalty be used to reinvest in services (48%) than a
reduction in their bills (43%).
70

Willingness to Pay for Incentives 2
Customers were more likely to accept the total penalty for all service areas than the individual
penalties associated with each service area. When customers were shown the total level of
penalty (Southern Water being penalised up to £93 million for not meeting the targets) alongside
the consequent reduction on a typical bill (£12.08 for household customers, £30.20 on a typical
business bill of £1,000), a higher proportion of businesses accepted the total penalty (58%) than
they did any of the individual penalties previously shown. The proportion of households
accepting the total level of penalty (60%) was only bettered by the acceptance of the penalty for
Bathing Water Quality (61%).
A bidding game approach was adopted to establish the amount customers are willing to pay for
incentives. Customers were informed of the cost of an average water bill, and were asked
whether they would be willing to pay more than the average bill for certain incentives. In
practice, respondents were given an initial starting value for the incentive and asked if they
would be willing to pay that amount. If the respondent was willing to pay the proposed amount
they were then asked if they would pay increasingly more until the upper acceptable limit was
achieved. Conversely, if respondents were unwilling to pay the initial amount then the amount
was incrementally decreased until the acceptable value was reached.
The total average Willingness to Pay for householders was £4.20 per year, or £1.90 below
Southern Water’s recommended level. Only 40% of all households were willing to accept the
recommended level of £6.10. Willingness to Pay was particularly low for households with an
income less than £10,000 at just £2.70.
The total average Willingness to Pay for businesses was £8.13 per year, or £7.13 below
Southern Water’s recommended level. Only 22% of all businesses were willing to accept the
recommended level of £15.26.
Customers who were not willing to pay more than they did already for Southern Water to exceed
their targets, considered it to be unfair that they would need to do so.
71

Willingness to Pay for Incentives 3
Conclusions
The backdrop to the research is that most people were satisfied with the service they received
and most were satisfied with the value for money of their water and wastewater services. The
total level of penalty for not meeting the level of service requirements set out in the business
plan was generally accepted by householders and businesses alike. However, some service
areas and their associated penalties gained very little support from customers. This was
particularly the case for Water Leakage and Serious Pollution Incidents.
The research leads us to conclude that, although 81% of customers were willing to pay more for
Southern Water to exceed targets in at least one service area, the overwhelming majority of
customers were not willing to pay anywhere close to Southern Water’s recommended incentive
levels. Furthermore, the number of respondents who are unwilling to pay more is significant in
some service areas such Reduction in Water Use (49% of households; 77% of businesses).
Indeed, the overall conclusions of the research are unambiguous:
60% of households were not willing to accept the recommended level of £6.10 on an
average annual water bill of £399
78% of businesses were not willing to accept the recommended level of £15.26 on an
average annual water bill of £1,000
72
Willingness to Pay for Incentives 4
2. Introduction
2.1 Background
Southern Water Services (SWS) is a water and sewerage company providing water to almost
2.4 million people and sewerage services to nearly 4.5 million people across Kent, Sussex,
Hampshire and the Isle of Wight.
SWS operates within the regulated UK water industry where regional monopolies exist. It is the
role of Ofwat, the water services regulation authority, to measure and compare companies
across the industry to develop high quality service and good value for money to customers.
Every five years, all water companies submit five year business plans setting out how they will
meet environmental and drinking water quality standards and deliver high quality customer
service. Companies must also demonstrate that their plans deliver investment in the areas that
customers’ value and at a price they find acceptable. All water and water and sewerage
companies published their draft business plans for the five year period from 2015 to 2020
(AMP6) in December 2013 in a process referred to as PR14.
SWS has carried out its largest ever programme of research as part of developing its business
plan. Part of this research included a Willingness to Pay study which was designed to research
and understand customers’ priorities for particular levels of service, as provided via investment
programmes. The business plan allows performance to be incentivised, i.e. where SWS delivers
more than the level of service and improvement detailed in its business plan it can earn a
financial reward and if it does not meet these promises it can be financially penalised.
SWS has already conducted some qualitative research around these incentives (referred to as
Outcome Delivery Incentives or ODIs) which has informed to which areas of the business plan
incentives should be applied.
2.2 Research Objectives
The specific research objectives were to understand:
Customers Willingness to Pay for incentives and the level of incentive for over
performance or early delivery in each of the priority areas
The expected level of penalty for under delivery against the priority areas
How customers wish the incentives / penalties to be paid e.g. through bills or
reinvestment.
73

Willingness to Pay for Incentives 5
2.3 Methodology
Given the complexity of the topic and the fact that customers would need to be provided with a
large amount of stimulus material to be in a position to give a considered opinion, the following
research methodologies were chosen for undertaking interviews with households and
businesses:
Householders – online for the bulk of the interviews and face-to-face for certain
demographics and the water only customers
Businesses – face-to-face for smaller businesses and phone/email/phone for small,
medium and large businesses
The overall content of the questionnaire is shown below (the guide and stimulus material for the
different audiences can be found in the Appendix):
General introduction to the research, covering:
o The planning process and regulation
o What we wanted customers’ opinion on
Satisfaction with SWS and perceptions of value for money
Introduction to incentives, including:
o The research that had gone into the business plan so far
o Explaining the concept of penalties and benefits
o That SWS wanted to get views on six service measures/outcomes, which
customers had previously said were appropriate to incentivise
o Explanation that each service measure would be shown separately
Taking each service outcome in turn (order randomised) we showed a chart featuring all
the information below. It was important that customers could see the penalties and
benefits together, so that they could see that the penalties were always higher than the
rewards:
o Explanation of proposed service level as per the plan
o Maximum amount of penalty if SWS failed to meet targets
o Maximum amount of benefit if SWS exceeded targets
o We then asked if they agreed that the penalty was acceptable and how much
more – if at all - they would be willing to pay for the benefit
We then asked them to look at the relevant outcomes together and the total impact on
bills.
o Overall acceptability of the proposed penalties and ability to amend Willingness
to Pay amounts
We then investigated how the penalties should be paid, i.e. whether customers would
prefer to see a reduction in their bill or whether they would prefer SWS to reinvest this
money to put right the shortcomings
Association with attitudinal statements in relation to incentivising water companies
Demographics
Clarity and customer understanding of the survey
74

Willingness to Pay for Incentives 6
2.4 Overall Sample
The overall sample size was 1,252, of which 1,033 respondents were households and 219 were
businesses. Interviews lasted 20 minutes on average, although interviews with hard-to-reach
audiences were significantly longer.
2.4.1 Household Sample
In total, 858 online panellists completed the survey. A further 175 household respondents were
interviewed face-to-face to ensure that the sample was as representative as possible of SWS’s
customer base.
The focus of the face-to-face interviews was on water only customers in the Hastings area and
north Hampshire, as well as hard-to-reach respondents including those with disabilities or
chronic illnesses and the over 75s across all of Southern Water’s service area. Deaf or blind
people were not included in the survey, as their inclusion would have required specialist
interviewers and would have taken more time to arrange than was available. Household
respondents were either solely or jointly responsible for paying the water bill. They were not
paid an incentive to participate in the research project.
Table 1: Structure of the Household Sample, highlighting the split of Hard-to-Reach respondents
Household Profile Type of Customer Hard-to-Reach
Dual
Customer
Wastewater
Only
Water
Only 18-29s 75+
With
disability
Me
tho
do
log
y
Online Panel 557 301 n/a 103 43 169
Face-to-Face 86 9 80 12 107 72
TOTAL 643 310 80 115 150 241
2.4.2 Business Sample
In total, 219 businesses completed the survey, of which 150 were recruited and interviewed by
DJS Research’s in-house CATI unit. The remaining 69 businesses were interviewed face-to-
face. The following table provides additional insight into the businesses interviewed:
Table 2: Structure of the Business Sample
Business Profile Small (<0.5 Ml/a) Medium (0.5-5 Ml/a) Large (>5 Ml/a)
Me
tho
do
log
y
CATI 100 35 15
Face-to-Face 69 n/a n/a
TOTAL 169 35 15
75

Willingness to Pay for Incentives 7
Small businesses represent approximately 91% of Southern Water’s business customers, and
are therefore slightly under-represented in the business sample. In contrast, medium and large
businesses are slightly over-representedThis, however has not adversely impacted on the
research findings.
Small businesses for face-to-face interviews were recruited by DJS Research’s team of face-to-
face recruiters. The businesses were informed that £5 would be donated to Water Aid on
completion of the research. In total, 2,459 businesses were contacted by DJS Research’s
telephone interviewers which resulted in 150 completed interviews with businesses. At the time
of completing interviews with 150 businesses, fieldwork was still in progress with 1,044
businesses, 558 respondents had refused to participate and 244 respondents had been
unreachable. Furthermore, 153 appointments had been set and 26 interviews had been partially
completed, 284 respondents did not qualify for a variety of reasons.
2.5 About This Report
The report comprises the following chapters:
Satisfaction with Southern Water and perceptions of value for money
Views on penalties
Preferences for use of penalties
Willingness to Pay for incentives
Attitudes towards incentives
Conclusions
Any queries on this report should be directed in the first instance to Ali Sims or David Marchant
at DJS Research.
76

Willingness to Pay for Incentives 8
Satisfied – 73%
Dissatisfied – 8%
3. Satisfaction with Southern Water
It was felt important to provide context to the main findings by asking customers how satisfied
they were with Southern Water and to what extent they thought the service provided was value
for money.
As Southern Water serves both customers’ water as well as wastewater requirements, the
satisfaction levels for both services were assessed separately.
3.1 Water Services
3.1.1 Satisfaction with the Services
The vast majority of respondents (73%) were satisfied with Southern
Water’s water services, compared to a very small proportion of
customers who were dissatisfied (8%) to varying degrees with
Southern Water in this area.
Satisfaction levels amongst businesses were significantly higher than amongst households,
while water-only household customers also registered a significantly higher level of satisfaction.
Table 3: Satisfaction with Water Services
Q: How satisfied are you with … Net - Satisfied Net - Dissatisfied
Households Businesses Households Businesses
… your current water services?
Dual Customers (n=643, n=147) 69% 82% 9% 5%
Water Only Customers (n=80, n=8) 86% 76% 1% 0%
Summary:
A larger proportion of customers were satisfied with water services (73%) than with
wastewater services (66%)
The proportion of customers satisfied with Value for Money for water services (59%) and
wastewater services (53%) was smaller than the proportion satisfied with the services
per se
More water-only household customers (86%) were satisfied with the water services than
dual household customers (69%)
Fewer wastewater-only customer (56%) were satisfied with the wastewater services than
dual household customers (66%), while the reverse was true for the business customers
(81% and 71% satisfied respectively)
77

Willingness to Pay for Incentives 9
Satisfied – 66%
Dissatisfied – 9%
Satisfied – 53%
Dissatisfied – 19%
Satisfied – 59%
Dissatisfied – 19%
3.1.2 Satisfaction with the Value for Money
A significantly smaller proportion of respondents were satisfied with
the value for money of the water services compared to their
satisfaction with water services per se. Approximately 59% of all
respondents claimed to be satisfied with the value for money, while
almost a fifth of the sample (19%) were dissatisfied with the value for money.
Table 4: Satisfaction with Value for Money of the Water Services
Q: How satisfied are you with … Net – Satisfied Net - Dissatisfied
Households Businesses Households Businesses
… the value for money of the water services?
Dual Customers (n=643, n=147) 56% 64% 20% 18%
Water Only Customers (n=80, n=8) 69% 75% 15% 13%
3.2 Wastewater Services
3.2.1 Satisfaction with the Services
Approximately two-thirds (66%) of all wastewater customers considered
themselves to be satisfied with Southern Water’s services. Again, a
relatively small proportion of customers were dissatisfied with their
wastewater services (9%).
Satisfaction levels amongst businesses were significantly higher than amongst households. In
general, wastewater only household customers were significantly less likely to be satisfied.
Table 5: Satisfaction with Wastewater Services
Q: How satisfied are you with … Net - Satisfied Net - Dissatisfied
Households Businesses Households Businesses
… your current wastewater services?
Dual Customers (n=643, n=147) 66% 71% 10% 11%
Wastewater Only Customers (n=310, n=64) 56% 81% 10% 2%
3.2.2 Satisfaction with the Value for Money
In comparison to the satisfaction with value for money of the water
services, wastewater services had a lower level of satisfaction (53%).
Almost a fifth of the respondents (19%) were dissatisfied with the
value for money for wastewater services.
78
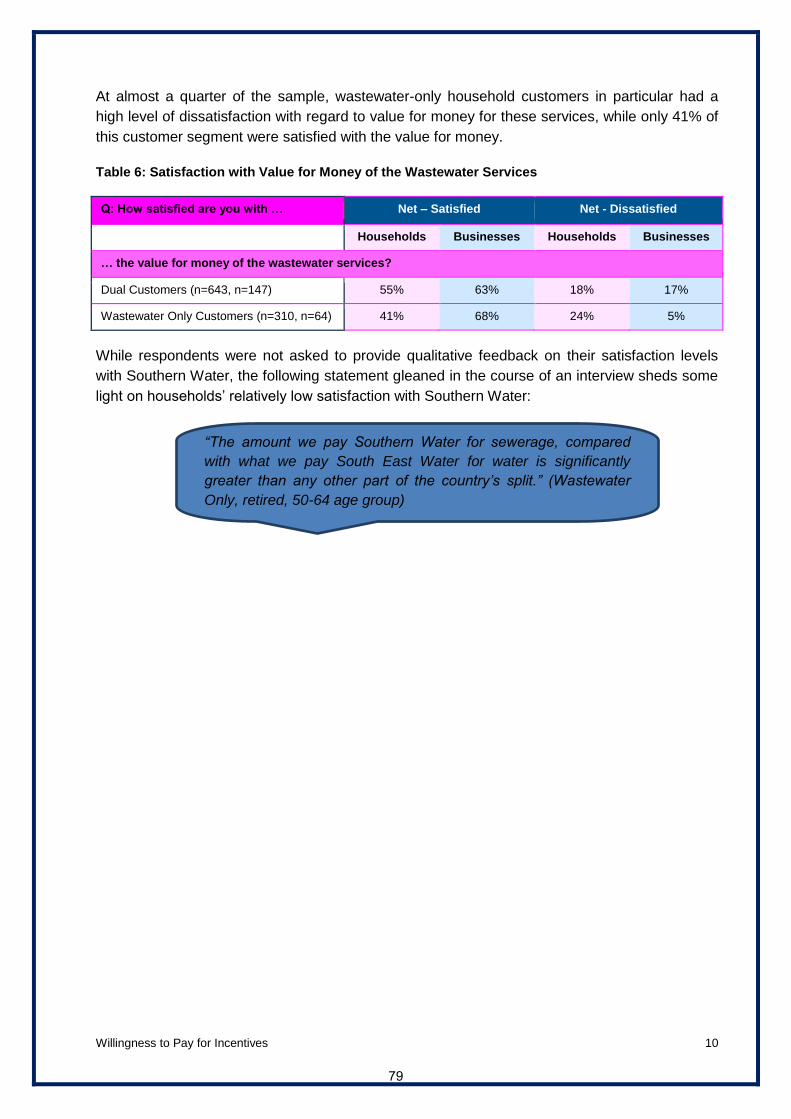
Willingness to Pay for Incentives 10
At almost a quarter of the sample, wastewater-only household customers in particular had a
high level of dissatisfaction with regard to value for money for these services, while only 41% of
this customer segment were satisfied with the value for money.
Table 6: Satisfaction with Value for Money of the Wastewater Services
Q: How satisfied are you with … Net – Satisfied Net - Dissatisfied
Households Businesses Households Businesses
… the value for money of the wastewater services?
Dual Customers (n=643, n=147) 55% 63% 18% 17%
Wastewater Only Customers (n=310, n=64) 41% 68% 24% 5%
While respondents were not asked to provide qualitative feedback on their satisfaction levels
with Southern Water, the following statement gleaned in the course of an interview sheds some
light on households’ relatively low satisfaction with Southern Water:
“The amount we pay Southern Water for sewerage, compared
with what we pay South East Water for water is significantly
greater than any other part of the country’s split.” (Wastewater
Only, retired, 50-64 age group)
79

Willingness to Pay for Incentives 11
4. Penalties
Before being shown six specific service levels and the associated penalties, participants were
introduced to the concept of incentives by being shown two showcards, detailing how Southern
Water’s business plan is developed, customers’ involvement in prioritising specific areas of
service, and the role of Ofwat in linking more of the profit water companies are allowed to earn
to beating targets and delivering improvements in customer priorities (see Appendix for
Showcards 1 & 2).
Customers were then shown a single showcard for each service area, detailing the service
target, the proposed penalties if Southern Water failed to meet the target and the proposed
incentives if the company exceeded the target (except for water use restrictions as only a
penalty applies). Furthermore, penalties were presented both in terms of the aggregate cost and
the typical cost for an annual bill.
4.1 Reaction to Individual Penalties
Respondents were asked to indicate the acceptability of the proposed penalties. Overall, a
smaller proportion of businesses than households accepted the penalties, irrespective of service
area (see Figure 1 and Figure 2).
The penalty associated with an increase in the number of beaches with excellent bathing water
quality had the highest levels of acceptance at 61% and 57% with households and businesses
respectively.
Summary:
A larger proportion of households accepted the proposed penalties than businesses
The penalty associated with Bathing Water Quality was accepted by the highest
proportion of both households (61%) and businesses (57%)
The penalty associated with Water Leakage was accepted by the lowest proportion of
both households (49%) and businesses (34%)
Satisfaction with the service and value for money impacted upon the acceptance of
penalties
A significant proportion of customers who considered the penalties to be unacceptable,
deemed them to be too low (>68%)
Both householders (60%) and businesses (58%) considered the sum of all penalties to
be more acceptable than the individual penalties
Water-only household customers (20%) were least likely to consider the total penalty to
be acceptable
A high proportion of households (58%) had a preference for penalties to lead to a
reduction in customer bills
Businesses preferred to reinvest the penalty payments (48%) rather than reduce their
bills (43%)
80

Willingness to Pay for Incentives 12
In contrast, the penalties relating to a reduction in water leakage had both the lowest
acceptability ratings at 49% and 34% respectively, as well as the highest proportion of
respondents rating the penalties as unacceptable – 42% of households and 55% of businesses.
The service areas rank as follows by the proportion of respondents willing to accept the
associated penalties:
1. Bathing Water Quality (61% & 57%)
2. Sewer Flooding Incidents (57% & 51%)
3. Water Use Restrictions (57% & 50%)
4. Reduction in Water Use (55% & 42%)
5. Serious Pollution Incidents (51% & 37%)
6. Water Leakage (49% & 34%)
Satisfaction with the current level of service and value for money directly impacted upon
whether customers deemed the penalties to be acceptable or not. As such, a smaller proportion
of respondents who were dissatisfied with the current level of service or value for money with
either the water or wastewater services considered the level of penalty to be acceptable.
Figure 1: Households’ Acceptance of Individual Penalties1
* net acceptable figures differ due to rounding
* *
81

Willingness to Pay for Incentives 13
The level of disapproval with some penalties was underlined by numerous qualitative
responses. Some respondents voiced their disbelief at the level of water leakage and therefore
considered the associated penalty to be unacceptable:
Furthermore, some respondents questioned the reasoning behind penalties in particular for
Water Leakage, claiming that:
Figure 2: Businesses’ Acceptance of Individual Penalties2
* net acceptable figures differ due to rounding
“The amount of water wasted in leaks is totally shocking. Companies must be encouraged to fix this by giving them massive fines.” (Dual Customer, Middle management, 35-49 age group)
“Southern Water has allowed the problem to get out of hand, it needs to be sorted but Southern Water should be fined from their profits” (Dual Customer, Middle management, 35-49 age group)
“Penalties should be incurred by Southern Water if they only maintain leakage, not if it worsens.” (Dual Customer, retired, 50-64 age group)
“Southern Water should have more ethical rather than economical concerns about water leakage.” (Dual Customer, Professional, 50-64 age group).
“It should be in the Southern Water's interest to reduce wastage - it should not be incentivised.” (Dual Customer, Middle management, 35-49 age group)
*
82
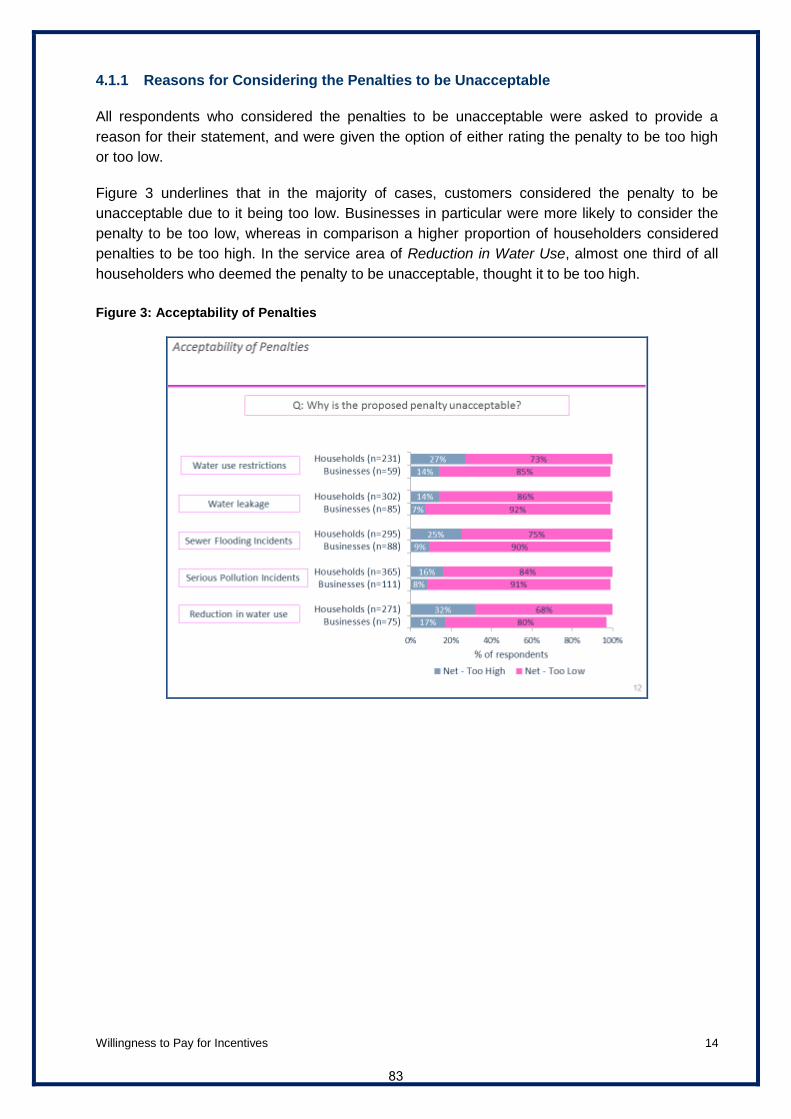
Willingness to Pay for Incentives 14
4.1.1 Reasons for Considering the Penalties to be Unacceptable
All respondents who considered the penalties to be unacceptable were asked to provide a
reason for their statement, and were given the option of either rating the penalty to be too high
or too low.
Figure 3 underlines that in the majority of cases, customers considered the penalty to be
unacceptable due to it being too low. Businesses in particular were more likely to consider the
penalty to be too low, whereas in comparison a higher proportion of householders considered
penalties to be too high. In the service area of Reduction in Water Use, almost one third of all
householders who deemed the penalty to be unacceptable, thought it to be too high.
Figure 3: Acceptability of Penalties
83

Willingness to Pay for Incentives 15
4.2 Reaction to the Total Level of Penalty if all service targets are not met
Faced with evaluating the total level of penalty if SWS was not able to meet any service targets
and the associated reduction on a typical bill, as shown in Figure 4 below, both households and
businesses considered the sum of all penalties to be more acceptable than the individual
penalties (see Figure 5).
Figure 4: Summary of Targets and Penalties
A small proportion of the 75+ age group (41%) considered the total level of penalty to be
acceptable, compared to other age groups where many found the level of penalty to be
acceptable. Significantly, householders who considered themselves likely to keep up with
changes in the cost of living were more likely to think the penalty to be acceptable (69%). Water
only household customers (20%) were least likely to consider the penalty to be acceptable.
84
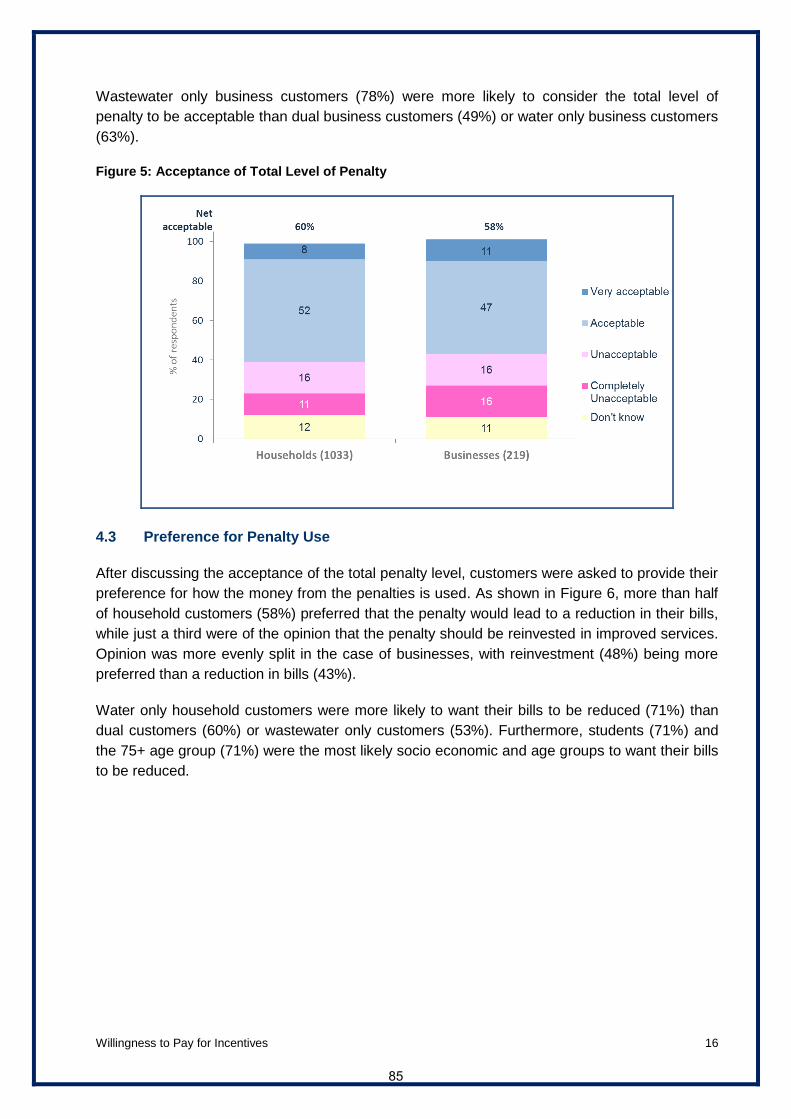
Willingness to Pay for Incentives 16
Wastewater only business customers (78%) were more likely to consider the total level of
penalty to be acceptable than dual business customers (49%) or water only business customers
(63%).
Figure 5: Acceptance of Total Level of Penalty
4.3 Preference for Penalty Use
After discussing the acceptance of the total penalty level, customers were asked to provide their
preference for how the money from the penalties is used. As shown in Figure 6, more than half
of household customers (58%) preferred that the penalty would lead to a reduction in their bills,
while just a third were of the opinion that the penalty should be reinvested in improved services.
Opinion was more evenly split in the case of businesses, with reinvestment (48%) being more
preferred than a reduction in bills (43%).
Water only household customers were more likely to want their bills to be reduced (71%) than
dual customers (60%) or wastewater only customers (53%). Furthermore, students (71%) and
the 75+ age group (71%) were the most likely socio economic and age groups to want their bills
to be reduced.
85

Willingness to Pay for Incentives 17
Amongst business customers, wastewater only customers (64%) were most likely to prefer the
penalties to be reinvested.
Figure 6: Preference for Penalty Use
86
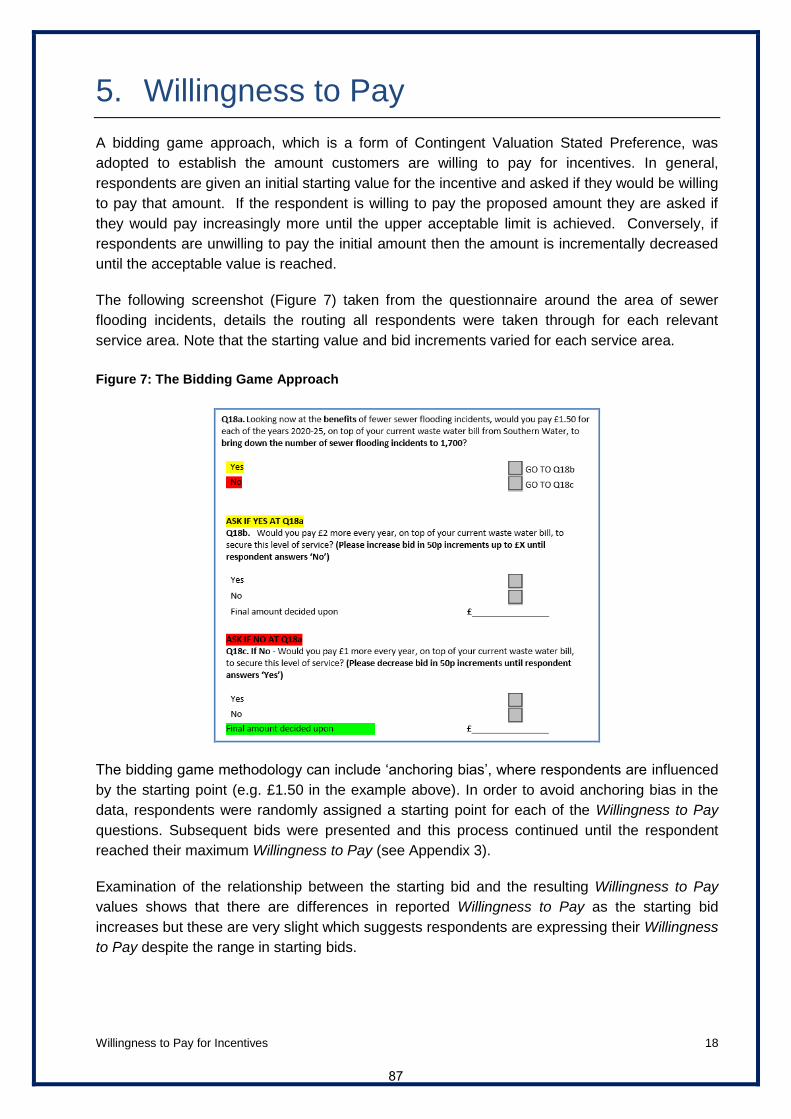
Willingness to Pay for Incentives 18
5. Willingness to Pay
A bidding game approach, which is a form of Contingent Valuation Stated Preference, was
adopted to establish the amount customers are willing to pay for incentives. In general,
respondents are given an initial starting value for the incentive and asked if they would be willing
to pay that amount. If the respondent is willing to pay the proposed amount they are asked if
they would pay increasingly more until the upper acceptable limit is achieved. Conversely, if
respondents are unwilling to pay the initial amount then the amount is incrementally decreased
until the acceptable value is reached.
The following screenshot (Figure 7) taken from the questionnaire around the area of sewer
flooding incidents, details the routing all respondents were taken through for each relevant
service area. Note that the starting value and bid increments varied for each service area.
Figure 7: The Bidding Game Approach
The bidding game methodology can include ‘anchoring bias’, where respondents are influenced
by the starting point (e.g. £1.50 in the example above). In order to avoid anchoring bias in the
data, respondents were randomly assigned a starting point for each of the Willingness to Pay
questions. Subsequent bids were presented and this process continued until the respondent
reached their maximum Willingness to Pay (see Appendix 3).
Examination of the relationship between the starting bid and the resulting Willingness to Pay
values shows that there are differences in reported Willingness to Pay as the starting bid
increases but these are very slight which suggests respondents are expressing their Willingness
to Pay despite the range in starting bids.
87

Willingness to Pay for Incentives 19
As an example, Figure 8 provides an insight into the average Willingness to Pay by starting bid
for Serious Pollution Incidents.
Figure 8: Average Willingness to Pay by Starting Bid - Serious Pollution Incidents
The research tested service levels in five areas to understand Willingness to Pay amongst
customers. Householders were asked to consider the annual bill impact on an average bill of
£399, while businesses were asked to consider the bill impact on an average business bill of
£1,000.
Of the 1,033 household respondents, 24 were identified as ‘protest’ bids, i.e. those who simply
objected to paying higher water bills or claiming that water companies made enough profits
already. Moreover, an additional twelve household respondents were excluded from the
Willingness to Pay analysis because they did not understand the questions or see how the
incentives could impact their bills. The total sample size for households for the purpose of
Willingness to Pay was therefore 997.
Of the 219 businesses interviewed, 11 were identified as “protest” bids and a further 4 either did
not understand the questions or were unable to answer them.
88

Willingness to Pay for Incentives 20
The five service areas tested were as follows (Figure 9), with Southern Water’s recommended
levels for both householders and businesses provided.
Figure 9: Five Service Areas Tested
89
Willingness to Pay for Incentives 21
5.1 Willingness to Pay - Householders
In total, 81% of all householders were willing to pay more (than the average annual water bill)
for Southern Water to exceed the target in at least one of the five service areas. The remaining
19% of respondents were not willing to pay more than the average annual water bill in any
service area.
Householders who were willing to pay more (than the average annual water bill of £399) for
Southern Water to exceed their target in at least one service area were given the opportunity to
provide a reason for their Willingness to Pay. Of the multiple choice statements respondents
were able to select from, most commented that “the additional amount to be paid per annum is
very small” (see Figure 10). This comment was particularly prevalent amongst householders
responding to Southern Water exceeding their targets in the area of Serious Pollution Incidents
(70%). In contrast, reasoning that “Incentives are a good way of ensuring that Southern Water
exceeds its targets” was the least likely multiple choice statement to be selected (40%).
Summary:
The total average (mean) Willingness to Pay for householders was £4.20 per year - £1.90 per year below Southern Water’s recommended level
The average Willingness to Pay ranged from 32p per year (for Water Leakage) to £1.76 per year (for Sewer Flooding Incidents), with both values below Southern Water’s recommended levels
Wastewater only customers had slightly higher (not statistically significant) Willingness to Pay in the 3 wastewater only service areas
Water only customers had significantly lower Willingness to Pay on Water Leakage and on Reduction in Water Use
There was more than a doubling of Willingness to Pay between the lowest (<£10,000) and highest (+£100,000) income brackets (£2.70 per year vs £6.27 per year)
Some 30% of all household customers were not willing to pay more than they did for Southern Water to reduce the number of serious pollution incidents
In comparison, 49% of household customers were not willing to pay more for Southern Water to reduce the amount of water used per day
Customers who were willing to pay more, most often considered the additional amount to be paid per year as very small (>50%)
Customers who were unwilling to pay more, most often considered it to be unfair that they would need to do so in order for Southern Water to exceed their targets (>63%)
90
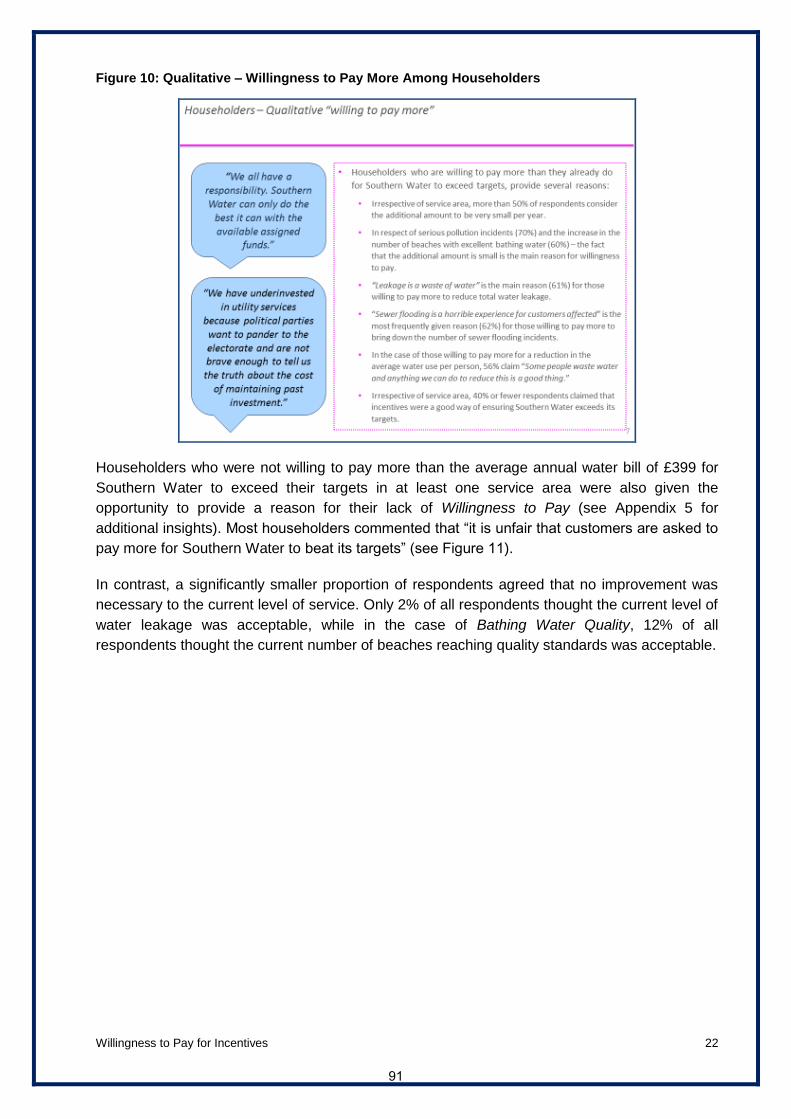
Willingness to Pay for Incentives 22
Figure 10: Qualitative – Willingness to Pay More Among Householders
Householders who were not willing to pay more than the average annual water bill of £399 for
Southern Water to exceed their targets in at least one service area were also given the
opportunity to provide a reason for their lack of Willingness to Pay (see Appendix 5 for
additional insights). Most householders commented that “it is unfair that customers are asked to
pay more for Southern Water to beat its targets” (see Figure 11).
In contrast, a significantly smaller proportion of respondents agreed that no improvement was
necessary to the current level of service. Only 2% of all respondents thought the current level of
water leakage was acceptable, while in the case of Bathing Water Quality, 12% of all
respondents thought the current number of beaches reaching quality standards was acceptable.
91

Willingness to Pay for Incentives 23
Figure 11: Qualitative – Lack of Willingness to Pay More Among Householders
The total average (mean) Willingness to Pay for householders was £4.20 per year - £1.90 per
year below Southern Water’s recommended level (see Figure 12). The average Willingness to
Pay ranged from 32p per year for Water Leakage to £1.76 per year for Sewer Flooding
Incidents. Only in the case of Serious Pollution Incidents was the average (mean) Willingness to
Pay higher than Southern Water’s recommended level of 29p per year. As indicated in Appendix
4 – “Zero” Willingness to Pay Respondents, the valuations include a relatively high proportion of
responses that are zero. The distribution of Willingness to Pay responses are highlighted in
Appendix 6.
Figure 12: Quantitative – Householders’ Willingness to Pay (per year) 3
*95% Confidence Interval
92

Willingness to Pay for Incentives 24
While for dual customers the average Willingness to Pay across all five service areas was £4.20
per year, wastewater only customers had a total Willingness to Pay of £2.80 per year across the
relevant service areas. These amounts were £1.90 per year and 94p per year below Southern
Water’s recommended levels respectively.
Wastewater only customers had slightly higher, although statistically not significant, Willingness
to Pay for the Sewer Flooding Incidents, Serious Pollution Incidents and Bathing Water Quality
service areas. In contrast, water only customers had significantly lower Willingness to Pay on
Water Leakage and on a Reduction in Water Use. At 81p per year, the average Willingness to
Pay for water only customers was £1.57 per year below Southern Water’s recommended level.
Figure 13 details the average Willingness to Pay by individual service area for household
customer types.
Figure 13: Householders’ Willingness to Pay by Element (per year)
93
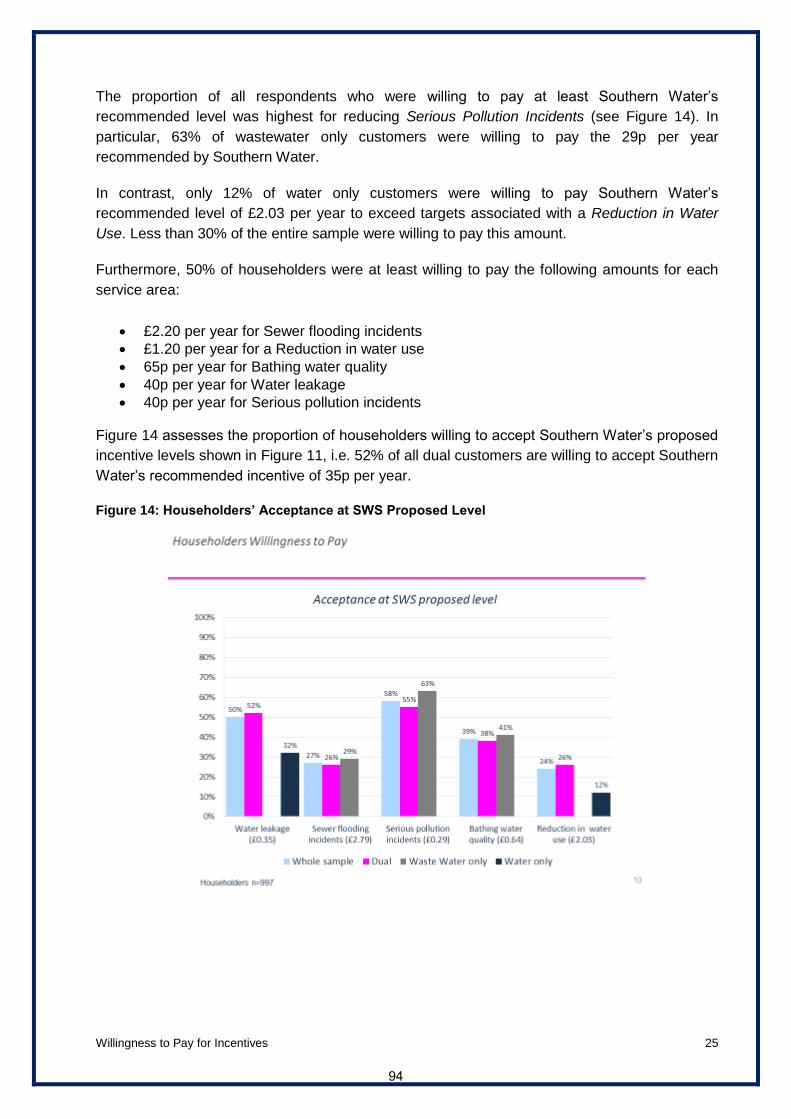
Willingness to Pay for Incentives 25
The proportion of all respondents who were willing to pay at least Southern Water’s
recommended level was highest for reducing Serious Pollution Incidents (see Figure 14). In
particular, 63% of wastewater only customers were willing to pay the 29p per year
recommended by Southern Water.
In contrast, only 12% of water only customers were willing to pay Southern Water’s
recommended level of £2.03 per year to exceed targets associated with a Reduction in Water
Use. Less than 30% of the entire sample were willing to pay this amount.
Furthermore, 50% of householders were at least willing to pay the following amounts for each
service area:
£2.20 per year for Sewer flooding incidents
£1.20 per year for a Reduction in water use
65p per year for Bathing water quality
40p per year for Water leakage
40p per year for Serious pollution incidents
Figure 14 assesses the proportion of householders willing to accept Southern Water’s proposed
incentive levels shown in Figure 11, i.e. 52% of all dual customers are willing to accept Southern
Water’s recommended incentive of 35p per year.
Figure 14: Householders’ Acceptance at SWS Proposed Level
94

Willingness to Pay for Incentives 26
The impact of income on the amount householders are willing to pay is shown in Figure 15.
Willingness to Pay increases in line with income. In fact, there is more than a doubling of
Willingness to Pay between the lowest income bracket of <£10,000 and the highest income
bracket of >£100,000. Furthermore, these differences are statistically significant (p<0.001).
Willingness to Pay is particularly low in the <£10,000 group where a lot of respondents gave a
valid ‘zero’ response stating they could not pay any more on their water bill because they were
pensioners or relied on benefits. Only the >£100,000 group had an average Willingness to Pay
above Southern Water’s recommended level (£6.27 per year).
Figure 15: Householders’ Willingness to Pay by Income (per year)
As an additional validity check, the Willingness to Pay was examined by reported attitudes to
incentives to look for consistency.
Customers who tended to agree that incentives were a good way to ensure good service, had
significantly higher Willingness to Pay and people who agreed that it was unfair that customers
may be asked to pay more and water companies make high enough profits, had significantly
lower Willingness to Pay.
95

Willingness to Pay for Incentives 27
Approximately 7% of all householders disagreed that it was unfair that customers may be asked
to pay more in their bills to fund rewards. These respondents had an average Willingness to Pay
of 18p per year above Southern Water’s recommended overall level (see Table 7).
Table 7: Householders’ Willingness to Pay by Attitudinal Statement4
Attitudinal Statement Agree* Disagree*
“It is unfair that customers may be asked to pay more in their bills to fund rewards to companies.”
£3.52 £6.28
“Anything that can be done to improve the environment is a good thing.”
£4.57 £4.20
“Water companies already make high enough profits without giving them additional rewards.”
£3.47 £6.09
“Incentives are a good way of ensuring water companies provide the best level of service possible.”
£5.03 £2.47
*95% Confidence Interval
96

Willingness to Pay for Incentives 28
5.2 Willingness to Pay - Businesses
Businesses who were willing to pay more than the average annual water bill of £1,000 for
Southern Water to exceed their targets were given the opportunity to provide a reason for their
Willingness to Pay. Of the multiple choice statements respondents were able to select from,
most commented that “the additional amount to be paid per annum is very small” (see Figure
16). Furthermore, businesses were far less likely than householders to consider incentives to be
a good way of ensuring that Southern Water exceeds its targets. A significant proportion of
respondents (>63%) consider it to be unfair that customers are being asked to pay more for
Southern Water to beat their targets (see Appendix 5 for additional insights).
Summary:
The total average (mean) Willingness to Pay for business customers was £8.13 per year - £7.13 per year below Southern Water’s recommended level
The total average (mean) Willingness to Pay for dual business customers was £7.04 per year - £8.22 per year below Southern Water’s recommended level
The total average (mean) Willingness to Pay for wastewater only business customers was £8.03 per year for the three relevant service areas, and was £1.26 per year below Southern Water’s recommended level
Wastewater only customers had a significantly higher Willingness to Pay in the service areas of Sewer Flooding Incidents and Bathing Water Quality
Some 52% of all business customers were not willing to pay more than they did for Southern Water to reduce the number of serious pollution incidents
In comparison, 77% of business customers were not willing to pay more for Southern Water to reduce the amount of water used per day
Customers who were willing to pay more, most often considered the additional amount to be paid per year to be very small
Customers who were unwilling to pay more, most often considered it to be unfair that they would need to do so in order for Southern Water to exceed their targets (>63%)
97
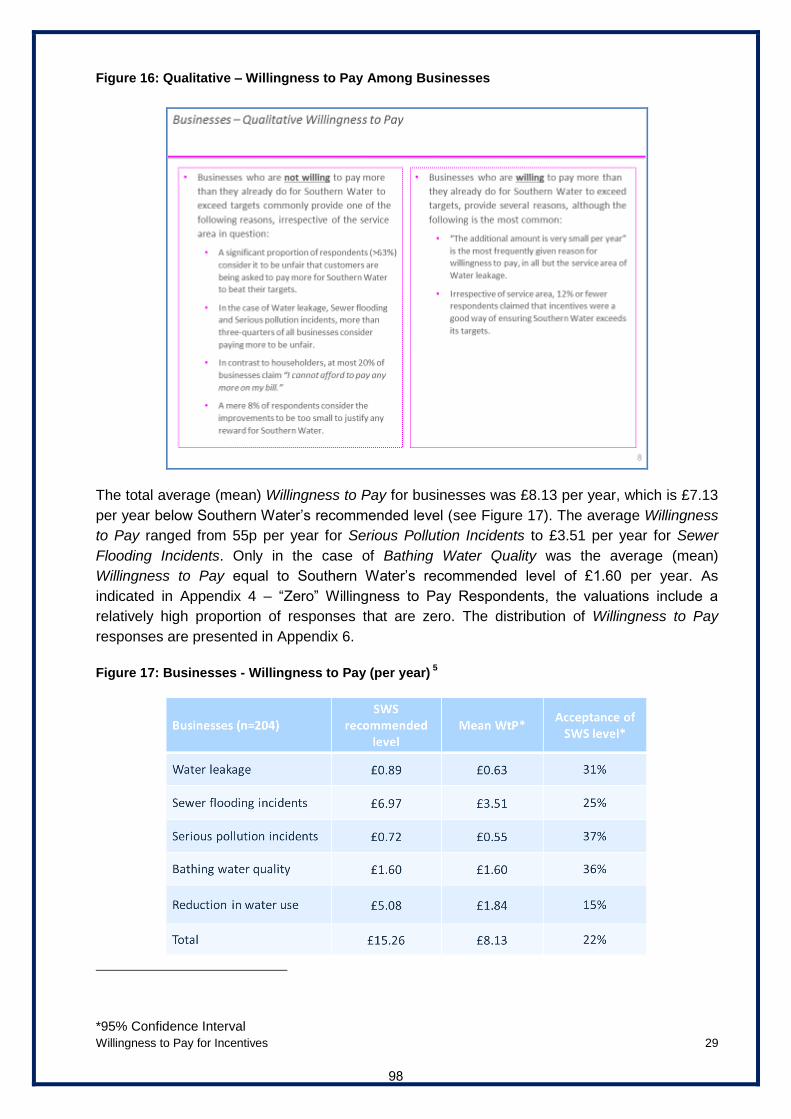
Willingness to Pay for Incentives 29
Figure 16: Qualitative – Willingness to Pay Among Businesses
The total average (mean) Willingness to Pay for businesses was £8.13 per year, which is £7.13
per year below Southern Water’s recommended level (see Figure 17). The average Willingness
to Pay ranged from 55p per year for Serious Pollution Incidents to £3.51 per year for Sewer
Flooding Incidents. Only in the case of Bathing Water Quality was the average (mean)
Willingness to Pay equal to Southern Water’s recommended level of £1.60 per year. As
indicated in Appendix 4 – “Zero” Willingness to Pay Respondents, the valuations include a
relatively high proportion of responses that are zero. The distribution of Willingness to Pay
responses are presented in Appendix 6.
Figure 17: Businesses - Willingness to Pay (per year)
5
*95% Confidence Interval
98

Willingness to Pay for Incentives 30
The relatively high Willingness to Pay for Sewer Flooding Incidents was mainly driven by
wastewater only customers with an average Willingness to Pay of £5.10 per year – still £1.87 per
year short of Southern Water’s recommended level. Indeed, wastewater only customers had a
significantly higher Willingness to Pay in both Sewer Flooding Incidents and Bathing Water Quality
(see Figure 18).
The rather small sample of water only business customers did not allow for statistical analysis.
Figure 18: Businesses - Willingness to Pay by Element (per year)
As was the case for householders, the Willingness to Pay of businesses was examined by
reported attitudes to look for consistency.
Businesses that tended to agree incentives were a good way to ensure good service had
significantly higher Willingness to Pay and businesses that disagreed that anything that could be
done to improve the environment was a good thing had a significantly lower Willingness to Pay
of just £1.38.
99

Willingness to Pay for Incentives 31
Average Willingness to Pay was below Southern Water’s recommended level, irrespective of
business customers’ attitude toward any of the four statements in Table 8 below.
Table 8: Businesses - Willingness to Pay by Attitudinal Statement
6
Attitudinal Statement Agree* Disagree*
“It is unfair that customers may be asked to pay more in their bills to fund rewards to companies.”
£6.19 £9.82
“Anything that can be done to improve the environment is a good thing.”
£7.92 £1.38
“Water companies already make high enough profits without giving them additional rewards.”
£5.62 £7.64
“Incentives are a good way of ensuring water companies provide the best level of service possible.”
£7.98 £6.11
*95% Confidence Interval
100
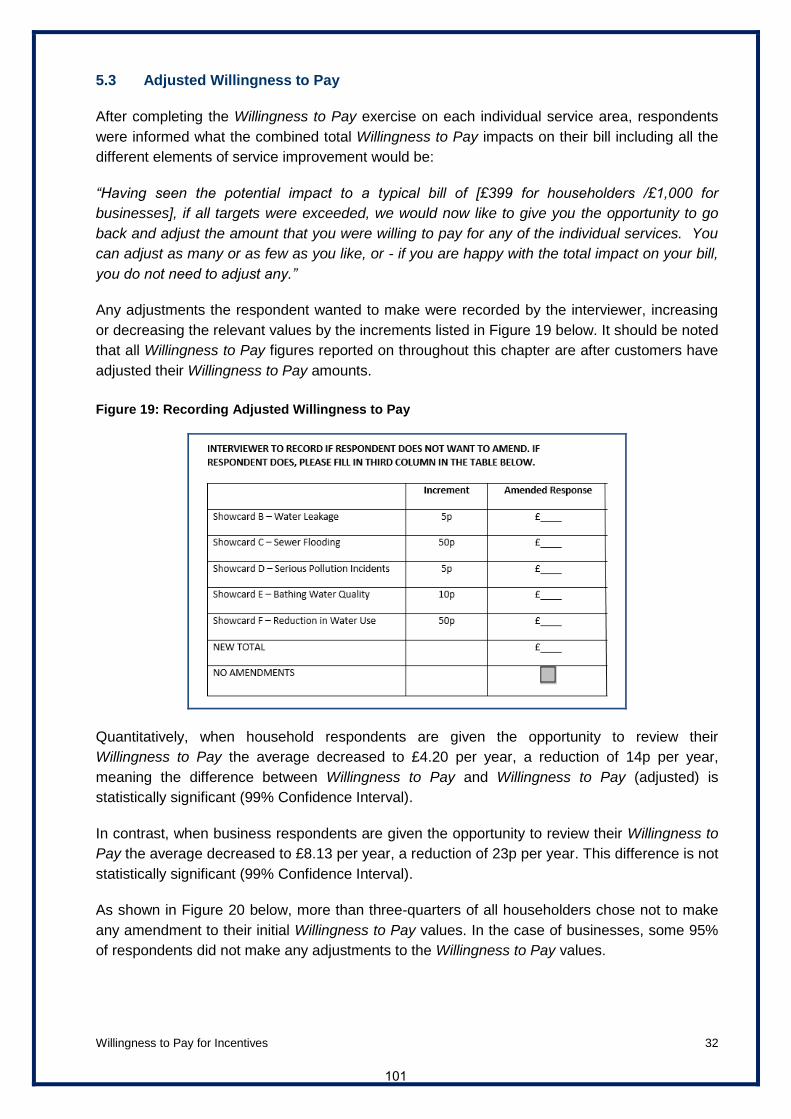
Willingness to Pay for Incentives 32
5.3 Adjusted Willingness to Pay
After completing the Willingness to Pay exercise on each individual service area, respondents
were informed what the combined total Willingness to Pay impacts on their bill including all the
different elements of service improvement would be:
“Having seen the potential impact to a typical bill of [£399 for householders /£1,000 for
businesses], if all targets were exceeded, we would now like to give you the opportunity to go
back and adjust the amount that you were willing to pay for any of the individual services. You
can adjust as many or as few as you like, or - if you are happy with the total impact on your bill,
you do not need to adjust any.”
Any adjustments the respondent wanted to make were recorded by the interviewer, increasing
or decreasing the relevant values by the increments listed in Figure 19 below. It should be noted
that all Willingness to Pay figures reported on throughout this chapter are after customers have
adjusted their Willingness to Pay amounts.
Figure 19: Recording Adjusted Willingness to Pay
Quantitatively, when household respondents are given the opportunity to review their
Willingness to Pay the average decreased to £4.20 per year, a reduction of 14p per year,
meaning the difference between Willingness to Pay and Willingness to Pay (adjusted) is
statistically significant (99% Confidence Interval).
In contrast, when business respondents are given the opportunity to review their Willingness to
Pay the average decreased to £8.13 per year, a reduction of 23p per year. This difference is not
statistically significant (99% Confidence Interval).
As shown in Figure 20 below, more than three-quarters of all householders chose not to make
any amendment to their initial Willingness to Pay values. In the case of businesses, some 95%
of respondents did not make any adjustments to the Willingness to Pay values.
101

Willingness to Pay for Incentives 33
Household respondents who had initially shown “zero” Willingness to Pay for any given service
area categorically did not amend their Willingness to Pay when given the opportunity Another
factor that cannot be underestimated is the relative length of the questionnaire, and
respondents’ fatigue when being asked to go through a further process of incremental changes
to their total amounts.
Sewer Flooding Incidents (10%) attracted the most frequent adjustments amongst
householders, while Willingness to Pay values for Serious Pollution Incidents (4%) were the
most frequently adjusted amongst business respondents.
Figure 20: Adjustments Made on Willingness to Pay
102

Willingness to Pay for Incentives 34
6. Conclusions
The backdrop to the research is that most people are satisfied with the service they receive and
most are satisfied with the value for money of their water and wastewater services. The total
level of penalties proposed by SWS is generally accepted by householders and businesses
alike. However, some service areas and their associated penalties gain very little support from
customers.
The research leads us to conclude that, although customers are generally willing to pay more
than their average annual water bill for Southern Water to exceed the service area targets, the
overwhelming majority of customers are not willing to pay anywhere close to Southern Water’s
recommended levels of incentive. Indeed, the overall conclusions of the research are
unambiguous:
60% of households would not be willing to accept the recommended level of £6.10 on an
average annual water bill of £399
78% of businesses would not be willing to accept the recommended level of £15.26 on
an average annual water bill of £1,000
103

Willingness to Pay for Incentives 35
7. Appendices
Appendix 1 – Questionnaire
In total, five versions of the following questionnaire were used – one for each audience.
DJS Research Ltd, 3 Pavilion Lane, Strines, Stockport SK6 7GH
Telephone: +44 (0)1663 767857
I declare that this interview was carried out according to instructions, within the MRS Code of Conduct and that the respondent was not previously known to me. Name:………………………………… Signature:…………………………………...
Date:…………………………………. Actual Interview Duration:……..minutes
2044 Southern Water - Willingness to Pay for Incentives
Introduction
This research is being carried out by DJS on behalf of Southern Water and is part of developing
Southern Water’s plans for services between 2015-2020. The aim is to find out what people think
about Southern Water’s plans for rewards and penalties for performance against Southern
Water’s targets.
Please be assured that any answer you give will be treated in confidence in accordance with the
Code of Conduct of the Market Research Society and none of your comments will be attributed
to you personally. Any personal information we ask for is purely to classify your answers and
will not be passed back to Consumer Council for Water or any third parties for any marketing or
sales purposes.
The interview should take no more than 15-20 minutes to complete.
Should you have any questions about the research please contact David Marchant at DJS
Research on 01663 767857 or email David at [email protected]
About You
Q1. Which water company provides your water supply? READ OUT
Southern Water
Affinity Water Southeast
Portsmouth Water
Sembcorp Bournemouth Water
South East Water
South West Water
Sutton & East Surrey Water
Thames Water
Wessex Water
Private supply only
104

Willingness to Pay for Incentives 36
Other
Q2. And which company provides your sewerage service.
Southern Water
Affinity Water Southeast
Portsmouth Water
Sembcorp Bournemouth Water
South East Water
South West Water
Sutton & East Surrey Water
Thames Water
Wessex Water
Other
Septic tank
Don’t know
ASK ALL WHO CLAIM THEIR SEWERAGE COMPANY IS NOT SOUTHERN WATER OR DO
NOT KNOW
Q2b According to our records, your sewerage company is Southern Water
Does this sound right to you?
Yes
No
Not sure
IF NEITHER WATER OR SEWERAGE PROVIDED BY SOUTHERN WATER (OR RESPONDENT DOES NOT KNOW SUPPLIERS) – THANK AND CLOSE
BASE:
DUAL CUSTOMERS (BOTH WATER AND SEWERAGE SERVICES PROVIDED BY SOUTHERN WATER AT Q1/Q2) WASTE ONLY CUSTOMERS (SEWERAGE SERVICES ONLY PROVIDED BY SOUTHERN WATER AT Q2)
Q3. Are you solely or jointly responsible for paying the water bill?
Yes
No, I am not responsible for paying the
bill THANK & CLOSE
Q4. Please code gender. DO NOT READ OUT
Male
Female
105

Willingness to Pay for Incentives 37
Q5. And which of the following age groups do you fall into?
Under 18 THANK & CLOSE
18-29 CHECK QUOTA
30-34 THANK & CLOSE
35-49 THANK & CLOSE
50-64 THANK & CLOSE
65-74 THANK & CLOSE
75+ CHECK QUOTA
Q6. Do you or anyone in your household have a long-term illness, health problem or
disability which limits your daily activities or the work you can do?
Yes (self) CHECK QUOTA
Yes (other)
No CHECK QUOTA
Don’t know / refused
Q7. Now, thinking of the chief income earner in your household (which might be you or
somebody else in the household) which of these best describes the current status of the chief
income earner?
Homemaker/housewife
Student/Full time education
Retired
Unemployed/on benefit
Factory/manual worker
Crafts/tradesperson/skilled
worker
Office/clerical/administration
Middle management
Senior management
Professional
Don't know/prefer not to say
106

Willingness to Pay for Incentives 38
ASK ALL DUAL CUSTOMERS AT Q1 / Q2
Q8a. How much do you currently pay per year for your water and sewerage services? (NB if
you have a water meter your bill might be for six months rather than a year, or if you don’t have
a water meter you may make 10 monthly payments to cover charges for the whole year).
Please provide your best estimate.
£______________
ASK ALL WASTE ONLY CUSTOMERS AT Q1 / Q2a
Q8b. How much do you currently pay per year for your sewerage services? (NB you may
make 10 monthly payments to cover charges for the whole year). Please provide your best
estimate.
£______________
ASK ALL
Q9 Check You’ve said that your current bill for [water and sewerage services / sewerage
services / ask as appropriate] – is [confirm amount specified at Q8a/b] are you sure that
this is for 12 months?
Yes
No
IF NO: Please re-write the amount so that it is for 12 months at Q8a/8b above
ASK ALL WHO RECEIVE WATER SERVICES FROM SOUTHERN WATER AT Q1
Q10 Before answering the next set of questions I’d like you to think about your water
services which are provided by Southern Water. Overall how satisfied or dissatisfied are you
with your current water services?
Very satisfied
Fairly satisfied
Neither satisfied nor dissatisfied
Fairly dissatisfied
Very dissatisfied
Don’t know
ASK ALL WHO RECEIVE WATER SERVICES FROM SOUTHERN WATER AT Q1
Q11. How satisfied or dissatisfied are you with the value for money of the water services in
your area?
Very satisfied
Fairly satisfied
Neither satisfied nor dissatisfied
Fairly dissatisfied
107

Willingness to Pay for Incentives 39
Very dissatisfied
Don’t know
ASK ALL WHO RECEIVE WASTE SERVICES FROM SOUTHERN WATER AT Q2
Q12 I’d like you to think about your sewerage services which are provided by Southern
Water. Overall how satisfied or dissatisfied are you with your current sewerage services?
Very satisfied
Fairly satisfied
Neither satisfied nor dissatisfied
Fairly dissatisfied
Very dissatisfied
Don’t know
ASK ALL WHO RECEIVE WASTE SERVICES FROM SOUTHERN WATER AT Q2
Q13. How satisfied or dissatisfied are you with the value for money of the sewerage services
in your area?
Very satisfied
Fairly satisfied
Neither satisfied nor dissatisfied
Fairly dissatisfied
Very dissatisfied
Don’t know
108

Willingness to Pay for Incentives 40
HAND RESPONDENT SHOWCARDS 1, 2 AND 3 CONTAINING THE INTRO BELOW AND
ASK THEM TO READ IT, OR READ OUT IF NECESSARY
I’d now like to give you some background information to the next set of questions which will
take a minute or two to read. Every five years, water and/or sewerage companies like
Southern Water are required to write five year business plans setting out how they will meet
environmental, drinking and wastewater quality standards and deliver high quality customer
service. Southern Water have built their 2015-2020 business plan on the basis of extensive
discussions with their customers. The plan includes 26 ‘promises’, or service targets, which
are based on delivering improvements in the areas their customers told them were most
important to them. Water and/or sewerage companies submit their plans to Ofwat who is the
regulator for the water industry and then Ofwat sets prices and service levels for the next five
years. As the regulator, Ofwat also monitors whether companies are meeting the service
levels they have committed to provide to their customers.
Ofwat wants to link more of the profit that water and/or sewerage companies are allowed to
earn to beating targets and delivering improvements in customer priorities. So, in future there
will be the potential for water companies to benefit from delivering better levels of service than
they planned. In this instance, companies that exceed their service targets by performing
exceptionally well will be able to increase their prices slightly in the next five year period
– so from 2020 to 2025. However, if they do not deliver the targets included in their plan,
they will pay a penalty – so profits would be lower. Through extensive discussion with
customers, Southern Water has identified six areas of service that could be incentivised
in this way. These six areas are those which customers consider to be the highest priority to
improve. I am now going to show them to you one at a time to get your opinions on them. The
scale of the penalties and benefits to Southern Water is linked to findings from previous
customer research on how much customers are willing to pay for specific improvements
and/or the costs associated with delivering those improvements.
When making your responses please remember that:
· your water bills can go up or down for other reasons.
· Other household bills may also go up or down, affecting the amount of money you have to spend in
general
· Your household income and expenses might change
NOTE TO INTERVIEWER:
FOR DUAL CUSTOMERS PLEASE SHOW THE SIX SERVICE MEASURES ON
SHOWCARDS A TO F IN RANDOMISED ORDER, BUT NEVER START WITH
SHOWCARD A AS THIS ONLY HAS A PENALTY ATTACHED AND NOT A
BENEFIT AS WELL.
FOR SEWERAGE ONLY CUSTOMERS PLEASE SHOW THE THREE SERVICE
MEASURES ON SHOWCARDS C,D,E IN RANDOMISED ORDER
IF THE RESPONDENT WANTS TO KNOW MORE ABOUT WHAT ANY OF THEM
MEAN, GIVE THEM THE EXPLANATORY SHOWCARD TO LOOK AT – A1, B1,
ETC
READ OUT I will now show you the first of six/three service areas.
109

Willingness to Pay for Incentives 41
SHOWCARD A –WATER USE RESTRICTIONS
ONLY ASK THOSE WHO RECEIVE WATER SERVICES FROM SOUTHERN WATER AT
Q1
Q14. Please think about the proposed penalty to Southern Water if the agreed target is not met. This would amount to an approximate reduction of £3.02 to a typical annual bill of £399 for each of the years 2020-2025. With this in mind, how acceptable do you think the proposed penalty is? READ OUT Completely unacceptable GO TO
Q14b Unacceptable
Acceptable
Very acceptable
Don’t know/can’t say
ASK IF COMPLETELY UNACCEPTABLE or UNACCEPTABLE AT Q14.
Q14b I’m interested to know why the proposed penalty is unacceptable. Is the penalty …
Much too low
A bit too low
A bit too high
Much too high
110

Willingness to Pay for Incentives 42
SHOWCARD B – WATER LEAKAGE ONLY ASK THISE WHO RECEIVE WATER SERVICES FROM SOUTHERN WATER AT Q1 Q15. Thinking about the proposed penalty if Southern Water fails to meet their
agreed target, which would amount to an approximate reduction of £0.44 to a typical
annual bill of £399 for each of the years 2020-2025. How acceptable do you think
the proposed penalty is? READ OUT
Completely unacceptable GO TO
Q15b Unacceptable
Acceptable GO TO
Q16a Very acceptable
Don’t know/can’t say
ASK IF COMPLETELY UNACCEPTABLE or UNACCEPTABLE AT Q15. Q15b I’m interested to know why the proposed penalty is unacceptable. Is the penalty …
Much too low
A bit too low
A bit too high
Much too high
Q16a.Looking now at the benefits of lower leakage, would you pay 20p more for each of the years 2020-2025, on top of your current water bill from Southern Water, to reduce total leakage to 83.6 million litres a day? Yes GO TO Q16b
No GO TO Q16c
ASK IF YES AT Q16a Q16b. Would you pay 25p more every year, on top of your current water bill, to secure this level of service? (Please increase bid in 5p increments until respondent answers ‘No’ or until respondent answers yes to X) Yes
No
ASK IF NO AT Q16a
111

Willingness to Pay for Incentives 43
Q16c.If No - Would you pay 15p more every year, on top of your current water bill, to secure this level of service? (Please decrease bid in 5p increments until respondent answers ‘Yes’) Yes
No
Final amount decided upon
£________________
ASK ALL RESPONDENTS ANSWERING 0 AT Q16c
Q16d.You said that you were not willing to pay more than you do already for this. Why is that? DO NOT READ OUT BUT CODE BELOW, MULTIPLE ANSWERS POSSIBLE I think the current level of leakage is acceptable – no improvement is necessary
The improvements are too small to justify any reward for the company
It is unfair that customers are being asked to pay more if Southern Water beat their targets
I cannot afford to pay any more on my bill
I don’t understand the question
Other – INTERVIEWER PLEASE WRITE IN
___________________________________________________________________
ASK ALL RESPONDENTS NOT ANSWERING 0 AT Q16c Q16e.You said that you were willing to pay [read out amount willing to pay at
Q16b/Q16c] for this. Please tell me all the reasons why. DO NOT READ OUT BUT CODE BELOW, MULTIPLE ANSWERS POSSIBLE It’s a very small amount per year
It’s worth paying to reduce leakage
Leakage is bad for the environment
Leakage is a waste of water
Leakage means our bills will rise
Incentives are a good way of ensuring Southern Water reduces leakage
Other – INTERVIEWER PLEASE WRITE IN
__________________________________________________________________
112

Willingness to Pay for Incentives 44
SHOWCARD C – SEWER FLOODING
ASK ALL
Q17. Thinking about the proposed penalty if Southern Water fail to meet their agreed target, which would amount to an approximate reduction of £2.90 to a typical annual bill of £399 for each of the years 2020-2025. How acceptable do you think the proposed penalty is? READ OUT Completely unacceptable GO TO
Q17b Unacceptable
Acceptable GO TO
Q18a Very acceptable
Don’t know/can’t say
ASK IF COMPLETELY UNACCEPTABLE or UNACCEPTABLE AT Q17.
Q17b I’m interested to know why the proposed penalty is unacceptable. Is the penalty …
Much too low
A bit too low
A bit too high
Much too high
Q18a.Looking now at the benefits of fewer sewer flooding incidents, would you pay £1.50 for
each of the years 2020-25, on top of your current waste water bill from Southern Water, to
bring down the number of sewer flooding incidents to 1,700?
Yes GO TO Q18b
No GO TO Q18c
ASK IF YES AT Q18a Q18b. Would you pay £2 more every year, on top of your current waste water bill, to secure this level of service? (Please increase bid in 50p increments up to £X until respondent answers ‘No’) Yes
No
Final amount decided upon £________________
113

Willingness to Pay for Incentives 45
ASK IF NO AT Q18a Q18c.If No - Would you pay £1 more every year, on top of your current waste water bill, to secure this level of service? (Please decrease bid in 50p increments until respondent answers ‘Yes’) Yes
No
Final amount decided upon
£________________
ASK ALL RESPONDENTS ANSWERING 0 AT Q18c
Q18d.You said that you were not willing to pay more than you do already for this. Why is that? DO NOT READ OUT BUT CODE BELOW, MULTIPLE ANSWERS POSSIBLE I think the current level of sewer flooding is acceptable – no improvement is necessary
The improvements are too small to justify any reward for the company
It is unfair that customers are being asked to pay more if Southern Water beat their targets
I cannot afford to pay any more on my bill
I don’t understand the question
Other – INTERVIEWER PLEASE WRITE IN
___________________________________________________________________
ASK ALL RESPONDENTS NOT ANSWERING 0 AT Q18c Q18e.You said that you were willing to pay [read out amount willing to pay at
Q18b/Q18c] for this. Please tell me all the reasons why. DO NOT READ OUT BUT CODE BELOW, MULTIPLE ANSWERS POSSIBLE It’s a very small amount per year
Sewer flooding is a horrible experience for customers affected
It’s worth paying to reduce the number of houses affected by sewer flooding
Incentives are a good way of ensuring Southern Water reduces the number of sewer flooding incidents
Other – INTERVIEWER PLEASE WRITE IN
___________________________________________________________________
114

Willingness to Pay for Incentives 46
SHOWCARD D – SERIOUS POLLUTION INCIDENTS
ASK ALL RESPONDENTS
Q19. Thinking about the proposed penalty if Southern Water fail to meet their agreed target, which would amount to an approximate reduction of £0.43 to a typical annual bill of £399 for each of the years 2020-2025. How acceptable do you think the proposed penalty is? READ OUT Completely unacceptable GO TO Q19b
Unacceptable
Acceptable GO TO Q20a
Very acceptable
Don’t know/can’t say
ASK IF COMPLETELY UNACCEPTABLE or UNACCEPTABLE AT Q19.
Q19b I’m interested to know why the proposed penalty is unacceptable. Is the penalty …
Much too low
A bit too low
A bit too high
Much too high
Q20a.Looking now at the benefits of fewer pollution incidents, would you pay 25p more for
each of the years 2020-2025, on top of your current water bill for Southern Water to ensure
that there are no ‘serious pollution incidents’ affecting local rivers, streams and
beaches in 2015-2020?
Yes GO TO Q20b
No GO TO Q20c
ASK IF YES AT Q20a Q20b. Would you pay 30p more every year, on top of your current water bill, to secure this level of service? (Please increase bid in 5p increments up to £X until respondent answers ‘No’) Yes
No
Final amount decided upon £________________
115

Willingness to Pay for Incentives 47
ASK IF NO AT Q20a Q20c.If No - Would you pay 20p more every year, on top of your current water bill, to secure this level of service? (Please decrease bid in 5p increments until respondent answers ‘Yes’) Yes
No
Final amount decided upon £________________
ASK ALL RESPONDENTS ANSWERING 0 AT Q20c
Q20d.You said that you were not willing to pay any more than you already do for this. Why is that? DO NOT READ OUT BUT CODE BELOW, MULTIPLE ANSWERS POSSIBLE I think the current level of pollution incidents is acceptable – no improvement is necessary
The improvements are too small to justify any reward for the company
It is unfair that customers are being asked to pay more if Southern Water beat their targets
I cannot afford to pay any more on my bill
I don’t understand the question
Other – INTERVIEWER PLEASE WRITE IN
________________________________________________________________
ASK ALL RESPONDENTS NOT ANSWERING 0 AT Q20c Q20e.You said that you were willing to pay [read out amount willing to pay at
Q20b/Q20c] for this. Please tell me all the reasons why. DO NOT READ OUT BUT CODE BELOW, MULTIPLE ANSWERS POSSIBLE It’s a very small amount per year
It’s worth paying to reduce damage to the environment
Incentives are a good way of ensuring Southern Water reduces the number of pollution incidents
Other – INTERVIEWER PLEASE WRITE IN
___________________________________________________________________
116

Willingness to Pay for Incentives 48
SHOWCARD E – BATHING WATER QUALITY ASK ALL RESPONDENTS Q21. Thinking about the proposed penalty if Southern Water fails to meet their agreed target, which would amount to an approximate reduction of £3.26 to a typical annual bill of £399 for each of the years 2020-2025. How acceptable do you think the proposed penalty is? Completely unacceptable GO TO Q21b
Unacceptable
Acceptable GO TO Q22a
Very acceptable
Don’t know/can’t say
ASK IF COMPLETELY UNACCEPTABLE or UNACCEPTABLE AT Q21. Q21b I’m interested to know why the proposed penalty is unacceptable. Is the penalty …
Much too low
A bit too low
A bit too high
Much too high
Q22a.Looking now at the benefits of more beaches with ‘excellent’ bathing water quality, would you pay 60p more for each of the years 2020-2025, on top of your current water bill for Southern Water to increase the total number of beaches with ‘excellent’ bathing water quality to 47 in 2015 and 49 by 2020?
Yes GO TO Q22b
No GO TO Q22c
ASK IF YES AT Q22a Q22b. Would you pay 70p more every year, on top of your current water bill, to secure this level of service? (Please increase bid in 10p increments up to £X until respondent answers ‘No’) Yes
No
Final amount decided upon £________________
117

Willingness to Pay for Incentives 49
ASK IF NO AT Q22a Q22c.If No - Would you pay 50p more every year, on top of your current water bill, to secure this level of service? (Please decrease bid in 10p increments until respondent answers ‘Yes’) Yes
No
Final amount decided upon
£________________
ASK ALL RESPONDENTS ANSWERING 0 AT Q22c
Q22d.You said that you were not willing to pay any more than you already do for this. Why is that? DO NOT READ OUT BUT CODE BELOW, MULTIPLE ANSWERS POSSIBLE I think the current level of beaches reaching quality standards is acceptable – no improvement is necessary
I never go to the beach
The improvements are too small to justify any reward for the company
It is unfair that customers are being asked to pay more if Southern Water beats their targets
I cannot afford to pay any more on my bill
I don’t understand the question
Other – INTERVIEWER PLEASE WRITE IN
___________________________________________________________________
ASK ALL RESPONDENTS NOT ANSWERING 0 AT Q22c Q22e.You said that you were willing to [read out amount willing to pay at
Q22b/Q22c] for this. . Please tell me all the reasons why. DO NOT READ OUT BUT CODE BELOW, MULTIPLE ANSWERS POSSIBLE It’s a very small amount per year
It’s worth paying to reduce damage to the environment
I visit our beaches and I want as many as possible to have clean bathing water
I don’t go to the beach myself but I think as many as possible should have clean bathing water
Incentives are a good way of ensuring Southern Water increases the number of clean beaches
Other – INTERVIEWER PLEASE WRITE IN
___________________________________________________________________
118

Willingness to Pay for Incentives 50
SHOWCARD F – REDUCTION IN WATER USE ONLY ASK THOSE WHO RECEIVE WATER SERVICES Q23. Thinking about the proposed penalty if Southern Water fail to meet their agreed target, which would amount to an approximate reduction of £2.03 to a typical annual bill of £399 for each of the years 2020-2025. How acceptable do you think the proposed penalty is? Completely unacceptable GO TO Q23b
Unacceptable
Acceptable GO TO Q24a
Very acceptable
Don’t know/can’t say
ASK IF COMPLETELY UNACCEPTABLE or UNACCEPTABLE AT Q23. Q23b I’m interested to know why the proposed penalty is unacceptable. Is the penalty …
Much too low
A bit too low
A bit too high
Much too high
Q24a.Looking now at the benefits of reduced water consumption, would you pay £2.50 more for each of the years 2020-2025, on top of your current water bill for Southern Water to reduce the average water use per person, per day to 131.7 litres? Yes GO TO Q24b
No GO TO Q24c Q23c
ASK IF YES AT Q24a Q24b. Would you pay £3 more every year, on top of your current water bill, to secure this level of service? (Please increase bid in 50p increments until respondent answers ‘No’ or until respondent answers yes to £x) Yes
No
Final amount decided upon £________________
119
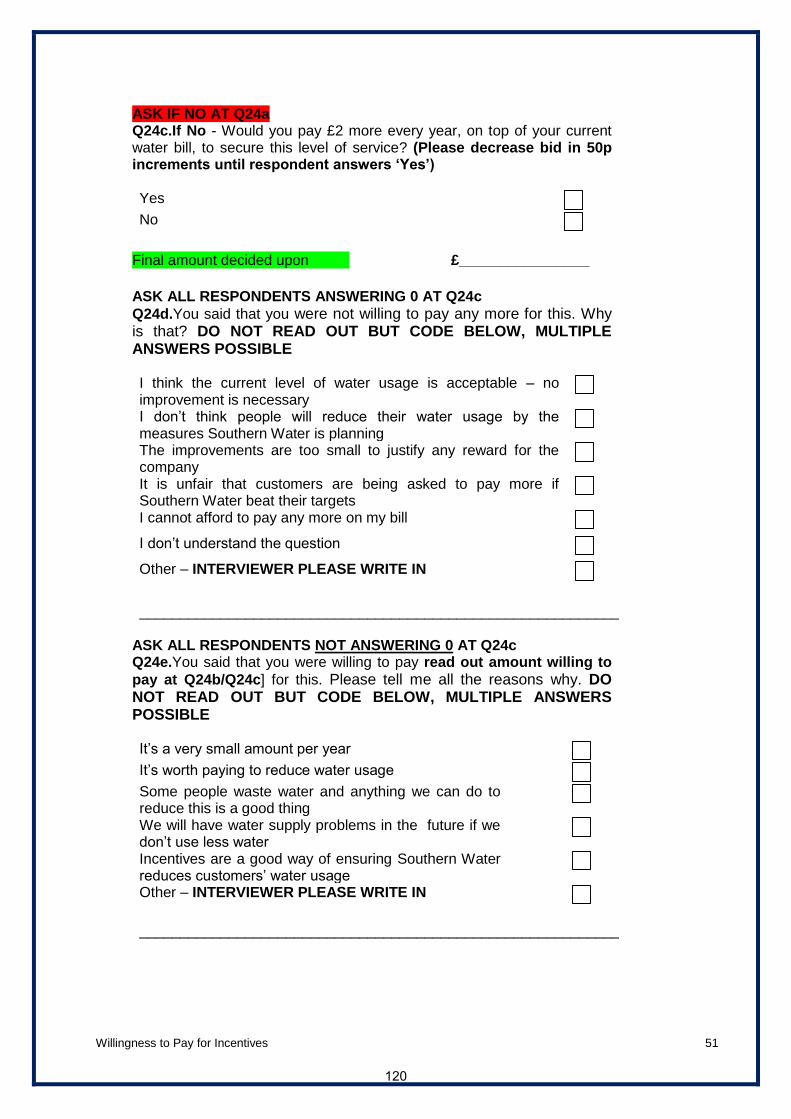
Willingness to Pay for Incentives 51
ASK IF NO AT Q24a Q24c.If No - Would you pay £2 more every year, on top of your current water bill, to secure this level of service? (Please decrease bid in 50p increments until respondent answers ‘Yes’) Yes
No
Final amount decided upon £________________
ASK ALL RESPONDENTS ANSWERING 0 AT Q24c
Q24d.You said that you were not willing to pay any more for this. Why is that? DO NOT READ OUT BUT CODE BELOW, MULTIPLE ANSWERS POSSIBLE I think the current level of water usage is acceptable – no improvement is necessary
I don’t think people will reduce their water usage by the measures Southern Water is planning
The improvements are too small to justify any reward for the company
It is unfair that customers are being asked to pay more if Southern Water beat their targets
I cannot afford to pay any more on my bill
I don’t understand the question
Other – INTERVIEWER PLEASE WRITE IN
_______________________________________________________________
ASK ALL RESPONDENTS NOT ANSWERING 0 AT Q24c Q24e.You said that you were willing to pay read out amount willing to
pay at Q24b/Q24c] for this. Please tell me all the reasons why. DO NOT READ OUT BUT CODE BELOW, MULTIPLE ANSWERS POSSIBLE It’s a very small amount per year
It’s worth paying to reduce water usage
Some people waste water and anything we can do to reduce this is a good thing
We will have water supply problems in the future if we don’t use less water
Incentives are a good way of ensuring Southern Water reduces customers’ water usage
Other – INTERVIEWER PLEASE WRITE IN
______________________________________________________________
120

Willingness to Pay for Incentives 52
INTRO
Now that you have been through each of the services in detail, I would like to show you the
total impact on your water bill if Southern Water managed to achieve the exceptional level of
service outlined for all [five – for water and waste water customers / three – for sewerage
customers] services.
The amounts shown are the maximum amounts you previously said you would be willing to
pay for each service.
SHOW DUAL CUSTOMERS SHOWCARD G1 – IMPACT OF EXCEEDING TARGETS.
WRITE IN FINAL AMOUNTS FROM FIVE OUTCOME QUESTIONS IN THE TABLE BELOW
AND SHOW TO RESPONDENT
SHOW ALL SEWERAGE ONLY CUSTOMERS SHOWCARD G2 –IMPACT OF
EXCEEDING TARGETS. WRITE IN FINAL AMOUNTS FROM THREE OUTCOME
QUESTIONS IN THE TABLE BELOW AND SHOW TO RESPONDENT
Annual Increase to your bill
Showcard B – water leakage
Insert amount from Q16b or Q16c
£___
Showcard C – sewer flooding
Insert amount from Q18b or Q18c
£___
Showcard D – serious pollution incidents
Insert amount from Q20b or Q20c
£___
Showcard E – bathing water quality
Insert amount from Q22b or Q22c
£___
Showcard F – reduction in water use
Insert amount from Q24b or Q24c
£___
TOTAL £___
BASE: ALL RESPONDENTS Q25. Having seen the potential impact to a typical annual bill of £399, if all targets were exceeded, I would now like to give you the opportunity to go back and adjust the maximum amount that you were willing to pay for any of the individual services. You can adjust as many or as few as you like by the increments we were talking about. INTERVIEWER TO RECORD IF RESPONDENT DOES NOT WANT TO AMEND. IF RESPONDENT DOES, PLEASE FILL IN THIRD COLUMN IN THE TABLE BELOW.
Increment Amended Response
Showcard B – Water Leakage 5p £____
Showcard C – Sewer Flooding 50p £____
Showcard D – Serious Pollution Incidents
5p £____
Showcard E – Bathing Water Quality 10p £____
Showcard F – Reduction in Water Use 50p £____
NEW TOTAL £____
121

Willingness to Pay for Incentives 53
NO AMENDMENTS
Finally, I’d like you to think about the total penalty Southern Water will have to pay if they do
not meet their agreed targets. The following table shows the total penalties for all the services
we have just been through.
SHOW DUAL CUSTOMERS SHOWCARD H1 – TOTAL PENALTY IMPACT
SHOW ALL SEWERAGE ONLY CUSTOMERS SHOWCARD H2 – TOTAL PENALTY
IMPACT
BASE: ALL RESPONDENTS Q26. How acceptable do you feel the total level of penalty is, and the impact on customer bills, if Southern Water do not meet all of their service targets? Completely unacceptable
Unacceptable
Acceptable
Very acceptable
Don’t know/can’t say
Q27. As shown above, if Southern Water did not meet all of their agreed targets, the total reduction to a typical annual bill of £399 would be [£12.08 – for water and sewerage customers / £6.59 – for sewerage customers]. If a penalty is due, would you prefer that this was used to reduce customer bills, or be reinvested in improved services? Reduce customer bills
Reinvest the penalty payments
Don’t know/can’t say
Q28. Finally, to what extent do you agree or disagree with each of the following statements in
relation to incentivising water companies such as Southern Water in this way?
PLEASE ROTATE STATEMENTS – READ OUT STATEMENTS
Strongly disagree
Tend to disagree
Neither / nor
Tend to agree
Strongly agree
It is unfair that customers may be asked to pay more in their bills to fund rewards to companies
Anything that can be done to improve the environment is a good thing
Water companies already make high enough profits without giving them additional rewards
Incentives are a good way of ensuring water companies provide the best level of service
122

Willingness to Pay for Incentives 54
possible
Q29. To finish off, I would like to make sure that we take account of the views of people of
all incomes. Could you tell me which of the following income bands your household falls into?
Please take account of the income of all those in the household (before tax and national
insurance) and include any pensions, benefits or extra earnings. READ OUT
Less than £10,000
£10,000 to £19,999
£20,000 to £29,999
£30,000 to £39,999
£40,000 to £49,999
£50,000 to £74,999
£75,000 to £99,999
£100,000 or more
Don’t know
Decline to answer
Q30 And looking ahead, how likely do you think it is that your household income is generally
going to keep up with changes in the cost of living (which includes inflationary costs, household
bills, food etc) over the next 5 years? READ OUT
Very likely
Fairly likely
Neither likely nor unlikely
Fairly unlikely
Very unlikely
Don’t know
Q31 How many people are in your household?
1
2
3
4-5
6-8
9-10
More than 10
Refused
123
Willingness to Pay for Incentives 55
Q32 Are there any children in your household?
Yes
No
IF yes at Q32 Ask
Q32a How old are they?
Under 5
5-10
11-16
Q33. Are you currently charged for water through a water meter?
1. Yes
2. No
Don’t know / can’t say
Q34 INTERVIEWER TO CODE LOCATION
Rural
Urban
Seaside
ASK ALL
Q35a Did you understand everything in this survey?
1. Yes
2. No
ASK ALL SAYING NO AT Q35a
Q35b What didn’t you understand? Please provide as much detail as you can. PROBE FULLY
_______________________________________________________________________
_______________________________________________________________________
SAY TO ALL
Q36 Thank you very much for taking part in this survey. Were there any issues relating to
benefits and penalties that could be imposed on Southern Water that were not covered in the
questionnaire which you would like to mention here?
________________________________________________________________________
________________________________________________________________________
124

Willingness to Pay for Incentives 56
THANK YOU FOR YOUR HELP IN THIS RESEARCH
This research was conducted under the terms of the Market Research Society (MRS) code of
conduct and is completely confidential. If you would like to confirm DJS Research’s credentials
please call the MRS free on 0500 396999.
We would be grateful if you could provide your name and telephone number for quality control
purposes. Please note that these will only be used by our quality control team and will not be
passed onto any third parties.
125
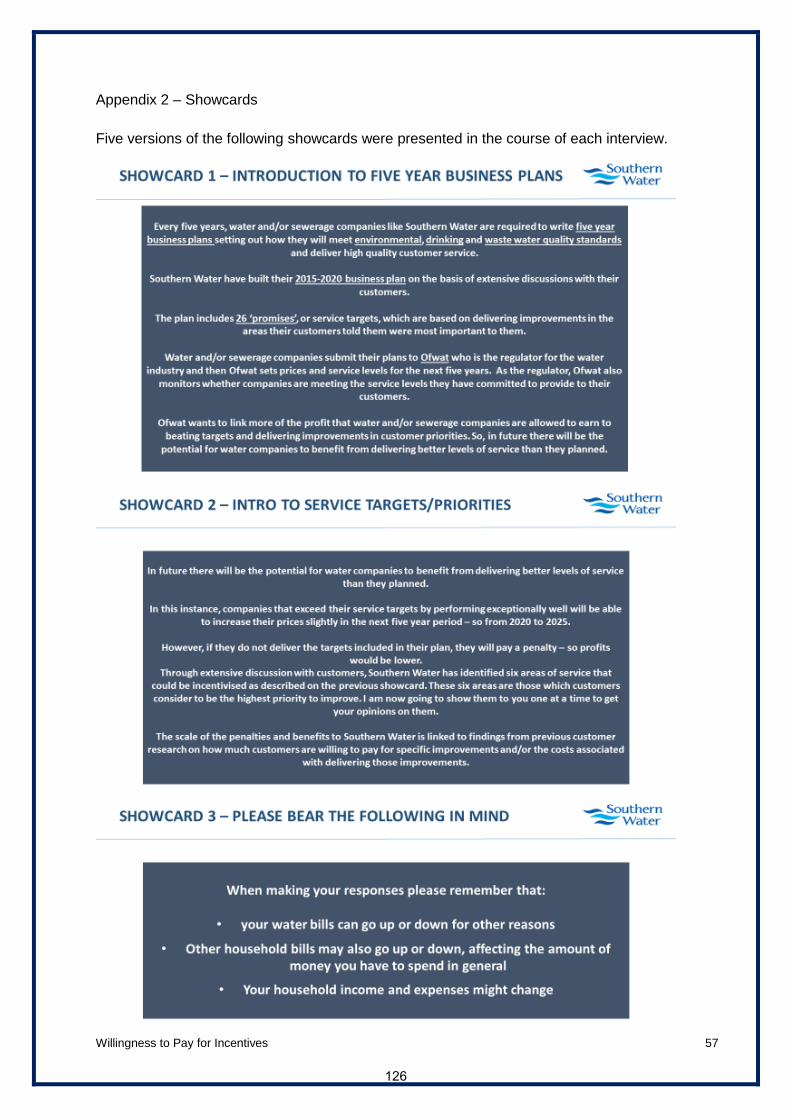
Willingness to Pay for Incentives 57
Appendix 2 – Showcards
Five versions of the following showcards were presented in the course of each interview.
126

Willingness to Pay for Incentives 58
127

Willingness to Pay for Incentives 59
128

Willingness to Pay for Incentives 60
129

Willingness to Pay for Incentives 61
130

Willingness to Pay for Incentives 62
131

Willingness to Pay for Incentives 63
132

Willingness to Pay for Incentives 64
Appendix 3 – Starting Point Showcards for Face-to-Face interviews
In order to support face-to-face interviewers, the following grids were developed. In total, 4 grids
with four different starting points were developed for interviews with businesses and 7 grids with
seven different starting points were developed for interviews with hard-to-reach householders.
Below are just two grid examples which were used by face-to-face interviewers.
133

Willingness to Pay for Incentives 65
Appendix 4 – “Zero” Willingness to Pay Respondents
134

Willingness to Pay for Incentives 66
Appendix 5 – Reasons for “Zero” Willingness to Pay for Individual Service Areas
135

Willingness to Pay for Incentives 67
136

Willingness to Pay for Incentives 68
Appendix 6 – Distribution of Willingness to Pay Responses
137
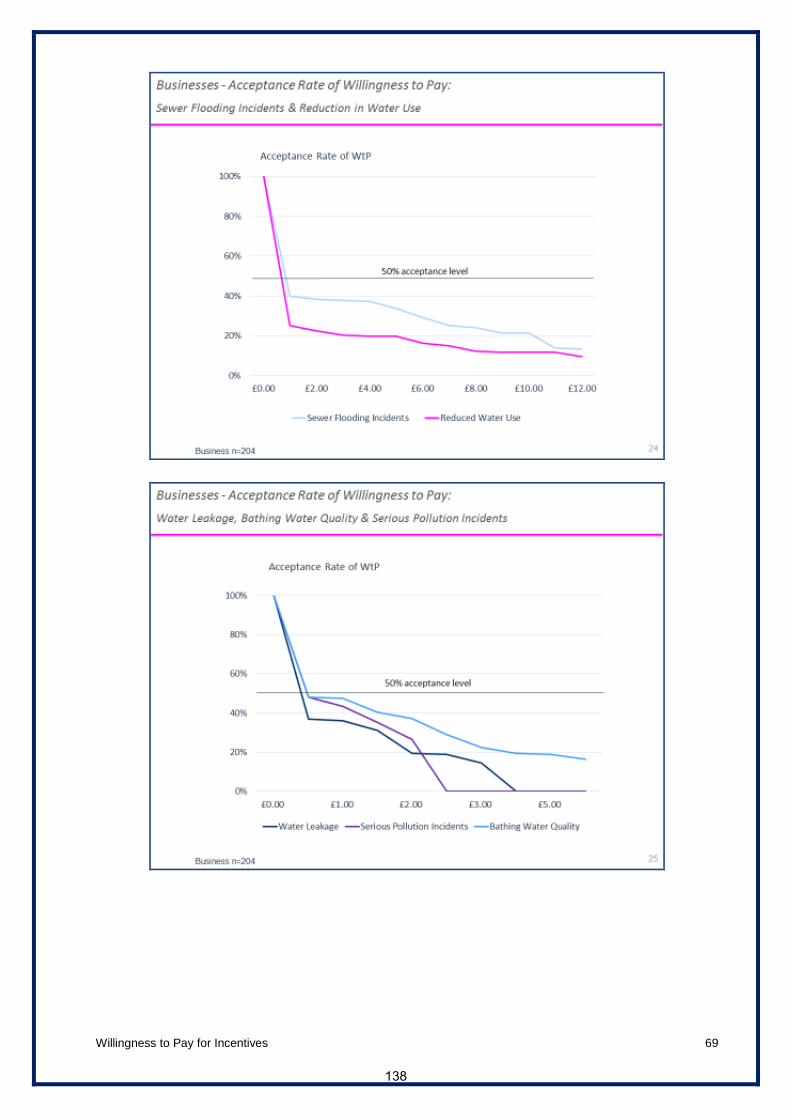
Willingness to Pay for Incentives 69
138

Review of ‘Willingness to Pay for Incentives’ Research Introduction RAND Europe were previously commissioned by Southern Water Services (SWS) to undertake a peer review of the programme of research undertaken to support the development of the Strategic Statement and Business Plan which formed the basis of the inputs for submission in Ofwat’s PR14 price review. Part of this research included a study to quantify consumers’ willingness to pay for service improvement priorities. The business plan allows performance to be incentivised, so that if SWS delivers more than the required service levels it can earn a financial reward. If SWS does not meet their promised service levels, then it can be financially penalised. The report “Willingness to Pay for Incentives” provides a description of the research undertaken to understand and quantifying customers’ willingness to pay for incentives for over performance or early delivery in key priority areas, as well as their views on expected levels of penalties for under delivery against the key priority areas and how they would wish to see incentives/penalties paid, i.e. through adjustments to bills or through reinvestment in service improvements.
Review of the research approach and analysis This research is conducted through interviews with SWS household and business customers. A multi-method survey approach (on-line, face-to-face and telephone surveys) was undertaken to ensure that the ‘sample was as representative as possible of SWS’s customer base’. For the household segment, 858 interviews were conducted with online panellists. A further 175 surveys were conducted using a face-to-face methodology to ensure that the sample included ‘hard-to-reach’ customers, including those with disabilities or chronic illness and those over 75 years of age. However, no comparisons with the SWS customer base are actually presented in the report. This would be a helpful addition (particularly in terms of age and income), given the use of the data to compute average willingness to pay valuations. In addition, 219 surveys were conducted with business users: 150 recruited and interviewed by telephone and 69 using a face-to-face methodology. Small, medium and large businesses were interviewed as part of the research, but again no comparisons with the SWS customer base are presented in the report. Again, this information would be a helpful addition. The sample sizes for the research are reasonably substantial. The questionnaire was well designed, and made good use of clear and succinct supporting show material to help explain the concepts to respondents and ensure consistency in understanding across respondents. It is not clear whether a pilot test of the survey was undertaken. Results are then presented on:
- reported satisfaction levels - views on penalties - willingness to pay for incentives
In terms of satisfaction levels, the results are clearly reported. The figures are well presented, and the summary boxes are particularly helpful in setting out the key findings.
139

In terms of customers’ views on penalties, it is difficult for the reader to put the acceptance figures into context, without information on the proposed penalty levels that were presented to respondents, although this information is presented in the Appendix. Willingness to pay was assessed using a bidding game approach. The report describes the detailed approach, along with some of the caveats, specifically:
- The report helpfully notes that possibility of anchoring bias, which is important in terms of the reliability of the resulting values, and presents evidence that this appears to be small.
- The report also discusses the problem of zero valuations, which are reasonably substantial, and presents the proportions of zero responses for each of the service areas tested. The report also presents the distribution of WTP responses.
Other comments on the research and report This is a solid piece of research. The sample sizes are reasonably large, and reflect a diverse range of customers. The information provided in the report is clear and allows readers to follow the general structure of the research process used, as well as key challenges and findings. There would be benefit in having the report formally copy-edited to ensure that there are no typing or grammatical errors in the report.
140
Scoring of the research report As with our review of previous rounds of research we have assigned scores, based upon a scheme used internally at RAND Europe, to assess the strength of the research across a range of criterion. Each criterion is assigned a score from 1-6, the full details of the scoring ladders are provided in Appendix A. For our own research we require that all criteria have a score of 4 or higher before we sign them off for publication within the public domain. However, it should be noted that the scoring ladder sets a very high standard and it is relatively rare that a study receives a score of 6 on any of the criterion. The scores for this piece of research are summarised below:
The problem should be well formulated and the purpose of the study should be clear. 4 - Problem is effectively formulated and the purpose of the study is clear.
The study approach should be well designed and executed. 4 - The design uses appropriate methods and execution is effective.
The study should demonstrate understanding of related studies. na - This criterion is not relevant for the report/deliverable being reviewed.
The data and information should be the best available. 4 - Appropriate data has been collected or used.
Assumptions should be explicit and justified. na - This criterion is not relevant for the report/deliverable being reviewed.
The findings should be important, advance knowledge and bear on important policy issues. 4 - The project usefully increases understanding of the area.
The implications and recommendations should be logical, warranted by the findings, and explained thoroughly, with appropriate caveats. na - This criterion is not relevant for the report/deliverable being reviewed.
The documentation should be accurate, understandable, clearly structured and temperate in tone. 4 - The documentation is accurate, understandable suitably structured and temperate in tone.
The study should be compelling, useful, and relevant to stakeholders and other decisionmakers. 4 - The report is clearly relevant to the client and explicitly lays out how they can use this Knowledge
The study should be objective, independent, and balanced. 4 - The work demonstrates objectivity, independence and balance.
141

Appendix A: RAND Europe’s quality standards Quality assurance (QA) is a vital part of all RAND Europe’s work. All reports are reviewed by two individuals independent of the study team prior to publication. To provide an overview of quality at RAND Europe, we use a scoring system as part of our reviewing process. The system is based on the ten RAND criteria for quality. Providing scores ensures that all the quality criteria are considered as part of the review, and clearly identifies areas where the reviewer may feel they do not have appropriate expertise to pass judgment. Scoring is not a replacement for qualitative reviews; rather it is intended to complement them: for individual pieces of work it acts as an unambiguous signal of the strengths and weaknesses. Each criterion is scored on a scale of 1 to 6. The criteria are:
The problem should be well formulated and the purpose of the study should be clear.
The study approach should be well designed and executed.
The study should demonstrate understanding of related studies.
The data and information should be the best available.
Assumptions should be explicit and justified.
The findings should be important, advance knowledge and bear on important policy issues.
The implications and recommendations should be logical, warranted by the findings, and explained thoroughly, with appropriate caveats.
The documentation should be accurate, understandable, clearly structured and temperate in tone.
The study should be compelling, useful, and relevant to stakeholders and other decisionmakers.
The study should be objective, independent, and balanced. The 1 to 6 scales are defined by language ladders that describe each score. These can be generalised as follows:
6 - Exceptional work: creative, novel, innovative, adds to and extends current best practice. As a rule of thumb this would probably be the best piece of work you have seen in the last year. 5 - Excellent work at the cutting edge of current practice. 4 - High quality work that reaches the standards required for publication. 3 - Needs minor refinement or correction that does not affect the conclusions of the study, but may require minor caveats. 2 - Needs significant revision that may affect the conclusions of the study. 1 - Fundamentally flawed. nex - The reviewer does not have the expertise to assess the work against this criterion. na - This criterion is not relevant for the report/deliverable being reviewed.
For our own research we require that all criterion have a score of 4 or higher before we sign them off for publication within the public domain. However, it should be noted that the scoring ladder sets a high bar and it is relatively rare that a study receives a score of 6 on any of the criterion. We have applied this scoring system to provide Southern Water with an overview of the strengths and weaknesses of the research reported from each wave of the research.
142

The detailed scoring ladder The ladders for each criterion are given below. It is important to note that few projects are expected to score 6; indeed many could not achieve the highest scores because of the scope of the project. The key is that all reports must achieve at least a 4 against all criteria. 1. The problem should be well formulated and the purpose of the study should be clear.
6 - Problem is formulated in a novel and innovative way that allows it to be more effectively addressed than was previously possible, and the purpose of the study is clear. 5 - Problem is formulated in a way that puts it at the cutting edge of work in the area, and the purpose of the study is clear. 4 - Problem is effectively formulated and the purpose of the study is clear. 3 - Formulation of problem needs minor revision and findings may require additional caveats, or the problem is not clearly stated. 2 - Flaws in the formulation of the problem mean that the study findings need modification or that caveats should be added. 1 - Formulation of the problem is fundamentally flawed and cannot support the findings, or the problem is not adequately defined. nex - The reviewer does not have the expertise to assess the work against this criterion. na - This criterion is not relevant for the report/deliverable being reviewed.
2. The study approach should be well designed and executed. 6 - The study design advances conceptual thinking, develops new methods (or employs methods new to the area) and the execution is exemplary. 5 - The design uses fully justified cutting edge methods and execution is robust. 4 - The design uses appropriate methods and execution is effective. 3 - Design or execution is imperfect, needing a small amount of additional analysis or additional caveats. 2 - Design, methods or execution has significant flaws that would undermine the credibility of the work, require significant additional work and/or entail major changes to the findings. 1 - Flaws in design or execution mean that it is impossible to make useful findings. nex - The reviewer does not have the expertise to assess the work against this criterion. na - This criterion is not relevant for the report/deliverable being reviewed.
3. The study should demonstrate understanding of related studies. 6 - The work does an outstanding job of synthesizing current and past research in the area and brings in relevant work from other fields. 5 - The work demonstrates a wide understanding of current and past research in the field. 4 - Appropriate understanding of previous research is demonstrated. 3 - There are minor shortfalls in the understanding of previous research that should be addressed. 2 - There are significant shortfalls in the understanding of previous research that could affect the findings or undermine the credibility of the work. 1 - Serious misunderstandings of previous research and the context for the current study jeopardize the findings of the study or its credibility. nex - The reviewer does not have the expertise to assess the work against this criterion. na - This criterion is not relevant for the report/deliverable being reviewed.
4. The data and information should be the best available. 6 - New types of data have been brought to bear on the question.
143
5 - State-of-the-art data sources have been developed or used. 4 - Appropriate data has been collected or used. 3 - Additional data sources should be taken into account or minor caveats may need to be added. 2 - Significant additions need to be made to the data sources that are likely to require changes to the findings of the study, or the addition of major caveats. 1 - Data sources are inappropriate and unable to support the implications and recommendations of the study. nex - The reviewer does not have the expertise to assess the work against this criterion. na - This criterion is not relevant for the report/deliverable being reviewed.
5. Assumptions should be explicit and justified. 6 - Old assumptions have been overturned or rendered unnecessary, those assumptions that remain are clearly justified. 5 - All assumptions are thoroughly justified and their implications fully explained. 4 - Reasonable assumptions are made and explained. 3 - Assumptions need more effective justification. Additional caveats may be required. 2 - Unreasonable assumptions have been made that will require changes to the findings of the study, or the addition of major caveats. 1 - The assumptions made are so unreasonable as to render the analysis meaningless. nex - The reviewer does not have the expertise to assess the work against this criterion. na - This criterion is not relevant for the report/deliverable being reviewed.
6. The findings should be important, advance knowledge and bear on important policy issues. 6 - Project provides a paradigm-shifting addition to understanding. 5 - Project advances knowledge in important ways and brings new viewpoints to bear on the question. 4 - The project usefully increases understanding of the area. 3 - Project contains findings that advance knowledge, but the report needs modifying so that these findings are made clearer to the reader. 2 - The projects findings do not usefully add to knowledge in the area. 1 - Project is in danger of decreasing understanding in the area by propagating myths and inaccuracies. nex - The reviewer does not have the expertise to assess the work against this criterion. na - This criterion is not relevant for the report/deliverable being reviewed.
7. The implications and recommendations should be logical, warranted by the findings, and explained thoroughly, with appropriate caveats.
6 - There is a clear link between implications, recommendations and findings. Caveats are well explained and implications drawn. There is an elegant consideration of possible counter arguments or alternative explanations for the findings. 5 - There is a clear link between implications, recommendations and findings. Caveats are well explained and implications drawn. 4 - Report effectively links the findings to the implications and recommendation. Caveats are appropriate. 3 - The report needs to better explain the link between implications and recommendations and the findings or provide more clarity with respect to the caveats. 2 - Some recommendations and implications in the report are not fully supported by the findings, the former needing slight amendment; or additional caveats are required 1 - The recommendation and implications are not supported by the findings requiring significant modification, additional research or major additional caveats.
144

nex - The reviewer does not have the expertise to assess the work against this criterion. na - This criterion is not relevant for the report/deliverable being reviewed.
8. The documentation should be accurate, understandable, clearly structured and temperate in tone. This criterion covers explanation of methods as well as results, conclusions and recommendations.
6 - The documentation is accessible, clear, well-structured and elegant. It effectively uses diagrams, illustration and the written word. It is temperate in tone. 5 - The documentation is easily accessible to its key audience, accurate and well structured, and temperate in tone. 4 - The documentation is accurate, understandable suitably structured and temperate in tone. 3 - The documentation needs minor reviews and corrections or needs tempering. 2 - The documentation needs significant revision in structure and content or is strident in tone. 1 - The documentation is difficult to understand in both detail and structure and requires complete revision. nex - The reviewer does not have the expertise to assess the work against this criterion. na - This criterion is not relevant for the report/deliverable being reviewed.
9. The study should be compelling, useful, and relevant to stakeholders and other decisionmakers. 6 - The report makes clear its relevance to a broad range of stakeholders and decisionmakers; and provides a strategic consideration of how its recommendations could be implemented. 5 - The report is clearly relevant to the client and others; and explicitly lays out how they can use this knowledge. 4 - The report is clearly relevant to the client and explicitly lays out how they can use this knowledge 3 - Report does not make clear how its findings are of relevance to policy makers. 2 - The report needs significant revision to make clear how its findings could be used by the client. 1 - It isn’t clear how the knowledge produced could be used in any meaningful way. nex - The reviewer does not have the expertise to assess the work against this criterion. na - This criterion is not relevant for the report/deliverable being reviewed.
10. The study should be objective, independent, and balanced. This criterion relates specifically to how the researchers made sure the research was objective, independent and balanced. Scoring a 6 would mean that researchers had developed particular techniques to ensure objectivity, etc., such as an improved method of blinding peer review.
6 - The work develops new methods to ensure objectivity, independence and balance, and demonstrates their effectiveness. 5 - The work explicitly uses state of the art techniques to assure objectivity, independence and balance. 4 - The work demonstrates objectivity, independence and balance. 3 - Minor problems with objectivity or apparent conflict of interest issues require additional caveats or justification. 2 - Significant problems with objectivity or apparent conflicts of interest could affect conclusions or credibility.
145

1 - The work is seriously compromised by conflict of interest. nex - The reviewer does not have the expertise to assess the work against this criterion. na - This criterion is not relevant for the report/deliverable being reviewed.
146

Appendix B: The peer reviewer Charlene Rohr is the Director of RAND Europe’s Choice Modelling and Valuation Group. She has over twenty years of applied experience in the modelling of choice behaviour, quantifying consumers’ preferences and modelling the impacts of policy interventions to studies within the telecoms, environmental, health and postal sectors. She has recently led studies to quantify demand for highspeed rail services in Britain, a study to examine the impact of multibuy promotions on alcohol purchasing for HRMC, and a study for the European Commission using stated preference choice experiments to quantify consumers’ preferences for postal services in three European Member States. She has acted as an internal peer reviewer on research undertaken at RAND Europe to support water companies in previous price review rounds. She has also led work on customer priorities for Ofgem. She is a highly experience researcher and manager and has worked with a range of UK and European public and private sector clients. Charlene is an experienced peer reviewer, and was awarded as RAND Europe’s Quality Assurance Reviewer of the Year in 2013. She has acted in academic peer review roles for a range of journals and conferences, and has undertaken reviews of grant applications for funding bodies. She regularly act as quality assurance reviewers for RAND Europe reports, both for research reports in their direct areas of expertise and for reports outside of these areas where she brings the eye of an informed lay reader. She understands the benefits that peer review can provide and is used to applying these principles in a contract research environment where honest appraisal is required within an appreciation of the context in which the work was undertaken and the resource available to commit to it.
147