response rates to the national household survey
TRANSCRIPT
VOL 4, ISSUE 5
Response Rates to the National Household Survey
Productivity Remains Strong in the West but Growth may be Slowing
Two Solitudes? Aboriginal and Non-Aboriginal Opinion in Saskatchewan
Perception and Opinions about Crime and Justice in Saskatchewan: Questions about their Relatedness
By Doug Elliot, Publisher, Western Policy Analyst
The National Household Survey (NHS) is the name that Statistics Canada uses for the voluntary part of
the 2011 census – what used to be called the “long form” for the census (and was mandatory). The first of three data releases from the 2011 NHS was in May so we now have an indication of how the switch from a mandatory to a voluntary survey has affected the data quality. In many ways, the news is worse than expected.
Three issues arise with the switch from a mandatory to a voluntary survey. • Statistics Canada suppresses statistics fromspecific communities if the response rate to the NHS was too low. • There is a potentially large but ultimatelyunknown level of non-response bias in the published data. • The mandatory census was used as areference for other surveys; the quality of other sample survey data will decline without that reference.
Suppression of Community Level Data The first problem is the most visible. The NHS was sent to a random sample of 30% of the households in Canada. Statistics Canada used the response rate to determine if the data was
Response Rates to the National Household Survey
www.schoolofpublicpolicy.sk.ca University of Regina University of Saskatchewan
1
3
6
reliable enough to be published. If fewer than 50% of the surveyed households responded (that is, 15% of the population), the data for that community was deemed to be too unreliable to be useful and was not published.
In 2011, there were 1,972 census subdivisions1 in western Canada that had a large enough population to allow publication of information from the mandatory part of the census. Of these only two-thirds (1,327 or 67%) had a high enough response rate to allow publication of data from the 2011 NHS. In the remaining third of the communities, we know demographic information from the mandatory part of the census but not socioeconomic information from the NHS. That means, for example, the age, sex, language, and living arrangements for the residents are known but the education, employment, income, housing condition, immigration status, and Aboriginal identity are not. (In 2006, socioeconomic data was available for virtually all of the census subdivisions.)
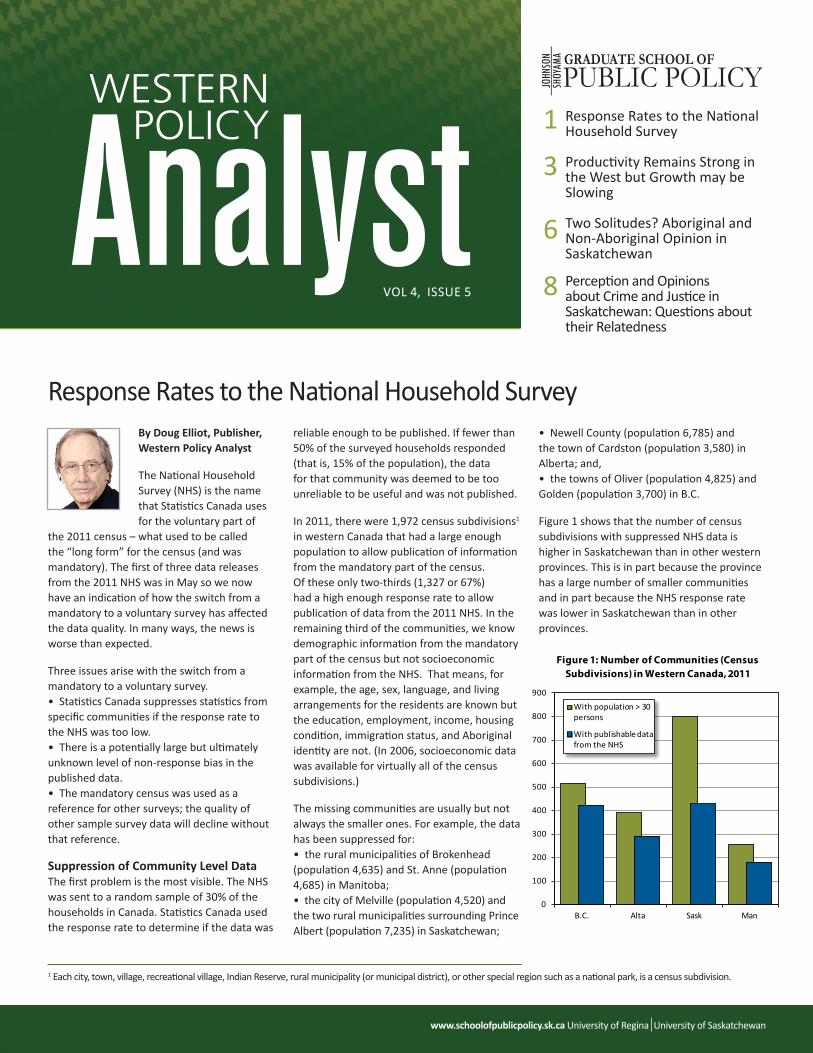
The missing communities are usually but not always the smaller ones. For example, the data has been suppressed for: • the rural municipalities of Brokenhead(population 4,635) and St. Anne (population 4,685) in Manitoba; • the city of Melville (population 4,520) and the two rural municipalities surrounding Prince Albert (population 7,235) in Saskatchewan;
• Newell County (population 6,785) andthe town of Cardston (population 3,580) in Alberta; and, • the towns of Oliver (population 4,825) andGolden (population 3,700) in B.C.
Figure 1 shows that the number of census subdivisions with suppressed NHS data is higher in Saskatchewan than in other western provinces. This is in part because the province has a large number of smaller communities and in part because the NHS response rate was lower in Saskatchewan than in other provinces.
1 Each city, town, village, recreational village, Indian Reserve, rural municipality (or municipal district), or other special region such as a national park, is a census subdivision.
8
0
100
200
300
400
500
600
700
800
900
B.C. Alta Sask Man
Figure 1: Number of Communities (Census Subdivisions) in Western Canada, 2011
With population > 30 persons
With publishable data from the NHS

VOL 4 ISSUE 5 JUNE 2013
The Western Policy Analyst is published several times annually by the Johnson-Shoyama Graduate School of Public Policy. No reproduction of any material is allowed without express consent of the publishers.
EDITOR Doug Elliott
PUBLISHER Andrea Geisbauer
EDITORIAL BOARD Rose OlfertJim Marshall Iryna Kryvoruchko
COPYRIGHT JSGS 2010
Johnson-Shoyama Graduate School of Public PolicyUniversity of Saskatchewan CampusDiefenbaker Building101 Diefenbaker PlaceSaskatoon, SK Canada S7N 5B8Tel: 306 966-8525 Fax: 306 966-1967 Email: [email protected]
University of Regina Campus3737 Wascana ParkwayRegina, SK Canada S4S 0A2Tel: 306 585-5460 Fax: 306 585-5461 Email: [email protected]
Outreach & TrainingUniversity of ReginaCollege Avenue CampusSecond Floor, Gallery BuildingRegina, SK Canada S4S 0A2Tel: 306 585-5777 Fax: 306 585-5780Email: [email protected]
ISSN 1923-9963
www.schoolofpublicpolicy.sk.ca
Figure 2 shows that the bulk of the suppressed information (poor response rate) is about residents of small towns and villages and those living in rural areas. Response rates on Indian Reserves were relatively good at 80%, at least in part because a) all households on Reserve (rather than the 30% sample) were surveyed and b) because the survey was done with a face-to-face interview. Response rates in cities were typically in the 70% range.
Non-Response Bias The second issue with the NHS is less visible but more problematic for researchers. Even for published data, we will be guessing about how to interpret the results and trends over time because of what statisticians call non-response bias.
Non-response bias arises when the people who do not respond to a survey have different characteristics from those who do. There is always some level of non-response in sample surveys but if the number of non-respondents is small, the resulting error is minimized. With a large number of non-respondents and a politically charged atmosphere about the census, there is little doubt that non-response bias is a major problem in the NHS. One generally expects non-respondents to be younger, male, with either very high or very low incomes, busier, less literate and less civically engaged.
The insidious nature of non-response bias is that it cannot be estimated using standard statistical techniques. We have no error estimates of the “±3% 19 out of 20 times” variety – the error from non-response bias simply cannot be quantified.
Figure 3 shows the “global non-response rate” or GNR for the NHS by province. The GNR is a blend of survey non-response and non-response for particular questions. Saskatchewan’s GNR was the third highest among the provinces and higher than both the national average and the rate in other western provinces. The non-response bias in Saskatchewan is potentially higher than in other western provinces.
Figure 4 shows that there are only minor differences in the GNR for metropolitan areas
0%
10%
20%
30%
40%
50%
60%
70%
80%
90%
100%
Cities Town/Villages Municipalities & Other Rural
Indian Reserves
Figure 2: NHS Response Rates in Western Canada, by Community Type, 2011
B.C. Alta Sask Man
% of households
33%
31%
29%
29%
28%
27%
27%
26%
26%
23%
22%
26%
0% 10% 20% 30% 40%
PEI
Nfld
Sask
NB
NS
Alta
Ont
Man
B.C.
North
Que
Canada
Figure 3: Global Non-Response Rate by Province
32%
28%
25%
24%
24%
24%
24%
23%
22%
10% 15% 20% 25% 30% 35%
Abbotsford
Kelowna
Edmonton
Saskatoon
Vancouver
Calgary
Regina
Victoria
Winnipeg
Figure 4: Global Non-Response Rates for Selected Metropolitan Areas

www.schoolofpublicpolicy.sk.ca University of Regina University of Saskatchewan
Johnson Shoyama Graduate School of Public Policy8
Perceptions and Opinions about Crime and Justice in Saskatchewan: Questions about their Relatedness
Few non-Aboriginal people see the importance of Aboriginal self-government to the future of the province. This is notable given what many non-Aboriginal Saskatchewan residents may actually see and experience in their daily lives. For example, Whitecap Dakota First Nation, located near Saskatoon and led by a university-educated chief, is prospering economically and that prosperity spills over into the non-Aboriginal population. This raised the question of why do the overwhelming majority of non-Aboriginal people in Saskatchewan fail to see a link between education, future economic contributions and Aboriginal self-government? More importantly, will this attitude hamper the development of Aboriginal self-government and impede the economic prosperity for Aboriginal communities and the province as a whole?
The fact that many Aboriginal respondents feel that immigration is too high and that their contribution to the province is minimal is difficult to explain. It is possible that some Aboriginal people perceive immigrants as potential threats to their livelihood at the same time
1 We would like to thank Trisha Keating for her research assistance. 2 Statistics Canada. 2011. Population Projections by Aboriginal Identity in Canada, 2006 to 2031. Catalogue no 91-552-X.
many immigrants may be absorbing negative views of Aboriginal people from the dominant society, fueling resentment from Aboriginal people toward immigrants. If in fact there is truth to this, what can be done to encourage better relations between Aboriginal people and immigrants? Perhaps one possible solution lies in cultural policies, as Aboriginal people support immigrants maintaining their cultural heritage.
The perception of crime and safety also raises some interesting questions. Of particular note, many police services in the province have attempted to improve relations with Aboriginal people. However, the low satisfaction rating given to policing by Aboriginal people begs the question, what are the reasons for the low rating? Is this simply a reflection of the perceived crime rate Aboriginal have or are there issues in the way the police interact with Aboriginal people?
Conclusion The Taking the Pulse data allow us to get a snapshot of the opinions held by people in Saskatchewan on various topics and identify areas for further exploration. The study suggests that Aboriginal and non-Aboriginal people hold distinct views on many issues. Some views, such as those about Aboriginal self-government and Aboriginal taxation, indicate lack of general public knowledge about Aboriginal people and the Aboriginal and treaty rights. However, other differences are due to social, cultural, political, and economic factors. Although Saskatchewan’s Aboriginal and non-Aboriginal peoples occupy the same geographical location – and as the urban populations grows will increasingly do so – both groups very much represent two solitudes.
J. Stephen Wormith, Professor, Department of Psychology and Director, Centre for Forensic Behavioural Science and Justice Studies and Myles Ferguson, PhD candidate, University of Saskatchewan
The National Justice Landscape Justice issues have been prominently represented in the federal Conservative Party’s platform and subsequent agenda. During their five years as a minority government, beginning in 2006, they introduced 61 crime-related bills (Greenspan & Doob, 2013). As a majority government, beginning in 2011, their efforts culminated in the highly publicized Omnibus Crime Bill (Bill C-10), also known as The Safe Streets and Communities Act. The Bill blended nine previously unpassed bills. It included a change to mandatory minimums for a range of drug, sex, violent, and other serious crimes, a potential doubling of sentences for the production of drugs such as marijuana, and tougher penalties for sexual offences against children. In addition, it proposed stiffer sentences for violent and repeat young offenders for serious crimes, and more rights for victims of crime to participate in parole decisions.
The government has also introduced modifications to the Youth Criminal Justice Act to make penalties more stringent for youth and to the Corrections and Conditional Release Act to make offenders more accountable. Their efforts on the crime and justice file continue apace with numerous acts (Bill C-268, C-310, C-452) to amend the Criminal Code on matters pertaining to exploitation and trafficking in persons. Most recently, the federal government has proposed legislation in Bill C-54, The Not Criminally Responsible Reform Act, to allow those who are found Not Criminally Responsible (NCR) to be declared dangerous offenders and detained indefinitely followed by periodic reviews every three years.
Commonly referred to as the “get tough on crime” agenda, the Omnibus Crime Bill, in particular, generated a considerable amount of controversy at the ideological, political, legal, and popular

9
www.schoolofpublicpolicy.sk.ca University of Regina University of Saskatchewan
Johnson Shoyama Graduate School of Public Policy
levels. Debate has been heated and inflammatory as illustrated by Public Safety Minister, Vic Towes comment in the House of Commons: “Stand with us or with the child pornographers” (National Post, 2012). On the one hand, the government has promoted public safety and victims’ rights. On the other, its detractors have cited declining crime rates, the lowest since the early 1970s (Statistics Canada, 2012), the failed punishment practices in the US (Clement, Schwarzfeld, & Thompson, 2011), and the empirical evidences supporting prevention and rehabilitative efforts, also known as the “what works” agenda (Gendreau & Andrews, 1990). Regardless, 64% of Canadians and basically the same number, 63% in the prairies, supported the crime bill in 2011 (Environics, 2011).
Periodically, but less frequently than one might expect, the discussion has turned toward public opinion and attitude about justice issues, where there is a substantial body of evidence. Thanks to Canadian criminologists, we have come to appreciate that the public is not the fear-mongering extremist as it is often portrayed (Doob, 2000; Roberts & Hough, 2005). To the contrary, Canadians present a balanced perspective about crime and criminals, particularly when we acquire more detailed information pertaining to scenarios on which we are asked to comment. Our concern is that Canadians’ perspective about crime, law, police and offenders is ignored in crafting legislation, in which case, social policy may be driven by the fear and loathing that can be generated among all of us under the right (i.e. carefully crafted) circumstances.
The Saskatchewan Context Saskatchewan presents a unique region in the country both in terms of its demographics and its crime rate. By the end of 2012, the population of Saskatchewan was estimated at nearly 1.1 million and residents lived primarily in the southern half of the province (Statistics Canada, 2012). The 2011 National Household Survey (NHS; Statistics Canada, 2011) indicated that 76% of Saskatchewan’s population was of European descent, while nearly 16% self-identified as being Aboriginal (10% First Nations and 5% Métis). Among the provinces, the incidence of Aboriginal people in Saskatchewan is second highest after Manitoba (at 17%). There were also relevant age differences. In 2011, 34 % of the Aboriginal population in Saskatchewan was
under the age of 15, compared to 17% of the total population. Thus, projections indicate that the Aboriginal proportion will grow to 32% of the provincial population by 2045 (Government of Saskatchewan, 2013). The proportion of residents who reported being a visible minority also climbed, increasing from 3.6% in 2006 to 6.3% in 2011.
While crime rates across Canada have shown a steady decline since 2004, among the provinces, those in the west continued a well-established trend of higher crime rates and crime severity compared to those in the east. For example, Saskatchewan reported the highest crime severity index (CSI) in 2011, followed by Manitoba, British Columbia, and Alberta (Statistics Canada, 2012). Among larger cities, Regina reported the highest CSI in 2011, followed by Saskatoon, Thunder Bay and Winnipeg. Supporting these crime statistics, a recent victim survey found that nearly twice as many people in Saskatchewan (13%) reported having been victimized by crime in the last six months than the national average of 7% (Environics, 2011).
Finally, the over representation of Aboriginal offenders in Canada and particularly in Saskatchewan is well established. As of February, 2013, about 4% of the Canadian population was aboriginal, while 23% of the federal inmate population was aboriginal. In the federal
Saskatchewan facilities, the Saskatchewan Penitentiary and the Regional Psychiatric Centre, 64% and 56%, respectively, of the institutional population consisted of aboriginal offenders (Office of the Correctional Investigator, 2013).
Criminal justice institutions and policies can be heavily influenced by public opinion. Consequently, measuring public opinions about criminal justice and appreciating the factors that shape the perceptions that lead to these opinions may assist in the development of new criminal justice policies and practice.
As a “kick-off” exercise for the new Social Science Research Laboratory (SSRL) at the University of Saskatchewan (see elsewhere, this issue), a province-wide survey entitled “Taking the Pulse” was undertaken in March, 2012. A total of 1750 phone interviews were completed of randomly selected residents of Saskatchewan who were 18 years of age or older. The response rate was 34.3%. Results were accurate within 2.34% 19 times out of 20. The interviews, which required about 15 minutes, focused on seven important public policy issues for Saskatchewan.
One of the topics, “crime and public safety,” included six questions. Two questions asked whether respondents believed that crime (general crime and youth crime) in their
www.schoolofpublicpolicy.sk.ca University of Regina University of Saskatchewan
Johnson Shoyama Graduate School of Public Policy10
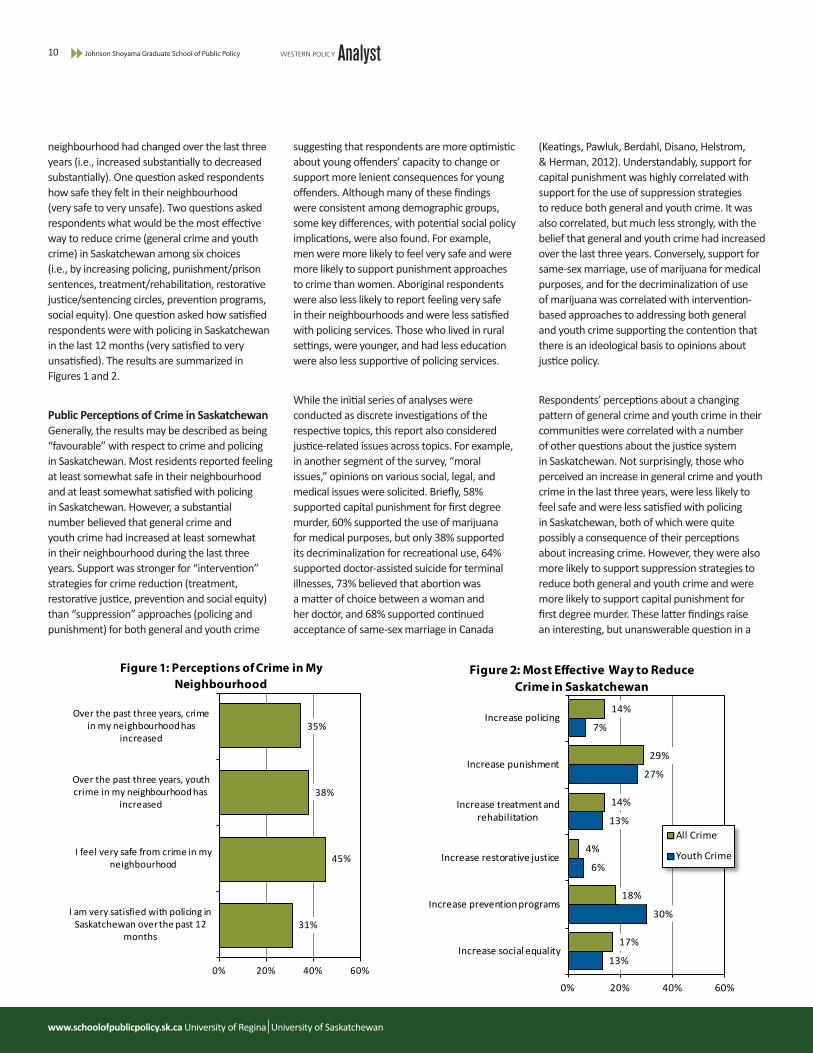
neighbourhood had changed over the last three years (i.e., increased substantially to decreased substantially). One question asked respondents how safe they felt in their neighbourhood (very safe to very unsafe). Two questions asked respondents what would be the most effective way to reduce crime (general crime and youth crime) in Saskatchewan among six choices (i.e., by increasing policing, punishment/prison sentences, treatment/rehabilitation, restorative justice/sentencing circles, prevention programs, social equity). One question asked how satisfied respondents were with policing in Saskatchewan in the last 12 months (very satisfied to very unsatisfied). The results are summarized in Figures 1 and 2.
Public Perceptions of Crime in Saskatchewan Generally, the results may be described as being “favourable” with respect to crime and policing in Saskatchewan. Most residents reported feeling at least somewhat safe in their neighbourhood and at least somewhat satisfied with policing in Saskatchewan. However, a substantial number believed that general crime and youth crime had increased at least somewhat in their neighbourhood during the last three years. Support was stronger for “intervention” strategies for crime reduction (treatment, restorative justice, prevention and social equity) than “suppression” approaches (policing and punishment) for both general and youth crime
35%
38%
45%
31%
0% 20% 40% 60%
Over the past three years, crime in my neighbourhood has
increased
Over the past three years, youth crime in my neighbourhood has
increased
I feel very safe from crime in my neighbourhood
I am very satisfied with policing in Saskatchewan over the past 12
months
Figure 1: Perceptions of Crime in My Neighbourhood
14%
29%
14%
4%
18%
17%
7%
27%
13%
6%
30%
13%
0% 20% 40% 60%
Increase policing
Increase punishment
Increase treatment and rehabilitation
Increase restorative justice
Increase prevention programs
Increase social equality
Figure 2: Most Effective Way to Reduce Crime in Saskatchewan
All Crime
Youth Crime
suggesting that respondents are more optimistic about young offenders’ capacity to change or support more lenient consequences for young offenders. Although many of these findings were consistent among demographic groups, some key differences, with potential social policy implications, were also found. For example, men were more likely to feel very safe and were more likely to support punishment approaches to crime than women. Aboriginal respondents were also less likely to report feeling very safe in their neighbourhoods and were less satisfied with policing services. Those who lived in rural settings, were younger, and had less education were also less supportive of policing services.
While the initial series of analyses were conducted as discrete investigations of the respective topics, this report also considered justice-related issues across topics. For example, in another segment of the survey, “moral issues,” opinions on various social, legal, and medical issues were solicited. Briefly, 58% supported capital punishment for first degree murder, 60% supported the use of marijuana for medical purposes, but only 38% supported its decriminalization for recreational use, 64% supported doctor-assisted suicide for terminal illnesses, 73% believed that abortion was a matter of choice between a woman and her doctor, and 68% supported continued acceptance of same-sex marriage in Canada
(Keatings, Pawluk, Berdahl, Disano, Helstrom, & Herman, 2012). Understandably, support for capital punishment was highly correlated with support for the use of suppression strategies to reduce both general and youth crime. It was also correlated, but much less strongly, with the belief that general and youth crime had increased over the last three years. Conversely, support for same-sex marriage, use of marijuana for medical purposes, and for the decriminalization of use of marijuana was correlated with intervention-based approaches to addressing both general and youth crime supporting the contention that there is an ideological basis to opinions about justice policy.
Respondents’ perceptions about a changing pattern of general crime and youth crime in their communities were correlated with a number of other questions about the justice system in Saskatchewan. Not surprisingly, those who perceived an increase in general crime and youth crime in the last three years, were less likely to feel safe and were less satisfied with policing in Saskatchewan, both of which were quite possibly a consequence of their perceptions about increasing crime. However, they were also more likely to support suppression strategies to reduce both general and youth crime and were more likely to support capital punishment for first degree murder. These latter findings raise an interesting, but unanswerable question in a

11
www.schoolofpublicpolicy.sk.ca University of Regina University of Saskatchewan
Johnson Shoyama Graduate School of Public Policy
Most residents reported feeling at least somewhat safe in their neighbourhood and at least somewhat satisfied with policing in
Saskatchewan.
cross-sectional survey: do people who hold a suppression perspective on matters of justice then perceive increasing crime, or do those who perceive increasing crime then adopt a more suppression-oriented response to crime, or do those with a more conservative ideology perceive increasing crime and simultaneously support more suppression-based approaches to it?
Possible Contributors to Perceptions of Crime Crime across North America, Canada and Saskatchewan has demonstrably decreased over the last two decades. Consequently, it is quite likely that most of those who reported increases in crime were simply wrong. Yet it is conceivable that local crime had indeed increased in some pockets of the province. This possibility is supported, but not demonstrated, by the known fact that the pattern of crime in Saskatchewan varies across a number of demographic characteristics. For example, offenders are much more likely to be male (80%), youth are overrepresented amongst offenders (25%) relative to their presence in the population (10%), the crime rate is twice as high on reserves as it is in rural and urban settings, Aboriginal people are more likely to be both perpetrators and victims of crime, and Aboriginal people are more likely to be victimized by a spouse, family member or friend (66%), while Non-aboriginal people are more likely to be victimized by an acquaintance or stranger (Statistics Canada, 2000).
Therefore, further analyses were conducted in order to examine the relationship between perceived changes in crime and other measures of justice-related attitudes and opinions, while controlling for the possibility that perceptions may be affected by real differences in terms of changing crime rates over the last three years in certain locales. To do so, demographic control measures included gender, aboriginal status, visible minority status, income level, age level, education level, and urban or rural location, each of which could have put the respondent into a local context of increasing crime. Collectively, these factors were modestly related to perceived changes in general and youth crime. For example, women and Aboriginal respondents were more likely to believe that crime had increased, while those with a higher education were more likely to believe that it had decreased.
However, many of the justice-related attitudinal, opinion and “morality” variables were still related to perceived increases in general crime as much as were the demographic measures and even more so for perceived increases in youth crime. For examples, the addition of opinion items, such as support for suppression approaches to crime and for a return to the death penalty for first degree murder and for repealing recognition of same sex marriage were incrementally related to respondent perceptions of increases in crime. Hence, these findings suggest that perceptions of changing patterns of crime are as strongly related to attitudes and opinions about crime as they are to actual exposure to crime.
Comparisons Elsewhere Although we are confident about the representativeness of the Taking the Pulse survey in Saskatchewan, the descriptive survey statistics should not be generalized outside the province. This is illustrated by the fact that the “morality” questions, which were taken from a similar study conducted in Alberta, generated both similarities and differences between neighbouring provinces, suggesting nuanced, but important differences in opinions between the two provinces (Ellis, 2011). Specifically, while a modest majority in both provinces favoured a return to capital punishment for first degree murder, 54% in Alberta and 55% in Saskatchewan, the proportion of residents in Alberta who supported women’s choice in matters of abortion (84%) was significantly higher than in Saskatchewan (70%).
Secondly, a survey called Focus Canada, which is conducted annually by the Environics Institute and includes questions about perceptions of changing crime in Canada, allowed us, with the usual caveats, to put the current survey findings in a national context. In 2011, Environics found that 46% of the respondents believed that crime
rates were increasing. This was 6 % lower than the previous year, a trend which was reported to be particularly evident in Ontario, Saskatchewan and Alberta, although provincial figures were not provided. This leads one to speculate if the trend has continued in Saskatchewan for 2012. If so, the findings suggest that the changing perspective about increasing crime rates may be due to the public’s catching up with the data (i.e. the fact that rates are truly decreasing). The Environics survey offers some hints about the persistent, although decreasing percentage of the population who believe that crime is increasing. Increasingly, respondents reported that the media overdramatize crime stories (46 %, up 9 % from the previous year). While criminal justice agencies may be reticent to report these decreasing statistics for fear of reduced allocations in their annual budget, good legislation, public policy and fiscal planning require an accurate appreciation of the facts and not distorted perceptions of them by a subset of the population.
When Environics asked respondents whether greater emphasis should be given by government on crime prevention (education, prevention programs) or law enforcement (detecting crime, punishing lawbreakers), 63% of Canadians favoured crime prevention compared to the 31% for law enforcement, the largest difference since this question was included in the Focus Canada survey. Breakdowns by province were not offered. Regardless, the concepts captured in the Taking the Pulse of Saskatchewan questions concerning strategies to control crime were very similar when collapsed into the two categories described previously. With the usual caveats in mind, it appears that Saskatchewan participants differed somewhat from the national norm when it comes to support for different kinds of strategies to fight general crime as only 53% supported intervention based approaches and 42% favoured suppression-based approaches.

Johnson Shoyama Graduate School of Public Policy12
University of Regina University of Saskatchewan www.schoolofpublicpolicy.sk.ca
The Environics survey may provide some insight into these differences. Their survey also revealed that Conservative Party members were less likely to support an emphasis on crime prevention, which is a relevant observation since 13 of the 14 current Saskatchewan members of the House of Commons are from the Conservative Party. Secondly, recall that Saskatchewan participants were more likely to have reported being victimized by a criminal act in the previous six months and, therefore, may have been more inclined to suggest more immediate strategies such as policing and punishment than long term strategies such as crime prevention. As such, the Taking the Pulse results concerning Saskatchewan residents being more likely to support the suppression (policing and punishment) approach is consistent with Saskatchewan’s profile of crime and politics.
Conclusion Generally, residents are supportive of the justice system in Saskatchewan as they feel safe and approve of policing in the province. However, there are distinct pockets of the population that are dissatisfied and appear to deserve more concerted efforts from justice and policing agencies. Although residents might be considered relatively liberal on some justice-related, moral issues, they reflect a conservative orientation on others. It is also apparent that their perceptions of crime trends and their preferred responses to it are not only related to each other, but to an array of demographic, attitudinal, ideological and personal experiential factors in a complex fashion.
Sources Clement, M., Schwarzfeld, M., and Thompson, M. (2011). The National Summit on Justice Reinvestment and Public Safety: Addressing Recidivism, Crime, and Corrections Spending (New York: Council of State Governments Justice Center, 2011). Doob, A. (2000). ‘Transforming the Punishment Environment: Understanding Public Views of what should be Accomplished at Sentencing.’ Canadian Journal Of Criminology 42(3): 323-340. Ellis, F. (2011). Albertans’ Opinion Structure on Six Policy Issues: Alberta Public Opinion Study. Citizen Society Research Lab. Lethbridge: Lethbridge College. Environics Institute. (2011). Focus Canada. 2011. Available: http://www.environicsinstitute.org/uploads/institute-projects/pdf-focuscanada-2011-final.pdf Gendreau, P., & Andrews, D.A., (1990). Tertiary prevention: What the meta-analysis of the offender treatment literature tells us about “what works”. Canadian Journal of Criminology, 32, 173-184. Government of Saskatchewan. (2013). Aboriginal peoples. Available: http://www.gov.sk.ca/Default.aspx?DN=d35c114d-b058-49db-896a-4f657f5fd66e Greenspan, E., & Doob, A. (2013). Harper’s ‘tough on crime’ is all torque. The Globe and Mail January 16, 2013. Available from: http://www.theglobeandmail.com/commentary/harpers-tough-on-crime-is-all-torque/article7367223/ Keatings, T., Pawluk, O., Berdahl, L., Disano, J., Helstrom, A., Herman, R. (2012). Taking the Pulse of Saskatchewan 2012: Moral Issues. (Saskatoon, SK: Social Sciences Research Laboratories, University of Saskatchewan. McDowell, M., Jones, K., Keatings, T., Brooks, C., Cheng, H., Olver, M., & Wormith, S. (2012). Taking the pulse of Saskatchewan 2012: Crime and Public Safety in Saskatchewan. Saskatoon, SK: Social Science Research Laboratories, University of Saskatchewan. National Post. (2012). Online surveillance bill critics are siding with ‘child pornographers’: Vic Towes. Postmedia News, February 14, 2012. Available at: http://news.nationalpost.com/2012/02/14/online-surveillance-bill-critics-are-siding-with-child-pornographers-vic-toews/ Office of the Correctional Investigator. (2013). Aboriginal offenders: A critical situation. Ottawa, Canada. Available at: http://www.oci-bec.gc.ca/cnt/rpt/oth-aut/oth-aut20121022info-eng.aspx Roberts, J. and M. Hough (2005). Understanding Public Attitudes to Criminal Justice. Berkshire, UK: Open University Press. Statistics Canada. (2000). Police-Reported Aboriginal Crime in Saskatchewan. Canadian Centre for Justice Statistics. Catalogue no. 85F0031XIE. Statistics Canada. (2011). National Household Survey. Available at: http://www12.statcan.gc.ca/nhs-enm/index-eng.cfm Statistics Canada. (2012). Quarterly demographic estimates: October to December, 2012. Available at: http://www.statcan.gc.ca/pub/91-002-x/91-002-x2012004-eng.pdf Statistics Canada. (2012). Police reported crime statistics in Canada. 2011. Available at: http://www.statcan.gc.ca/pub/85-002-x/2012001/article/11692-eng.htm?fpv=269303#a1
FOR MORE INFORMATION, VISIT WWW.SCHOOLOFPUBLICPOLIC Y.SK.CA
JSGS Leadership AnnouncedThe University of Regina and the University of Saskatchewan
have approved the re-appointment of Michael Atkinson as executive director of the JSGS for a two-year term starting
July 1, 2013. In addition to Atkinson’s appointment, the two universities have appointed Kathleen McNutt as the new
associate director of the school’s U of R campus, for a two-year term, and have re-appointed Dan Perrins as the director of
Outreach and Training until June 30, 2014.