response of potato genotypes to production sites and water
TRANSCRIPT

Response of potato genotypes to production sites and water deficit imposed
at different growth stages
By
Sizwe Goodman Mthembu
Submitted in partial fulfilment of the academic requirements for the degree of
Master of Science in Agriculture
Discipline of Crop Science
School of Agricultural, Earth and Environmental Sciences
University of KwaZulu-Natal
Pietermaritzburg
South Africa
September 2020

i
PREFACE
The research contained in this thesis was completed by the candidate while based in the
Discipline of Crop Science, School of Agricultural, Earth and Environmental Sciences of the
College of Agriculture, Engineering and Science, University of KwaZulu-Natal,
Pietermaritzburg, South Africa.
The contents of this work have not been submitted in any form to another university and,
except where the work of others is acknowledged in the text, the results reported are due to
investigations by the candidate.
Signature : ……. Date : …09/09/2020……….
Prof A.O Odindo
Supervisor
Signature: ……. Date: ……09/09/2020……….
Prof L.S Magwaza
Co-supervisor
Signature ……… Date: ……10/09/2020……….
Dr A. Mditshwa
Co-supervisor


iii
ABSTRACT
In South Africa, potato is an important food security crop widely cultivated by smallholder
farmers due to its extensive adaptation characteristics. However, drought adaptive responses
of potato genotypes vary under different environmental conditions. Potato is generally
categorized as the most sensitive crop to water deficit than other root and tuber crops.
However, there is insufficient evidence regarding adaptive responses of potato genotypes to
water deficit imposed at different growth stages. Therefore, this study sought to identify
growth stage-specific drought adaptation of selected potato genotypes for recommendation
and cultivation in targeted production sites in South Africa. The specific objectives of this
study were: (1) to determine morpho-physiological traits related to water use efficiency
among selected potato genotypes subjected to water deficit at the different growth stages; (2)
to determine the effect of water deficit imposed at different growth stages on yield
performance and tuber quality of selected potato genotypes; and (3) to investigate the effect
of different production sites/regions on growth, physiological and yield responses of potato
genotypes.
For objective 1, a glasshouse study was conducted using a 8×4×2 factorial experiment
involving the following factors: potato genotypes - 8 levels (Bikini, Challenger, Electra,
Mondial, Panamera, Sababa, Sifra, and Tyson); growth stages - 4 level (vegetative stage,
tuber initiation, tuber bulking and maturity) and watering regimes - 2 levels (Well-watered
[Ww] and Water deficit [Wd] conditions). The treatments were replicated three times to give
a total of 192 experimental units. Water deficit was imposed by withholding irrigation at the
beginning to the end of each growth stage. A highly significant (p < 0.001) interaction among
genotypes, water condition and growth stages was observed for morphological traits and
physiological responses including number of leaves and total above-ground biomass, and
photosynthetic rate (A), instantaneous water use efficiency (IWUE), transpiration rate (Tr),
chlorophyll content index (CCI), and relative water content (RWC). Potato genotypes Bikini,
Challenger and Mondial with growth-stage specific drought adaptation were identified and
recommended for water-limited environments.
The second study (objective 2) determined the effect of water deficit imposed at different
growth stages on yield performance and tuber quality of selected potato genotypes. The study
was conducted as 8×4×2 factorial experiment (See objective 1) replicated three times and
data was collected on tuber yield (TY), number of tubers (NT), tuber size distribution (TSD)

iv
and dry matter content (DMC). Results revealed a highly significant (p < 0.001) genotype x
water condition x growth stages interaction for tuber yield and dry matter content. Imposing
water deficit at the tuber initiation and tuber bulking stages resulted in significantly lower
yields, whereas drought stress at maturity stage resulted in high number of small tubers.
‘Bikini’, ‘Challenger’, ‘Mondial’ and ‘Tyson’ were identified as tolerance genotypes to water
deficit at vegetative stage, tuber initiation and maturity stage due to high yield potential and
DMC. This finding suggests that these genotypes could be suitable for processing industry
(chipping) and baking.
For objective 3, eight potato genotypes were grown across two environments namely:
Ukulinga research farm (URF) in Pietermaritzburg which characterised with semi-arid
environment and eChibini area (CB) in Bamshela with seasonal rainfall and high humidity.
The experiments were laid out using a randomised complete block design (RCBD) replicated
three times. Data was collected on morphological and physiological traits. Significant (p <
0.05) genotype x environment interaction effect was observed for studied traits at URF and
CB. Potato genotypes planted at CB had a significant (p < 0.05) lower gs and Tr resulting to
low A, than at URF. The CCI at CB compared to URF was significant (p < 0.05) higher at the
beginning and gradually decreased towards maturity while at URF was constant. Moderately
to poorly drained soils at eChibini resulted in low yields and low dry matter content. Various
genotypes with better yield and high quality were obtained at URF. This suggested that
genotypes were suitable for production in cool temperate regions with humid climate areas
like URF. The study showed that different production regions can significantly affect the
potato yield performance, suggesting URF sites as suitable environment.
Overall, the study identified potato genotypes with growth stage-specific drought tolerance
and environment specific adaptation for high yield and good quality.

v
ACKNOWLEDGEMENTS
Firstly, I would like to thank Shembe Nyazi LweZulu for giving me strength that saw me
through this master’s degree. All the praise rests in You Lord.
I would like to express my sincere gratitude to my Supervisor Dr A.O. Odindo and co-
supervisors Prof L.S. Magwaza and Dr A. Mditshwa for their financial and academic
support, persistence, incentive, eagerness and massive knowledge during my research. My
adopted supervisor’s Dr J. Mashilo for his constructive criticism and helpful suggestions on
my writing and Prof S.Z Tesfay for encouraging words.
My sincere thanks also go to Dr Duduzile Buthelezi and Mr T. Nkosi for teaching me how to
go about with the laboratory work, James “Nyan’Nyani” for offering me a place to stay
during vacation, Magwaza’s family, Simon (driving to/from eChibini), Carlos, Maphumulo,
Nqobile, Sharon, Takudzwa, Xola and my young brother Kwanele for their full support
during planting, data collection and writing. I would also like to thank FoodBev bursary for
coming on board with financial assistance.
Last but not the least; I would like to thank my parents and siblings for their unconditional
love and support. I thank God for having them.
vi
TABLE OF CONTENTS
PREFACE ................................................................................................................................................ i
DECLARATION: PLAGIARISM .......................................................................................................... ii
ABSTRACT ........................................................................................................................................... iii
ACKNOWLEDGEMENTS .................................................................................................................... v
TABLE OF CONTENTS ....................................................................................................................... vi
LIST OF FIGURES ................................................................................................................................ x
LIST OF TABLES ................................................................................................................................ xii
Chapter 1: Introduction .............................................................................................................. 1
1.1 Background ................................................................................................................................... 1
1.2 Problem statement ......................................................................................................................... 6
1.3 Justification ................................................................................................................................... 6
1.4 Aim ............................................................................................................................................... 7
1.5 The objectives of this study are to: ............................................................................................... 7
1.6 Research questions ........................................................................................................................ 7
1.7 Dissertation outline ....................................................................................................................... 8
1.8 References ..................................................................................................................................... 9
Chapter 2: Environmental factors affecting growth, yield and quality of potatoes grown under
controlled and open field environment: A review ............................................................................ 13
2.1 Abstract ....................................................................................................................................... 13
2.2 Introduction ................................................................................................................................. 14
2.3 The effects of water deficit on potato genotypes at different growth stages ............................... 17
2.3.1 Stage 1: Sprout development and the emergence ................................................................ 18
2.3.2 Stage 2: Vegetative growth .................................................................................................. 18
2.3.3 Stage 3: Tuber initiation ....................................................................................................... 19
2.3.4 Stage 4: Tuber bulking ......................................................................................................... 19
2.3.5 Stage 5: Maturity .................................................................................................................. 20
2.4 Drought and water deficit ........................................................................................................... 20

vii
2.4.1 Mechanisms of drought avoidance and tolerance ................................................................ 21
2.4.2 Mechanisms of drought escape and recovery ...................................................................... 21
2.4.3 Morphological responses to water deficit ............................................................................ 22
2.4.4 Physiological responses to water deficit .............................................................................. 22
2.4.5 Biochemical responses to water deficit ................................................................................ 23
2.5 Factors affecting tuber quality .................................................................................................... 24
2.6 Other factors affecting potato production ................................................................................... 28
2.6.1 Potato genotypes .................................................................................................................. 28
2.6.2 Agronomic factors................................................................................................................ 31
2.6.3 Cultural and management practices ..................................................................................... 32
2.7 Summary and conclusions .......................................................................................................... 39
2.8 References ................................................................................................................................... 40
Chapter 3: Drought tolerance assessment of potato (Solanum tuberosum L.) genotypes at
different growth stages based on morphological and physiological traits .................................. 55
3.1 Abstract ....................................................................................................................................... 55
3.2 Introduction ................................................................................................................................. 56
3.3 MATERIAL AND METHODS .................................................................................................. 58
3.3.1 Plant materials ...................................................................................................................... 58
3.3.2 Description of a controlled environment.............................................................................. 58
3.3.3 Experimental design and trial establishment ........................................................................ 58
3.3.4 Data collection ..................................................................................................................... 60
3.3.5 Data analysis ........................................................................................................................ 61
3.4 Results ......................................................................................................................................... 62
3.4.1 Effect of genotype, water condition and growth stages on physiological and morphological
traits............................................................................................................................................... 62
3.4.2 Physiological response of potato genotypes under well-watered and water deficit conditions
across different growth stages ....................................................................................................... 64
3.4.3 Morphological response of potato genotypes under well-watered (Ww) and water deficit
(Wd) conditions across different growth stages ............................................................................ 75
3.4.4 Correlations coefficients among morphological and physiological traits under well-watered
and water-deficit conditions across growth stages ........................................................................ 82
3.4.5 Principal component biplot analysis for assessed agronomic and physiological traits under
well-watered and water-deficit conditions across growth stages .................................................. 85

viii
3.5 Discussion ................................................................................................................................... 88
3.6 Conclusion .................................................................................................................................. 89
3.7 References ................................................................................................................................... 90
Chapter 4: The effect of water deficit on yield performance and tuber quality of different potato
genotypes .................................................................................................................................. 94
4.1 Abstract ....................................................................................................................................... 94
4.2 Introduction ................................................................................................................................. 95
4.3 MATERIAL AND METHODS .................................................................................................. 97
4.3.1 Plant materials ...................................................................................................................... 97
4.3.2 Description of a controlled environment.............................................................................. 97
4.3.3 Experimental design and trial management ......................................................................... 97
4.3.4 Data analysis ...................................................................................................................... 100
4.4 Results ....................................................................................................................................... 101
4.4.1 Effect of genotype, water condition and growth stages on total yield and tuber quality ... 101
4.4.2 Yield performance of potato genotypes under well-watered and water deficit conditions
across different growth stages ..................................................................................................... 103
4.4.3 The effect of water deficit on potato genotypes tuber size distribution and dry matter
content across different growth stages ........................................................................................ 106
4.4.4 Correlations among yield and quality traits under well-watered and water-deficit conditions
across growth stages. .................................................................................................................. 114
4.4.5 Principal component analysis for assessed quality traits under well-watered and water-
deficit conditions across growth stages. ...................................................................................... 116
4.5 Discussion ................................................................................................................................. 121
4.6 Conclusion ................................................................................................................................ 123
4.7 References ................................................................................................................................. 124
Chapter 5: The effect of production site on growth, physiological and yield responses of potato
(Solanum tuberosum L.) .......................................................................................................... 128
5.1 Abstract ..................................................................................................................................... 128
5.2 Introduction ............................................................................................................................... 129
5.3 Materials and methods .............................................................................................................. 132
5.3.1 Potato tuber description ..................................................................................................... 132
5.3.2 Site descriptions ................................................................................................................. 132

ix
5.3.3 Experimental design and agronomic practices ................................................................... 133
5.3.4 Data collection ................................................................................................................... 134
5.3.5 Data analysis ...................................................................................................................... 135
5.4 Results ....................................................................................................................................... 136
5.4.1 Emergence percentage ....................................................................................................... 136
5.4.2 Plant height ........................................................................................................................ 138
5.4.3 Stomatal conductance and transpiration rate ...................................................................... 140
5.4.4 Photosynthetic rate (A) and Chlorophyll content index (CCI) ........................................... 143
5.4.5 Potato yield ........................................................................................................................ 146
5.4.6 Number of tubers ............................................................................................................... 147
5.4.7 Dry matter content (%) ...................................................................................................... 148
5.4.8 Specific gravity .................................................................................................................. 148
5.5 Discussion and conclusion ........................................................................................................ 149
5.6 References ................................................................................................................................. 152
Chapter 6: General discussion, conclusion and recommendations for future work ................. 156
6.1 General discussion .................................................................................................................... 156
6.2 Conclusion ................................................................................................................................ 157
6.3 Recommendations and future prospects ................................................................................... 157
References ........................................................................................................................................... 159

x
LIST OF FIGURES
Figure 1.1: Potato morphological features (International Potato Center. ................................. 2
Figure 1.2: Trends of potato yield production (tonnes ha-1) and area (tons) planted in South
Africa from 2012 to 2016 . ........................................................................................................ 3
Figure 1.3: Potato production between dryland versus irrigation condition (PSA, 2017). ....... 3
Figure 2.1: Chips made from potato tubers with a high concentration of reducing sugars
(Potato South Africa, 2016). .................................................................................................... 26
Figure 2.2: The most dominating potato genotypes planted in 2016, in South Africa (van der
Merwe and van Zyl, 2016). ...................................................................................................... 28
Figure 2.3: Glassy flesh caused by the disappearance of starch after a delayed harvest in
summer (Phelan, 2018). ........................................................................................................... 35
Figure 2.4: Potato yield genotypes Capiro (CAP), Pastusa Suprema (SUP) and Esmeralda
(ESM) under c: irrigation and d: water deficit (Rodriguez et al., 2016). ................................. 37
Figure 3.1a: The effect of water deficit imposed at different growth stages on stomatal
conductance (gs) of eight potato genotypes. ............................................................................ 65
Figure 3.1b: Effect of water deficit imposed at four different growth stages on transpiration
rate (Tr) of eight potato genotypes. .......................................................................................... 66
Figure 3.2: The effect of water deficit on the rate of photosynthesis at different growth stages
of potato genotypes evaluated under well-watered and water deficit conditions. ................... 68
Figure 3.3: Effect of water deficit on the instantaneous water use efficiency (IWUE) at
different growth stages of potato genotypes tested under well-watered and water deficit
conditions. ................................................................................................................................ 70
Figure 3.4: Effect of water deficit on chlorophyll content index (CCI) of eight potato
genotypes imposed at four growth stages. ............................................................................... 72
Figure 3.5: The influence of water deficit imposed at four different growth stages on relative
water content (RWC) of eight potato genotypes. ..................................................................... 74
Figure 3.6a: The effect of water deficit on plant height of eight potato genotypes imposed at
the vegetative stage, tuber initiation, tuber bulking and maturity growth stages. ................... 76
Figure 3.6b: Effect of water deficit imposed at four different growth stages on the number of
leaves per plant of eight potato genotypes. .............................................................................. 77
Figure 3.7: Effect of water deficit on tuber yield of eight potato genotypes under well-
watered and water deficit conditions at different growth stages. ............................................. 79
Figure 3.8: The influence of water deficit on total above-ground biomass (TAG) of eight
potato genotypes imposed at the vegetative stage, tuber initiation, tuber bulking and maturity
growth stages. .......................................................................................................................... 81
Figure 3.9: Principal component bi-plot scores of PC1 vs PC2 showing groupings of potato
genotypes based on morphological and physiological traits evaluated under well-watered
(Ww) and water deficit (Wd) conditions. ................................................................................ 87
Figure 4.1a: Yield performance of eight potato genotypes under well-watered and water
deficit conditions at different growth stages. ......................................................................... 104
Figure 4.1b: The effect of water deficit imposed at different growth stages on the number of
tubers of potato genotypes. .................................................................................................... 105

xi
Figure 4.2: Effect of water deficit imposed at different growth stages on tubers dry matter
content of eight potato genotypes. ......................................................................................... 113
Figure 4.3: Principal component bi-plot scores of PC1 vs PC2 showing groupings of potato
genotypes based on quality traits evaluated under well-watered (Ww) and water deficit (Wd)
conditions.. ............................................................................................................................. 120
Figure 5.1: Effects of the interactions between genotypes and emergence days; production
sites and emergence days (p < 0.001), production sites (Ukulinga Research Farm, URF and
eChibini, CB) and genotypes (p < 0.05) after 7, 14 and 21 days of planting.. ...................... 137
Figure 5.2: The effect of different production sites (CB and URF) on tuber initiation and
tuber bulking stage on the stomatal conductance. ................................................................. 141
Figure 5.3: The effect of different production sites on potato genotypes transpiration rate
during tuber initiation and tuber bulking stage. ..................................................................... 142
Figure 5.4: The rate of photosynthesis during tuber initiation and tuber bulking stage of
potato genotypes grown at different production sites. ........................................................... 144
Figure 5.5: The influence of production sites on chlorophyll content index (CCI) during
tuber initiation and tuber bulking stage of potato genotypes grown under rainfed conditions
(CB and URF). ....................................................................................................................... 145
Figure 5.6: Effect of a different production site on the total yield of potato genotypes
obtained from CB and URF. .................................................................................................. 146
Figure 5.7: The effect of production sites on a number of tubers obtained from each genotype
produced at URF and CB. ...................................................................................................... 147
Figure 5.8: The influence of different production sites on tuber dry matter content of potato
genotypes. .............................................................................................................................. 148
Figure 5.9: The effect of production sites on the specific gravity of potato genotypes
produced at URF and CB. ...................................................................................................... 149

xii
LIST OF TABLES
Table 1.1: Raw tubers with different qualities for the processing industry ............................ 27
Table 3.1: Soil chemical composition ..................................................................................... 59
Table 3.2: Phonological development stages of potato (Solanum tuberosum L.) according to
the BBCH scale (Meier, 2001). ................................................................................................ 59
Table 3.3: Analysis of variance showing mean squares and significance test for assessed
physiological and morphological traits among eight potato genotypes tested under well-
watered and water deficit conditions at four different growth stages. ..................................... 63
Table 3.4: Pearson correlation coefficients (r) showing associations of morphological and
physiological traits of 8 selected potato genotypes under well-watered (lower diagonal) and
water deficit (upper diagonal) conditions at different growth stages. ..................................... 83
Table 4.1: Soil chemical composition ..................................................................................... 98
Table 4.2: Phonological development stages of potato (Solanum tuberosum L.) according to
the BBCH scale (Meier, 2001). ................................................................................................ 98
Table 4.3: Analysis of variance showing mean squares and significance test for evaluated
potato quality traits among eight potato genotypes tested under well-watered and water deficit
conditions at four different growth stages. ............................................................................ 102
Table 4.4a: Tuber size distribution (small, medium and large) of potato genotypes at
vegetative stage evaluated under well-watered (Ww) and water deficit (Wd) conditions. ... 107
Table 4.4b: Tuber size distribution (small, medium and large) of potato genotypes at tuber
initiation evaluated under well-watered (Ww) and water deficit (Wd) conditions. .............. 108
Table 4.4c: Tuber size distribution (small, medium and large) of potato genotypes at tuber
bulking stage evaluated under well-watered (Ww) and water deficit (Wd) conditions. ....... 110
Table 4.4d: Tuber size distribution (small, medium and large) of potato genotypes at
maturity stage evaluated under well-watered (Ww) and water deficit (Wd) conditions. ...... 111
Table 4.5: Pearson correlation coefficients (r) showing associations of quality traits of 8
selected potato genotypes under well-watered (lower diagonal) and water deficit (upper
diagonal) conditions at different growth stages. .................................................................... 115
Table 4.6: Principal component analysis showing eigenvalues and cumulative percent
variance of all measured traits of eight potato genotypes under Ww and Wd conditions at
different growth and Bi-plot. ................................................................................................. 118
Table 5.1: The description of potato genotypes used in this study. ...................................... 132
Table 5.2: Experimental site description for Ukulinga Research Farm and eChibini,
Bamshela. ............................................................................................................................... 133
Table 5.3: Different production sites (URF and CB) effect on plant height for eight potato
genotypes, the pooled data of interaction for genotypes, time and production sites showed
significant. .............................................................................................................................. 139

1
CHAPTER 1: Introduction
1.1 Background
The potato (Solanum tuberosum L.) is an annual crop species belonging to the family
Solanaceae (Malarian et al., 2014). It is a starchy vegetable crop and a good source of energy
(Malarian et al., 2014). Potato tubers containts 79 % water, 18 % carbohydrates, 2 % proteins,
1 % vitamins (Khan et al., 2018). The species is consumed globally and is a staple food crop
in many countries found in Africa, Asia, America and Europe (Obidiegwe et al., 2015). The
global production of potatoes has an estimated annual yield of 374 million tonnes, obtained
from 19.2 million hectares (Obidiegwe et al., 2015). The largest potato producing country is
China with 96.13 million tons annual production followed by India with 45.4 million tons and
Russia with 31.5 million tons (Department of Agriculture, Forestry and Fisheries DAFF,
2015). But, the African continent, Algeria (4.6 million tons), Egypt (4.3 million tons) and
South Africa (2.4 million tons) are reported as the top three largest producers and exporter of
fresh potatoes (Kesiime et al., 2016; VIB Facts Series, 2019). According to Food and
Agriculture Organization FAO, (2008 b) the crop was first introduced to South Africa by a
Dutch seafarers in the 1600s in the Cape (Western Cape) and from there it spread to the entire
country. The production of potatoes in South Africa is mainly for human consumption, fresh
market, seed potatoes and processing industry for different food products, such as chips,
frozen French fries, table stock (DAFF, 2017).
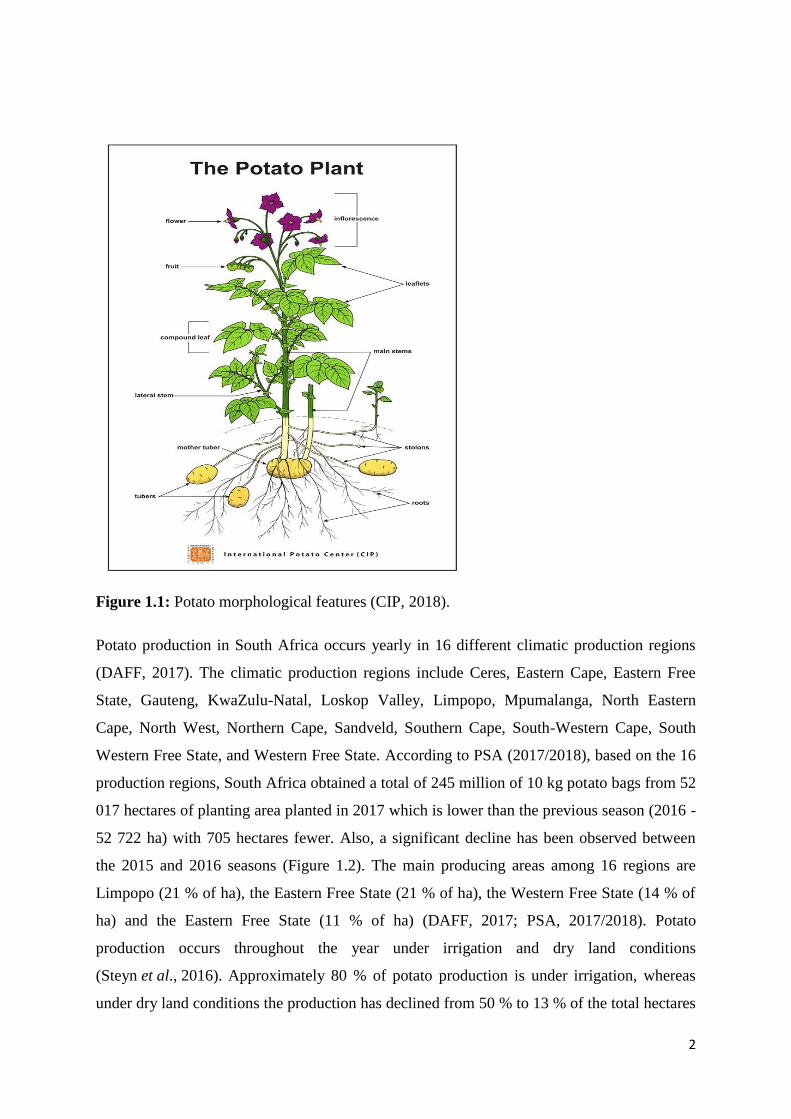
Potato is an erect, dicotyledonous herbaceous plant, which grows up to a height of one meter
with alternate and compound leaves of three to five pairs of leaflets, arranged in a prostrate
and erect forms Figure 1.1 (Horton, 1987; FAO, 2008a). The colour of inflorescence
produced varies from blue, cream, purple to white petals which emerged on the terminal
cluster which contain five sepals, five petals, five stamens and two-celled pistil. Below
inflorescence are spherical fruits, yellow-green berries (3-4 cm in diameter) formed during
tuber formation. Berries are capable of producing potato true seeds (VIB Facts Series, 2019).
True seeds can be used to plant potato, but they are still underused. Potato's mainly
propagated vegetatively using tubers and it forms fibrous root rising from the base of
sprouts/eyes. Root development is restricted to topsoil layers about 20-25 cm long. Potato
plant possesses an enlarged, starchy, underground stems known as stolons that produce tubers
that vary in shape and size (CIP, 2018).
2
Figure 1.1: Potato morphological features (CIP, 2018).
Potato production in South Africa occurs yearly in 16 different climatic production regions
(DAFF, 2017). The climatic production regions include Ceres, Eastern Cape, Eastern Free
State, Gauteng, KwaZulu-Natal, Loskop Valley, Limpopo, Mpumalanga, North Eastern
Cape, North West, Northern Cape, Sandveld, Southern Cape, South-Western Cape, South
Western Free State, and Western Free State. According to PSA (2017/2018), based on the 16
production regions, South Africa obtained a total of 245 million of 10 kg potato bags from 52
017 hectares of planting area planted in 2017 which is lower than the previous season (2016 -
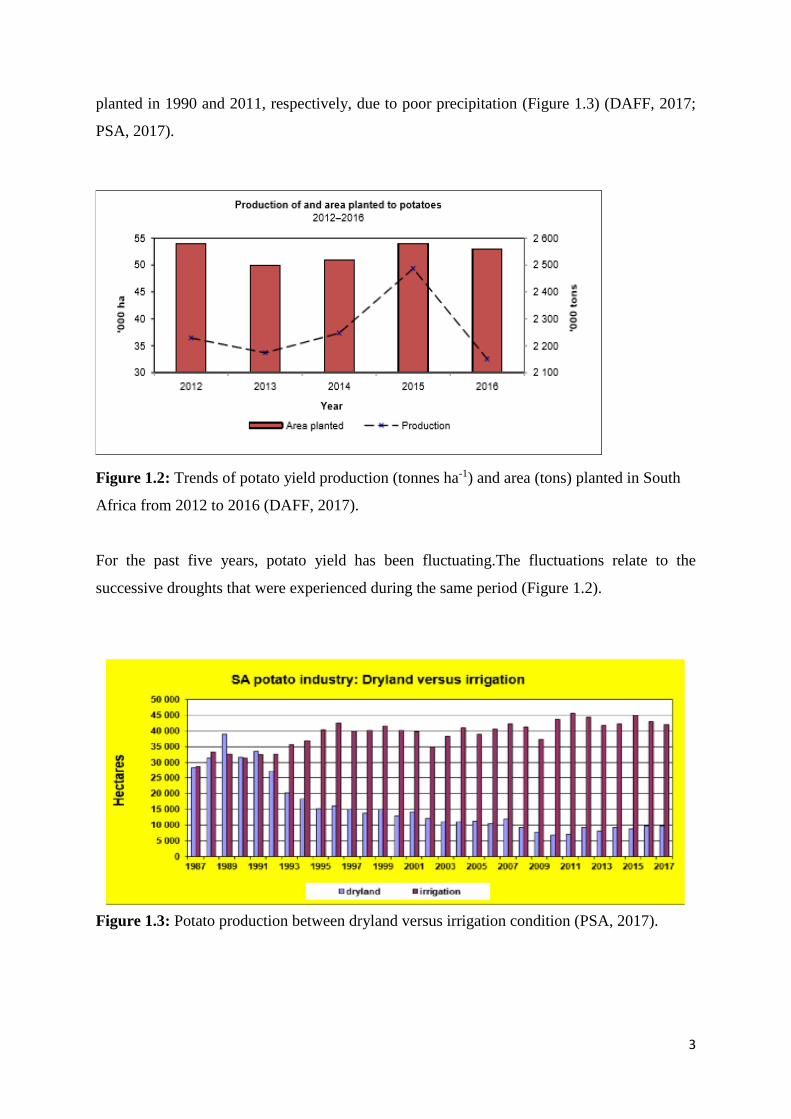
52 722 ha) with 705 hectares fewer. Also, a significant decline has been observed between
the 2015 and 2016 seasons (Figure 1.2). The main producing areas among 16 regions are
Limpopo (21 % of ha), the Eastern Free State (21 % of ha), the Western Free State (14 % of
ha) and the Eastern Free State (11 % of ha) (DAFF, 2017; PSA, 2017/2018). Potato
production occurs throughout the year under irrigation and dry land conditions
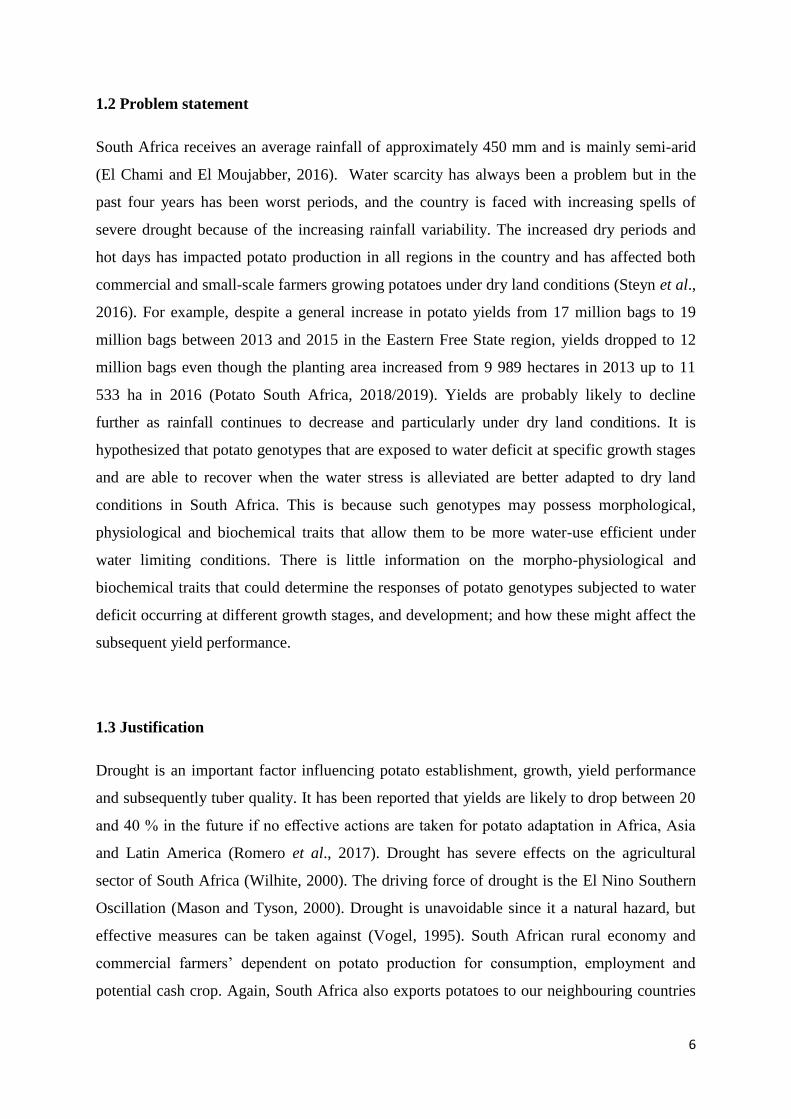
(Steyn et al., 2016). Approximately 80 % of potato production is under irrigation, whereas
under dry land conditions the production has declined from 50 % to 13 % of the total hectares
3
planted in 1990 and 2011, respectively, due to poor precipitation (Figure 1.3) (DAFF, 2017;
PSA, 2017).
Figure 1.2: Trends of potato yield production (tonnes ha-1) and area (tons) planted in South
Africa from 2012 to 2016 (DAFF, 2017).
For the past five years, potato yield has been fluctuating.The fluctuations relate to the
successive droughts that were experienced during the same period (Figure 1.2).
Figure 1.3: Potato production between dryland versus irrigation condition (PSA, 2017).

4
According to Feed the Future Kenya, (2018) potato is adapted to temperate conditions with
deep, well-drained, sandy loam soils, rich in organic matter, stoneless and frost-free soils.
The species is sensitive to arid and semiarid regions as well as harsh conditions like high and
too low temperatures (Kandil et al., 2011). Potato tolerate an optimal day temperature
ranging from 10-35° C for root growth and cool night’s temperature range from 12-18° C for
optimum growth (Nyawade et al., 2018), a soil pH of 5.0-6.5 is required for optimum growth,
lower soil pH result in poor tuber quality whereas high soil pH triggers diseases such as
common scab, blackleg and blight. Adequate fertilizer (nitrogen, phosphorus and potassium)
plays a significant role in the vegetative growth and increasing yield, especially nitrogen is a
very important element necessary for growth and production (Muhammad et al., 2015). Low
soil fertility affects potato production. Average annual rainfall of 500 to 700 mm equally
distributed during the growing period is needed for optimum growth (FAO, 2008a). Regions
where rainfall is unreliable, supplementary irrigation is required. Potato can be cultivated as a
sole crop, rotated with maize (Zea mays), wheat (Triticum aestivum) and legumes. Legumes
play a vital role in improving soil fertility by fixing nitrogen into the soil (Sanginga and
Mbabu, 2015). Crop rotation helps in reducing fertilizer input and the build-up of pests and
diseases (Naidoo, 2011).
Potato growers in South Africa are faced with several challenges in trying to improve the
yield and quality of the crop. The production of the crop is limited by environmental stress
(drought, frost at high altitudes, high temperature and evaporation) and technical approaches
(improper land preparation, improper crop rotation, selection of low yielding genotypes,
incorrect plant spacing, high plant population, poor handling at harvest and improper post-
harvest handling) (Sanginga and Mbabu, 2015). The unbearable climatic conditions such as
high temperatures and low rainfall in subtropical regions significantly hinder potato growth,
tuber yield and quality (Steyn et al., 1997; Khan et al., 2015). High temperatures and dry
conditions lead to a high evaporation rate and that increases crop water requirement and for
that reason, supplemental irrigation is recommended particularly in most sensitive stages due
to water deficiency. Water deficit is a major constraints affecting crop productivity in Africa
and worldwide (Levy et al., 2013). Elzner et al. (2018) reported that in the Czech Republic
water deficit during the vegetation stage decline potato yields. Steyn et al. (1998) found that
in South Africa potato genotypes exposed to water deficit produce low yields and poor tuber
quality.

5
The unreliable rainfall distribution and limited water resources resulting in water stress is a
major challenge on potato production in South Africa. This implies that the agricultural sector
particularly the potato industry has to use irrigation water more efficiently in the future
(Steyn et al., 1997). Therefore, it is very important to carefully consider crop water
requirements, soil type and weather conditions to ensure proper irrigation (Eid et al., 2013).
Also, potato production is limited by pests (aphids, leaf miner, and tuber moth) and diseases
(bacterial wilt, scab, early and late blight). Bacterial wilt often significantly limits tuber
production (Allemann, 2004). However, early blight and the great Irish famine have been
found as the most devastating disease in many potato production regions (Wharton and Kirk,
2007). Potato blight is characterized as irregular, light tan, circular dark brown spots on lower
leaves caused by fungus Alternaria solani. This results in an irregular and slightly sunken,
dark brown border, shapeless tubers (Wharton and Kirk, 2007).
The response of potatoes to water deficit varies among genotypes and also differs from the
timing, level, and duration of water deficit imposed (Banik et al., 2016). Mild water deficit
reduces the expansion of stems and leaves, leading to reduced, leaf area index, photosynthetic
efficiency and reduction in dry matter (Obidiegwe et al., 2015). Water deficit are closely
linked with low water potential which is known to promote abscisic acid (ABA) to
accumulation (Rodríguez-Perez et al., 2017). An increase in ABA encourages a stomatal
closure, a first and well-known response against water deficit (Obidiegwe et al., 2015).
Furthermore, studies have shown that water deficit can reduce tuber quality during tuber
initiation and tuber bulking growth stages relative to other (sprouting, vegetative growth, and
maturity) growth stages (Maralian et al., 2014; Muthoni and Kabira, 2016). Maralian et al.
(2014), found that limited irrigation negatively affects tuber yield. Muthoni and Kabira.
(2016), reported that potato genotypes “Up-to-date” as well as “Troubadour” grown under
water stress had low dry matter compared to the “Alpha” genotype grown under well-watered
conditions. Hassan et al. (2002), found that water deficit at stolonization and tuberization
showed a negative impact on the yield obtained. This shows that the response of potato
genotypes to water deficit differs among the genotypes and growth stages.
6
1.2 Problem statement
South Africa receives an average rainfall of approximately 450 mm and is mainly semi-arid
(El Chami and El Moujabber, 2016). Water scarcity has always been a problem but in the
past four years has been worst periods, and the country is faced with increasing spells of
severe drought because of the increasing rainfall variability. The increased dry periods and
hot days has impacted potato production in all regions in the country and has affected both
commercial and small-scale farmers growing potatoes under dry land conditions (Steyn et al.,
2016). For example, despite a general increase in potato yields from 17 million bags to 19
million bags between 2013 and 2015 in the Eastern Free State region, yields dropped to 12
million bags even though the planting area increased from 9 989 hectares in 2013 up to 11
533 ha in 2016 (Potato South Africa, 2018/2019). Yields are probably likely to decline
further as rainfall continues to decrease and particularly under dry land conditions. It is
hypothesized that potato genotypes that are exposed to water deficit at specific growth stages
and are able to recover when the water stress is alleviated are better adapted to dry land
conditions in South Africa. This is because such genotypes may possess morphological,
physiological and biochemical traits that allow them to be more water-use efficient under
water limiting conditions. There is little information on the morpho-physiological and
biochemical traits that could determine the responses of potato genotypes subjected to water
deficit occurring at different growth stages, and development; and how these might affect the
subsequent yield performance.
1.3 Justification
Drought is an important factor influencing potato establishment, growth, yield performance
and subsequently tuber quality. It has been reported that yields are likely to drop between 20
and 40 % in the future if no effective actions are taken for potato adaptation in Africa, Asia
and Latin America (Romero et al., 2017). Drought has severe effects on the agricultural
sector of South Africa (Wilhite, 2000). The driving force of drought is the El Nino Southern
Oscillation (Mason and Tyson, 2000). Drought is unavoidable since it a natural hazard, but
effective measures can be taken against (Vogel, 1995). South African rural economy and
commercial farmers’ dependent on potato production for consumption, employment and
potential cash crop. Again, South Africa also exports potatoes to our neighbouring countries

7
such as Angola, Botswana, Mozambique, Namibia, and Zimbabwe (DAFF, 2015). Thus, the
supply for potatoes decreases and fails to meet demand, resulting in price increases.
Therefore, it is important to gain more understanding of the relationship between genotypic
and physiological factors that may determine the effect of water deficit occurring at different
growth stages of potato growth and development based on yield performance. Variability in
the performance of genotypes might be related to growth stages that are tolerance to water
deficit (morphological, physiological and biochemical) and may account for variation in
yields.
1.4 Aim
The aim of the study is to gain a deeper understanding of genotypic, phenotypic and
physiological traits/factors that may determine the effect of water deficit occurring at
different growth stages of potato growth and development; and how these affect subsequent
biomass production and yield performance.
1.5 The objectives of this study are to:
1. Determine morpho-physiological traits related to water use efficiency among different
potato genotypes subjected to water deficit imposed at the different growth stages.
2. Determine the effect of water deficit imposed at different growth stages on yield
performance and internal tuber quality of different potato genotypes.
3. Investigate the effect of different production sites on growth, physiological and yield
responses of potato (Solanum tuberosum L.) genotypes.
1.6 Research questions
1. What are the morph-physiological traits that may be associated with water use
efficiency among potato genotypes subjected to water deficit at different growth
stages; and do genotypes differ in their response?
2. What is the effect of water deficit on potato yield performance and internal tuber
quality?
3. What is the effect of climate on potato yield performance and tuber quality grown on
different regions?
8
1.7 Dissertation outline
Chapter 1: Introduction
This chapter provides a brief overview of the current trends in potato production from global
to national scale followed by a review of the production region, adaptation, current
challenges in potato production and the response of potatoes to water deficit. The problem
statement, justification, research aim and objectives, and of the study are also outlined in this
chapter.
Chapter 2: Literature review
The chapter offers a literature review on the influence of water deficit on potato genotypes
morphology, physiology and biochemistry. It highlights recently published works and
identifies the current knowledge gap that needs to be filled, then this research intended to fill
that gap.
Chapter 3: The chapter provides a detailed report on morph-physiological traits related to
water use efficiency among different potato genotypes subjected to water deficit imposed at
the different growth stages.
Chapter 4: The chapter reports on the effect of water deficit imposed at different growth
stages on yield performance and internal tuber quality of different potato genotypes.
Chapter 5: This chapter compares the effect of different location on yield performance and
tuber quality of different potato genotypes grown in different regions.
Chapter 6: The chapter provides the experimental chapter’s discussion, general discussion
and recommendations for future research. It provides a conclusion and the contributions of
this research.

9
1.8 References
Allemann, J., Laurie, S.M., Thlart, S., Voster, H.J., 2004. Sustainable production of root and
tuber crops (potato, sweet potato, indigenous potato, cassava) in southern Africa.
South African Journal of Botany, 70(1): 60-66.
Banik, P., Zeng, W., Tai, H., Bizimungu, B., Tanino, K., 2016. Effect of drought acclimation
on drought stress resistance in potato (Solanum tuberosum L.) genotypes.
Environmental and Experimental Botany, 126: 76-89.
DAFF, [Department of Agriculture, Forestry and Fisheries]. 2015. Potatoes Production
guidelines. Compiled by Directorate Plant Production in collaboration with the ARC.
DAFF, [Department of Agriculture, Forestry and Fisheries]. 2017. Abstract of Agricultural
Statistics 2017. Compiled by Directorate Statistics and Economic Analysis.
DAFF, [Department of Agriculture, Forestry and Fisheries]. 2017. Trends in the Agricultural
Sector. Directorate Communication Services.
Eid, T.A., Ali, S.M.M., Abou-Baker, N.H., 2013. Influence of soil moisture depletion on
water requirements, yield and mineral contents of potato. Journal of Applied Sciences
Research, 9(3): 1457-1466.
El Chami, D., El Moujabber, M., 2016. Drought, climate change and sustainability of water
in agriculture: A roadmap towards the NWRS2. South African Journal of Science,
112: 9-10.
Elzner, P., Juzl, M., Kasal, P., 2018. Effect of different drip irrigation regimes on tuber and
starch yield of potatoes. Plant Soil Environment, 64: 546-550.
FAO. 2008a. The International Year of Potato 2008. The Global Crop Diversity Trust and
FAO’s Plant Production and Protection Division. Rome, Italy. www.fao.org/potato-
2008/en/potato/index.html (Accessed on 13/05/2018).
FAO. 2008b. Why potato? International Year of the Potato 2008. http://www.fao.org/potato-
2008/en/aboutiyp/index.html (Accessed on 13/05/2018).

10
Feed the Future Kenya Accelerated Value Chain Development (AVCD) project. 2018. Model
learning farm for potato producers. Guide for ware potato farmers training.
International Potato Center. Lima (Peru). 25 p.
Hassan, A.A., Sarkar, A.A., Ali, M.H., Karim, N.N., 2002. Effect of deficit irrigation at
different growth stages on the yield of potato. Pakistan Journal of Biological Sciences
5(2): 128-134.
Horton, D. E., 1987. Potatoes: Production, marketing and programs for developing countries.
Westview, 27-36.
CIP, 2018. International Potato Center. CIP Annual Report 2017. Harnessing potato and
sweetpotato’s power for food security, nutrition and climate resilience. Lima, Peru.
International Potato Center. 47 p. https://cipotato.org/crops/potato/how-potato-grows/.
(Accessed on 13/10/2019).
Kandil, A.A., Attia, A.N., Badawi, M.A., Sharief, A.E., Abido, W.A.H., 2011. Effect of
water stress and fertilization with inorganic nitrogen and organic chicken manure on
yield and yield components of potato. Australian Journal of Basic and Applied
Sciences, 5(9): 997-1005.
Kesiime, V. E., Tusiime, G., Kashaija, I. N., Edema, R., Gibson, P., Namugga, P.,
Kakuhenzire, R., 2016. Characterization and evaluation of potato genotypes (Solanum
tuberosum L) for tolerance to drought in Uganda. American Journal of Potato
Research, 93(6): 543-551. DOI 10.1007/s12230-016-9533-5.
Khan, A., Erum, S., Ghafoor, A., Riaz, N., 2018. Evaluation of potato (Solanum tuberosum
L.) genotypes for yield and phenotypic quality traits under subtropical climate.
Academia Journal of Agricultural Research, 6(4): 079-085.
Khan, M.A., Saravia, D., Munive, S., Lozano, F., Farfan, E., Eyzaguirre, R., Bonierbale, M.,
2015. Multiple QTLs linked to agro-morphological and physiological traits related to
drought tolerance in potato. Plant Molecular Biology Reporter, 33: 1286-1298.
Levy, D., Coleman, W.K., Veilleux, R.E., 2013. Adaptation of potato to water shortage:
irrigation management and enhancement of tolerance to drought and salinity.
American Journal of Potato Research, 90: 186-206.

11
Maralian, H., Nasrollahzadeh, S., Raiyi, Y., Hassanapanah, D., 2014. Responses of potato
genotypes to limited irrigation. International Journal of Agronomy and Agriculture
Research, 5(5): 13-19.
Mason, S.J., Tyson, P.D., 2000. The occurrence and predictability of droughts over Southern
Africa, in D. A. Wilhite (ed.) Drought Volume 1 A Global Assessment, Routledge,
London, 113-134.
Muhammad, N., Hussain, Z., Rahmdil, Ahmed, N., 2015. Effect of different doses of NPK
fertilizers on the growth and tuber yield of potato. Life Science International Journal,
9(1, 2, 3, & 4): 3098-3105.
Muthoni, J., Kabira, J.N., 2016. Potato production under drought conditions: Identification of
adaptive traits. International Journal of Horticulture, 6(12): 1-9.
Naidoo, M., van Rij, N., Arathoon, J., 2011. Potato Production for Kwazulu-Natal.Agri
Update.
https://www.kzndard.gov.za/images/Documents/researchandtechnologydevelopment/
publications/Research_and_Technology_Bulletins/Potato-production-for-Kwazulu-
natal.pdf (Accessed on 14/06/2018).
Nyawade, S.O., Karanja, N.N., Gachene, C.K.K., 2018. Effect of potato hilling on soil
temperature, soil moisture distribution and sediment yield on a sloping terrain. Soil
and Tillage Research, 184: 24-36.
Obidiegwu, J.E., Bryan, G.J., Jones, H.G., Prashar, A., 2015. Coping with drought: stress and
adaptive responses in potato and perspectives for improvement. Frontier in Plant
Science, 6: 542.
PSA, 2017-2018. Potato South Africa. Potato Industry Research Strategy published report.
Potato South Africa, Pretoria. RSA. http://stage.potatoes.co.za/wp-
content/uploads/2019/04/Markkommentaar-Market-Comment-Maart-2019.pdf
(Accessed on 22/09/2019).
PSA, 2018-2019. Potato South Africa. Potato Market comment March 2019.
http://stage.potatoes.co.za/wp-content/uploads/2019/04/Markkommentaar-Market-
Comment-Maart-2019.pdf . (Accessed on 22/09/2019).

12
Rodríguez-Perez, L., Nustez, C.E.L., Moreno, L.P.F., 2017. Drought stress affects
physiological parameters but not tuber yield in three Andean potato (Solanum
tuberosum L.) cultivars. Agronomía Colombiana, 35(2): 158-170.
Romero, A.P., Alarcon, A., Valbuena, R.I., Galeano, C.H., 2017. Physiological assessment of
water stress in potato using spectral information. Frontiers in Plant Science, 8:1608.
Sanginga, N., Mbabu, A., 2015. Root and Tuber Crops (Cassava, Yam, Potato and Sweet
Potato). Feeding Africa: An Action plan for African Agricultural Transformation, 16-
21.
https://www.afdb.org/fileadmin/uploads/afdb/Documents/Events/DakAgri2015/Root_
and Tuber Crops Cassava Yam Potato and Sweet Potato .pdf (Accessed on
13/09/2019).
Steyn, J.M., du Plessis, H.F., Fourie, P., 1997. Response of potato genotypes to different
water regimes. Ph.D. Thesis. University of Pretoria, South Africa.
Steyn, J.M., Du Plessis, H.F., Fourie, P., Hammes, P.S., 1998. Yield response of potato
genotypes to different soil water regimes in contrasting seasons of a subtropical
climate. Potato Research, 41: 239-254.
Steyn, J.M., Franke, A.C., van der Waals, J.E., Haverkort, A.J., 2016. Resource use
efficiencies as indicators of ecological sustainability in potato production: A South
African case study. Field Crops Research 199: 136-149.
VIB Facts Series, 2019. Potato in Africa. International Plant Biotechnology Outreach.
http://ipbo.vib-ugent.be/wp-content/uploads/2018/11/VIB_Facts-Series_Potato-in-
Africa.pdf (Accessed 29/07/2019).
Vogel, C.H., 1995. People and drought in South Africa: reaction and mitigation, in T. Binns
(ed.) People and Environment in Africa, Wiley, West Sussex, 249-256.
Wharton, P., Kirk, W., 2007. Michigan, potato diseases. Extension bulletin E-2991.
Department of Plant Pathology, Michigan State University.
Wilhite, D.A., 2000. Drought as a Natural Hazard: concepts and definitions, in D. A. Wilhite
(ed.) Drought Volume 1 A Global Assessment, Routledge, London, 3-18.

13
Chapter 2: Environmental factors affecting growth, yield and quality of potatoes grown
under controlled and open field environment: A review
2.1 Abstract
Sub-Saharan Africa region is considered one of the poorest regions worldwide due to
vulnerability to climate change which affects crop production. The production of potatoes
(Solanum tuberosum L.) in developing countries, particularly in Sub-Saharan Africa is faced
by various biotic and abiotic factors. These factors include the high occurrence of pests and
diseases, poor agronomic practices, above-average temperatures, and water deficit. Potato as
a field crop it turns to experience different environmental conditions, such as water deficit
which result in drought stress can have a considerable negative impact on potato yield and
quality. This review discusses changes occurring in potatoes morphological, physiological
and biochemical responses to water deficit and its impact on yield performance. Secondly,
the review also discusses the agronomic factors influencing potato growth, harvest and
storage. Moreover, the pre-harvest and post-harvest factors affecting the internal quality were
reviewed, to evaluate dry matter content, specific gravity, and sugar content. The main
objective is to design appropriate irrigation schedules. Currently, there are no advance
irrigation models for potato genotypes in South Africa, which can keep up with drought.
Studies have shown that tuberization is the most sensitive stage in water deficit, but findings
remain inconclusive because no study has shown or compared the response through all the
five potato growth stages, on how they respond. Therefore, a deep understanding of potato
genotypes response to drought regime at different growth stages could help in the
identification of non-sensitive growth stages where water can be withheld and still produce
optimum yields. This review focused on how we can use water efficiency and also indicated
some cultural practices that need to be considered when planting potatoes.
Keywords: Potato; genotypes; water deficit; drought mechanisms; tuber quality; yield

14
2.2 Introduction
Potato (Solanum tuberosum L.) is one of the most important starchy vegetables that is
globally cultivated and consumed (Obidiegwu et al., 2015). The species is first in the world
among the root and tuber crops followed by cassava (Manihot esculenta), sweet potato
(Ipomoea batatas), and yam (Dioscorea alata) in terms of production (Tolessa et al., 2016).
In terms of human consumption, it ranks third after rice (Oryza sativa) and wheat (Triticum
aestivum). But, among the world's food crop production, it ranks fourth after rice, wheat and
maize (Zea mays) (CIP, 2018; VIB Facts Series, 2019). The annual potato production exceeds
300 million tons from 18.6 million hectares worldwide (Tolessa et al., 2016; Shu-han et al.,
2018). In South Africa, the projected land under potato cultivation each year is just over 52
000 hectares (DAFF, 2017; PSA, 2017). Potato has multipurpose usage for both humans and
animals, for example, the raw material is used for the production of starch and alcohol
(Zaman et al., 2016). In developed countries like the Russian Federation and other countries
found in east Europe cultivate potato to fed cattle, chickens and pigs. It serves as a good
source of biological value protein compared to wheat (53 %), maize (54 %), peas (Pisum
sativum) (48 %), beans (Phaseolus vulgaris) (46 %) (FAO, 2008b; Wassu, 2017). It contains
high content of protein than root and tuber crops (Wassu, 2017). It also contains essential
compounds such as ascorbate, β-carotene, carbohydrates, dietary fibre, vitamins, cysteine-
rich polypeptides which are necessary for human health (Obidiegwe et al., 2015; van Niekerk
et al., 2016; Ngobese et al., 2017).
Although it is mostly consumed as a vegetable in many countries, other parts of African
countries such as Nigeria use potato paste as a remedy to treat skin ailments (acne, burns,
frostbite, warts) in humans. The paste is prepared by slicing or grinding raw tubers and
mixing with water, thereafter the paste is applied to ailments to release the pain (Umadevi et
al., 2013). Potato peels of some genotypes are rich in phenolic compounds compared to
onions (Allium cepa) and tomato (Solanum lycopersicum) (Akyol et al., 2016). Phenolic
compounds play a significant role in human health by protecting against pathogens and
diseases such as cancer, cardiovascular and inflammation (Saxena et al., 2012; Umadevi et
al., 2013). Potato makes a significant contribution to the gross domestic product (GDP) as it
helps to stabilize the South African economy (Steyn et al., 2016; PSA, 2017). According to
the statistics, potatoes contribute about 3 % (R4.06 billion) to the national gross value of
agriculture (PSA, 2014/2015).

15
Despite its importance and high consumption (1 506 779 tons per annum), potato production
area in South Africa has declined under dryland conditions over the past decade (DAFF,
2017). For example, the area under potato production decreased from almost 63 000 of the
total hectares planted in 1990, to 52 000 hectares in the 2016 season (PSA, 2017). Currently,
almost 80 % of the production is under irrigation conditions (DAFF, 2017; PSA, 2017). One
of the largest regions under potato production, Eastern Free State, which has a high number
of productions under dry land (8 063 ha) compared to irrigation condition (3 470 ha) was
highly affected by drought. This region (Eastern Free State) had a general increase in potato
yields from 17 million of bags to 19 million bags between 2013 and 2015, however in 2016
yields dropped to 12 million bags even though the planting area increased from 9 989
hectares in 2013 up to 11 533 ha (PSA, 2018/2019). Potato SA Industry Research. (2016/17)
reported that the number of commercial potato producers declined from 690 in 2010 to 540 in
the 2016 season. The decline is largely attributed to climate change through poor rainfall
distribution as well as above-average temperatures. The lack of skills and other necessary
inputs for optimum production could also be accounted for this decline (Sanginga and
Mbabu, 2015; VIB Facts Series, 2019).
Unlike irrigated potatoes, dryland potatoes depend on unreliable seasonal rainfall for water
supply. However, the main source of water for both (dryland and irrigated) conditions is
adequate rainfall, which has been the main problem in South Africa (Hedden and Cilliers,
2014). As the country continues to experiences minimal rain, dams are running low. The
country only receives an annual average rainfall of approximately 450 mm (El Chami and El
Moujabber, 2016). Consequently, South Africa has been categorized as a water-stressed
country by the International Water Management Institute (IWMI, 1996; WRC, 2015b). Also,
two-thirds of the country is a semi-arid region, meaning it is prone to water stress caused by
insufficient precipitation (Levy et al., 2013; Zhang et al., 2018). Agricultural sector utilizes
65 % of total average surface water and it has been linked with low water use efficiency,
particularly irrigated agriculture (Costa et al., 2007; Hedden and Cilliers, 2014). The usage of
irrigation water in agriculture increased from 57 % in 2014 to 66 % in 2015 (Hedden and
Cilliers, 2014; The Green Cape: Water Market Intelligence Report 2016).

16
The significant decline of potato production under dryland conditions as a result of drought
led to the increase of production under irrigation to meet the demand of the species (PSA,
2017). This suggests that high production under irrigation conditions means more water
supply required to attain optimum yield (Rolando et al., 2015; Muthoni and Kabira, 2016).
Several research studies have been conducted to attain skills in the irrigation of crops to
increase yield performance, efficiency and productivity. The research is still ongoing in
promoting water use efficiency by implementing deficit irrigation (Cantore et al., 2014).
Carli et al. (2014) in Central Asia found that limiting water supply after tuberization harmed
yield as well as tuber quality. Hassanpanah. (2010) conducted research in Iran and learned
that different potato genotypes responded differently on three levels of deficits irrigation. The
research reveals that under the same level of water deficit genotypes Savalan and Satina were
moderately tolerant whereas Agria, Marfona and Sante genotype susceptible to water deficit.
Steyn et al. (1998) reported that genotypes Up-to-date and Mondial produced high yield
potentials under well-watered conditions whereas under water stress conditions recorded the
low yields, in South Africa. These studies reveal that the response differs among genotypes
with the level and timing of water deficit imposed (Steyn et al., 2016). This proves that
there's a variation among potato genotypes. However, the researchers did not compare how
each stage of each genotype responds to water deficit and how does it affect yield, quality
and tuber size distribution.
With this view, it was essential to evaluate the response of potato genotypes to water deficit
imposed at different growth stages. It has been proven that potato genotypes comprise of
genetic makeup that allows them to be tolerance or susceptible to harsh conditions like
drought. Knowledge regarding the morph-physiological and biochemical response of potato
genotypes to water deficit will be therefore important in optimizing the future of potato
production. The focus is on how water deficit at different growth stages impact potato
growth, tuber yield and quality, this will assist in decision making and planning irrigation
schedules, hence improving yields.

17
2.3 The effects of water deficit on potato genotypes at different growth stages
There is a considerable amount of research that has been successfully conducted in sustaining
potato production in drought occurring areas. Rodriguez et al. (2016) found that water deficit
delays potato growth and development and subsequently reducing the yield. Saravia et al.
(2016) also observed a similar result of yield reduction and total biomass. Al-Muhmad et al.
(2014) revealed that all studied genotypes were negatively affected by different levels of
drought. Even though, there are many research has been conducted but the yields are still
declining as drought crises continue (Allemann et al., 2004; Haverkort et al., 2013; Admasu
and Tamiru 2019). Drought crises, inadequate irrigation, and extreme conditions are the
reasons for reduced and poor yield (Geofrey et al., 2014; Ramirez et al., 2015). Drought is
caused by human action, climate change and El Nino leading to prolonged dry spell (Bahta et
al., 2016). As a result, plants shows variety of physiological and biomchemical responses,
like disturbance of plant water relations due to the loss of turgor pressure and that reduces
carbon assimilation which affects photosynthesis and biomass production (Osakabe et al.,
2014). Obidiegwu et al. (2015); Rodriguez et al. (2016); Rodríguez-Pérez et al. (2017)
conducted research to determine how water deficit affects potato’s morphological,
physiological, biochemical traits and yield performance. Obidiegwu et al. (2015), reported
that drought incidence during the vegetative stage and reproductive result in yield loss.
Rodriguez et al. (2016) investigated the effects of water deficit on growth and phenology of
the three potato genotypes in Colombia. Genotypes ‘Diacol Capiro’, ‘Esmeralda’ and
‘Pastusa Suprema’ were subjected to water deficit at stem elongation, flowering and
senescence. The findings demonstrated that water deficit delayed flowering time in 'Diacol
Capiro’, while 'Esmeralda' had a decline in the development of leaves and tuber ripening and
lastly ‘Pastusa Suprema’ displayed a decline in the development of leaves and formation of
lateral shoots.
The potato growth cycle is sub-dived into five growth stages; sprout development, vegetative
growth, tuber initiation, tuber bulking and maturity (Khan et al., 2011). All these growth
stages are sensitive to water stress (Onder et al., 2005). However, the sensitivity to water
deficit varies among each growth stage (Curwen, 1994). These stages vary in their growth
duration, normally first stage (emergence) takes 20 to 30 days, second stage (the development
stage) takes 30 to 40 days, third stage (tuber initiation stage) takes 40 to 60 days, fourth stage
(tuber filling stage) takes 60 to 90 days, and lastly is maturity or leaf senescence (FAO,

18
2008a). The duration of these growth stages, when subjected to water stress, varies with
cultivars. Factors that influence potato growth and development include; air, soil
temperatures, light intensity and duration, length of growing season and humidity (Khan et
al., 2011). The most crucial time for potato crop is the period of vegetative growth and tuber
formation stages because at this point metabolic processes are at the peak (Tantowijoyo and
van de Fliert, 2006). Water deficit have a severe effect during tuber initiation and tuber
bulking due to the high rate of photosynthesis (Onder et al., 2005). The tuber is an important
part of the crop since it stores nutrients and it is the harvestable portion of the crop. The roots
and shoots transport nutrients and provide support for the crop whereas leaves play an
important role in photosynthesis (Tantowijoyo and van de Fliert, 2006).
2.3.1 Stage 1: Sprout development and the emergence
The sprouting stage begins with the development of eyes on tubers which appears as black
spots on the skin and this stage varies among genotypes. Tubers use available carbohydrates
(energy) from the seed piece to develop sprout (Tantowijoyo and van de Fliert, 2006). At this
stage during emergence, not much irrigation is required if and only if the soil water content is
kept at 65-80 % field capacity, too much water can accelerate pathogen infestation such as
blackleg and stem canker. High soil water content also causes metabolic stress in tubers
causing respiration problems (Curwen, 1994; Tantowijoyo and van de Fliert, 2006). During
the early days (15-30 DAP) of planting water, scarcity restricts roots development and delay
emergence (Obidiegwu et al., 2015).
2.3.2 Stage 2: Vegetative growth
Vegetative growth of potato is characterized by an increase in plant height, leaf number, leaf
area and formation of stolons (Tumuhimbise et al., 2009). According to Hossain et al. (2016)
when the potato crop is under water stress during the vegetative stage, the plant growth (plant
height, plant branching, the number of leaves, leaf area index, leaf size, and expansion) is
tremendously reduced. This stage takes place at 30 to 50 DAP depending on environmental
factors such as planting dates, soil temperature, and climate. The plant begins to stretch its
roots absorbing small quantities of nutrients from topsoil but it still depends on the food
reserved in the seed tuber (Tantowijoyo and van de Fliert, 2006). Therefore, at this stage soil
water content should be around 70-80 % field capacity, less than 70 % is detrimental
(Curwen, 1994). Water deficit during this stage may limit roots growth thereby
compromising the uptake of nutrients (Obidiegwu et al., 2015). On the other hand,
19
waterlogging during the vegetative period may also promote the leaching of nutrients and
increase the susceptibility of plants to diseases (Curwen, 1994).
2.3.3 Stage 3: Tuber initiation
Tuber formation takes place at 40 to 55 DAP and it takes a short period of 10-15 days, almost
two weeks forming tubers (Tantowijoyo and van de Fliert, 2006). Tuber initiation is a critical
stage for water deficit (FAO, 2009). During this stage (tuber initiation) the stolon tips develop
a hook, which then segregates and expand to form a small tuber (O’brien et al., 1998). The
initiation of tubers is a physiological change in a plant since it highly regulated by
photosynthesis (O’brien et al., 1998). Water stress and temperature conditions can cause
deformed tubers (Obidiegwu et al., 2015). During the formation and development of tubers,
water stress is more detrimental to the size distribution resulting in small tubers (Lutaladio
and Castaldi, 2009). When soil water drops below 65 % of field capacity, tuber yield and
quality is negatively affected (Geofrey et al., 2014). Therefore, soil water content of 80 to 95
% field capacity is advisable but it also varies with genotype and soil type (Curwen, 1994).
Water shortage results in limited foliage, poor tuber formation and fewer number of tubers
(Obidiegwu et al., 2015). According to Walworth and Carling. (2002), water deficit increases
the number and portion of smaller sized tubers, whereas the early-season drought stress
decreases the total number of tubers. Less than 15 °C of night temperatures are needed for
tuber initiation (FAO, 2008b). Also, tuber development is inhibited when exposed to
temperature below 10 °C and above 30 °C because they cannot withstand freezing and hot
conditions (FAO, 2008a). Water deficit can promote diseases like common scab, early blight
and late blight (Curwen, 1994).
2.3.4 Stage 4: Tuber bulking
Tuber bulking stage occurs at 50 to 80 DAP and is the longest growth stage as it can last up
to three months, but it also depends on genotype and planting date. During this stage, large
quantities of water and nutrients are needed for cell division and expansion (Tantowijoyo and
van de Fliert, 2006). The soil water content of 80 to 90 % or 90 to 95 % field capacity is
recommended but it also depends on the soil type (Curwen, 1994). Tuber bulking has the
most influence on the yield depending on the water supply (Onder et al., 2005). Late planting
and early harvest can cause a higher percentage of small-sized tubers (Khan et al., 2011). The
impact of water deficit results in small tuber size, distorted tuber shape, tarnished tubers,
limited development and accelerated leaf senescence (Obidiegwu et al., 2015). Water deficit

20
also promote brown spots (Alternaria solani and A. alternata), early dying (Verticillium and
Fusarium wilts), common scab and early blight (Curwen, 1994).
2.3.5 Stage 5: Maturity
The tuber maturity is the stage where roots and shoot growth are at maximum dry matter
accumulation, it occurs at 80 to 95 DAP, however, the best time to harvest the tubers is when
it is over 100 days old depending on the genotype (Khan et al., 2011). At this point, the
metabolic processes stop and settle (Curwen, 1994). During maturity plant leaves turn yellow
or brown, photosynthetic processes stop and leaves fall off, the tuber already sets and the skin
and hardens (Pavlista, 2002; Tantowijoyo and van de Fliert, 2006). Furthermore, a rapid
decline in the mean petiole length shoots growth is observed (Tumuhimbise et al., 2009). At
this stage, not much water is required, and the ideal soil moisture is reduced to 60 to 65 %
field capacity. Too much irrigation stimulates tuber vulnerability to water rots, pink rot and
soft rot (Curwen, 1994). Furthermore, water deficit at this stage lead to limited tuber density
and tuber size (Obidiegwu et al., 2015).
2.4 Drought and water deficit
Drought is the most devastating factor in crop production. The dry spell can be declared after
20 days, whereas drought can last for months or years (Kemiise et al., 2016). It occurs when
there is a change in atmospheric conditions resulting to the lack of sufficient soil water
content to support crop growth in the soil surface at a certain time. South Africa is a semi-arid
and arid region that characterised by the periods of dry spell (WRC, 2015a). For instance,
Bahta et al. (2016) reported that in 2015 drought crisis cost South African farmers’ losses up
to R10 million. This shows that more research is in need to describe and understand sensitive
crop's responses to water deficit as well as their mechanisms.
Potato is the most sensitive crop to drought stress compared to other major field crops such as
wheat, maize and rice (Monneveux et al., 2013). The sensitivity of the species is due to its
sparse and short root system (Amel et al., 2015; Zin El-Abedin et al., 2017). For that reason,
the crop cannot absorb water from deeper soil zones (Banik et al., 2016; Mohamed et al.,
2017). In a study conducted by Hijmans (2003) predicted that between 2040 and 2069 potato
production will decline by 18-32 % due to climate change worldwide. In another study by
Holden et al. (2003) anticipated that potato yield will decline significantly by 2055 as a
21
consequence of drought and global warming. Consequently, to improve potato yield
performance, it is essential to identify the non-sensitive growth stages where water can be
withheld and still produce optimum yields and best agronomic practices suitable for studied
genotypes. The ability to conserve water for future usage differs among genotypes. Potato
genotypes are possessed with physiological mechanisms that allow them to tolerate and
survive to water deficit during their growth (Zhang et al., 2018). These physiological
mechanisms include drought avoidance, drought escape, drought recovery, and drought
tolerance (Muthoni and Kabira, 2016).
2.4.1 Mechanisms of drought avoidance and tolerance
Drought avoidance involves morphological (roots, shoots, and leaves) and physiological traits
(stomata conductance) (Zhang et al., 2018). For example, in response to drought stress for
drought avoidance mechanisms, plants develop long roots to reach deep soil moisture while
closing stomata conductance and reducing leaf area. Therefore, the loss of plant water
through the process of transpiration is reduced (Miura and Tada, 2014; Zhang et al., 2018).
Furthermore, in saving the energy within the plant morphological changes such as plant
height, leaf number, and leaf area are reduced (Muthoni and Kabira, 2016). On the other
hand, drought tolerance performs more or less the same as avoidance, but tolerance is
achieved through physiological and biochemical mechanisms (Zhang et al., 2018). For
instance, drought tolerance mechanisms refer to the plant stability to withstand the period of
water deficit and grow to mitigate (Miura and Tada, 2014). Drought tolerant plants focus on
using water more efficiency by increases root size, extending root length and developing
water storage organs (Blum, 2005). Furthermore, the plant maintains tissue turgor using
osmotic adjustment during water stress, enabling plants to maintain growth. The adjustment
includes the production of abscisic acid in the roots (Zhang et al., 2018). This reduces the
uptake of nutrients due to the reduction of soil water also (Miura and Tada, 2014).
2.4.2 Mechanisms of drought escape and recovery
Drought escape is correlated with the occurrence of the phenological stage of the plant. Plants
that have a short period of growing, therefore, complete their life cycle before severe drought
strikes using the maximum moisture available in soil (Muthoni and Kabira, 2016). They
escape drought by hastening the development of flowers and early maturity. However, crops
can only escape drought when soil water available matches with phenological development.
22
Whereas, drought recovery refers to genotypes that show a slow growth during drought stress
and rapid growth after re-irrigation (Muthoni and Kabira, 2016).
2.4.3 Morphological responses to water deficit
Morphology refers to the growth structures such as roots, stem, leaves, flowers, and fruits. It
is an indication of plant growth and development (Kaya et al., 2006). Roots establishment is
considered an important part of the plant for the transportation of water and nutrients from
the soil to the entire plant (Geremew et al., 2007). Some plants when upper soil becomes dry
they develop short suberized to minimize water loss in plants (Lipiec et al., 2013). Drought
stress has been found to delaying the emergence of potatoes (Obidiegwe et al., 2015). Heuer
and Nadler. (1998) reported that water deficit reduces plant height in potatoes. The shortage
of water in plants disrupt the process of osmosis (water and nutrients uptake). Consequently,
wilting and shedding of leaves is observed because of the negative pressure created by low
turgor pressure (Banik et al., 2016). Negative turgor pressure in plants decreases leaf
expansion rate, leaf area index (LAI) and inhibits the development of new leaves
(Fahad et al., 2017).
In response to water deficit some plants, like aloe, increase the roots system to withstand
water deficit (Lipiec et al., 2013). Roots and shoots show an abnormal enlargement due to the
dislocation of dry matter/assimilate and cause a roots pressure (Obidiegwe et al., 2015).
Furthermore, the number of leaves and leaf size per plant and leaf longevity are reduced due
to limited water in soil (Anjum et al., 2001). Khan et al. (2001) revealed that plant height,
stem girth, leaf area of maize decreases as water stress rises. Water deficit in potato
encourage early senescence, deformed (dumb-bell shaped, bent or pointed end) tubers and
diseases like a common scab (Muthoni and Kabira, 2016).
2.4.4 Physiological responses to water deficit
Physiological responses refer to the internal response of a plant to water deficit. Water deficit
impair the plant water relations, uptake of nutrients, carbohydrates and photosynthetic
activity (Obidiegwu et al., 2015). The first response of crops to water deficit is the closing of
stomata to avoid water loss through transpiration and drying out of leaves (Hossain et al.,
2016). Relative water content (RWC) is an important indicator of water status in plant leaf
(Byrd et al., 2014; Khamssi et al., 2014). According to Muthoni and Kabira, (2016) water
deficit cause a significant decrease in RWC leading to a loss of turgor. Therefore, the cell
turgor becomes less than the wall threshold, resulting in a decline in leaf size and expansion

23
(Hossain et al., 2016). The elongation and expansion of leaves are very crucial to dry matter
production and photosynthesis (Kaya et al., 2006). For that reason, leaf gaseous exchange
(stomatal conductance, photosynthesis and transpiration rate) is negatively affected (Li et al.,
2017).
The decline in cell division is triggered by the closure of stomata and that prevents the intake
of carbon dioxide (CO2) on leaves (Mathobo et al., 2017). As a result, the concentration of
solutes increases in the cytoplasm thereby leading to the toxic cytoplasm (Muthoni and
Kabira, 2016). This results in a low rate of photosynthesis causing the imbalance of energy in
photosystem II, dehydration and shrinkage of cell volume (Obidiegwu et al., 2015; Mashilo
et al., 2017). The uptake of CO2 and carbon-fixing reactions drop significantly on the leaves
when the stomata close under drought conditions and that prevent the light-independent
reactions in producing energy (Fahad et al., 2017; Mashilo et al., 2017). The plant loses
turgor pressure if the cell membrane pulls away from the cell wall due to loss of water within
the cell, as a result, the plant wilts. If there is no photosynthesis (due to loss of turgor
pressure) it means the plant cannot grow and carry out metabolic processes properly (Lipiec
et al., 2013). This alters gene expression and decreases proteins in the leaves due to
suppressed synthesis (Fahad et al., 2017). Water deficit could lead to plant dysfunctional or
even plant death.
2.4.5 Biochemical responses to water deficit
The biochemical responses of potato to water deficit are complex (Obediegwu et al., 2015).
Water deficit activate many solutes in plant leaves including proline. Proline is a natural
amino acid produced by the plant under environmental stress condition, without enough
proline plants are vulnerable to stress. It provides strength and energy to overcome any kind
of stress in plants (Hayat et al., 2012). Proline accumulation prevents plant dehydration by
adjusting plant cell osmotic and decreases cell osmotic potential (Kelaleche et al., 2018).
Jaleel et al. (2007) stated that genotype with high proline content advocated as a stress
tolerance genotype. This entails that proline content is one of the parameters of selection for
stress tolerance in genotypes. Levy. (1983) revealed that water deficit resulted in the rise of
proline content in potato leaves of some of the genotypes studied. However, during the early
developmental stages of stress, the non-alteration of protein content was detected. This
indicates that proline content is correlated to the loss of turgor pressure in potato leaves and

24
the adjustments in osmotic potentials occurring (Levy, 1983). Turgor reduction causes
external (tuber cracks, bruise) and internal (cell wall) damages (Praeger et al., 2009).
Abscisic Acid (ABA) is another plant (hormone) defender against water deficit that produced
from the roots. ABA is transported by xylem through plant shoot to the leaves in the guard
cell and regulates stomata (Obediegwu et al., 2015). An exponential increase of ABA in the
roots results in drastically decrease of stomatal conductance (Ahmadi et al., 2010). Under
stress condition ABA take charge of plant growth by reducing transpiration rate, however,
this denies the leaves of CO2 and decrease photosynthetic carbon assimilation (Anjum et al.,
2011). This limits the leaf expansion, leaf area and leaf number of the species. It also triggers
the production of reactive oxygen species (ROS) which is a by-product of oxygen
metabolism (Hossian et al., 2016). The flow of electron capacity results in the overproduction
of ROS production in the chloroplast (Molinari et al., 2007). Water deficit, therefore, triggers
the accumulation of ROS in plants such as singlet oxygen, superoxide radical, hydroxyl
radical and hydrogen peroxide in the chloroplast (Lei et al., 2006). Reactive oxygen species
in plants serves as a second messenger and pathologic mediator. Excessive production of
ROS causes membrane injury and changes the metabolic activities of a plant (Muthoni and
Kabira, 2016).
Under normal circumstances, Adenine Tri-Phosphate (ATP) and Nitrogen Adenine Di-
Phosphate (NADPH) are generated through photosynthetic electron transport chain when
light-harvesting centers absorb sunlight and CO2 in the chloroplast. These molecules are
essential for carbohydrate production in the Calvin cycle (Dahal et al., 2019). However, in
water deficit condition regeneration of ATP and NADP is reduced as a result of limited CO2
on the leaf (Obidiegwu et al., 2015). This causes protein damage in photosystem II (Molinari
et al., 2007; Hasanuzzaman et al., 2013). Therefore, enzymes such as Ribulose-1, 5-
bisphosphate carboxylase (RuBisCO) cannot operate under the injured membrane (Lipiec et
al., 2013). The rate of transporting sucrose from source to sink is altered due to insufficient
CO2 leading to deformed tubers with uneven distribution of dry matter and low starches
(Fahad et al., 2017; Dahal et al., 2019).
2.5 Factors affecting tuber quality
Quality is influenced by pre-harvest and post-harvest events occurring during growth and
development. Such factors include agronomic practices; planting dates, fertilizer application,

25
harvesting dates, handling and storage (Solaiman et al., 2015; Bekele and Haile, 2019). Tuber
quality is the most significant parameter for the consumers and the processing industry
(Bekele and Haile, 2019). The internal quality of potato is often based on dry matter, specific
gravity, starch and reducing sugars contained. The processing industry requires a certain
percentage in terms of dry matter, specific gravity, starch and reducing sugars (Solaiman et
al., 2015). It has been noted that dry matter and specific gravity are positively correlated
(Abong et al., 2009; Steyn et al., 2009). For example, tubers with high dry matter and
specific gravity are best suited for French fries’ production (Bekele and Haile, 2019).
According to Abong et al. (2015), long growing season (120 days) genotypes have higher dry
matter content compared to short growing season (90 days) genotype (Laboski and Kellings,
2007; Solaiman et al., 2015). This suggests that potatoes harvested at or after 120 days of
planting are well developed physiologically and structurally whereas potatoes harvested at or
before 90 days of planting their cell structure still underdeveloped. For example, Kenya
genotype Tigoni harvested at 90 and 120 days had a different dry matter content of 19.66 and
22.28 % respectively (Abong et al., 2015). The recommended dry matter percentage range
from 20 to 25. 6. Below (20 %) average range of dry matter content is unacceptable because
it turns to absorb more oil (for fried chips) during frying, while above (26 %) average range
of dry matter content turn to be pale at the sliced edges (Gegov et al., 2007). The content of
specific gravity and dry matter of potato tubers vary within genotypes (Kumar et al., 2005).
The specific gravity is determined by the weight in air and weight in water (Equation 1.1). An
ideal specific gravity of 1.08 g ml- 1 or greater is accepted for processing, while low
(<1.08 g ml- 1) specific gravity, they are used for canning and boiling (Rady and Guyer, 2015;
Bekele and Haile, 2019). These authors further reported that potato tuber with low (less than
0.2 g 100 g-1) reducing sugar contents are best suited for the processing industry. The high
concentration of reducing sugars gives an undesirable brown colour to fried chips (Figure 1)
(Potato South Africa, 2016). Size distribution, shape, skin and flesh colour are among the
main physical characteristics considered in the evaluation of potato quality (Abong and
Kabira, 2011; Bekele and Haile, 2019). Various studies have shown the variation among
genotypes of dry matter content ranging from 15.83 to 27.3 g m-1 specific gravity ranging
from 1.022 to 1.130 and size distribution from small tubers (< 35 mm) to large (> 55 mm),
depending on the genotype (Table1). Therefore, ensuring a high quality of potato production,
pre-harvest and post-harvest factors that affect the quality need to be carefully considered.
𝑆𝐺 =Ms
Msw

26
Equation 1.1: Where: Ms = mass of the sample and Msw = mass of the sample in water
Figure 2.1: Chips made from potato tubers with a high concentration of reducing sugars
(PSA, 2016).

27
Table 1.1: Raw tubers with different qualities for the processing industry.
Genotypes Origin Dry matter (%) Specific gravity
(g m-1)
Size category
Sugar content in
(g 100 g-1, fmb)
reference
Small
(< 35
mm)
Medium
(35 – 55
mm)
Large
(> 55
mm)
Ajax Jordan 18.9 1.097 - - - - Ereifej et al., (1997)
Belete Ethiopia 17.50C 1.07C 10.47E 72.18B 17.35A - Bekele and Haile, (2019)
Chala Ethiopia 20.00B 1.08B 29.95C 66.39DE 3.66DE - Bekele and Haile, (2019)
Desiree Kenya 22.2 - - 50 - - Abong et al., (2009)
Degemegn Ethiopia 18.33C 1.07C 20.80D 67.85CD 11.35C - Bekele and Haile, (2019)
Gudanie Ethiopia 21.67A 1.084A 13.59E 77.443A 8.97C Bekele and Haile, (2019)
Golden Purple Kenya 20.8 1.080 - - - Fructose – 0.031 Abong and Kabira,
(2011) Glucose – 0.016
Sucrose – 0.056
Kenya Mpya Kenya 25.8 1.130 - - - Fructose – 0.023 Abong and Kabira,
(2011) Glucose – 0.018
Sucrose – 0.065
Kenya Sifa Kenya 20.88 - - - - - Abong et al., (2009)
Kenya Karibu Kenya 21.14 - - - - - Abong et al., (2009)
Mondial Jordan 17.6 1.022 - - - - Ereifej et al., (1997)
Maracharre Ethiopia 15.83D 1.06D 34.35A 60.68G 4.97D - Bekele and Haile, (2019)
Sherekea Kenya 27.3 1.090 - - - Fructose – 0.026 Abong and Kabira,
(2011) Glucose – 0.023
Sucrose – 0.055

28
2.6 Other factors affecting potato production
2.6.1 Potato genotypes
To ensure higher productivity and lower crop vulnerability to pest and diseases, it very
important to select the best genotype adapted to the location and consider the planting season.
The usage of certified seeds is recommended for both commercial and subsistence farmers
because they have a low risk of diseases and pest infection (Wilson et al., 2001; Lutaladio
and Castaldi, 2009). Seed quality of any potato genotype is regarded as a yield-reducing
factor if it not of the best quality (Haverkort and Struit, 2015). The genotypes that are mostly
used in South Africa are imported from other countries such as Netherland and Ireland
(Ngobese et al., 2017). These genotypes are grown in 16 different agronomic regions, which
guarantees a constant supply of fresh potatoes throughout the year (van Niekerk et al., 2016).
South Africa is currently registered more 80 % of genotypes with Mondial being popularly
followed by Sifra, Lanorma, and Valor genotypes dominating in terms of performance in
growth and yield (Figure 2) (Potatoes South Africa, 2016).
Figure 2.2: The most dominating potato genotypes planted in 2016, in South Africa (van der
Merwe and van Zyl, 2016).
The response of potatoes to water deficit varies among genotypes, timing and level of water
deficit imposed (Banik et al., 2016; Caliska, 2016; Fahad et al., 2017). Fahad et al. (2017)
reported that severe drought stress inhibits crop development, nutrients uptake and alters dry

29
mass content. On the other hand, Banik et al. (2016) reported that a short period of drought
stress results in a reduction of tuber production, quality tubers and eventually cause a
significant decrease in crop yield. Geofrey et al. (2014) stated that water deficit during tuber
bulking stage reduce yield and tuber quality. These results suggested that the absorption of
nutrients and the partitioning of photosynthesis products in plants rely on the type of
genotype used. Therefore, research evaluating the best performing genotypes in a different
location is vital.
2.6.1.1 Bikini
According to Irish Potato Marketing, (2017) Bikini is an early maturing multi-colored
genotype with a widespread and unique red splash. It produces a consistent yield of very
uniform tubers that are good-looking and distinctive when pre-packed. Bikini tubers are oval
with red skin colour, yellow flesh, and splash as well as shallow yellow eyes. Generally, it
has high dry matter content, also excellent for cooking quality. This genotype is good for the
chipping industry, French fried since it does not discolour after cooking. Bikini is very
sensitive to drought stress. It is resistant to common scab, powdery scab, foliage blight, rust,
tuber blight, blackleg, and wart diseases (IPM, 2017).
2.6.1.2 Challenger (Aziza x Victoria)
Challenger has broad adaptation and tubers have a medium late growth period. It produces
high, medium-size tubers. The shape of Challenger tuber is oval/long oval uniform tubers
with yellow skin as well as shallow eyes (Hettema and ZPC HZPC, 2018a). This genotype is
susceptible to spraing and foliage blight, moderate resistance to Alternaria, common scab,
tuber blight, and slightly susceptible to powdery scab. Challenger can withstand drought
stress and therefore it is a good drought tolerance genotype (HZPC, 2018a).
2.6.1.3 Electra
Electra is adaptive to a wide range of geographic regions and can tolerate harsh temperatures
such as high temperatures and water deficit. It is an early maincrop. Electra produces large
high yields, smooth bright clean yellow oval tubers with faint pink eye. This genotype is
slightly susceptible to late blight (Phytophthora infestans) on leaves as well as on tubers.
However, it is resistant to common scab, powdery scab, foliage blight, tuber blight, blackleg,
wart disease and soil-borne diseases (IPM, 2015).

30
2.6.1.4 Mondial
Mondial is one of the most popular and planted genotypes in all production regions of South
Africa. It originated from the Netherlands and can be grown in all soil types as it is well-
adaptive, and they have a good tolerance of drought stress (HZPC, 2018c). Extreme
conditions such as heat and water strain result in a large number of deformed tubers
experienced during tuber initiation. The plant produces pure white flowers, grows quick and
strong in an upright orientation to medium 90 - 110 days from emergence until the death of
natural foliage (ANSA, 2008). Mondial is likely to produce high yield when it grows during
late spring, summer and early winter season. Mondial tubers size range from medium to large
and long oval cylindrical tuber shape with shallow eyes (Aartappel Netwerk Suid-Afrika
ANSA, 2008; HZPC, 2018c). They produce a high yield of big tubers with bright attractive,
yellow skin colour and light-yellow flesh colour (HZPC, 2018c). Usually, Mondial has good
dry matter content and specific gravity, however not suitable for the processing industry
because of low density (ANSA, 2008). This genotype is susceptible to common scab and
slightly susceptible to foliage blight, tuber blight and powdery scab (HZPC, 2018c). It also
highly susceptible to late blight and fusarium-wilt (ANSA, 2008).
2.6.1.5 Sababa
Sababa is a newly introduced genotype, therefore there is currently no scientific information
available.
2.6.1.6 Sifra (Mondial x Robinta)
Sifra originated from the Netherlands, which can be grown in all types of soil and produce
high yield (HZPC, 2016; 2018d). The plants grow higher with erect, tall stems and provide
vigorous ground-covering foliage. Sifra produces a round, oval-shaped tuber with bright
white smooth skin, medium-deep eyes and white flesh. They are classified as late maturing
genotype which can be used for any purpose (HZPC, 2016). Sifra is susceptible to powdery
scab, slightly susceptible to common scab, Alternaria and foliage blight also resistance to
tuber bight and golden nematodes. This genotype has a low nitrogen requirement but it very
sensitive to water deficit (HZPC, 2018d).
2.6.1.7 Panamera
Panamera has a very low nitrogen requirement and can be grown in all types of soil except
those with a risk of diseases like a powdery scab. This genotype produces a great yield of big

31
tubers under favourable conditions (HZPC, 2018b). Panamera tubers are oval, with yellow
skin colour as well as shallow eyes. It is slightly susceptible to foliage blight, tuber blight,
and powdery scab. Furthermore, it is resistant to common scab (HZPC, 2018b).
2.6.1.8 Tyson (Sylvana x Cyrano)
Tyson is an early bulking table potato for the wholesale fresh markets in Europe and
southwest Asia (Set Holland, 2018). The growth pattern of Tyson is medium maturing, with
an early tuberisation. It also produces a high number of bigger tubers per plant with round
oval shape, cream skin and cream flesh colour with shallow eyes. They have moderate dry
matter and specific gravity (Set Holland, 2018). Tyson is resistance to cyst nematodes, wart
diseases but susceptible to foliage blight (Phytophthora infestans). This genotype is good for
the baker market (Set Holland, 2018).
2.6.2 Agronomic factors
Agronomic factors such as soil type, pH, soil composition and crop rotation or past use of the
soil as well as exposure to pests and diseases affect the potato yield and quality of tubers
(Khan et al., 2011). Potato plants adapt in a wide range of climatic conditions, however
temperate climate is advised for optimal growth (Haverkort and Struit, 2015). It can be also
produced in a wide variety of soils, but the most suitable is loose loamy, loamy and sandy
loam soils that have good drainage, aeration and rich in organic matter (FAO, 2008a). The
largest production in the country comes from regions that are highly dominated with loam,
and sandy loam soils and those regions are found in Limpopo, Eastern and Western Free
State (Steyn et al., 2016). Likely, South African soil types also vary with regions of
production from loam, loam-clay loam, sand, sandy and sandy loam (Steyn et al., 2016).
Monitoring soil pH in both controlled and open field environments is essential for optimum
growth to avoid the acidity and alkalinity of the soil. A high concentration of pH affects the
uptake of nutrients by the plant from the soil. For potato production, slightly acidic soils in
the range of pH 5.0 to 6.0 are important for growth (FAO, 2018). At high soil pH (>7) the
crop becomes more susceptible to pests and diseases such as common scab while low pH
(<5) leads to leaching of nutrients and subsequently reduces the yield (Waterer, 2002;
McCauley et al., 2017). Soil aeration is vital for gaseous exchange in potatoes during growth
because soil compaction often limits tuber expansion (Lutaladio and Castaldi, 2009). Planting

32
potatoes in the same field over a long period leads to the accumulation of nematodes and
diseases. Studies have shown that rotating potatoes with dry beans, maize or wheat reduces
the risk of diseases and ensures health benefits and yields (Naidoo et al., 2011; Saravia et al.,
2016). Maintaining required soil moisture all the time is important because it improves tuber
size and yield (Tolessa et al., 2016). Extreme temperatures or deficient moisture during tuber
formation especially in the late spring and early summer reduces yield. Therefore, optimum
soil temperature for the tuber development range between 15 ºC and 18 °C (FAO, 2018).
Agronomic factors need to be fully considered when one planning to grow crops because they
determine the yield and quality to be obtained.
2.6.3 Cultural and management practices
2.8.1 Potato Spacing
Plant spacing is one of the most important cultural practices affecting potato growth and
yield. The growth, yield, size, and quality are always influenced by how far apart or close
potato seeds/tubers were spaced in the field during planting (Mangani et al., 2015).
Getachew et al. (2012) conducted a study comparing the effect of different spacing (10, 20,
30 and 40 cm) in yield and number of tubers. The results reveal that potato plants with wider
intra-row spacing (40 and 30 cm) had the highest number of tubers but lowest yield whereas
plants with closer intra-row spacing (20 and 10 cm) scored the lowest number of tubers yet
high yield. The study conducted by Razaq et al. (2015) also found that the highest number of
tubers was recorded on wider intra-row spacing (35 and 25 cm) whereas the lowest tuber
number was found at closer intra-row spacing (15 cm). Arega et al. (2018) reported similar
results where a high number of tubers were obtained at 30 cm intra-row spacing but fewer in
20 cm and 40 cm which is wider. This tells us that the wider the intra-row spacing the higher
the number of tubers per plant. Furthermore, Razaq et al. (2015) found that the highest
number of small tubers was obtained on closer spacing (10 cm) while the highest larger
tubers were recorded on wider spacing (40 cm). Considering plant spacing is essential for the
plant uptake of nutrients and radiation.
The competition of plant resources is minimized on wider intra-row spacing. Lack of
information on plant spacing could go as far as interfering with internal quality (biomass
accumulation, dry matter, and specific gravity) (Getachew et al., 2012; Mangani et al., 2015).
For example, Getachew et al. (2013) found that the highest dry matter content of 21. 53 %
was observed on plants with a wider intra-row spacing of 30 cm, on the other hand, the
lowest dry matter of 19. 57 % was obtained at 10 cm intra-row spacing. Similarly, on the

33
specific gravity, the highest (1.082) was recorded on wider-spacing and lowest (1.072) was
obtained in closer plant intra-row spacing. Overcrowding plants increases competition among
the plants reduces the amount of nutrients uptake, water and light received by the plants
resulting in reduced photosynthesis, transpiration. Plant density is one of the most important
cultural practices affecting potato yield that need to be considered because ignoring plant
density or crowding plants triggers the accumulation of pest and diseases (Fiers et al., 2012).
Therefore, it is advisable to use low plant density only when producing for the market that
considers tuber size while high plant density for the market with no size restriction of tubers.
However, in most cases, the size distribution for potatoes remain the main factor in price
determination.
2.8.2 Weed control and earthing-up
Weeding should be done properly to reduce nutrients competition. Usually, deep cultivation
is not recommended for potato because it damages roots and tubers. Proper earthing-up
creates favorable conditions for tuber initiation and development and eventually increases
yield (Getachew et al., 2013). Tafi et al. (2010) reported that first earthing-up should be done
when plants reach a height of 10 cm and this could be repeated twice every after two-three
weeks. Earthing-up ensures plant stability, increases underground stolons that will produce
tubers (Tafi et al., 2010; Getachew et al., 2013). Getachew et al. (2012) conducted a study on
the influence of early and late earthing-up on potato yield and found that early earthing-up
(after 15 days of planting) results in high yield and a high number of tubers than late
earthing-up (after 30 and 40 days of the plantation). Therefore, early weeding and ridging
improves yield and number of tubers produced per plant.
2.8.3 Pest and diseases
Pests and diseases are another main limiting factors of potato production (FAO, 2008b).
Unbearable environmental conditions cause a high risk of diseases and pest infestation (Steyn
et al., 2016). Pests such as the beetle, tuber moth, leaf miner fly and diseases such as early
blight, late blight, bacterial wilt, blackleg, viruses decrease the yield and lead to crop death
(Tantowijoyo and van de Fliert, 2006; FAO, 2008b). Early blight (caused by Alternaria
solani) and late blight (caused by Phytophthora infestans) are the most serious diseases
worldwide that have a devastating effect on potato production (FAO, 2008a). Beetles
(Leptinotarsa decemlineata) and leaf miner fly (Liriomyza huidobrensis) are serious pests
with strong resistance to insecticides as they destroy leaves, shoots and eventual the entire

34
crop. Late blight is characterized by brown spots on the leaves with brown patches and some
yellowish. Once the blight spores washed down by rain or irrigation it reaches the soil and
starts ruining tubers and from there it destroys the entire plant (Curwen, 1994). Early blight is
noted by an irregular series of dark and light tan concentric rings, as a result of this,
discoloured irregular tubers are produced and can cause major yield reductions (Curwen,
1994; FAO, 2008a). It is always advisable to control pests and diseases as early as possible to
avoid crop losses.
2.8.4 Harvesting and storage conditions
Harvesting potatoes at the maturity stage (after the foliage has died back) requires full
attention to avoid bruising, skinning and mechanical damage. Physically damaged tubers are
prone to diseases, rotting and are rejected by consumers. Moreover, inappropriate harvesting
reduces tuber quantity and quality, therefore it is important to handle tubers with care
(Pandey et al., 2017). Delaying harvesting particularly in summer can cause tubers to become
glassy (Figure 3) which not good for the market. After harvesting is also important to wash
them and group into size and grading according to the market.
When potatoes reach physiological maturity, tubers stay dormant up until they are stored at a
particular storage temperature based on the final usage. Tuber dormancy is governed by both
exogenous and endogenous factors (Alamar et al., 2017). The period of dormancy ranges
from one month to over three months, but it differs from genotypes (Freitas et al., 2012;
Alamar et al., 2017). After this period, the quality of tubers changes based on storage
conditions (Heltoft et al., 2017). The storage conditions and duration of potatoes after harvest
are very crucial because they contribute to the chemical composition (Chemeda et al., 2014;
Heltoft et al., 2017). Even if potatoes are to be marketed as seed, fresh potato or for the
processing industry, storage temperature and duration remain vital parameters. Storing
potatoes at a very high or low temperature over some time could lead to a vast variability in
quality. For example, high temperature as 26.7 oC or above triggers the spread of disease and
encourage sprouting while low temperatures 10 oC or below leads to soft rot, black spot and
accelerates conversion of starch into fructose and glucose (Voss et al., n.d; Freitas et al.,
2012; Khanal et al., 2014). Again, low storage temperatures lower the sprouting process and
respiration rate (Freitas et al., 2012; Alamar et al., 2017). Potato reducing sugars also
decrease when stored at low temperatures and that negatively affects the chipping industry

35
(Kumar et al., 2004; Heltoft et al., 2017). Nevertheless, the level of reducing sugars varies
among genotypes and with maturity (Kumar et al., 2004; Khanal et al., 2014). This
articulates that, each genotype is genetically unique and requires specific storage conditions
that would keep the internal quality unchanged. Understanding the storage temperature
requirements for each genotype would help in storing potatoes in a conducive temperature
that will not accelerate the convention of sugars which will result in rejected by the chipping
industry if it to be market for the processing industry.
Figure 2.3: Glassy flesh caused by the disappearance of starch after a delayed harvest in
summer (Phelan, 2018).
2.8.5 Effect of fertilizer on potato growth
It is always advisable to take into consideration the soil status before applying fertilizer to
avoid insufficient or excess application. The roots system plays a vital role in the absorption
of nutrients, however, it can only uptake mobile fertilizer that is well dissolved in a solution
(Barber, 1995; Stubbs, 2016). The elements that are essential for plant growth and
development are categorized into basic nutrients (carbon (C), hydrogen (H) and oxygen (O)),
primary macronutrients (nitrogen (N), phosphorus (P) and potassium (K)), secondary
macronutrients (magnesium (Mg), calcium (Ca) and sulphur (S)) and lastly micronutrients
(iron (Fe), zinc (Zn), manganese (Mn) and boron (B)) (Stubbs, 2016). Plants require basic
nutrients like carbon dioxide (CO2), light, water (H2O) and they are needed in large amounts
to build larger organic molecules of the cells. Even though micronutrients are needed in small
quantities they do play an essential role like activating various enzymes, depending on the
crop growth stage (Tavakoli et al., 2014). For example, Mn plays role in leaves by activating
carboxylation, carbohydrates metabolism, phosphorus reactions and oxidation reactions
(Tavakoli et al., 2014). However, potato requires macronutrients (N, P, and K) in large

36
quantities for plant growth and development to produce optimum yield (Suh et al., 2015;
Kahsay, 2019).
Nitrogen is an essential nutrient required for plant growth especially during vegetative growth
and it facilitates photosynthesis, whereas phosphorus stimulates root growth, improves plant
shoot and increases flower formation. Likewise, potassium is one of the most important
nutrients regulating various physiological processes (protein synthesis, role in photosynthesis,
translocation of sugars) (Muhammad et al., 2015). Kandil et al. (2011) stated that nitrogen
fertilizer is an important element for the high number of tubers and quality. Furthermore,
insufficient supply of nitrogen fertilizer decreases dry matter content and specific gravity. It
also plays an important role during the vegetative stage and tuberization of potatoes
(Adhikari et al., 2009). Kandil et al. (2011) stated that N fertilizer increases the plant height,
leaf number, tuber weight per plant and average tuber. A constant supply of nitrogen and
water guarantees high yield performance and tuber quality (Saravia et al., 2016). Rosen et al.
(2014) pointed out that phosphorus fertilizer plays a vital role in cell division, photosynthesis,
and respiration which eventually influence plant metabolism. Phosphorus goes as far as
speeding up the cell division rate and by doing that it accelerates plant maturity. Generally, P
fertilizer is more involved in physiological and biochemical mechanisms. Razoq et al. (2015)
reported that potato requires a sufficient amount of potassium more than any other vegetable
because of its significant role in regulating guard cells in stomata, ensuring plant stability and
increasing tuber size and quality. It is important to understand soil status and proper fertilizer
rate required is very important to enhance crop vigor and yield.
2.8.6 Irrigation
Water accounts for more than 80 % of plant growth tissues (Ati et al., 2012). It is considered
a scarce resource in several parts of the world particularly in arid and semi-arid areas (Kandil
et al., 2011). In agriculture, several irrigation systems have been successfully used for potato
production which includes, drip irrigation, furrow, and overhead sprinkler irrigation system.
The drip irrigation system has been widely used particularly in the greenhouse and tunnels
production. Even though it has some higher cost for installation it’s known as a good water-
saving system while increases yield and tuber quality and reducing the chances of disease
infestation (Onder et al., 2005). Irrigation in potatoes is an important factor required for
optimum growth, transpiration and metabolic processes (Sarani et al., 2014). It plays a

37
significant role in the yield and quality of the crop. However, the amount of irrigation
required depends on soil type or growth media, climatic condition, genotype, and growth
stage (Khanna-Chopra and Singh, 2011). For example, hot conditions with dry soils require a
high amount of water because of the high evaporation rate (Steyn et al., 1997). Adequate and
consistence supply of water ensures high yield performance and quality tubers (Saravia et al.,
2016).
Excessive irrigation or inadequate irrigation has an adverse impact on crop development and
tuber quality. Excessive irrigation results in leaching of nutrients, disease vulnerability,
erosion whereas under irrigation delays normal crop growth, decreases yield, while the crops
become more vulnerable to diseases. Furthermore, the shortage of water reduces the
photosynthesis rate and absorption of plant nutrients (Obidiegwu et al., 2015). A minimum of
500 to 700 mm of water is recommended for long growing season genotypes (120-150) to
optimum yield (FAO, 2008b). Some genotypes cannot undergo physiological changes
through natural rainfall only, they also require supplemental irrigation to enhance yields (Xie
et al., 2012). FAO. (2008a) reported that 50 % of soil water is not sufficient enough to meet
the crop demand for the growing period because it leads to lower yields. Badr et al. (2012)
found that under four irrigation treatments 40 %, 60 %, 80 % and 100 % the highest yield was
obtained under full water irrigation (100 % and 80 %), while 40 % and 60 % irrigation had a
significantly low yield. Rodriguez et al. (2016) found that tuber yield per plant was reduced
by 15.45 % for genotype Pastusa Suprema (SUP) d, 16.68 % for genotype Capiro (CAP) d
and 19.46 % for Esmeralda (ESM) d due to water deficit (Figure 4). Variation within
genotypes was observed.
Figure 2.4: Potato yield genotypes Capiro (CAP), Pastusa Suprema (SUP) and Esmeralda
(ESM) under c: irrigation and d: water deficit (Rodriguez et al., 2016).

38
Potato can be grown in both conditions open field and controlled environment, but the crop is
mainly grown on the open field global. There is no much work that has been done on potato
production under a controlled environment (tunnels, greenhouse and shades) in South Africa.
However, in other parts of the world, there is information. A study conducted in Turkey by
Ayas (2013) illustrated that low water supply in potato production under unheated
greenhouse significantly affects plant height, yield, and a number of tubers per plant,
diameter, weight, dry matter and starch matter. In a similar study in Japan, it was revealed
that different water regimes increased potato plant height, shoot and biomass with an increase
of the amount of irrigation water but specific leaf weight declined (Yuan et al., 2013). Both
studies suggested the importance of maintaining irrigation using a pan evaporation factor
above 0.75 (K > 0.75) as a guideline because lower factors could negatively affect potato
yield (Yuan et al., 2013). Alsharari et al., (2007) evaluated drought tolerance of different
potato genotypes under greenhouse conditions. They reported that most genotypes were
highly affected during the vegetative stage, consequently, it decreased tuber yield as water
stress increased. Therefore, looking at the tuber yield and number produced in relation to
days after treatment and irrigation regimes, drought tolerance and drought-sensitive
genotypes were identified. Such information could be useful in addressing the issue of the
ongoing drought problem in South Africa.
2.8.7 Water use efficiency
Water use efficiency is defined as the yield of marketable crop produced per unit of water
used in evapotranspiration (Boutraa, 2010; Badr et al., 2012). Hussain et al. 2015 reported
that water use efficiency focuses on the total yield produced over water used to produce that
yield. It also involves the loss of water from the soil surface and crop through the
evapotranspiration process (De Pascale et al., 2011). This is a parameter used to measure how
crops use water applied during the growing season. The concept involves the capacity of the
soil to store water and the crop's ability to access stored water in soil pores and then after the
crop's ability to go through metabolic processes, conversion until biomass or yield produced
(Masango, 2014). Water use efficiency aimed to improve crop yield and quality at low water
supply (Boutraa, 2010). Therefore, it is important to understand the soil or environment and
crop to be used its water status. Fereres and Soriano. (2006) stated that applying water below
the evapotranspiration requirements is described as deficit irrigation, and that reduces crop
production. On the other hand, deficits irrigation may beneficially improve water use

39
efficiency by crop when imposed to less sensitive growth stages (i.e. late vegetative and late
tuber bulking) (De Pascale et al., 2011; Begum et al., 2018).
The majority of the plant's physiological processes depend on water supply for adequate
growth. Water deficit may inhibit either of the physiological processes such as
photosynthesis, transpiration, enzymatic activities and cell enlargement (Aliche et al., 2018).
Even though potato is known as water use efficiency compared to cereal crops, but it is
sensitive to water scarcity (Birch et al., 2012; Daryanto et al., 2016). Badr et al. (2012)
conducted research looking at how different irrigation levels (100, 80, 60 and 40 %) affects
yield and results reveal that the highest tuber yield obtained under full irrigation (100 and 80
%) and reduced as irrigation decreases. Scheduling irrigation based on soil and crop
requirement remains vital for the potato crop. This can be attained by estimating soil moisture
using relevant instruments such as HS2 HydroSense II, neuron probes and tensiometer.
Moreover, improving water use efficiency can be done through the correct selection of
specific genotype, planting date as well as a specific location.
2.7 Summary and conclusions
The short durations and uneven distribution of precipitation which is related to prolonged dry
periods result in complete yield loss. This has been demonstrated for the past decades where
potato production has declined significantly due to climatic extremes. Yet, there is a high
demand for potatoes of high quality for processing and other different usages. Potato
genotypes require careful management to guarantee optimal tuber development since tubers
are sensitive to water deficit throughout the growing season. Also, poor post-harvest handling
practices can compromise quality if not fully considered. The current literature review has
revealed that reducing water at certain growth stages of potato has an impact on the growth,
yield and quality, but, there is little information on the responses of different potato
genotypes to water deficit at critical stages of growth and development. Secondly, we do not
know for how long and by how much we can impose water deficit and which stages are most
sensitive to water deficit and third we need to describe the variability among current potato
genotypes in relation to the imposition of water deficit, the recovery process and effect on
yield performance.
40
2.8 References
Abong, G.O., Okoth, M.W., Karuri, E.G., Kabira, J.N., Mathooko, F.M., 2009. Influence of
potato cultivar and stage of maturity on the oil content of French fries (chips) made
from eight Kenyan potato cultivars. African Journal of Food, Agriculture, Nutrition
and Development, 9(8): 1667-1682.
Adhikari, R.C., 2009. Effect of NPK on vegetative growth and yield of desiree and kufri
sindhuri potato. Nepal Agriculture Research Journal, 9: 67-75.
Admasu, R., Tamiru, Z., 2019. Effect of deficit irrigation on common bean (Phaseolus
vulgaris L.) under conventional, fixed and alternate furrow irrigation systems at West
Wellega, Ethiopia. Journal of Natural Sciences Research, 9(1): 31-36.
Ahmad, S.H., Andersen, M.N., Plaugorg, F., Poulsen, R.T., Jensen, C.R., Sepaskhan, A.R.,
Hansen, S., 2010. Effect of irrigation strategies and soils on field grown potatoes:
Yield and water productivity Agricultural. Agricultural Water Management, 97: 1923-
1930.
Ahmadi, S.H., Andersen, M.N., Plauborg, F., Poulsen, R.T., Jensen, C.R., Sepaskhah, A.R.,
Hansen, S., 2010. Effects of irrigation strategies and soils on field-grown potatoes:
Gas exchange and xylem (ABA). Agricultural Water Management, 97: 1486-1494.
Akyol, H., Riciputi, Y., Capanoglu, E., Caboni, M.F., Verardo, V., 2016. Phenolic
compounds in the potato and it’s by products: an overview. International Journal of
Molecular Science, 17, 835; doi: 10.3390/ijms17060835.
Alamar, M.C., Tosetti, R., Landahl, S., Bermejo, A., Terry, L.A., 2017. Assuring potato tuber
quality during storage: a future perspective. Frontiers in Plant Science, 8: 2034.
Aliche, E.B., Oortwijn, M., Theeuwen, T.P.J.M., Bachem, C.W.B., Visser, R.G.F., van der
Linden, C.G., 2018. Drought response in field grown potatoes and the interactions
between canopy growth and yield. Agricultural Water Management, 206: 20-30.
Allemann, J., Laurie, S.M., Thlart, S., Voster, H.J., 2004. Sustainable production of root and
tuber crops (potato, sweet potato, indigenous potato, cassava) in southern Africa.
South African Journal of Botany, 70(1): 60-66.

41
Alsharari, S.F., Alsadon, A.A., Alharbi, A.R., 2007. Evaluation of drought tolerance of potato
cultivars under greenhouse conditions. Acta Horticulturae, 747: 67-74
DOI:10.17660/ActaHortic.2007.747.5
https://doi.org/10.17660/ActaHortic.2007.747.5
Anjum, S.A., Xie, X., Wang, L., Saleem, M.F., Man, C., Lei, W., 2001. Morphological,
physiological and biochemical responses of plants to drought stress. African Journal
of Agricultural Research, 6(9): 2026-2032.
ANSA, 2008. Aartappel Netwerk Suid Afrika. Seed potatoes, member of MHF
http://www.potatonet.co.za/seedpotatos/seedpotatos.html (Accessed on 18/05/2018).
Arega, A., Tekalign, A., Solomon, T., Tekile, B., 2018. Effect of inter and intra row spacing
on tuber yield and yield components of potato (Solanum tuberosum L.) in Guji zone,
Southern Ethiopia. Journal of Advancements in Plant Science, 1(1): 102.
Ayas, S., 2013. The effects of different regimes on potato (Solanum tuberosum L. Hermes)
yield and quality characteristics under unheated greenhouse conditions. Bulgarian
Journal of Agricultural Science, 19(1): 87-95.
Badr, M.A., El-Tahamy, W.A., Zaghloul, A.M., 2012. Yield and water use efficiency of
potato grown under different irrigation and nitrogen levels in an arid region.
Agricultural Water Management, 110: 9-15.
Bahta, Y.T., Jordaan, A., Mnyambo, F., 2016. Communal farmers' perception of drought in
South Africa: Policy implication for drought risk reduction. International Journal of
Disaster Risk Reduction, 20: 39-50.
Barber, S. A. 1995. Soil nutrient bioavailability: a mechanistic approach, John Wiley & Sons.
Begum, M., Saikia, M., Sarmah, A., Ojah, N.J., Deka, P., Dutta, P.K., Ojah, I., 2018. Water
management for higher potato production: a review. International Journal of Current
Microbiology and Applied Sciences, 7(5): 24-33.
Bekele, T., Haile, B., 2019. Evaluation of improved potato (Solanum tuberosum L.) varieties
for some quality attributes at Shebench Woreda of Bench-Maji Zone, South western
Ethiopia. African Journal of Agricultural Research, 14(7): 389-394.
42
Birch, P.R.J., Bryan, G., Fenton, B., Gilroy, E.M., Hein, I., Jones, J.T., Prashar, A., Taylor,
M.A., Torrance, L., Toth, I.K., 2012. Crops that feed the world 8: Potato: are the
trends of increased global production sustainable? Food Security, 4: 477-508.
Blum, A., 2005. Drought resistance, water-use efficiency, and yield potential-are they
compatible, dissonant, or mutually exclusive? Australian Journal of Agricultural
Research, 56: 1159-1168.
Boutraa, T., 2010. Improvement of water use efficiency in irrigated agriculture: A review.
Journal of Agriculture, 9(1): 8-11.
Cantore, V., Wassar, F., Yamac, S.S., Sellami, M.H., Albrizio, R., Stellacci, A.M.,
Todorovic, M., 2014. Yield and water use efficiency of early potato grown under
different irrigation regimes. International Journal of Plant Production, 8(3): 409-428.
Carli, C., Yuldashev, F., Khalikov, D., Condori, B., Meres, V., Monneveux, P., 2014. Effect
of different irrigation regimes on yield, water use efficiency and quality of potato
(Solanum tuberosum L.) in the lowlands of Tashkent, Uzbekistan: A field and
modeling perspective. Field Crops Research, 163: 90-99.
Costa, J.M., Ortuno, M.F., Chaves, M.M., 2007. Deficit irrigation as a strategy to save water:
Physiology and potential application to horticulture. Journal Integrated Plant Biology,
49(10): 1421-1434.
Curwen, D., 1994. Potato growth and irrigation scheduling. Water stress-related disorders.
Nebraska Potato Focus, 22-28.
DAFF, [Department of Agriculture, Forestry and Fisheries]. 2013. Potatoes Production
guidelines. Compiled by Directorate Plant Production in collaboration with the ARC.
DAFF, [Department of Agriculture, Forestry and Fisheries]. 2017. Trends in Agricultural
Sector 2017. Compiled by Directorate Plant Production in collaboration with the
ARC.
Daryanto, S., Wang, L., Jacinthe, P.A., 2016. Drought effects on root and tuber production: A
meta-analysis. Agricultural Water Management, 176: 122-131.

43
De Pascale, S., Costa, L.D., Vallone, S., Barbieri, G., Maggio, A., 2011. Increasing water use
efficiency in vegetable crop production: from plant to irrigation systems efficiency.
Horticulture Technology, 21(3): 203-308.
El Chami, D., El Moujabber, M., 2016. Drought, climate change and sustainability of water
in agriculture: A roadmap towards the NWRS2. South African Journal of Science,
112(9/10).
Fahad, S., Bajwa, A.A., Nazir, U., Anjum. S.A., Farooq, A., Zohaib, A., Sadia, S., Nasim,
W., Adkins, S., Saud, S., Ihsan, M.Z., Alharby, H., Wu, C., Wang, D., Huang, J.,
2017. Crop production under drought and heat stress: Plant responses and
management options. Frontiers Plant Science, 8:1147.
FAO. 2008a. The International Year of Potato. The Global Crop Diversity Trust and FAO’s
Plant Production and Protection Division. Rome, Italy. www.fao.org/potato-
2008/en/potato/index.html (Accessed on 13/05/2018).
FAO. 2018. Crop water information: Potato. Available from: www.fao.org/land-
water/databases-and-software/crop-information/potato/en/ (Accessed on14/05/2018).
Fereres, E., Soriano, A., 2006. Deficit irrigation for reducing agricultural water use. Journal
of Experimental Botany, 1-13.
Fiers, M., Edel-Hermann, V., Chatot, C., Le Hingrat, Y., Alabouvette, C., Steinberg, C.,
2012. Potato soil-borne diseases. A review. Agronomic Sustainable Development, 32:
93-132.
Freitas, S.T., Pereira, E.I.P., Gomez, A.C.S., Brackmann, A., Nicoloso, F., Bisognin, D.A.,
2012. Horticultura Brasileira, 30(1): 91-98.
Geofrey, K.G., Joseph, N.A., Dorcas, K.I., 2014. Effects of irrigation water and mineral
nutrients application rates on tissue contents and use efficiencies in seed potato tuber
production. International Journal of Plant and Soil Science, 3(9): 1153-1166.
Geremew, E.B., Steyn, J.M., Annandale, J.G., 2007. Evaluation of growth performance and
dry matter partitioning of four processing potato (Solanum tuberosum L.) cultivars.
New Zealand Journal of Crop and Horticultural Science, 35(3): 385-393.

44
Getachew, T., Belew, D., Tulu, S., 2013. Combined effect of plant spacing and time of
earthing up on tuber quality parameters of potato (Solanum tuberosum L.) at Degem
district, North Showa Zone of Oromia Regional State. Asian Journal of Crop Science,
5(1): 24-32.
Hasanuzzaman, M., Nahar, K., Alam, M., Roychowdhury, R., Fujita, M., 2013.
Physiological, Biochemical, and Molecular Mechanisms of Heat Stress Tolerance in
Plants. International Journal of Molecular Sciences, 14: 9643-9684.
Hassanpanah, D., 2010. Evaluation of potato cultivars for resistance against water deficit
stress under in vivo conditions. Potato Research, 53: 383-392.
Haverkort, A.J., Franke, A.C., Engelbrecht, F. A., Steyn, J.M., 2013. Climate change and
potato production in contrasting South African agro-ecosystems 1. Effects on land and
water use efficiencies. Potato Research, 56: 31-50.
Haverkort, A.J., Struik, P.C., 2015. Yield level of potato crops: recent achievement and future
prospects. Field crops Research, 182: 76-85.
Hayat, S., Hayat, Q., Alyemeni, M.N., Wani, A.S., Pichtel, J., Ahmad, A., 2012. Role of
proline under changing environments: a review. Plant Signalling and Behaviour,
7(11): 1456-1466.
Hedden, S., Cilliers, J., 2014. Parched prospects: The emerging water crisis in South Africa.
African futures paper 11.
Heltoft, P., Wold, A.B., Molteberg, E.L., 2017. Maturity indicators for prediction of potato
(Solanum tuberosum L.) quality during storage. Postharvest Biology and Technology,
129: 97-106.
Heuer, B., Nadler, A., 1998. Physiological response of potato plants to soil salinity and water
deficit. Plant Science, 137: 43-51.
Holden, N., Brereton, A., Fealy, R., Sweeney, J., 2003. Possible change in Irish climate and
its impact on barley and potato yields. Agricultural and Forest Meteorology, 116: 181-
196. doi:10.1016/s0168-1923(03)00002-9.
45
Hossain, M.A., Wani, S.H., Bhattacharjee, S., Burritt, D.J., Tran, L.S.P., 2016. Drought stress
tolerance in plants, 2.
Hussain, S., Iqbal, M., Iqbal, M., Aziz, O., Murtaza, G., Iqbal, S., Mehmood, S., Rasool, T.,
2015. Effect of different irrigation practices and plastic mulch on water use efficiency,
growth and yield of spring maize. Basic Research Journal of Agricultural Science and
Review, 4(11).
Hussein, O.S., Hamideldin, N., 2014. Effects of spraying irradiated alginate on Solanum
tuberosum L. plants: growth, yield and physiological changes of stored tubers. IOSR
Journal of Agriculture and Veterinary Science, 7(1): 75-79.
HZPC 2016, Sifra. http://www.hzpc.ca/english/varieties-details.asp?id=87 (Accessed on
19/05/2018).
HZPC 2018 a, http://web.hzpc-
holland.com/teeltbeschrijving/CHALLENGER_C_EN_FRENCH%20FRIES.PDF
(Accessed on 07/12/2018).
HZPC 2018 b, http://web.hzpc-holland.com/teeltbeschrijving/PANAMERA_C_EN.PDF
(Accessed on 20/11/2018).
HZPC 2018 c, Mondial. http://web.hzpc-holland.com/teeltbeschrijving/MONDIAL_C_EN,
(Accessed on 03/04/ 2018).
HZPC 2018 d, Sifra. http://web.hzpc-holland.com/teeltbeschrijving/SIFRA_C_EN.PDF
(Accessed on 19/05/2018).
CIP, 2018. International Potato Center (Centro Internacional de la Papa CIP). CIP Annual
Report 2017. Harnessing potato and sweet potato’s power for food security, nutrition
and climate resilience. Lima, Peru. International Potato Center. 47 p.
https://cipotato.org/crops/potato/ (Accessed on 13/10/2019).
IWMI, 1996. International Water Management Institute. World water demand and supply,
1990 to 2025: Scenarios and Issues, Research Report 19.
IPM, 2015. Irish Potato Marketing (IPM) Potato Group, http://www.ipmpotato.com/wp-
content/uploads/2015/11/Electra.pdf (Accessed on 20/11/2018).

46
IPM, 2017. rish Potato Marketing (IPM) Potato Group, http://www.ipmpotato.com/wp-
content/uploads/2017/09/bikini.pdf (Accessed on 20/11/2018).
Jaleel, C.A., Gopi, R., Sankar, B., Manivannan, P., Kishorekumar, A., Sridharan, R.,
Panneerselvam, R., 2007. Studies on germination, seedling vigour, lipid peroxidation
and proline metabolism in Catharanthus roseus seedlings under salt stress. South
African Journal of Botany, 73: 190-195.
Kahsay, W.S., 2019. Effects of nitrogen and phosphorus on potatoes production in Ethiopia:
A review. Cogent Food and Agriculture, 5: 1572985
https://doi.org/10.1080/23311932.2019.1572985
Kandil, A.A., Attia, A.N., Badawi, M.A., Sharief, A.E., Abido, W.A.E., 2011. Influence of
water stress and organic and inorganic fertilization on quality, storability and
chemical analysis of potato (Solanum tuberosum, L.). Journal of Applied Sciences
Research, 7(3): 187-199.
Kaya, M.D., Okcub, G., Ataka, M., Cikilic, Y., Kolsaricia, O., 2006. Seed treatments to
overcome salt and drought stress during germination in sunflower (Helianthus
annus L). Europe Journal Agronomy, 24: 291-295.
Kelaleche, H., Guendouz, A., Hafsi, M., 2008. The effect of water stress on some
physiological and biochemical traits in five durum wheat (Triticum durum Desf.)
genotypes. International Journal Biosciences, 12(1): 90-97.
Khan, A.A., Jilani, M.S., Khan, M.Q., Zubair, M., 2011. Effect of seasonal variation on tuber
bulking rate of potato. The Journal of Animal and Plant Sciences, 21(1): 31-37.
Khanal, B., Uprety, D., 2014. Effects of storage temperature on post-harvest of potato.
International Journal of Research, 1(7): 2348-6848.
Khanna-Chopra, R., Singh, S., 2011. Approaches to increase water use efficiency in
Horticultural and grain crops: an overview. Plant Stress, 5(1): 52-63.
Kumar, D., Ezekiel, R., Singh, B., Ahmed, I., 2005. Conversion table for specific gravity, dry
matter and starch content from under water weight of potatoes grown in north-Indian
plains. Potato Journal, 32 (1 - 2): 79-84.

47
Kumar, D., Singh, B.P., Kumar, P., 2004. An overview of the factors affecting sugar content
of potatoes. Annals of Applied Biology, 145: 247-256.
Laboski, C.A.M., Kellings, K.A., 2007. Influence of fertilizer management and soil fertility
on tuber specific gravity: a review. American Journal of Potato Research, 84: 283-
290.
Lahlou, O., Ouattar. S., Ledent, J.F., 2003. The effect of drought and cultivar on growth
parameters, yield and yield components of potato. Agronomie, 23: 257-268.
Lei, Y., Yin, C., Lia, C., 2006. Differences in some morphological, physiological, and
biochemical responses to drought stress in two contrasting populations of Populus
przewalskii. Physiologia Plantarum, 127: 182-191.
Levy, D., 1983. Water deficit enhancement of proline and a-amino nitrogen accumulation in
potato plants and its association with susceptibility to drought. Physiology and Plant,
57: 169-173.
Li, J., Cang, Z., Jiao, F., Bai, X., Zhang, D., Zhai, R., 2017. Influence of drought stress on
photosynthesic characteristics and protective enzymes of potato at seedling stage.
Journal of the Saudi Society of Agricultural Sciences, 16: 82-88.
Lipiec, J., Doussan, C., Nosalewicz, A., Kondracka, K., 2013. Effect of drought and heat
stresses on plant growth and yield: a review. International Agrophysics, 27, 463-477.
Lutaladio, N.B., Castaldi, L., 2009. Potato: The hidden treasure. Journal of Food
Composition and Analysis, 22: 491-493.
Mangani, R., Mazarura, U., Mtaita, T.A., Shayanowako, A., 2015. Growth, yield and quality
responses to plant spacing in Irish potato: a review. African Journal of Agricultural
Research, 10(7): 727-730.
Masango, S., 2014. Water use efficiency of orange fleshed sweet potato (Ipomoea batatas L.
Lam.). M.Sc. Thesis. University of Pretoria, South Africa.
Mashilo, J., Odindo, A.O., Shimelis, H.A., Musenge, P., Tesfay, S.Z., Magwaza, L.S., 2017.
Photosynthetic response of bottle gourd [Lagenaria siceraria (Molina) Standl.] to

48
drought stress: Relationship between cucurbitacins accumulation and drought
tolerance. Scientia Horticulturae, 231: 133-143.
McCauley, A., Jones, C., Olson-Rutz, K., 2017. Soil pH and Organic Matter. Nutrient
Management Module No. 8, 4449-8.
http://landresources.montana.edu/nm/documents/NM8.pdf.
Miura, K., Tada, Y., 2014. Regulation of water, salinity, and cold stress responses by
salicylic acid. Faculty of Life and Environmental Sciences, University of Tsukuba, 1-
1-1Tennodai, Tsukuba 305-8572.
Mohamed, E.M.E., Watthier, M., Zanuncio, J.C., Santos, R.H.S., 2017. Dry matter
accumulation and potato productivity with green manure. Idesia (Chile) Marzo, 35(1):
79-86.
Molinari, H.B.C., Marur, C.J., Daros, E., de Campos, M.K.F., de Carvalho, J.F.R.P., Filho,
J.C.B., Pereira, L.F.P., Vieira, L.G.E., 2007. Evaluation of the stress-inducible
production of proline in transgenic sugarcane (Saccharum spp.): osmotic adjustment,
chlorophyll fluorescence and oxidative stress. Physiologia Plantarum, 130: 218-229.
Monneveux, P., Ramirez, D.A., Pino, M.-T., 2013. Drought tolerance in potato (S. tuberosum
L.) can we learn from drought tolerance research in Cereals? Plant Science, (205-
206): 76-86.
Muhammad, N., Hussain, Z., Rahmdil, Ahmed, N., 2015. Effect of different doses of NPK
fertilizers on the growth and tuber yield of potato. Life Science International Journal,
9(1, 2, 3, & 4): 3098-3105.
Muthoni, J., Kabira, J.N., 2016. Potato production under drought conditions: Identification of
adaptive traits. International Journal of Horticulture, 6(12): 1-9.
Naidoo, M., van Rij, N., Arathoon, J., 2011. Potato Production for KwaZulu-Natal.Agri
Update.https://www.kzndard.gov.za/images/Documents/researchandtechnologydevelo
pment/publications/Research and Technology Bulletins/Potato-production-for-
Kwazulu-natal.pdf (Accessed on 14/06/2018).

49
Ngobese, N.Z., Workneh, T.S., Alimi, B.A., Tesfay, S., 2017. Nutrient composition and
starch characteristics of eight European potato cultivars cultivated in South Africa.
Journal of Food Composition and Analysis, 55: 1-11.
Obidiegwu, J.E., Bryan, G.J., Jones, H.G., Prashar, A., 2015. Coping with drought: stress and
adaptive responses in potato and perspectives for improvement. Frontier in Plant
Science, 6: 542.
Onder, S., Caliskan, M.E., Onder, D., Caliskan, S., 2005. Different irrigation methods and
water stress effects on potato yield and yield components. Agricultural Water
Management, 73: 73-86.
Osakabe, Y., Osakabe, K., Shinozaki, K., Tran, L.S.P., 2014. Response of plants to water
stress. Plant Physiology, 5, 86.
Pandey, V., Kumar, V.A., Brar, A., 2017. Biochemical behaviour of potato tubers during
storage. Chemical Science Review and Letters, 6(23): 1818-1822.
Pavlista, A.D., 2002. Skin set evaluation by skin shear measurements. American Journal of
Potato Research, 79: 301-307.
Phelan, S., 2018. https://www.teagasc.ie/media/website/publications/2018/Potato-newsletter-
September-2018.pdf. (Accessed on 05/08/2019).
PSA, 2014-2017. Potato South Africa. Potato Industry Research Strategy. Published report.
Potato South Africa, Pretoria. RSA. (Accessed on 22/03/2018).
PSA, 2018-2019. Potato South Africa. Potato Market comment March 2019.
http://stage.potatoes.co.za/wp-content/uploads/2019/04/Markkommentaar-Market-
Comment-Maart-2019.pdf . (Accessed on 22/09/2019).
Praeger, U., Herppich, W.B., Konig, C., Herold, B., Geyer, M., 2009. Changes of water
status, elastic properties and blackspot incidence during storage of potato tubers.
Journal of Applied Botany and Food Quality, 83: 1-8.
Rady, A.M., Guyer, D.E., 2015. Rapid and/or non-destructive of quality evaluation methods
for potatoes, the review. Computers and Electronics in Agriculture, 117, 31-48.

50
Razaq, M., Rab, A., Alam, H., Salahuddin, Saud, S., Ahmad, Z., 2015. Effect of potash levels
and plant density of potato yield. Journal of Biology, Agriculture and Healthcare,
5(13): 2224-3208.
Rodríguez, L.P., Sanjuanelo, D.C., Nustez, C.E.L., Moreno-Fonseca, L.P., 2016. Growth and
phenology of three Andean potato varieties (Solanum tuberosum L.) under water
stress. Agronomia Colombiana, 34(2): 141-154.
Rodriguez-Perez, L., Nustez, C.E.L., Moreno L.P.F., 2017. Drought stress affects
physiological parameters but not tuber yield in three Andean potato (Solanum
tuberosum L.) cultivars. Agronomia Colombiana, 35(2): 158-170.
Rosen, C.J., Kelling, K.A., Stark, J.C., Porter, G.A., 2014. Optimizing phosphorus fertilizer
management in potato production. America Journal Potato Research, 91: 145-160.
Sanginga, N., Mbabu, A., 2015. Root and Tuber Crops (Cassava, Yam, Potato and Sweet
Potato). Feeding Africa: An Action plan for African Agricultural Transformation, 16-
21.
https://www.afdb.org/fileadmin/uploads/afdb/Documents/Events/DakAgri2015/Root_
and Tuber Crops Cassava Yam Potato and Sweet Potato .pdf (Accessed on
13/09/2019).
Sarani, M., Namrudi, M., Hashemi, S.M., Raoofi, M.M., 2014. The effect of drought stress
on chlorophyll content, root growth, glucosinolate and proline in crop plants.
International Journal of Farming and Allied Sciences, 3(9): 994-997.
Saxena, M., Saxena, J., Pradhan, A., 2012. Flavonoids and phenolic acids as antioxidants in
plants and human health. International Journal of Pharmaceutical Sciences Review
and Research, 16(2): 130-134.
Singh, A., Aggarwal, N., Aulakh, G.S., Hundal, R.K., 2011. Ways to maximize the water use
efficiency in field crops – a review. Greener Journal of Agricultural Sciences, 2(4): 108-
129.
Solaiman, A.H.M., Nishizawa, T., Roy, T.S., Rahman, M., Chakraborty, R., Choudhury, T.,
Sarkar, M.D., Hasanuzzaman, M., 2015. Yield, dry matter, specific gravity and colour

51
of three Bangladeshi local potato cultivars as influenced by stage of maturity. Journal
of Plant Sciences. 1816-4951/DOI: 10.3923/jps.
Steyn, J.M., Du Plessis, H.F., Fourie, P., Hammes, P.S., 1998. Yield response of potato
genotypes to different soil water regimes in contrasting seasons of a subtropical
climate. Potato Research, 41: 239-254.
Steyn, J.M., Franke, A.C., van der Waals, J.E., Haverkort, A.J., 2016. Resource use
efficiencies as indicator of ecological sustainability in potato production: A South
African case study. Field Crop Research, 199: 136-149.
Steyn, J.M., Geremew, E.B., Annandale, J.G., Steyn, P.J., 2009. Frodo and Darius: South
African potato cultivars with good processing quality. South African Journal of Plant
and Soil, 26(1): 24-30.
Stubbs, M., 2016. Nutrients in agricultural production: A water quality overview.
Congressional Research Service 7-5700.
Suh, C., Meka, S.S., Ngome, A.F., Neba, D.A., Kemngwa, I.T., Sonkouat, A.D., Njualem, D.,
2015. Effects of organic and inorganic fertilizers on growth and yield of potato
(Solanum tuberosum L.) in the western highlands of Cameroon. Journal of
Development Research, 5(0).
Tafi, M., Siyadat, S.A. Radjabi, R., Mojadam, M., 2010. The effects of earthing up on the
potato yield in Dezful (Khouzestan, Iran) weather condition. Middle-East Journal of
Scientific Research, 5(5): 392-396.
Tantowijoyo, W., van de Fliert, E., 2006. All about potatoes. An Ecological Guide to Potato
Integrated Crop Management. International Potato Center (CIP-ESEAP Region) &
FAO Regional Vegetable IPM Program in South and Southeast Asia.
www.vegetableipmasia.org/uploads/files/document/TrainingMaterials/All-about-
potatoes-ecoguide2006.pdf (Accessed 16/05/2018).
Tavakoli, M.T., Chenari, A.I., Rezaie, M., Tavakoli, A., Shahsavari, S., Mousavi, S.R., 2014.
The importance of micronutrients in agricultural production. Advances in
Environmental Biology, 8(10): 31-3.

52
The Water Wheel, 2007. Water scarcity making every drop count. The Water Wheel. pp 28
29.
Tolessa, E.S., Belew, D., Debela, A., Kedi, B., 2016. Effect of nitrogen rates and irrigation
regimes on water use efficiency of selected potato varieties in Jimma zone, west
Ethiopia. Advances in Crop Science and Technology 4(6): 3-6 doi: 10.4172/2329-
8863.1000244.
Tumuhimbise, R., Talwana, H.L., Osiru, D.S.O., Serem, A.K., Ndabikunze, B.K., Nandi,
J.O.M., Palapala, V., 2009. Growth and development of wetland-grown taro under
different plant populations and seedbed types in Uganda. African Crop Science
Journal, 17(1). 49-60.
Umadevi, M., Kumar, P.K.S., Bhowmik, D., Duraivel, S., 2013. Health Benefits and Cons of
Solanum tuberosum. Journal of Medicinal Plants Studies, 1(1): 16-25.
Van der Merwe, L., Van Zyl, P., 2017. Which cultivars dominated the South African potato
industry in 2016? (Potato South Africa). Economic News, 54-57.
Van Niekerk, C., Schönfeldt, H., Hall, N., Pretorius, B., 2016. The role of biodiversity in
food security and nutrition: a potato cultivar case study. Food and Nutrition Sciences,
7, 371-382.
VIB Facts Series, 2019. Potato in Africa. International Plant Biotechnology Outreach.
http://ipbo.vib-ugent.be/wp-content/uploads/2018/11/VIB_Facts-Series_Potato-in-
Africa.pdf (Accessed 29/07/2019).
Voss, R.E., Baghott, K.G., Timm, H., n.d. Proper environment for potato storage. Vegetable
Research and Information Center, 1-3.
Walworth, J.L., Carling, D.E., 2002. Tuber Initiation and Development in Irrigated and Non-
Irrigated Potatoes. American Journal of Potato Research, 79: 387-395.
Wassu, M., 2017. Genotype x environment interaction, stability and co-heritability of tuber
internal quality traits in potato (Solanum tuberosum l.) cultivars in Ethiopia. African
Journal of Food, Agriculture and Nutrition and Development, 17(4): 12930-12952.

53
Waterer, D., 2002. Impact of high soil pH on potato yields and grade losses to common scab.
Canadian Journal of Plant Science, 82: 583-586.
Wilson, C.R., Pemberton, B.M., Ransom, L.M., 2001. The effect of irrigation strategies
during tuber initiation on marketable yield and development of common scab disease
of potato in Russet Burbank in Tasmania. Potato Research, 44: 243-251.
WRC, 2015 a. Water Research Commission. South African Drought. Background to current
drought situation in South Africa
http://www.droughtsa.org.za/images/Background_to_current_drought_situation_in
South_Africa.pdf (Accessed on 18/05/2019).
WRC, 2015 b. Water Research Commission. 2015. South African Drought. Drought SA:
your knowledge gateway to managing water scarcity in times of drought. The October
2015 report on drought conditions across the country.
http://www.droughtsa.org.za/images/SA7 2015 10 Drought report.compressed.pdf
(Accessed on 18/05/2019).
Xie, K, Wang, XX, Zhang, R, Gong, X, Zhang, S, Mares, V, Gavilán, C, Posadas, A and
Quiroz, R. 2012. Partial root-zone drying irrigation and water utilization efficiency by
the potato crop in semi-arid regions in China. Scientia Horticulturae, 134: 20-25.
Yuana, B,-Z., Nishiyama, S., Kang, Y., 2003. Effects of different irrigation regimes on the
growth and yield of drip-irrigated potato. Agricultural Water Management, 63: 153-
167.
Zaman, S., Hassani, D., Khalid, M., Erum, S., Shah, S.H., Che, S., 2016. Assessment of
fifteen selected potato (Solanum tuberosum L.) genotypes on the basis of biochemical
characteristics. International Journal of Biology, Pharmacy and Allied Sciences, 5(3):
725-735.
Zhang, S., Xu, X., Sun, Y., Zhang, J., LI, C., 2018. Influence of drought hardening on the
resistance physiology of potato seedlings under drought stress. Journal of Integrative
Agriculture, 17(2): 336-347.

54
Zin El-Abedin, T.K., Mattara, M.A., Alazba, A.A., Al-Ghobari, H.M., 2017. Comparative
effects of two water-saving irrigation techniques on soil water status, yield, and water
use efficiency in potato. Scientia Horticulturae, 225: 525-532.

55
Chapter 3: Drought tolerance assessment of potato (Solanum tuberosum L.)
genotypes at different growth stages based on morphological and physiological
traits
3.1 Abstract
Cultivation of drought-tolerant potato (Solanum tuberosum L.) genotypes is key to improving
complementary morphological and physiological traits tuber yield and quality for food and
processing. The objective of this study was to assess drought tolerance of diverse potato
genotypes. Physiological and morphological responses of eight potato varieties were assessed
under well-watered (Ww) and water-deficit (Wd) conditions across four different growth
stages namely: (i.e. vegetative (VG), tuber initiation (TI), tuber bulking (TB) and maturity
(MAT) stages using an 8×4×2 factorial treatment with three replications. Data was collected
on morphological traits such as plant height (PH), leaf number (LN), tuber yield (TY) and
total above-ground biomass (TAG), and physiological traits including stomatal conductance
(gs), transpiration rate (Tr), rate of photosynthesis (A), instantaneous water use efficiency
(IWUE), chlorophyll content index (CCI) and relative water content (RWC). Significant (p <
0.05) genotype x water condition x growth stage effect were observed for A, Tr, IWUE,
RWC, CCI, PH, LN, TY and TAG indicating varied response of genotypes to water condition
across growth stages. This is useful to recommend growth-stage specific and tolerant potato
genotypes for production. Correlation analysis revealed significant and negative associations
between gs and IWUE with TY (r = -0.81; r = -0.77) at VG stage, PH, Tr, A and IWUE with
TY (r = 0.92; (r = 0.65; r = 0.95; r = 0.88 at TI stage. Also, CCI with TY (r = 0.71) at MAT
stage and negative association between TAG with TY (r = -0.85) at MT stage under Wd
condition. Principal component bi-plot identified drought-tolerant potato genotypes such as
Bikini and Challenger with high tuber yield across growth stages and recommended for
cultivation in water-restricted environments.
Keywords: Abiotic stress, potato genotypes; water deficit; growth stages; physiological traits

56
3.2 Introduction
Potato (Solanum tuberosum L.) is an economically important tuber crop widely cultivated for
food and various industrial applications globally after cassava (Manihot esculenta), sweet
potato (Ipomoea batatas), and yam (Dioscorea alata) (FAOSTAT, 2019). The starchy tuber
are valuable sources of health-promoting phyto-nutrients including carbohydrates, minerals
(i.e. iron, zinc, magnesium, phosphorus and potassium), vitamins (i.e. Vit C, B3, B5, B6 and
fibre) and protein content ranging from 1 to 1.5%, and 8 to 9 % for fresh and tubers,
respectively (Singh and Raigond, 2014; Wassu, 2017). The crop is also valuable source of
phenolic compound such as phenolic acids and flavonoids including flavonols and
anthocyanins, alkaloids such as glycoalkaloids which are health-promoting possessing
antioxidant and anti-cancer properties (Singh and Raigond, 2014; Akyol et al., 2016). Potato
is largely produced under rainfed conditions and production is affected by abiotic stress
factors mainly drought and heat (Chauvin et al., 2012; El-Wahab et al., 2016) resulting in
low yield output and unsuitable for marketing (Adhikari et al., 2015; Kiptoo et al., 2018).
Efforts to develop well-adapted and drought-tolerant potato genotypes are required to
improve yield gains and overall production, and quality end-user potato-derived products by
processing industries.
Agronomic traits are key determinant of potato tuber yield under water-stress environments
and useful indicators for drought tolerance assessment. Traits such as plant height, leaf
number and total-above ground biomass are widely used for selection of drought-tolerant
potato genotypes (Tourneux et al., 2003a). Agronomic traits well correlated with yield
serving as an indirect selection criterion for cultivar development (Mahmud et al., 2017).
Physiological traits including chlorophyll content index (CCI), rate of photosynthesis (A),
stomatal conductance (gs), transpiration (Tr), relative water content (RWC) which measures
plant water status, and water-use efficiency (WUE) are also useful indicators of drought
tolerance. These traits can be targeted in breeding programs to select and identify promising
genotypes for production in targeted environments (Tourneux et al., 2003b; Ramirez et al.,
2014). Therefore, the integration of agronomic and physiological traits is useful to improving
identification and selection of drought tolerant genotypes.
Growth of potato occurs in various stages including vegetative, tuber initiation, tuber bulking
and maturity stages (Ayas and Korukcu, 2010). All potato growth stages are sensitive to
water deficit; however, the most drought-sensitive are tuber initiation and bulking stages,
whereas early vegetative and maturity stages are regarded as tolerant to drought stress (Ayas

57
and Korukcu, 2010; Hirut et al., 2017). Water deficit reduce total yield in all potato growth
stages (Abbas and Ranjan, 2015; Al-Mahmud et al., 2015). As a result, the interactive effects
genotype, developmental stage, and the environment influence the response of potato to
drought stress. This is important to identify growth-stage specific or “all-stage” adaptation of
genotypes for specific cultivation in dry environments to improve yield potential.
In South Africa, drought stress is the leading factor for reduced potato yields and quality
(DAFF, 2017). In the country, potato yield output has slowly increased from 1.2 to 2.5
million tonnes from the period 1990 to 2015 (Potato South Africa, 2017). In addition,
production is insufficient due to the high demand of the crop by neighbouring countries such
as Botswana, Lesotho, Namibia, Swaziland, Zambia and Zimbabwe (Kapuya and Sihlobo,
2015). There has been very limited efforts in the country concerning developing potato
genotypes with high-levels of drought tolerance across all growth stages for recommendation
to growers. The currently and widely grown genotypes in the country could serve as useful
germplasm for developing specific and across-stage tolerance potato genotypes for improving
yield output and quality under water-constrained production environments.
Although extensive research has been carried out determining the response of potato
genotypes to different water regimes (Alsharari et al., 2007; Haverkort et al., 2013; Elzner et
al., 2018), there is limited information on potato response at different growth stages and how
this influence yield performance. Therefore, the objective of this study was to determine the
drought tolerance of diverse potato genotypes based on physiological and morphological
responses to identify for recommendation or breeding.

58
3.3 MATERIAL AND METHODS
3.3.1 Plant materials
Certified seed (i.e. generation 1-3) of eight potato genotypes namely: Bikini (G1), Challenger
(G2), Electra (G3), Mondial (G4), Panamera (G5), Sababa (G6), Sifra (G7), and Tyson (G8)
were sourced from Wes grow Pretoria, South Africa and used for the study. This are highly
demanded and newly introduced genotypes for potato the industry in South Africa, hence
selected for evaluation.
3.3.2 Description of a controlled environment
An experiment was conducted at the University of KwaZulu-Natal’s Controlled Environment
Research Unit (CERU), Pietermaritzburg, South Africa. The environmental conditions inside
the tunnel were semi-controlled with the average day and night temperatures of 38 °C and 18
°C, respectively, whereas relative humidity ranged between 45 % - 55 %. Temperature and
relative humidity were monitored electronically using a data logger (HOBO 2K logger, Onset
Computer Corporation, Bourne, USA). The experiment was planted on the 16th of December
2018 and terminated on the 14th of April 2019.
3.3.3 Experimental design and trial establishment
The study was conducted using an 8×4×2 factorial treatment structure arranged in
randomized complete blocks design with three replications resulting in 192 experimental
units (i.e. 10 L drained polyethylene pots). The experiment comprised of the following
factors: potato genotypes- 8 levels (Bikini, Challenger, Electra, Mondial, Panamera, Sababa,
Sifra, and Tyson); growth stages - 4 levels (vegetative stage, tuber initiation, tuber bulking
and maturity) and watering regimes -2 levels (Well-watered [Ww] and Water deficit [Wd]
conditions). A loamy soil with known chemical (Table 1) and physical properties (Table 1)
collected from Ukulinga Research Farm (29° 39′48.82″S; 30° 24′19.89″E), Pietermaritzburg,
South Africa was used for the study.
One sprouted potato tuber was sown in each pot half-filled with 2.5 kg of sieved soil and after
two weeks another 2.5 kg of sieved soil was re-added. Nitrogen (N), phosphorus (p) and
potassium (K) were supplied using automated drip irrigation at a rate of 200 kg N ha-1 (ha-1),
80 kg P ha-1 and 90 kg K ha-1 based on soil fertility analysis using potato nutrient
requirements as a reference. For the first two weeks, all pots were watered to field capacity
after planting to ensure fully establishment. The studied genotypes were exposed to water
deficit at the beginning of each growth stage (i.e. vegetative growth, tuber initiation, tuber

59
bulking and maturity) for the entire growth stage and re-irrigated at the end of each growth
stage. The crop duration in growing degree days (beginning and end-stage of each growth
stage) was monitored using the BBCH developmental scale (Table 2) (Meier, 2001). Soil
water content was monitored daily by a Hydro-Sense II (HS2) Handheld Soil Moisture
Sensor, carefully inserted in the pot to a depth of 12 cm. The H2S uses a battery capacitance
to estimate the volumetric soil moisture content (VSC). Soil moisture content was maintained
at 32 % at field capacity (throughout the growing period) under well-watered condition.
Under water deficit treatment, soil moisture was allowed to decline from 32 % to
approximately 10% after irrigation was withheld throughout all the crop growing period.
Weeds were removed by hand while pests and diseases were chemically controlled.
Table 3.1: Soil chemical composition
Sample
density (g/ml)
N
(%)
P
(mg/L)
K
(mg/L)
Ca
(mg/L)
Mg
(mg/L)
Exch.Acidity
(cmol/L)
Total
cations (cmolmg/L)
pH
(KCL)
Zn
(mg/L)
Mn
(mg/L)
Cu
(mg/L) Organic
C (%)
1.46 0.13 30 108 844 314 1.14 8.21 3.94 5.9 110 8.9 1.5
N = nitrogen, P = phosphorus, K = phosphorus, Ca = calcium, Mg = magnesium, Zn = zinc, Mn = manganese, Cu = copper, C = carbon.
Table 3.2: Phonological development stages of potato (Solanum tuberosum L.) according
to the BBCH scale (Meier, 2001).
Code Description Stage no. dd/mm/Year DAP
00 Planting 0 16 December 2018 0
11 Emergence I 02 January 2019 17
21 Vegetative stage II 19 January 2019 34
40 Tuber initiation III 27 January 2019 42
51 Flowering - 04 February 2019 50
69 End of flowering - 17 February 2019 63
70 Tuber bulking IV 01 March 2019 75
95 Maturity V 30 March 2019 104
99 Yellow leaves and Harvest N 13-14 April 2019 119
N= Terminal, dd-Date, mm-Month, y-Year, DAP-Days after planting

60
3.3.4 Data collection
3.3.4.1 Physiological traits
The LI-6400 XT Portable Photosynthesis System (Licor Bioscience, Inc. Lincoln, Nebraska,
USA) was used to measure leaf gas exchange parameters: stomatal conductance (gs), the rate
of photosynthesis (A) and transpiration rate (Tr). Measurements were performed at the
termination of the stressing period for each growth stage for all genotypes under Ww and Wd
conditions. Data was collected at the mid-morning during sunny conditions between 9:00-
11:00 am on three young fully expanded leaves second from the top for each combination
genotype and water regime, to avoid potential stomatal closure during the middle of the day.
Instantaneous water-use efficiency was calculated as the ratio of A/Tr (de Santana et al.,
2015). Chlorophyll content index (CCI) was measured on abaxial surface using the
chlorophyll content meter (CCM-200 PLUS, Opti-Sciences, USA). The average of CCI was
determined from three.
Relative leaf water content (RWC) was measured from three plants randomly selected plants
per genotype under Ww and Wd conditions across growth stages according to Kalina et al.
(2016) using the formula by:
RWC (%) =(FW (g) − DW (g))
(TW (g) − DW (g))× 100
Where: FW-Fresh water; DW-Dry weight; TW-Turgid weight
3.3.4.2 Morphological traits
Data were collected on the following morphological traits: plant height (PH) in cm measured
from the base of the plant to the terminal point or last growth using a meter ruler, the leaf
number was physically counted. Plant fresh weights (sum of stem and leaf of the plants) were
determined for both well-watered and water deficit conditions. Samples were oven-dried at
75 °C for 48 hours to determine plant dry weight. Total above-ground biomass (TAG) or
shoot dry weight was calculated. Plant biomass was calculated as follows:
Total above − ground biomass (%) =Plant dry weight (g)
Plant fresh weight (g)× 100
Number of tubers per plant were counted and fresh tuber yield determined by weighing all
tubers and expressing values in grams/plant.

61
3.3.5 Data analysis
The data collected was subjected to analysis of variance (ANOVA) using GenStat® 18th
Edition (VSN International, Hemel Hempstead, UK). The means were separated with the
LSD test at 5% probability level. Correlation analysis was performed on studied traits to
determine their level of association. Principal component analysis (PCA) based on the
correlation matrix was used to derive bi-plots showing the relationship between genotypes
and assessed traits under well-watered and water deficit conditions.

62
3.4 Results
3.4.1 Effect of genotype, water condition and growth stages on physiological and
morphological traits
Analysis of variance showing mean squares and significance tests for physiological and
morphological traits among eight selected potato genotypes under well-watered and water
deficit conditions is shown in Table 3. Genotypic differences were observed with regards to
A, Tr, IWUE, CCI, RWC, PH, NL, TY and TAG. Highly significant (p < 0.001) effects of
water condition and growth stages were observed for assessed traits. Genotype x water
condition and genotype x growth stage were significant (p < 0.05) for most assessed traits. A
significant (p < 0.001) genotype × water condition × growth stages interaction was observed
for A, Tr, CCI, RWC, NL, TAG and TY (Table 3).

63
Table 3.3. Analysis of variance showing mean squares and significance test for assessed physiological and morphological traits among
eight potato genotypes tested under well-watered and water deficit conditions at four different growth stages.
Source of
variation
df A gs Tr IWUE CCI RWC PH NL TY TAG
Genotypes (G) 7 31*** 0.01ns 119.7*** 3.22** 91.0*** 381.3*** 1422*** 130*** 26737*** 1754***
Water condition
(WC)
1 1174*** 0.33*** 540.0*** 10.59** 213.4*** 3069*** 2567*** 2938*** 603649*** 448.4***
Growth Stage
(GS)
3 3694*** 0.17*** 562.6*** 66.61*** 1385*** 2326*** 15854*** 5383*** 60766*** 2195***
G × WC 7 27*** 0.02ns 38.6*** 0.79ns 63.08*** 288.2*** 205ns 7ns 671.9*** 7804***
G × GS 21 50*** 0.04*** 79.5*** 2.46*** 25.5*** 251.0*** 243* 48*** 623.9*** 9397***
WC × GS 3 57*** 0.02ns 37.5** 2.23ns 17.4*** 45.2ns 320ns 220*** 139.7*** 34832***
G × WC × GS 21 38*** 0.01ns 32.2*** 1.15ns 39.3*** 177.4*** 60ns 18*** 4116*** 424.1***
Residual 68 6 0.01 7.2 0.99 1.5 24.1 122 5 358 21.6
df = degree of freedom; * = significance at p < 0.05; ** = significance at p < 0.01; *** = significance at p < 0.001; ns = non-significant. A = Rate of
photosynthesis; gs = stomatal conductance; Tr = Transpiration rate; IWUE = instantaneous water-use efficiency; CCI = Chlorophyll content index; RWC =
Relative water content; PH = Plant height; NL = Number of leaves; TY= Yield; TAG = Total above-ground biomass.

64
3.4.2 Physiological response of potato genotypes under well-watered and water deficit
conditions across different growth stages
The mean values comparing for stomatal conductance (gs) and transpiration (Tr) rates of
studied potato genotypes under Ww and Wd conditions are presented in Figures 1a and 1b.
Non-significant (p > 0.05) genotypic differences were observed among potato genotypes for
gs at the vegetative and tuber bulking stages (Figure 1a). All genotypes under Ww condition
recorded higher gs than under Wd conditions in all growth stages (vegetative stage, tuber
initiation, tuber bulking and maturity stage). During vegetative and maturity stages
genotypes Panamera and Sababa recorded lowest gs (<2.18 and 2.16 molH2O m-2s-2
respectively) under Wd condition, whereas Electra had lowest gs at tuber initiation (2.24
molH2O m-2s-2) and Panamera (2.14 molH2O m-2s-2) at the tuber bulking stage. Under Ww
condition, Challenger 2.27 molH2O m-2s-2 and Mondial 2.28 molH2O m-2s-2 at the
vegetative stage, Bikini 2.25 molH2O m-2s-2 at tuber initiation, Panamera 2.17 molH2O m-2s-
2 and Sababa 2.12 molH2O m-2s-2 recorded lowest gs at the maturity stage.
Significant (p < 0.05) differences were observed among potato genotypes with respect to Tr
under Ww and Wd conditions across growth stages (Figure 1b). Sababa had a significantly
lower Tr (9.16 mmol H2O m-2 s-2) compared to Bikini which recorded higher Tr of >20
mmol H2O m-2 s-2 under Wd condition at the vegetative stage. A lower rate of Tr (<17 mmol
H2O m-2 s-2) was observed for Sababa and Panamera, whereas Electra, Tyson and Bikini
recorded higher Tr of >21 mmolH2O m-2 s-2 under Ww condition at the vegetative stage.
Mondial and Sababa recorded low Tr (<9 mmolH2O m-2 s-2) compared to genotypes Sifra
and Tyson which recorded higher Tr (>15 mmolH2O m-2 s-2) under Wd condition at the
tuber initiation stage. Under Ww condition at the tuber initiation stage, Sifra recorded
significantly higher Tr (>20 mmolH2O m-2 s-2), whereas lower Tr (<13 mmolH2O m-2 s-2)
were observed for Mondial and Challenger.
During the tuber bulking stage all genotypes recorded higher Tr (>20 mmolH2O m-2 s-2)
except Electra recording slightly low Tr rate of 18.91 mmolH2O m-2 s-2 under Ww condition.
Bikini, Sababa and Mondial recorded higher Tr (>20 mmolH2O m-2 s-2) under Wd condition
at the tuber bulking stage, Panamera and Sababa showed a similar trend at maturity stage
under Wd condition. At maturity stage, Panamera, Sababa, Sifra and Tyson recorded the
highest Tr rate of >30.5 mmolH2O m-2 s-2, whereas Electra, Mondial, Bikini and Challenger
recorded lowest Tr rate of <24 mmol H2O m-2 s-2 under Ww condition.

65
Figure 3.1a: The effect of water deficit imposed at different growth stages on stomatal conductance (gs) of eight potato genotypes.

66
Figure 3.1b: Effect of water deficit imposed at four different growth stages on transpiration rate (Tr) of eight potato genotypes.

67
Genotypic differences (p < 0.05) were observed for A under Ww and Wd conditions across
growth stages (Figure 2). Water deficit during the vegetative stage significantly reduced A
rate of Sababa (32.13 μmol CO2 m−2 s−1) compared to Sifra, Bikini and Tyson which recorded
higher A rate (>40 μmol CO2 m−2 s−1). Tyson, Electra and Mondial recorded highest A rate
(i.e., 47.21, 46.86 and 46.01 μmol CO2 m−2 s−1, respectively) under Ww condition at the
vegetative stage. Under Wd condition during the tuber initiation stage, Tyson recorded a
significantly higher A rate of 48.67 μmol CO2 m−2 s−1 compared to other test genotypes.
Under Ww condition during the tuber initiation stage, most genotypes recorded A rate ˃53
μmol CO2 m−2 s−1. At the tuber bulking stage, all genotypes recorded A rates <29 μmol CO2
m−2 s−1 except Mondial which had a higher A rate of 30.07 μmol CO2 m−2 s−1 under Wd
condition. Under Ww condition during the tuber bulking stage, Electra recorded a higher A
rate (42.74 μmol CO2 m−2 s−1), whereas Panamera recorded the lowest A rate of 30.01 μmol
CO2 m−2 s−1. Water deficit during the maturity stage reduced A rate of genotypes Sifra and
Electra (<21 μmol CO2 m−2 s−1), whereas Challenger and Panamera recorded a high A rate
(>24 μmol CO2 m−2 s−1). The lowest A rate under Ww condition was recorded for Sifra (21
μmol CO2 m−2 s−1) compared to the highest A rates of 27.57 and 27.63, μmol CO2 m−2 s−1
were recorded Panamera and Bikini at maturity stage, respectively.

68
Figure 3.2: The effect of water deficit on the rate of photosynthesis at different growth stages of potato genotypes evaluated under well-watered
and water deficit conditions.
69
For IWUE, significant differences (p < 0.05) were observed among potato genotypes across
some growth stages under Ww and Wd conditions (Figure 3). Sababa, Challenger and
Panamera showed significantly higher IWUE (>2.50 µmolCO2 mmol-1 H2O) compared to
genotypes Bikini and Tyson which showed lower IWUE values (< 2.10 µmolCO2 mmol- 1
H2O) under Wd condition at the vegetative stage. Under Ww condition, Sababa, Panamera
and Electra recorded higher IWUE values (>3.50 µmolCO2 mmol-1 H2O), whereas Bikini and
Tyson displayed lower IWUE values of < 2.3 µmolCO2 mmol-1 H2O during the vegetative
stage. At the tuber initiation stage, IWUE of genotypes Mondial and Challenger were higher
(>4 µmolCO2 mmol-1 H2O) compared to Bikini, Sifra and Tyson which (< 4µmolCO2 mmol-1
H2O) under Wd condition. Mondial, Bikini and Sababa recorded significantly higher IWUE
(> 5.09 µmolCO2 mmol-1 H2O) whereas genotype Sifra recorded a lower IWUE (2.7
µmolCO2 mmol-1 H2O) under Ww condition.
Non-significant differences were observed among tested potato genotypes at the bulking
stage. At the maturity stage under Wd condition, Bikini, Mondial, Challenger and Electra
recorded higher IWUE values (>1.0 µmolCO2 mmol-1 H2O), whereas Panamera, Sababa,
Sifra and Tyson recorded lower IWUE values (<0.9 µmolCO2 mmol-1 H2O). The lowest
value of IWUE of 1.09 µmolCO2 mmol-1 H2O was recorded for Panamera compared to other
genotypes under Ww condition at the maturity stage.
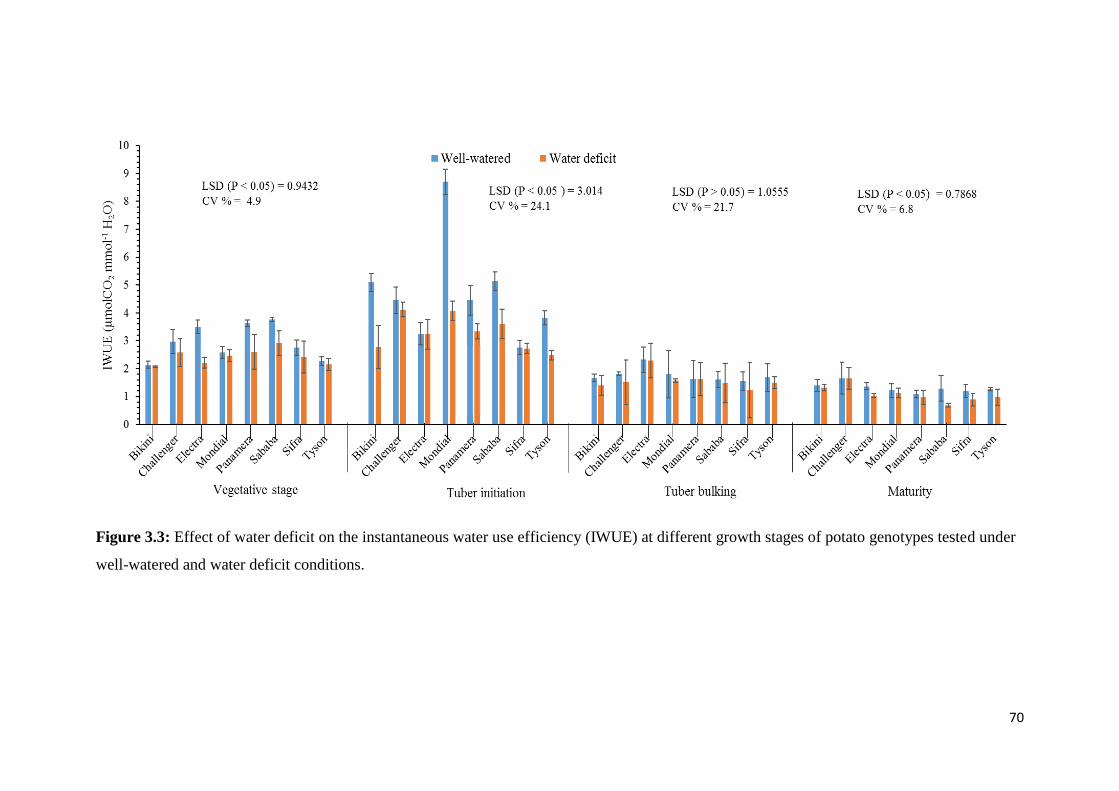
70
Figure 3.3: Effect of water deficit on the instantaneous water use efficiency (IWUE) at different growth stages of potato genotypes tested under
well-watered and water deficit conditions.

71
Genotypic differences (p < 0.05) were observed among genotypes across all growth stages for
CCI (Figure 4). Under Wd condition at the vegetative stage, Bikini, Challenger, Mondial,
Sifra and Tyson recorded higher CCI (> 42 %) compared to Sababa and Panamera which
recorded lower CCI (<37 %). Tyson recorded lower CCI of 31.40 % whereas Electra
recorded higher CCI (43.70 %) under Ww condition at the vegetative stage. At the tuber
initiation stage, Electra, Mondial, Challenger and Tyson recorded higher CCI of ˃ 35%,
whereas other test genotypes recorded CCI (<27 %) under Wd condition. Genotypes Bikini,
Electra, Mondial and Sifra recorded CCI >30 % compared to genotypes such as Challenger,
Panamera, Sababa and Tyson which recorded lower CCI (<29 %) under Ww condition.
At the tuber bulking stage, the water deficit significantly increased CCI of Bikini (34.95 %).
Mondial and Challenger recorded CCI (<29 %) compared to other studied genotypes. Bikini
recorded lowest CCI of 25% compared to Sifra and Panamera, which recorded higher CCI of
30.43 % and 30.25 % under Ww condition, respectively. At the maturity stage, Mondial and
Tyson showed significantly higher CCI of 38.68 and 35.3%, compared to Sifra and
Panamera, which recorded 21.40 and 21.20% under Wd condition, respectively. Challenger,
Mondial and Panamera recorded a higher CCI of 29 % whereas Sifra and Bikini recorded
lower CCI of 22.05 and 22.95 % under Ww condition at the maturity stage, respectively.

72
Figure 3.4: Effect of water deficit on chlorophyll content index (CCI) of eight potato genotypes imposed at four growth stages.

73
For RWC, genotypic differences were observed among genotypes across growth stages and
water conditions (Figure 5). Sifra and Tyson recorded RWC > 80% under Ww and Wd
conditions at the vegetative stage. Significantly, low RWC was observed for Bikini under
Ww condition (67.06%), whereas Bikini and Panamera recorded high RWC of 59.51 and
53.95% under Wd condition at the vegetative stage. High RWC of > 70% was recorded for
Sifra, Tyson, and Electra at the tuber initiation, tuber bulking and maturity stages under Ww
condition, whereas Bikini recorded lower RWC of < 67% under Ww condition across all
growth stages. During the vegetative stage under Wd condition genotype Panamera and
Bikini attained the lowest RWC of 53.95 and 59.51 % compared to other genotypes whereas
Sifra (88.86) and Tyson (85.66) recorded higher RWC%, also at the tuber initiation Bikini,
Sifra and Tyson recorded RWC < 53.34 %, while Sababa recorded higher RWC of 67.65%
under Wd condition. Challenger and Mondial recorded lowest RWC of 49.32 and 49.63%
respectively, during tuber bulking whereas Challenger, Electra, Sifra and Tyson recorded
RWC > 50% compared to other genotypes who recorded less than 50% during maturity
stages under Wd condition.
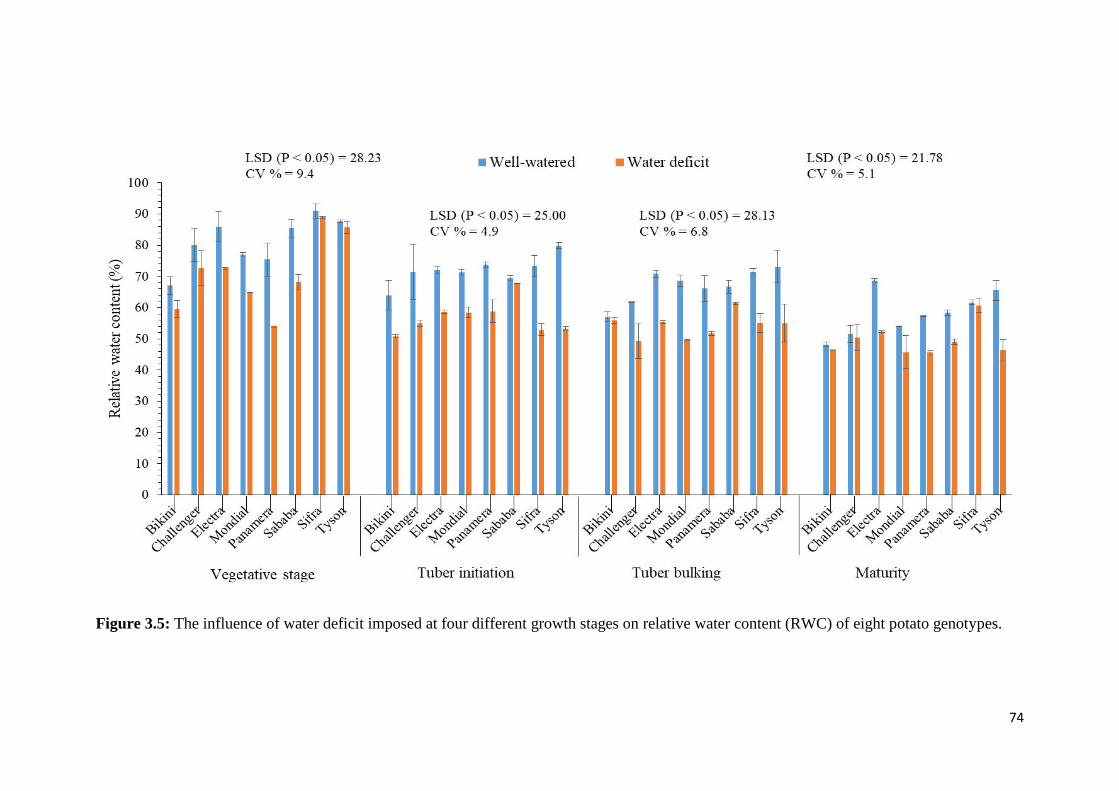
74
Figure 3.5: The influence of water deficit imposed at four different growth stages on relative water content (RWC) of eight potato genotypes.

75
3.4.3 Morphological response of potato genotypes under well-watered (Ww) and water
deficit (Wd) conditions across different growth stages
Mean values of PH and NL of studied potato genotypes evaluated under Ww and Wd
conditions are presented in Figures 6a and 6b. Non-significant genotypic differences were
observed at vegetative and tuber initiation stages under both Ww and Wd conditions (Figure
6a). Significant differences (p < 0.05) were observed for PH among potato genotypes at tuber
bulking and maturity growth stages. Genotypes Panamera, Mondial and Challenger recorded
taller plants of 83.30, 79.90 and 67.70 cm, in that order whereas Sifra and Bikini recorded
shorter plants of 49.30 and 53.30 cm under Ww during tuber initiation stage, respectively.
Under Wd condition, taller plants of 72.50 and 72.30 cm were recorded for Mondial and
Panamera compared to Sifra and Sababa which attained the lowest PH of 47.30 and 50.3 cm,
in the order. During the tuber bulking stage under Wd condition, the shortest plant height was
observed for genotypes Bikini (54.7 cm), Sifra (55.00 cm) and Sababa (56.00 cm). Genotypes
with taller plants under Wd condition at the tuber initiation stage were Panamera (74.7 cm),
Mondial (72.70 cm) and Tyson (70.70 cm). Under Ww condition, tallest plants were
observed for genotypes Mondial (99.00 cm) and Panamera (88.00 cm); whereas Tyson (59.30
cm) and Sifra (61.00 cm) recorded lowest PH during tuber bulking stage. At the maturing
stage, the highest PH of 102.3, 110.00 and 82.30 cm was recorded for genotypes Panamera,
Mondial and Challenger, in that order compared to the low PH of 66.70, 72.00 and 73.30 cm
for Bikini, Tyson and Sifra under Ww condition, respectively. Genotypes Panamera (78.70
cm), Mondial (78.00 cm) and Tyson (74.30 cm) recorded highest PH under Wd condition
compared with Sababa (60.3 cm), Electra (60.70 cm) and Sifra (61.30 cm).
The number of leaves per plant differed significantly (p < 0.05) among studied potato
genotypes under Ww and Wd conditions across all growth stages (Figure 6b). Under Ww
condition, genotypes Mondial and Panamera produced the highest number of leaves per plant
during vegetative (˃ 17), tuber initiation (> 29), tuber bulking (> 39) and maturity stages (>
50). While under Wd condition, genotypes Mondial and Panamera and Tyson recorded a
higher number of leaves per plant during tuber initiation (˃ 24), tuber bulking (˃ 35) and
maturity stages (˃ 40), during vegetative stage Challenger, Mondial, Panamera and Tyson
had (> 13).
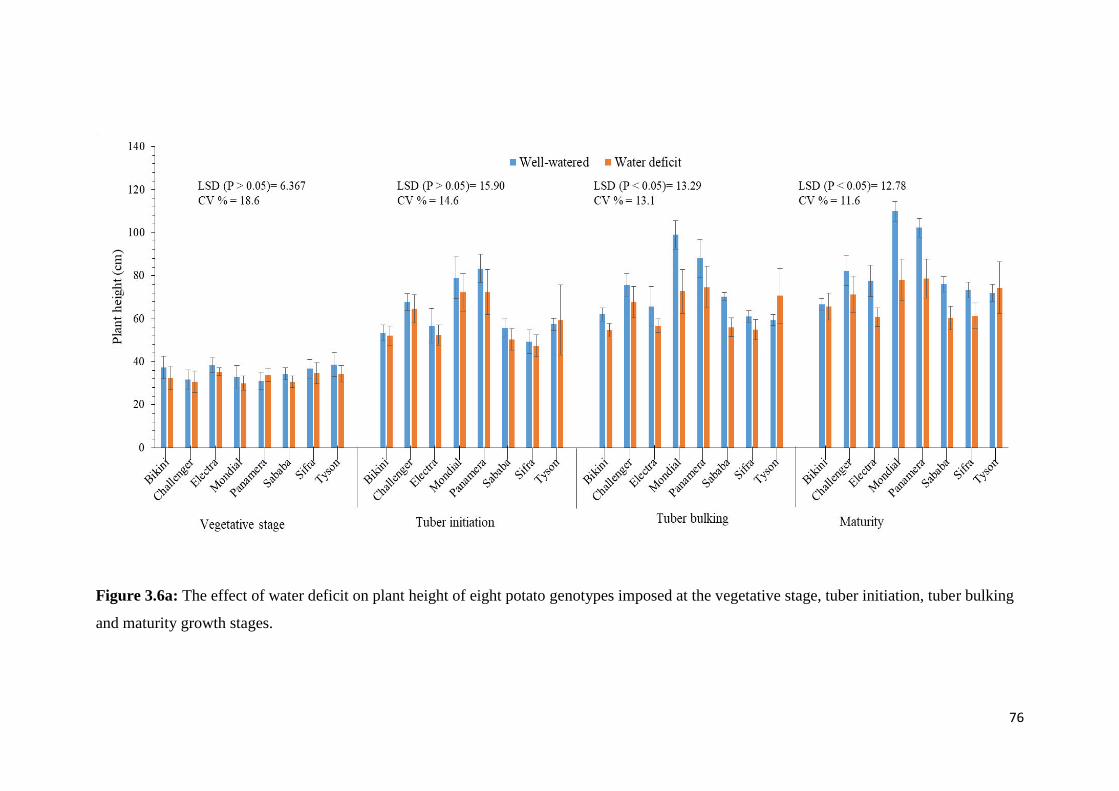
76
Figure 3.6a: The effect of water deficit on plant height of eight potato genotypes imposed at the vegetative stage, tuber initiation, tuber bulking
and maturity growth stages.

77
Figure 3.6b: Effect of water deficit imposed at four different growth stages on the number of leaves per plant of eight potato genotypes.

78
Across all growth stages, genotypes differed significantly (p < 0.05) for tuber yield under
Ww and Wd conditions (Figure 7). Genotypes Electra, Challenger and Mondial recorded
significantly higher tuber yields (˃ 430 g) under Ww condition at the vegetative stage.
Genotypes Bikini Challenger, Electra, Mondial and Tyson produced higher fresh yield (˃310
g) compared to Sababa (203.0 g), Sifra (266.0 g) and Panamera (254.0 g) which produced
lower tuber yields under Wd condition at the vegetative stage. During the tuber initiation
stage, Mondial and Sifra were high-yielding (˃ 450 g) under Ww condition, whereas
Challenger and Sifra recorded significantly higher yields of 181 and 217.4 g under Wd
condition. Under Ww condition, genotypes Challenger, Mondial, Sifra and Tyson recorded
higher tuber yields during tuber bulking (˃ 430 g) and maturity stages (˃ 390 g). Genotype
Tyson produced the highest tuber yield while the lowest obtained for Bikini, Mondial and
Panamera under Wd condition during tuber bulking and maturity stages.

79
Figure 3.7: Effect of water deficit on tuber yield of eight potato genotypes under well-watered and water deficit conditions at different growth
stages.

80
The mean values of total above-ground biomass (TAG) of evaluated potato genotypes under
Ww and Wd conditions are presented in Figure 8. Genotypes differed significantly (p < 0.05)
for TAG across water treatments and growth stages for TAG. Under Ww condition at the
vegetative stage, genotypes Electra and Panamera recorded significantly higher TAG (>45 g),
whereas genotypes Sifra and Tyson recorded lower TAG (< 27 g). Under Wd condition at the
vegetative stage higher TAG of > 35 g was recorded for Sifra and Electra compared to lower
TAG of < 20 g recorded for Mondial and Challenger. Under Ww condition during the tuber
initiation stage, the highest TAG (> 63 g) was recorded for Bikini, Panamera and Sababa
compared to other test genotypes. Under Wd condition during the tuber initiation stage,
Bikini recorded the highest TAG of 44.19 g compared to other test genotypes.
At the tuber bulking stage, the highest TAG was recorded for genotype Bikini and Sifra under
both Ww (64.86 and 41.10 g, respectively) and under Wd conditions (i.e., 57.42 and 61.63 g,
respectively). At the maturity stage, the highest TAG was recorded for genotypes Bikini,
Electra and Panamera under both Ww (57.35, 76.47 and 71.93 respectively) and Wd (50.61,
72.20 and 68.99, respectively) conditions compared to other test genotypes.
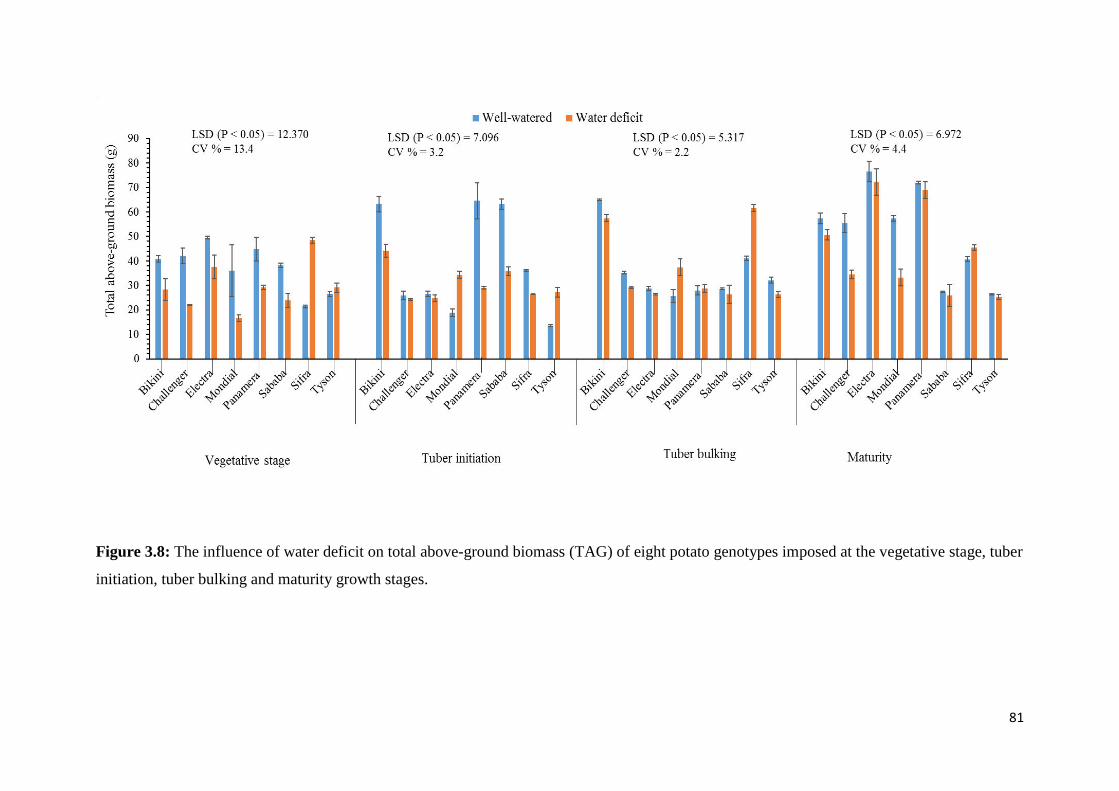
81
Figure 3.8: The influence of water deficit on total above-ground biomass (TAG) of eight potato genotypes imposed at the vegetative stage, tuber
initiation, tuber bulking and maturity growth stages.

82
3.4.4 Correlations coefficients among morphological and physiological traits under well-
watered and water-deficit conditions across growth stages
Pearson’s correlation coefficients (r) revealing the level of associations for studied traits of
among potato genotypes under well-watered and water deficit conditions at different growth
stages are presented in Table 5. TY was significantly and negatively correlated with gs (r = -
0.81; p = 0.05) and IWUE (r = -0.77; p = 0.05) at the vegetative stage under Wd condition.
Under Ww condition, TY positively and significantly correlated with IWUE (r = 0.94 p =
0.001) at the vegetative stage. At tuber initiation stage under Wd condition, TY negative and
significantly correlated with RWC (r = -0.87; p = 0.01) and CCI (r = -0.89; p = 0.01) but
positively correlated with PH (r = 0.91; p = 0.001), Tr (r = 0.63; p = 0.001), A (r = 0.94; p =
0.01) and IWUE (r = 0.87; p = 0.01). Non-significant and poor correlations were observed
between TY with other traits observed at the tuber bulking stage under both conditions. TY
negatively and significantly correlated with CCI (r = -0.71; p = 0.05) and TAG (r = -0.85; p =
0.01) under Wd condition at the maturity stage.

83
Table 3.4: Pearson correlation coefficients (r) showing associations of morphological and physiological traits of 8 selected potato
genotypes under well-watered (lower diagonal) and water deficit (upper diagonal) conditions at different growth stages.
Vegetative stage
Traits PH NL TAG gs Tr A IWUE RWC CCI TY
PH
0.14ns 0.66ns 0.52ns -0.19ns -0.09ns 0.60ns 0.20ns 0.01ns -0.66ns
NL 0.81*
0.01ns 0.75* 0.57ns 0.24ns 0.37ns 0.78* 0.73* -0.34ns
TAG -0.40ns -0.17ns
0.55ns 0.11ns 0.45ns 0.63ns 0.49ns 0.43ns -0.69ns
gs 0.83** 0.67* -0.01ns
0.51ns 0.43ns 0.60ns 0.87** 0.73* -0.81*
Tr 0.78* 0.55ns -0.21ns 0.80**
0.88** -0.19ns 0.65ns 0.63ns -0.10ns
A -0.11ns 0.11ns 0.06ns 0.12ns 0.21ns
-0.10ns 0.60ns 0.60ns -0.22ns
IWUE 0.29ns 0.43ns -0.39ns -0.05ns 0.17ns 0.27ns
0.58ns 0.54ns -0.77*
RWC 0.11s 0.25ns -0.41ns -0.22ns 0.12ns 0.36ns 0.93***
0.96*** -0.66ns
CCI 0.22ns 0.45ns -0.27ns 0.01ns 0.22ns 0.57ns 0.93*** 0.87**
-0.50ns
TY 0.03ns 0.28ns -0.34ns -0.33ns -0.06ns 0.30ns 0.94*** 0.93*** 0.89**
Tuber initiation
Traits
PH NL TAG gs Tr A IWUE RWC CCI TY
PH 0.97*** 0.51ns -0.62ns 0.33ns 0.96*** 0.92*** -0.97*** -0.98*** 0.91***
NL 0.97*** 0.58ns -0.63ns 0.51ns 0.96*** 0.94*** -0.96*** -0.96*** 0.96ns
TAG 0.65** 0.69** -0.22ns 0.45ns 0.68* 0.67ns -0.47ns -0.57ns 0.59ns
gs -0.19ns -0.23ns -0.30ns -0.39ns -0.61ns -0.51ns 0.60ns 0.60ns -0.64ns
Tr 0.36ns 0.43ns 0.63** -0.75*** 0.41ns 0.46ns -0.39ns -0.27ns 0.63***
A 0.89*** 0.92*** 0.68** -0.43ns 0.48* 0.91*** -0.91*** -0.96*** 0.94**
IWUE 0.69** 0.77*** 0.44ns -0.16ns 0.11ns 0.77*** -0.92*** -0.93*** 0.87**
RWC -0.68** -0.76*** -0.48* 0.27ns -0.32ns -0.73*** -0.78*** 0.94*** -0.87**
CCI -0.47ns -0.49* -0.04ns 0.27ns 0.04ns -0.66** -0.76*** 0.54* -0.89**
TY -0.02ns 0.09ns 0.01* -0.67** 0.36ns 0.36ns 0.38ns -0.44ns -0.60***
Tuber bulking
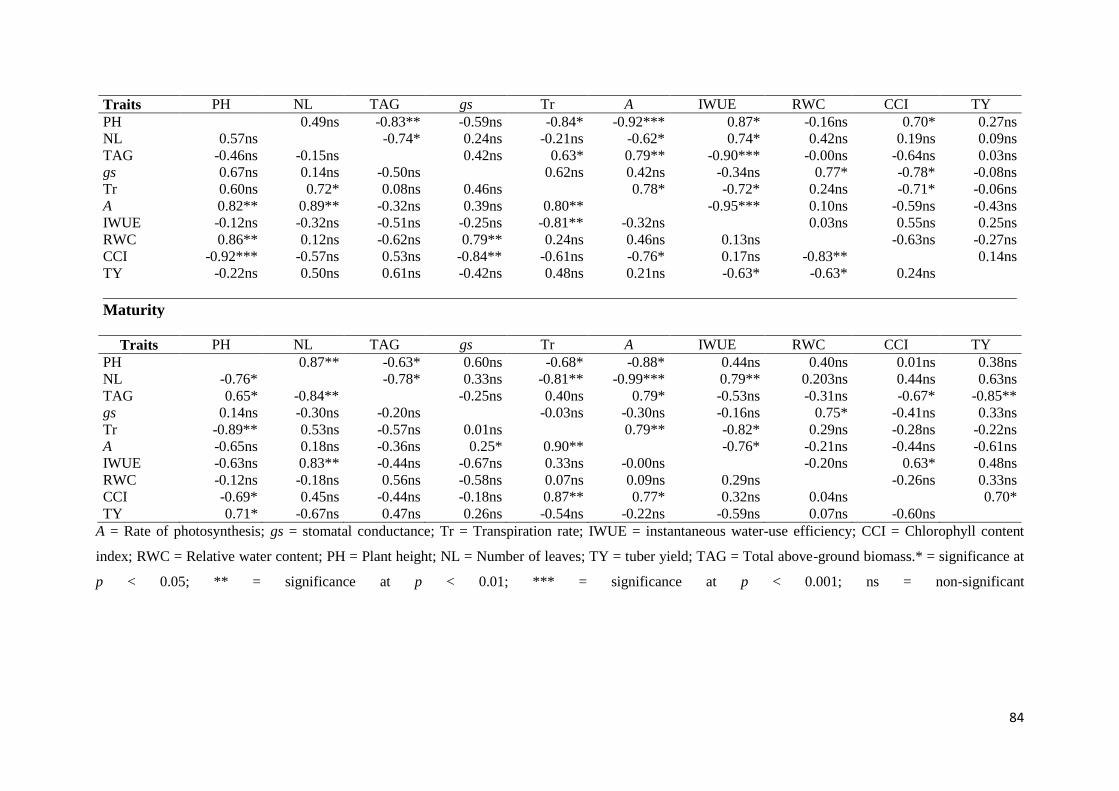
84
A = Rate of photosynthesis; gs = stomatal conductance; Tr = Transpiration rate; IWUE = instantaneous water-use efficiency; CCI = Chlorophyll content
index; RWC = Relative water content; PH = Plant height; NL = Number of leaves; TY = tuber yield; TAG = Total above-ground biomass.* = significance at
p < 0.05; ** = significance at p < 0.01; *** = significance at p < 0.001; ns = non-significant
Traits PH NL TAG gs Tr A IWUE RWC CCI TY
PH 0.49ns -0.83** -0.59ns -0.84* -0.92*** 0.87* -0.16ns 0.70* 0.27ns
NL 0.57ns -0.74* 0.24ns -0.21ns -0.62* 0.74* 0.42ns 0.19ns 0.09ns
TAG -0.46ns -0.15ns 0.42ns 0.63* 0.79** -0.90*** -0.00ns -0.64ns 0.03ns
gs 0.67ns 0.14ns -0.50ns 0.62ns 0.42ns -0.34ns 0.77* -0.78* -0.08ns
Tr 0.60ns 0.72* 0.08ns 0.46ns 0.78* -0.72* 0.24ns -0.71* -0.06ns
A 0.82** 0.89** -0.32ns 0.39ns 0.80** -0.95*** 0.10ns -0.59ns -0.43ns
IWUE -0.12ns -0.32ns -0.51ns -0.25ns -0.81** -0.32ns 0.03ns 0.55ns 0.25ns
RWC 0.86** 0.12ns -0.62ns 0.79** 0.24ns 0.46ns 0.13ns -0.63ns -0.27ns
CCI -0.92*** -0.57ns 0.53ns -0.84** -0.61ns -0.76* 0.17ns -0.83** 0.14ns
TY -0.22ns 0.50ns 0.61ns -0.42ns 0.48ns 0.21ns -0.63* -0.63* 0.24ns
Maturity
Traits PH NL TAG gs Tr A IWUE RWC CCI TY
PH 0.87** -0.63* 0.60ns -0.68* -0.88* 0.44ns 0.40ns 0.01ns 0.38ns
NL -0.76* -0.78* 0.33ns -0.81** -0.99*** 0.79** 0.203ns 0.44ns 0.63ns
TAG 0.65* -0.84** -0.25ns 0.40ns 0.79* -0.53ns -0.31ns -0.67* -0.85**
gs 0.14ns -0.30ns -0.20ns -0.03ns -0.30ns -0.16ns 0.75* -0.41ns 0.33ns
Tr -0.89** 0.53ns -0.57ns 0.01ns 0.79** -0.82* 0.29ns -0.28ns -0.22ns
A -0.65ns 0.18ns -0.36ns 0.25* 0.90** -0.76* -0.21ns -0.44ns -0.61ns
IWUE -0.63ns 0.83** -0.44ns -0.67ns 0.33ns -0.00ns -0.20ns 0.63* 0.48ns
RWC -0.12ns -0.18ns 0.56ns -0.58ns 0.07ns 0.09ns 0.29ns -0.26ns 0.33ns
CCI -0.69* 0.45ns -0.44ns -0.18ns 0.87** 0.77* 0.32ns 0.04ns 0.70*
TY 0.71* -0.67ns 0.47ns 0.26ns -0.54ns -0.22ns -0.59ns 0.07ns -0.60ns

85
3.4.5 Principal component biplot analysis for assessed agronomic and physiological
traits under well-watered and water-deficit conditions across growth stages
Principal component analysis (PCA) biplot analysis showing percent variance for PC1 and
PC2 measured morphological and physiological traits for studied genotypes under Ww and
Wd conditions across four growth stages is shown in Figure 9.
All evaluated genotypes that performed better in a specific measured trait were grouped
nearby and furthest to the vector line. Under Wd condition, Bikini and Challenger were
differentiated from the other genotypes based on high tuber yield at the vegetative stage
(Figure 9a). Under Wd condition at the vegetative stage, Tyson and Sifra are far apart from
other genotypes based on NL, CCI, RWC and gs. At tuber initiation (Figure 9b) under Wd
condition Bikini, Challenger, Mondial and Electra were grouped together based on high CCI,
RWC and gs. No distinctive grouping was observed for genotypes under Wd condition at the
tuber bulking stage (Figure 9c). Panamera, Sababa, Sifra and Tyson grouped displaying high
Tr, A and TAG under Wd condition during the maturity stage (Figure 9d).
Under Ww condition during vegetative stage (Figure 9A) genotypes Electra, Sababa and
Tyson were grouped together based on high values for TAG. At the tuber initiation stage
(Figure 9B), no clear grouping patterns were observed for genotypes and assessed traits.
During the tuber bulking (Figure 9C) Electra, Mondial and Panamera were grouped together
recording higher values for A, Tr and NL. At the maturity stage (Figure 9D) Challenger,
Electra and Tyson were grouped together recording higher CCI, IWUE and NL (Figure 9D).

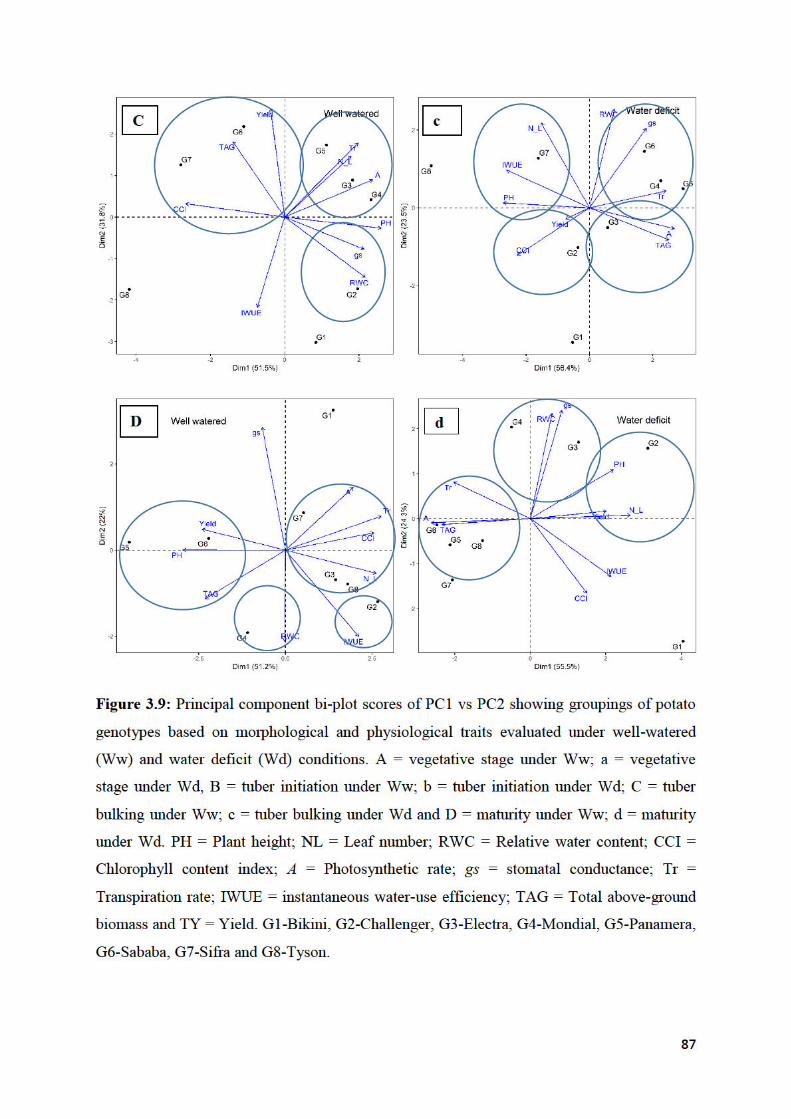

88
3.5 Discussion
Drought stress occurring during critical growth stages in potato results in low yield potential
under water-stress conditions. Developing potato genotypes with tolerance to crop growth
stages such as vegetative stag, tuber initiation, tuber bulking and maturity expand terms, is
key to improving potato yield outputs and gains (Hassan et al., 2002; Alsharari et al., 2007;
Al-Mahmud et al., 2015). The current study evaluated drought tolerance of potato (Solanum
tuberosum L.) genotypes at different growth stages based on physiological and morphological
traits assessed under well- and water-deficit conditions. The significant interaction between
genotypes x water deficit x growth stage for studied traits indicated genotypes performed
differently across different growth stages (Table 3). This is useful to identify and select
potato genotypes with specific growth stage adaptation for a recommendation for cultivation.
For example, genotypes such as Bikini, Electra and Mondial with high-yield potential under
water deficit conditions at the vegetative stage are useful for breeding or cultivation (Figure
7). Water deficit significantly reduced yield at tuber initiation and tuber bulking stage. Tuber
initiation drought tolerant genotypes including Sifra and Challenger while Tyson and Sifra
were high at tuber bulking. Tyson, Challenger and Electra had good yield performance at the
maturity stage under water deficit are useful for cultivation under a low water supply
environment.
Physiological and morphological traits are widely targeted in potato enhancement
programmes to develop high-yielding genotypes with improved levels of abiotic stress
tolerance (Tourneux et al., 2003a; b; Alsharari et al., 2007; Mahmud et al., 2016; Ramirez et
al., 2016; Hirut et al., 2017; Elzner et al., 2018). The current study revealed positive and
significant correlations between rates of photosynthesis with transpiration at the vegetative
stage (Table 4). Total-above ground, plant height and number of leaves can be selected to
improve the rate of photosynthesis during the tuber initiation under water deficit. However, at
the tuber bulking and maturity stage, negative but significant correlations between the rate of
photosynthesis with plant height and number of leaves were observed.
The negative or poor correlations between agronomic traits such as plant height, number of
leaves and total above-ground biomass with tuber yield at the vegetative and the tuber
bulking stages suggest that studied genotypes consist of unique genes. This means they are
capable of manipulating potato yields regardless of the high total above ground. This also
explains the reason why plant height and a number of leaves were unaffected by water deficit
at the tuber initiation, however, the total yield was reduced (Figure 7). The traits, such as

89
plant height, transpiration, photosynthesis and instantaneous water-use efficiency during the
tuber initiation and chlorophyll content index at maturity are positively correlated with total
yield, which can be used as selection conditions to improve yield genotype under water
deficit.
3.6 Conclusion
The present study evaluated drought response of potato genotypes to water deficit imposed at
different growth stages to select drought-tolerant genotypes that best suited to be cultivated in
environments with restricted water. Genotypes with a higher water use efficiency and high
yield were identified as the most tolerant genotypes since they responded consistently at
various stages under water deficit. Therefore, it can be proposed from the assessed genotypes
that Bikini and Tyson were tolerant to water deficit at the vegetative stage. Electra and Tyson
were tolerant to water deficit at tuber initiation. Electra and Panamera were tolerant at tuber
bulking while Bikini and Challenger were tolerant to water deficit at the maturity stage.
These genotypes can be recommended in environments with water stress and still produce
optimum yields. Meanwhile Sababa, Sifra and Tyson were identified as most sensitive
genotypes.
90
3.7 References
Adhikari, R.C., 2009. Effect of NPK on vegetative growth and yield of desiree and kufri
sindhuri potato. Nepal Agriculture Research Journal, 9: 67-75.
Akyol, H., Riciputi, Y., Capanoglu, E., Caboni, M.F., Verardo, V., 2016. Phenolic
compounds in the potato and it’s by products: an overview. International Journal of
Molecular Sciences, 17, 835; doi:10.3390/ijms17060835.
Al-Mahmud, A., Hossain, M.M., Zakaria, M., Mian, M.A.K., Karim, M.A., 2015. Effects of
water stress on plant canopy, yield attributes and yield of potato. Kasetsart Journal
(Natural Science) 49: 491-505.
Alsharari, S.F., Alsadon, A.A., Alharbi, A.R., 2007. Evaluation of drought tolerance of potato
cultivars under greenhouse conditions. Acta Horticulture, 747: 67-74.
Anithakumari, A.M., 2011. Genetic dissection of drought tolerance in potato. Thesis,
Wageningen University.
Ayas, S., Korukcu, A., 2010. Water-yield relationships in deficit irrigated potato. Journal of
Agricultural Faculty of Uludag University, 24(2): 23-36.
Chauvin, N.D., Mulangu, F., Porto, G., 2012. Food production and consumption trends in
sub-Saharan Africa: prospects for the transformation of the agricultural sector. United
Nation Development Programme, 24-26.
DAFF, [Department of Agriculture, Forestry and Fisheries]. 2017. Trends in the Agricultural
Sector. Directorate Communication Services.
El-Wahab, M.A.A., Toaima, W.I.M., Hamed, E.S., 2016. Effect of different planting
locations in Egypt on volatile oil of geranium (pelargonium graveolens L.) plant.
Journal of basic and applied Research, 2(4): 522-533.
Elzner, P., Juzl, M., Kasal, P., 2018. Effect of different drip irrigation regimes on tuber and
starch yield of potatoes. Plant Soil Environment, 64: 546-550.
FAOSTAT. 2019. http://www.fao.org/faostat/en/#data/QC (Accessed on the 19/12/2019).

91
Haverkort, A.J., Franke, A.C., Engelbrecht, F.A., Steyn, J.M., 2013. Climate change and
potato production in contrasting South African agro-ecosystems 1. Effects on land and
water use efficiencies. Potato Research, 56: 31-50.
Hirut, B., Shimelis, H., Fentahun M., Bonierbale, M., Gastelo M., Asfaw A., 2017.
Combining ability of highland tropic adapted potato for tuber yield and yield
components under drought. PLoS One 12(7): e0181541.
https://doi.org/10.1371/journal.pone.0181541.
Kalina, D.S., Plich, J., Zyta, D.S., Sliwka, J., Marczewski, W., 2016. The effect of drought
stress on the leaf relative water content and tuber yield of a half-sib family of
‘Katahdin’-derived potato cultivars. Breeding Science 66(2): 328-331.
Kapuya, T., Sihlobo, W., 2015. South Africa’s commercial and seed potato exports:
Identifying potential market opportunities in Africa. Trade Intelligence Report
https://agbiz.co.za/uploads/AgbizNews/15101Potato.pdf (Accessed on the
23/09/2019).
Kiptoo, S., Kipkorir, E.C., Kiptum, C.K., 2018. Effects of deficit irrigation and mulch on
yield and quality of potato crop. African Journal of Education, Science and
Technology, 4(4): 65-77.
Lahlou, O., Ouattar, S., Ledent, J.-F., 2003. The effect of drought and cultivar on growth
parameters, yield and yield components of potato. Agronomie, 23: 257-268.
Lawlor, D.W., Tezara, W., 2009. Causes of decreased photosynthetic rate and metabolic
capacity in water-deficient leaf cells: a critical evaluation of mechanisms and
integration of processes. Annals of Botany, 103: 561-579.
Lisar, S.Y.S., Motafakkerazad, R., Hossain, M.M., Rahman, I.M.M., 2012. Water stress in
plants: causes, effects and responses. In: Ismail Md, Mofizur Rahman, editors. ISBN:
978-953-307-963-9.
Liu, F., Jensen, C.R., Shahanzari, A., Andersen, M.N., Jacobsen, S.E., 2005. ABA regulated
stomatal and photosynthetic water use efficiency of potato (Solanum tuberosum L.)
during progressive soil drying. Plant Science, 168: 831-836.

92
Mahmud, A.A., Rahman, M.M., Bazzaz, M.M., Banu, M.A. Mamun, M.A.A., Rahaman,
E.H.M.S., 2016. Growth biomass distribution and yield of potato under water stress
and non-stress conditions. Bangladesh Horticulture, 2(2): 81-93.
Mashilo, J., Odindo, A.O., Shimelis, H.A., Musenge, P., Tesfay, S.Z., Magwaza, L.S., 2017.
Drought tolerance of selected bottle gourd [Lagenaria siceraria (Molina) Standl.]
landraces assessed by leaf gas exchange and photosynthetic efficiency. Plant
Physiology and Biochemistry, 120:75-87.
Maxwell, K., Johnson, G.N., 2000. Chlorophyll fluorescence a practical guide. Journal of
Experimental Botany, 51: 659-668.
Meier, U., 2001. Growth stages of mono-and dicotyledonous plants, BBCH Monograph.
Federal Biological Research Centre for Agriculture and Forestry.
https://www.politicheagricole.it/flex/AppData/WebLive/Agrometeo/MIEPFY800/BB
CHengl2001.pdf (Accessed on 13/06/2019).
Monneveux, P., Rekika, D., Acevedo, E., Merah, O., 2006. Effect of drought on leaf gas
exchange, carbon isotope discrimination, transpiration efficiency and productivity in
the field grown durum wheat genotypes. Plant Science, 170:867-872.
Obidiegwu, J.E., Bryan, G.J., Jones, H.G., Prashar, A., 2015. Coping with drought: stress and
adaptive responses in potato and perspectives for improvement. Frontier in Plant
Science, 6: 542.
Ramirez, D.A., Yactayo, W., Gutierrez, R., Mares, V., De Mendiburu, F., Posadas, A.,
Quiroz, R., 2014. Chlorophyll concentration in leaves is an indicator of potato tuber
yield in water-shortage conditions. Scientia Horticulture, 168: 202-209.
Ramirez, D.A., Yactayo, W., Rens, L.R., Rolando, J.L., Palacios, S., De Mendiburu, F.,
Mares, V., Barreda, C., Loayza, H., Monneveux, P., Zotarelli, L., Khan, A., Quiroz,
R., 2016. Defining biological thresholds associated to plant water status for
monitoring water restriction effects: Stomatal conductance and photosynthesis
recovery as key indicators in potato. Agricultural Water Management, 177: 369-378.
Rijkers, T., Pons, T. L., Bongers, F., 2000. The effect of tree height and light availability on
photosynthetic leaf traits of four neotropical species differing in shade tolerance.
Functional Ecology, 14: 77-86.

93
Rodriguez-Perez, L., Nustez, C.E.L., Moreno, L.P.F., 2017. Drought stress affects
physiological parameters but not tuber yield in three Andean potato (Solanum
tuberosum L.) cultivars. Agronomia Colombiana, 35(2): 158-170.
Rolando, J.L., Ramirez, D.A., Yactayo, W., Monneveux, P., Quiroz, R., 2015. Leaf
greenness as a drought tolerance related trait in potato (Solanum tuberosum L.).
Environmental and Experimental Botany, 110: 27-35.
Rosales-Serna, R., Kohashi-Shibata, J., Acosta-Gallegos, J.A., Trejo-Lopez, C., Ortiz-
Cereceres, J., Kelly, J.D., 2004. Biomass distribution, maturity acceleration and yield
in drought -stressed common bean cultivars. Field Crops Research, 85: 203-211.
Tourneux, C., Devaux, A., Camacho, M.R., Mamani, P., Ledent, J.F., 2003a. Effects of water
shortage on six potato genotypes in the highlands of Bolivia (I): morphological
parameters, growth and yield. Agronomie, 23: 169-179.
Tourneux, C., Devaux, A., Camacho, M.R., Mamani, P., Ledent, J.F., 2003b. Effect of water
shortage on six potato genotypes in the highlands of Bolivia (II): water relations,
physiological parameters. Agronomie, 23: 181-190.
Wassu, M., 2017. Genotype x environment interaction, stability and co-heritability of tuber
internal quality traits in potato (Solanum tuberosum l.) cultivars in Ethiopia. African
Journal of Food, Agriculture and Nutrition and Development, 17(4): 12930-12952.

94
Chapter 4: The effect of water deficit on yield performance and tuber quality of
different potato genotypes
4.1 Abstract
Selection of drought-tolerant (Solanum tuberosum L.) genotypes is essential to enhance tuber
yield and quality for food and processing. The aim of the study was to evaluate effect of
water deficit on tuber yield and quality and drought-tolerant varieties and growth stages.
Tuber quality of eight potato genotypes were evaluate under well-watered (Ww) and water-
deficit (Wd) conditions through four different growth stages namely: (i.e. vegetative (VG),
tuber initiation (TI), tuber bulking (TB) and maturity (MAT) stages using an 8×4×2 factorial
treatment with three replications. Data was collected on yield traits such as tuber yield (TY),
number of tubers (NT), tuber size distribution (TSD) and dry matter content (DMC).
Significant (p < 0.05) genotype x water condition x growth stage effect were observed for
TY, NT, TSD and DMC indicating varied response of genotypes to water condition across
growth stages. This is useful to recommend tolerant potato genotypes at growth-stage specific
for processing industry. Correlation analysis shown significant and positive associations
among medium tubers and yield (r = 0.76; p = 0.05) also between large tubers and number of
tuber (r = 0.42; p = 0.05) at VG stage, DMC and yield (r = 0.79; p = 0.010) at TI stage and
highly significant negatively correlated with NT (r = -0.94; p = 0.001) at TB stage. Mondial
and Sifra produced high percentage of medium (35-55 mm) and large tubers (>55 mm) across
growth stages. Genotypes Bikini, Mondial, Sababa and Sifra were identified as tolerance
genotypes to water deficit due to high yield potential and suitable for processing industry.
Keywords: Potato; genotypes; growth stages; water deficit; yield; quality.

95
4.2 Introduction
The production of the potato (Solanum tuberosum L.) guarantees that it has the potential for
contributing significantly to the alleviation of hunger and to the world’s food requirement
(Dreyer, 2017; Ayyub et al., 2019). It is one of the important vegetables which is known for
playing a vital role in food and nutrition security in South Africa (van Niekerk et al., 2016;
Dreyer, 2017). It rich in nutrients such as copper, iron, magnesium, manganese, potassium,
phosphorous and zinc (Ngobese et al., 2017; Gultekin and Ertek, 2018). The crop known to
be source of energy, highly in carbohydrate, proteins and amounts of vitamin C (Ayyub et al.,
2019). The global production of potato is approximately 374 million tonnes (Obidiegwe et
al., 2015), of which comes from five leading producing countries which include Chine
(26.3%), India (12.5%), Russia (7.62%), Ukraine (5.72%) and United States of America
(5.15%) (FAOSTAT, 2019). It is mostly used for mashed potatoes, chips, French fries,
croquettes or soups (VIB Facts Series, 2019). Potato comes third after maize and wheat
among crops produced in the country (Ngobese et al., 2017; Cavalcante et al., 2019). The
production of potatoes in South Africa occurs in 16 different geographic regions (van
Niekerk et al., 2016). However, the production has been threaten by various factors such as
drought leading in poor tuber quality produced unsuitable for processing (Levy et al., 2013;
Kiptoo et al., 2018). The product’s demand is increasing at a high rate and that have driven
the expansion of the processing industry and the necessity to evaluate a number of newly
introduced genotypes that can be used for production in South Africa.
Drought stand-out as one of the factors affecting potato tuber quality (Monneveux et al.,
2013). Traits including tuber size distribution, dry matter content, reducing sugar and specific
gravity are important characteristics of potato tuber internal quality that are intended for the
processing industry (Tabatabaeefar, 2002; Muthoni and Kabira, 2016). Tuber size distribution
is very important for processing and fresh markets that have specific preferences. Irregular
tuber size distribution might not satisfy the desires of the consumer and that might be costly
to the producer (Denner et al., 2012). Water deficit reduce number of tubers during the
vegetative stage, and number of tubers during tuber initiation stage; whereas at tuber bulking
and maturity stages affects tuber size and quality (Obidiegwu et al., 2015). Available
information does not specify or identify the growth stage that produced smaller and irregular
tuber size when exposed to water deficit. Thus, it is necessary to know which potato growth
stage is likely to give smaller, medium or bigger tuber size after imposing water deficit at

96
different growth stages. This information would assist in understanding the target market or
consumers' desires in terms of size distribution and internal quality.
The impact of water deficit on potato yield and quality differs from developmental stages
(Stark et al. 2013). Various field studies have reported that limited water during the
vegetative stage and tuber initiation adversely affect potato yield (Abbas and Ranjan, 2015;
Al-Mahmud et al., 2015). Although the literature has shown that water deficit at vegetative
stage and tuber initiation results in lower yield and poor quality, the impact of water deficit
on potato genotypes imposed at the vegetative stage, tuber initiation, tuber bulking and
maturity has never been assessed in South Africa. There is very little available information on
the actual potato yield loss due to moisture stress.
The South Africa research attempts on potato production under limited water have focussed
on growth and yield quality (Steyn et al., 1998). Scant information is available about the
effects of water deficit on different potato tuber quality, size distribution and nutritional
status. It is crucial to examine and also identify less sensitive potato growth stages and
genotypes where water can be withheld, hence improving yield. This would assist potato
growers in decision making and planning when to increase or decrease irrigation. It is
hypothesized that drought tolerance may be linked to genotype and environmental conditions.
Hence, the specific objective of this study was to determine the effect of water deficit
imposed at different growth stages on yield performance and tuber quality of different potato
genotypes.

97
4.3 MATERIAL AND METHODS
4.3.1 Plant materials
Certified seed (i.e. generation 1-3) of eight potato genotypes namely: Bikini (G1), Challenger
(G2), Electra (G3), Mondial (G4), Panamera (G5), Sababa (G6), Sifra (G7), and Tyson (G8)
were sourced from Wes grow Pretoria, South Africa and used for the study. This are highly
demanded and newly introduced genotypes for potato the industry in South Africa, hence
selected for evaluation.
4.3.2 Description of a controlled environment
An experiment was conducted at the University of KwaZulu-Natal’s Controlled Environment
Research Unit (CERU), Pietermaritzburg, South Africa. The environmental conditions inside
the tunnel were semi-controlled with the average day and night temperatures of 38 °C and 18
°C, respectively, whereas relative humidity ranged between 45 % - 55 %. Temperature and
relative humidity were monitored electronically using a data logger (HOBO 2K logger, Onset
Computer Corporation, Bourne, USA). The experiment was planted on the 16th of December
2018 and terminated on the 14th of April 2019.
4.3.3 Experimental design and trial management
The study was conducted using an 8×4×2 factorial treatment structure arranged in
randomized complete blocks design with three replications resulting in 192 experimental
units (i.e. 10 L drained polyethylene pots). The experiment comprised of the following
factors: potato genotypes- 8 levels (Bikini, Challenger, Electra, Mondial, Panamera, Sababa,
Sifra, and Tyson); growth stages - 4 levels (vegetative stage, tuber initiation, tuber bulking
and maturity) and watering regimes -2 levels (Well-watered [Ww] and Water deficit [Wd]
conditions). A loamy soil with known chemical (Table 1) and physical properties (Table 1)
collected from Ukulinga Research Farm (29° 39′48.82″S; 30° 24′19.89″E), Pietermaritzburg,
South Africa was used for the study.
One sprouted potato tuber was sown in each pot half-filled with 2.5 kg of sieved soil and after
two weeks another 2.5 kg of sieved soil was re-added. Nitrogen (N), phosphorus (p) and
potassium (K) were supplied using automated drip irrigation at a rate of 200 kg N ha-1 (ha-1), 80
kg P ha-1 and 90 kg K ha-1 based on soil fertility analysis using potato nutrient requirements as a
reference. For the first two weeks, all pots were watered to field capacity after planting to ensure
fully establishment. The studied genotypes were exposed to water deficit at the beginning of each

98
growth stage (i.e. vegetative growth, tuber initiation, tuber bulking and maturity) for the entire
growth stage and re-irrigated at the end of each growth stage. The crop duration in growing
degree days (beginning and end-stage of each growth stage) was monitored using the BBCH
developmental scale (Table 2) (Meier, 2001). Soil moisture content was monitored daily by a
Hydro-Sense II (HS2) Handheld Soil Moisture Sensor, carefully inserted in the pot to a depth of
12 cm. The H2S uses a battery capacitance to estimate the volumetric soil moisture content
(VSC). Soil moisture content was maintained at 30% (throughout the growing period) under
well-watered condition. Under water deficit treatment, soil moisture was allowed to decline from
30% to approximately 10% after irrigation was withheld throughout all the crop growing period.
Weeds were removed by hand while pests and diseases were chemically controlled.
Table 4.1: Soil chemical composition Sample
density (g/ml)
N
(%)
P
(mg/L)
K
(mg/L)
Ca
(mg/L)
Mg
(mg/L)
Exch.Acidity
(cmol/L)
Total
cations (cmolmg/L)
pH
(KCL)
Zn
(mg/L)
Mn
(mg/L)
Cu
(mg/L) Organic
C (%)
1.46 0.13 30 108 844 314 1.14 8.21 3.94 5.9 110 8.9 1.5
N = nitrogen, P = phosphorus, K = phosphorus, Ca = calcium, Mg = magnesium, Zn = zinc, Mn = manganese, Cu = copper, C = carbon.
Table 4.2: Phonological development stages of potato (Solanum tuberosum L.) according
to the BBCH scale (Meier, 2001).
Code Description Stage no. dd/mm/Year DAP
00 Planting 0 16 December 2018 0
11 Emergence I 02 January 2019 17
21 Vegetative stage II 19 January 2019 34
40 Tuber initiation III 27 January 2019 42
51 Flowering - 04 February 2019 50
69 End of flowering - 17 February 2019 63
70 Tuber bulking IV 01 March 2019 75
95 Maturity V 30 March 2019 104
99 Yellow leaves and Harvest N 13-14 April 2019 119
N= Terminal, dd-Date, mm-Month, y-Year, DAP-Days after planting

99
4.3.3.1 Application of water deficit treatments
• TX (00000); Water deficit
• TY (11111); Well-watered
• T1 (11111); Well-watered at stage I
• T2 (10111); Water deficit at stage II
• T3 (11011); Water deficit at stage III
• T4 (11101); Water deficit at stage IV
• T5 (11110); Water deficit at stage V
Where 0-Water deficit, 1-Well-watered, stage I-Emergency, stage II-Vegetative stage, stage
III-Tuber initiation, stage IV-Tuber bulking, stage V-Maturity.
4.3.4 Data collection
4.3.4.1 Tuber yield
The number of tubers and weight (g) were determined according to Lihlou et al. (2003) with
some modifications. The number of tubers per plant was determined by physically counting
tubers produced per plant and taking the average (three plants) for each treatment and growth
stage. At maturity, the weight of fresh tuber yield was taken from three pots of each treatment
and growth stage. Thereafter, the average representing treatment output per block was
determined.
4.3.4.2 Tuber size
Tuber size category was determined according to Khan et al. (2011); Bekele and Haile (2019)
with some modification. Tuber yield samples were washed and six tubers in each genotype
randomly selected from both conditions (well-watered and water deficit) and categorized into
three groups size of tubers: small (< 35 mm), medium (35-55 mm) and large (>55 mm) using
Vernier caliper after categorizing was done tubers in each grade were counted.

100
4.3.4.3 Determination of dry matter content
Washed potato tubers with a diameter range of 30 to 40 mm from each treatment combination
were selected and used to determine tuber dry matter content. The standard of 150 g fresh
sample tubers was weighed, chopped into small pieces to accelerate the oven drying process.
Dry weights were determined by oven dry chopped samples at 70 o C for 24 hours to
determine the dry weight and then 60 oC re-weighed till constant weight was obtained. The
dry matter content was calculated as a percentage of dry weight over fresh weight (g) (Abbas
et al., 2011; Bekele and Haile, 2019). Dry matter content (%) was determined using Equation
(1).
Dry matter content (%) =Dry weight
Fresh weight× 100
4.3.5 Data analysis
The data collected was subjected to analysis of variance (ANOVA) using GenStat® 18th
Edition (VSN International, Hemel Hempstead, UK). The means were separated with the
LSD test at 5% probability level. Correlation analysis was performed on measured traits to
determine the level of association. Principal component analysis (PCA) based on the
correlation matrix was used to derive bi-plots showing the relationship between genotypes
and assessed traits for both well-watered and water deficit conditions.

101
4.4 Results
4.4.1 Effect of genotype, water condition and growth stages on total yield and tuber
quality
Analysis of variance showing mean squares and significance tests for total yield and tuber
quality traits between eight selected potato genotypes under well-watered and water deficit
conditions is shown in Table 3. Genotypic differences were observed with regards to Yield,
NT, small tubers and DMC. Highly significant (p < 0.001) effects of water condition and
growth stages were observed for assessed traits. Genotype x water condition and genotype x
growth stage were significant (p < 0.05) for most assessed traits. A significant (p < 0.001)
genotype × water condition × growth stages interaction was observed for DMC only, whereas
a significant (p < 0.001) interaction between water condition × growth stages was observed
for Yield, NT, small tubers and DMC (Table 3).

102
Table 4.3. Analysis of variance showing mean squares and significance test for evaluated potato quality traits among eight potato
genotypes tested under well-watered and water deficit conditions at four different growth stages.
Source of variation Df Yield NT Small Medium Large DMC
Genotypes (G) 7 36531*** 22.97*** 1461*** 706* 479** 17.5***
Water condition (WC) 1 769006*** 126.75*** 26759*** 7239*** 7500*** 856.8***
Growth Stage (GS) 3 92860*** 26.19*** 187ns 129ns 27ns 20.4***
G × WC 7 6640ns 1.32ns 966*** 216ns 446* 13.6***
G × GS 21 11527*** 2.15ns 443** 224ns 189ns 6.7***
WC × GS 3 57608*** 16.69*** 2172*** 1024* 413ns 24.7***
G × WC × GS 21 3670*** 0.76ns 294ns 393ns 127ns 4.4***
Residual 128 3292 2.09ns 214ns 318ns 162ns 0.6***
df = degree of freedom; * = significance at p < 0.05; ** = significance at p < 0.01; *** = significance at p < 0.001; ns = non-significant. Yield = Total yield
NT = Number of tubers; Small = Small tubers; Medium = Medium tubers; Large = Large tubers; DMC = Dry matter content.

103
4.4.2 Yield performance of potato genotypes under well-watered and water deficit
conditions across different growth stages
The interactions between water treatments and genotypes had significant (p < 0.05) effect on
fresh tuber yield among genotypes (Figure 1a). Genotypes Tyson, Electra and Bikini (327.0,
326.5 and 320.0 g, respectively) produced higher TY compared to Sababa, Sifra and
Panamera (203.0, 266.0 and 254.0 g, respectively) that produced low TY when Wd were
imposed at VG. Genotypes Electra, Challenger and Mondial recorded significantly higher
tuber yields (˃ 430 g) under Ww condition at the VG. All genotypes were affected by Wd at
TI and TB stage where Sifra, Challenger and Sababa (200.0, 180.0 and 173.5 g, respectively)
were less affected while Panamera and Electra (124.0 and 125.0 g, respectively) were highly
affected during TI stage. Under Ww condition Mondial, Sababa and Sifra recorded higher TY
> 400 g compared to other genotypes at the TI. During TB and MAT under Wd condition
Tyson produced the highest tuber yield while the lowest obtained for Bikini, Mondial and
Panamera. Under Ww condition, Challenger, Mondial, Sifra and Tyson recorded higher tuber
yields during TB (˃ 430 g) and MAT (˃ 390 g).
Genotypic differences (p < 0.05) were observed among genotypes across all growth stages for
NT (Figure 1b). When Wd was imposed at VG it affected Sababa and Panamera NT while
Electra and Sifra were unaffected. Under Ww condition Electra, Mondial and Sifra produced
high NT compared to other genotypes. During TI, TB and MAT stage under Wd condition,
genotypes Sababa and Panamera produced lower NT. Electra recorded high NT at VG, TI
and MAT, whereas Mondial had higher NT at TB and MAT under Wd condition. Bikini,
Electra, Mondial and Sifra produced high NT than other genotypes under Ww condition
throughout stages.

104
Figure 4.1a: Yield performance of eight potato genotypes under well-watered and water deficit conditions at different growth stages.

105
Figure 4.1b: The effect of water deficit imposed at different growth stages on the number of tubers of potato genotypes.

106
4.4.3 The effect of water deficit on potato genotypes tuber size distribution and dry
matter content across different growth stages
A significant difference (p < 0.05) in tuber size among tested genotypes concerning the
number of small size tuber in percentage was observed (Table 3a). During VG stage Wd
resulted in the highest percentage of small tubers from Tyson, Sababa (both 66.67%), Bikini
and Challenger (both 61.11%). Under Ww condition at VG stage Sababa recorded high
percentage of small tubers (77.78%) while Sifra produced lowest percentage (11.11%) of
small size tuber. On the other hand, Sifra, Panamera and Mondial (55.55, 50 and 50%,
respectively) dominated with medium size tubers whereas the highest percentage of large
tubers were obtained from Sifra, Mondial and Sababa (16.67, 11.11 and 11.11%,
respectively) at VG stage under Wd condition. Under Ww condition at VG stage Panamera,
Tyson and Mondial produced many medium size tuber >50% whereas Sifra and Sababa
produced less than 30% of medium size tubers. Many large size tubers were obtained from
Sifra (61.11%) while other genotypes recorded fewer large tubers < 11.11% under Ww
condition.
Genotypic differences (p < 0.05) were observed among genotypes at TI for small size tubers
under Ww and Wd condition (Table 3b). Under Wd condition at TI stage a high percentage
of small size tubers were produced by Bikini and Challenger (both 11.11%) compared to
other genotypes. Only Tyson produced many small size tubers (44.44%) whereas Sifra
produced fewer under Ww condition. Panamera, Sababa and Tyson recorded higher medium
size tuber of 44.44% also large size tubers (Sababa and Tyson) at TI stage under Wd
condition. Under Ww condition Sababa and Tyson produced lesser percentage of medium
size tubers while other genotypes produced more than 50%. High percentage of large size
tubers were obtained from Sifra (22.22%).

107
Table 4.4a: Tuber size distribution (small, medium and large) of potato genotypes at
vegetative stage evaluated under well-watered (Ww) and water deficit (Wd) conditions.
Tuber size category at Vegetative stage
Genotypes Small (< 35mm) Medium (35-55mm) Large (> 55 mm)
Ww Wd Ww Wd Ww Wd
Bikini 55.55cde 61.11cde 33.33abc 33.33abc 11.11a 5.56a
Challenger 50.00bcde 61.11cde 44.44abcd 33.33abc 5.56a 5.56a
Electra 44.44bcd 50.00bcde 44.44abcd 44.44abcd 11.11a 5.56a
Mondial 22.22ab 38.89abcd 66.67d 50.00abcd 11.11a 11.11a
Panamera 33.33abc 44.44bcd 55.56bcd 50.00abcd 11.11a 5.56a
Sababa 77.78e 66.67de 16.67a 22.22a 5.56a 11.11a
Sifra 11.11a 27.78ab 27.78ab 55.55cd 61.11b 16.67a
Tyson 38.89abcd 66.67de 50.00abcd 27.78a 11.11a 5.56a
P-value p < 0.05 p < 0.05 p < 0.05 p < 0.05 p > 0.05 p > 0.05
LSD 25.14 25.14 26.77 26.77 18.84 18.84
S.e.d 12.31 12.31 13.11 13.11 9.23 9.23
CV (%) 5.6 5.6 14.6 14.6 31 31
Note: Means in a column and treatment group followed by the same letter are not significantly
different from each other using the LSD test at 5% probability level; Ww, Well-watered (control);
Wd, Water deficit; p-value = Significance of interaction between treatment x genotype; LSD, Least
significant difference; S.e.d, standard error deviation; CV, Coefficient of variation.
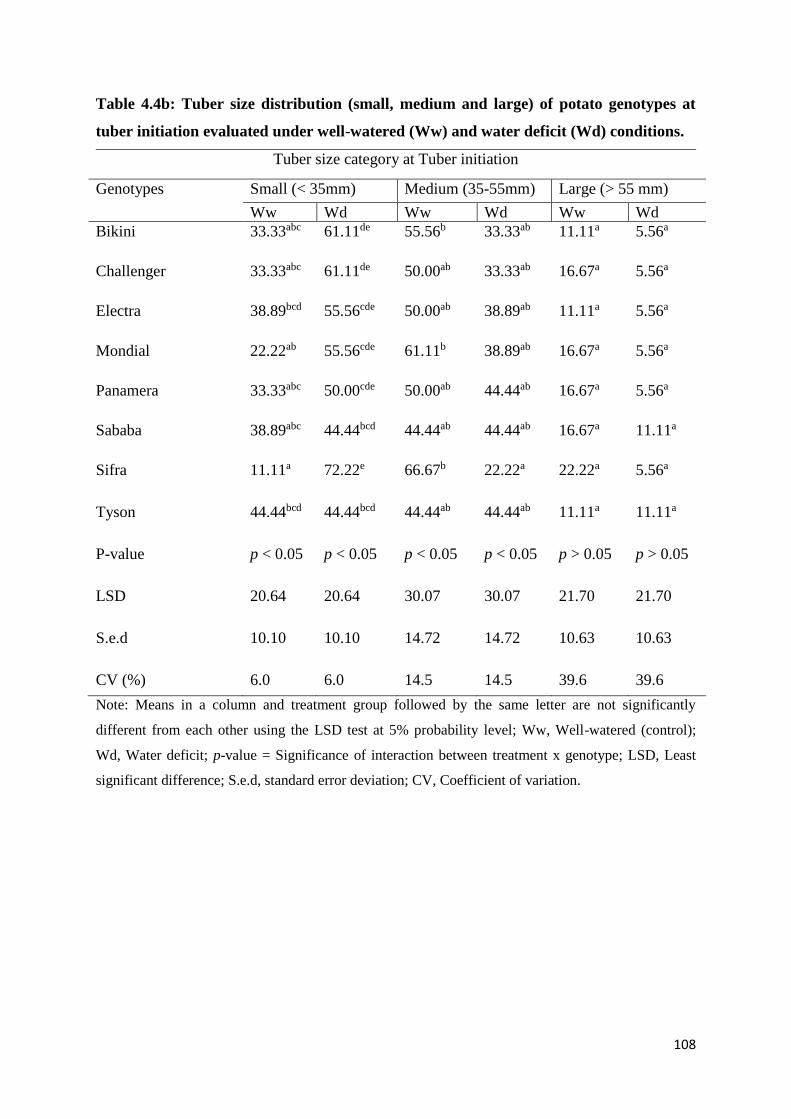
108
Table 4.4b: Tuber size distribution (small, medium and large) of potato genotypes at
tuber initiation evaluated under well-watered (Ww) and water deficit (Wd) conditions.
Tuber size category at Tuber initiation
Genotypes Small (< 35mm) Medium (35-55mm) Large (> 55 mm)
Ww Wd Ww Wd Ww Wd
Bikini 33.33abc 61.11de 55.56b 33.33ab 11.11a 5.56a
Challenger 33.33abc 61.11de 50.00ab 33.33ab 16.67a 5.56a
Electra 38.89bcd 55.56cde 50.00ab 38.89ab 11.11a 5.56a
Mondial 22.22ab 55.56cde 61.11b 38.89ab 16.67a 5.56a
Panamera 33.33abc 50.00cde 50.00ab 44.44ab 16.67a 5.56a
Sababa 38.89abc 44.44bcd 44.44ab 44.44ab 16.67a 11.11a
Sifra 11.11a 72.22e
66.67b 22.22a 22.22a
5.56a
Tyson 44.44bcd 44.44bcd 44.44ab 44.44ab 11.11a 11.11a
P-value p < 0.05 p < 0.05 p < 0.05 p < 0.05 p > 0.05 p > 0.05
LSD 20.64 20.64 30.07 30.07 21.70 21.70
S.e.d 10.10 10.10 14.72 14.72 10.63 10.63
CV (%) 6.0 6.0 14.5 14.5 39.6 39.6
Note: Means in a column and treatment group followed by the same letter are not significantly
different from each other using the LSD test at 5% probability level; Ww, Well-watered (control);
Wd, Water deficit; p-value = Significance of interaction between treatment x genotype; LSD, Least
significant difference; S.e.d, standard error deviation; CV, Coefficient of variation.

109
At the TB stage, significant differences (p < 0.05) with respect to small size distribution
among genotypes imposed in Wd were found (Table 3c). During TB under Wd all genotypes
produced high number of small size tubers >50% except Sababa and Tyson. Genotype
Challenger produced >50% of smaller size tubers and Sifra produced less (11.11%) under
Ww condition. A high percentage of medium-sized tubers under Wd condition were observed
from Sababa, Panamera and Tyson (>50%). On the other hand, Sifra produced a lower
percentage of medium-sized tubers (<30%) under Wd condition. Under Ww condition
Mondial and Panamera produced high percentage of medium sized tubers >55% while
Challenger recorded lowest (<33.33%). Electra, Panamera and Sababa produced non-large
size tubers while Tyson produced higher of 16.67% under Wd condition. However, under
Ww condition Sifra followed by Panamera and Mondial produced >20% of large size tubers
and <10% observed for Challenger. At MAT stage under Ww condition only Panamera
produced high percentage of medium size tubers, while under Wd condition Challenger
produced high percentage of small size tubers.

110
Table 4.4c: Tuber size distribution (small, medium and large) of potato genotypes at
tuber bulking stage evaluated under well-watered (Ww) and water deficit (Wd)
conditions.
Tuber size category at Tuber bulking
Genotypes Small (< 35mm) Medium (35-55mm) Large (> 55 mm)
Ww Wd Ww Wd Ww Wd
Bikini 38.89bcde 61.11de 50.00a 33.33a
11.11a 5.56a
Challenger 61.11de 61.11de 33.33a
33.33a
5.56a 5.56a
Electra 44.44bcde 55.56de 44.44a 44.44a 11.11a 0.00a
Mondial 16.67ab 50.00cde 61.11a 38.89a
22.22ab
11.11a
Panamera 22.22abc 50.00cde 55.56a
50.00a 22.22ab
0.00a
Sababa 44.44bcde 44.44bcde 38.89a
55.56a
16.67ab 0.00a
Sifra 11.11a 66.67e 50.00a 27.78ab
38.89b
5.56a
Tyson 33.33abcd
33.33abcd
50.00a 50.00a 16.67ab 16.67ab
P-value p < 0.05 p < 0.05 p > 0.05 p > 0.05 p < 0.05 p < 0.05
LSD 24.53 24.53 30.53 30.53 22.00 22.00
S.e.d 12.01 12.01 14.95 14.95 10.77 10.77
CV (%) 7.7 7.7 7.0 7.0 42.3 42.3
Note: Means in a column and treatment group followed by the same letter are not significantly
different from each other using the LSD test at 5% probability level; Ww, Well-watered (control);
Wd, Water deficit; p-value = Significance of interaction between treatment x genotype; LSD, Least
significant difference; S.e.d, Standard error deviation; CV, Coefficient of variation.
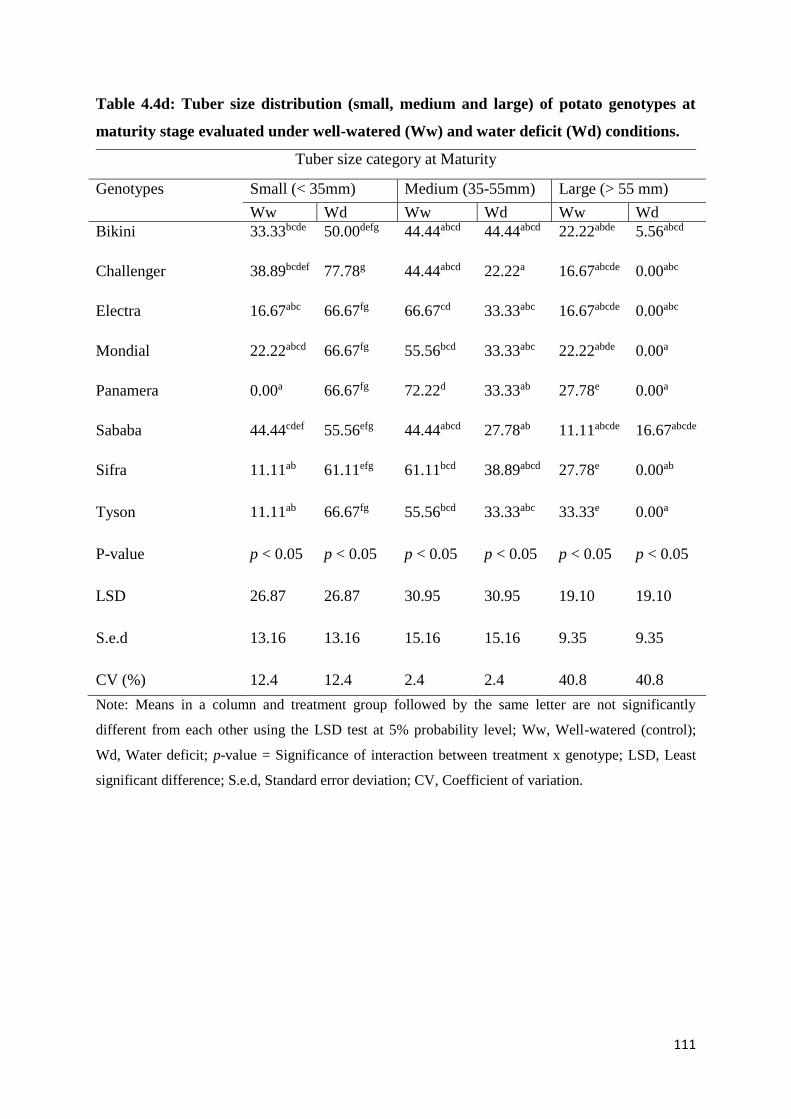
111
Table 4.4d: Tuber size distribution (small, medium and large) of potato genotypes at
maturity stage evaluated under well-watered (Ww) and water deficit (Wd) conditions.
Tuber size category at Maturity
Genotypes Small (< 35mm) Medium (35-55mm) Large (> 55 mm)
Ww Wd Ww Wd Ww Wd
Bikini 33.33bcde
50.00defg 44.44abcd 44.44abcd 22.22abde
5.56abcd
Challenger 38.89bcdef 77.78g
44.44abcd 22.22a 16.67abcde
0.00abc
Electra 16.67abc 66.67fg 66.67cd 33.33abc 16.67abcde
0.00abc
Mondial 22.22abcd 66.67fg 55.56bcd
33.33abc 22.22abde
0.00a
Panamera 0.00a
66.67fg 72.22d 33.33ab 27.78e 0.00a
Sababa 44.44cdef
55.56efg 44.44abcd 27.78ab 11.11abcde
16.67abcde
Sifra 11.11ab
61.11efg 61.11bcd
38.89abcd
27.78e 0.00ab
Tyson 11.11ab
66.67fg 55.56bcd
33.33abc 33.33e
0.00a
P-value p < 0.05 p < 0.05 p < 0.05 p < 0.05 p < 0.05 p < 0.05
LSD 26.87 26.87 30.95 30.95 19.10 19.10
S.e.d 13.16 13.16 15.16 15.16 9.35 9.35
CV (%) 12.4 12.4 2.4 2.4 40.8 40.8
Note: Means in a column and treatment group followed by the same letter are not significantly
different from each other using the LSD test at 5% probability level; Ww, Well-watered (control);
Wd, Water deficit; p-value = Significance of interaction between treatment x genotype; LSD, Least
significant difference; S.e.d, Standard error deviation; CV, Coefficient of variation.

112
For dry matter content (DMC), genotypic differences were observed among genotypes across
growth stages and water conditions (Figure 2). Challenger and Tyson recorded higher DMC
across stages while Electra, Panamera and Sababa recorded lower DMC % under Wd at the
VG, TI, TB and MAT stages. Genotypes Electra recorded higher DMC% during VG stage
followed by Sababa and Tyson higher > 17% at both VG and TI stage under Ww condition.
Bikini and Sababa produced higher DMC > 19% at TB whereas Sifra and Tyson were higher
> 18% at MAT stage under Ww condition. Lower DMC under Ww condition was observed
from Mondial and Panamera (14 and 14%, respectively) at VG stage. Electra, Mondial and
Panamera were lower at TI, Mondial at TB and Sababa was lower < 16% at MAT stage under
Wd condition.

113
Figure 4.2: Effect of water deficit imposed at different growth stages on tubers dry matter content of eight potato genotypes.

114
4.4.4 Correlations among yield and quality traits under well-watered and water-deficit
conditions across growth stages.
Pearson’s correlation coefficients (r) revealing the level of associations of yield and quality
traits among potato genotypes under well-watered and water deficit conditions at different
growth stages are presented in Table 5. On the upper diagonal, under Wd condition, medium
tubers were significant and positively correlated with yield (r = 0.76; p = 0.05) at vegetative
stage, (r = 0.88; p = 0.010) at tuber bulking however, at tuber initiation it was significant and
negatively correlated with yield (r = -0.08; p = 0.05). Medium tubers were highly significant
and negatively correlated with small tubers (r = -0.95; p = 0.001) at vegetative stage, (r = -
0.95; p = 0.001) at tuber initiation also significant and negatively correlated with small tubers
(r = -0.75; p = 0.05) at tuber bulking and (r = 0 -0.69; p = 0.05). During tuber initiation on the
upper diagonal under Wd condition medium tubers were significant and positively correlated
with NT (r = 0.75; p = 0.05). Small tubers were significant and negatively correlated with
yield (r = -0.81; p = 0.010) during tuber bulking on the upper diagonal.
Large tubers were significant and positively correlated with NT (r = 0.42; p = 0.05) at
vegetative stage however during tuber initiation and tuber bulking it was significant and
negatively correlated with yield (r = -0.68; p = 0.05) and (r = -0.09; p = 0.05), respectively.
During vegetative stage under Wd condition on upper diagonal DMC was significant and
positively correlated with large tubers (r = 0.71; p = 0.05) while during tuber initiation it was
significant and negatively correlated with large tubers (r = -0.64; p = 0.05). DMC was
significant and positively correlated with yield (r = 0.79; p = 0.010) during tuber initiation
and highly significant negatively correlated with NT (r = -0.94; p = 0.001) at tuber bulking.

115
Table 4.5: Pearson correlation coefficients (r) showing associations of quality traits of 8
selected potato genotypes under well-watered (lower diagonal) and water deficit (upper
diagonal) conditions at different growth stages.
Yield = total yield; NT = Number of tubers; Small = small tubers; Medium = medium tubers;
Large = large tubers; DMC = dry matter content.* = significance at p < 0.05; ** =
significance at p < 0.01; *** = significance at p < 0.001; ns = non-significant.
Vegetative stage
Traits Yield NT Small Medium Large DMC
Yield 0.4266ns -0.6021ns 0.764* -0.5068ns -0.4688ns
NT -0.0971ns -0.4384ns 0.4132ns 0.3337* 0.2543ns
Small -0.1634ns -0.6939* -0.9539*** 0.1823ns 0.4778ns
Medium 0.177ns 0.5923ns -0.9742ns -0.4275ns -0.5618ns
Large -0.5618ns 0.4725ns -0.17ns -0.0173ns 0.7158*
DMC -0.0657ns -0.1495ns 0.7531* -0.8544** 0.2228ns
Tuber initiation
Traits Yield NT Small Medium Large DMC
Yield 0.5697ns 0.3137ns -0.0886* -0.6816* 0.7959**
NT 0.8569** -0.5465ns 0.748* -0.1259ns 0.2553ns
Small -0.8304** -0.6154ns -0.9499*** -0.6344* 0.454ns
Medium 0.6955* 0.3454ns -0.811** 0.4088ns -0.3459ns
Large 0.4779ns 0.5841ns -0.6112ns 0.0327ns -0.6386*
DMC -0.7646* -0.3815ns 0.7908** -0.9674*** -0.0423ns
Tuber bulking
Traits Yield NT Small Medium Large DMC
Yield 0.3283ns -0.8189** 0.8893** -0.0912* -0.542ns
NT 0.3159ns -0.2218ns 0.3818ns -0.2257ns -0.9411***
Small -0.5033ns -0.8669** -0.7559* -0.3592ns 0.3223ns
Medium 0.3119ns 0.128ns 0.1329ns -0.3394ns -0.5148ns
Large 0.3302ns 0.7187* -0.9318*** -0.4835ns 0.2707ns
DMC 0.8429** 0.1067ns -0.2262ns 0.5159ns 0.0109ns
Maturity
Traits Yield NT Small Medium Large DMC
Yield -0.1089ns 0.5335ns -0.5489ns -0.43ns 0.2604ns
NT -0.1089ns -0.4154ns 0.4663ns 0.1843ns -0.8282ns
Small 0.5335ns -0.4154ns -0.9957* -0.9341ns 0.8035ns
Medium -0.5489ns 0.4663ns -0.9957ns 0.8971ns -0.8285ns
Large -0.43ns 0.1843ns -0.9341*** 0.8971** -0.6406ns
DMC 0.2604ns -0.8282** 0.8035** -0.8285** -0.6406*

116
4.4.5 Principal component analysis for assessed quality traits under well-watered and
water-deficit conditions across growth stages.
Principal component analysis (PCA) showing percent variance and correlation among the
measured quality traits for studied genotypes under Ww and Wd conditions across four
growth stages (Table 5). For vegetative, tuber initiation, tuber bulking and maturity stages,
PCA revealed two principal components (PC’s) which accounted for a total variation of
Figure Aa, Bb, Cc and Dd. Medium tubers, DMC and small tubers correlated with PC1 which
accounted for 51.6 % of the total variation while large tubers and yield correlated with PC2
which accounted for 30.1 % of the total variation under Ww condition at the vegetative stage.
Under Wd condition PC1 correlated with small tubers, DMC, yield and medium tubers which
accounted for 56 % of the total variation whereas only NT correlated with PC2 which
accounted for 28.8 % of the total variation at the vegetative stage. At the tuber initiation
under Ww condition yield, medium tubers, NT, DMC and small tubers correlated with PC1
and large tubers correlated with PC2 which accounted for 67.6 and 23.2 % of the total
variation, respectively. On the other hand of Wd condition small tubers, DMC, medium
tubers and large tubers correlated with PC1 which accounted for 52.6 % of total variation
whereas only NT correlated with PC2 which accounted for 38.1 % of the total variation.
Large tubers, NT and small tubers correlated with PC1 which accounted for 50.6 % of total
variation while medium tubers and DMC correlated with PC2 during tuber bulking which
accounted for 34 % of the total variation. But during Wd condition medium tubers, yield,
small tubers and DMC correlated with PC1 which accounted for 55.7 % of total variation and
only large tubers correlated with PC2 which accounted for 25.8 % of the variation. At
maturity stage under Ww condition medium tubers, large, DMC and small tubers correlated
with PC1 whereas only NT correlated to PC2 which accounted for 68.7 and 19.4 % of the
total variation, respectively. Under Wd condition yield and small tubers were correlated with
PC1 which accounted for 40 % whilst medium tubers correlated with PC2 which accounted
for 73 % of the total variation.

117
The evaluated genotypes that performed best in a particular assessed trait were gathered
nearby and furthest to the vector line (Figure 3). Under Wd condition (Figure 3a) at the
vegetative stage, G1-Bikini, G3-Electra and G4-Mondial were grouped together based on
high yield of medium tubers while G5-Panamera and G6-Sababa were grouped together on
small tubers produced. G8-Tyson was characterised with high NT and G7-Sifra with large
tubers and DMC under Wd condition. During the tuber initiation under Wd condition (Figure
3b), G6-Sabab and G7-Sifra were grouped together based on high medium NT. G1-Bikini
and G2-Challenger were grouped together based on high large tubers produced while G4-
Mondial and G3-Electra produced small tubers, under Wd condition at the tuber initiation
stage. G2-Challenger, G3-Electra and G4-Mondial grouped together by producing large
tubers with high DMC while G7-Sifra had high yield of medium size tubers under Wd
condition during the tuber bulking (Figure 3c). Under Wd condition (Figure 3d) at the
maturity stage, G1-Bikini and G6-Sababa were grouped together based on high large NT
whereas G4 and G5 were clustered together by producing medium tubers with high DMC.
Under Ww condition during vegetative stage (Figure 3A) genotypes G5- Panamera and G4-
Mondial were grouped together based on many small tubers with a high DMC. Meanwhile
G6-Sababa was characterised with high large NT and G7-Sifra with high yield of medium
tubers (Figure 3A) also high DMC at tuber initiation (Figure 3B) under Ww condition. At the
tuber initiation stage (Figure 3B) G1-Bikini, G2-Challenger and G3-Electra were grouped
together with high yield of medium tubers while G4-Mondial, G5-Panamera and G6-Sababa
were grouped together based on high small tubers produced. G8-Tyson at Figure 3B and G2-
Challenger at Figure 3C (tuber bulking) was characterised with high large NT under Ww
condition. During the tuber bulking under Ww condition (Figure 3C) G3-Electra and G4-
Mondial were grouped together based on high medium and large tubers with DMC produced
whereas G5-Panamera, G6-Sababa and G8-Tyson were grouped together based on small
tubers produced. At the maturity stage (Figure 3D) under Ww condition G1-Challenger and
G2-Electra were grouped together recording higher DMC. G3-Electra and G4-Mondial were
grouped together based on high yield of small tubers while G6-Sababa, G7-Sifra and G8-
Tyson were grouped together by producing medium and large tubers under Ww condition at
the maturity stage.

118
Table 4.6: Principal component analysis showing eigenvalues and cumulative percent variance of all measured traits of eight potato
genotypes under Ww and Wd conditions at different growth and Bi-plot.
Vegetative stage Tuber initiation Tuber bulking Maturity
Traits Ww Wd Ww Wd Ww Wd Ww Wd
PC1 PC2 PC1 PC2 PC1 PC2 PC1 PC2 PC1 PC2 PC1 PC2 PC1 PC2 PC1 PC2
Yield 0.12 -0.75 -0.85 0.11 0.95 0.10 0.66 0.69 0.69 0.59 0.89 0.31 -0.55 0.52 0.86 0.03
NT 0.68 0.51 -0.32 0.87 0.75 0.47 -0.17 0.97 0.84 -0.16 0.68 -0.53 0.58 0.75 0.66 0.35
Small -0.99 -0.03 0.85 -0.31 -0.95 -0.03 0.88 -0.43 -0.96 0.22 -0.74 -0.64 -0.97 0.15 -0.79 0.40
Medium 0.98 -0.12 -0.95 0.18 0.83 -0.53 0.76 0.63 0.005 0.82 0.90 0.14 0.98 -0.11 0.27 -0.89
Large 0.10 0.92 0.59 0.69 0.50 0.78 -0.83 -0.26 0.85 -0.50 -0.21 0.72 0.86 -0.31 0.65 0.62
DMC -0.80 0.32 0.71 0.57 -0.84 0.51 0.78 0.43 0.44 0.82 -0.80 0.45 -0.89 -0.42 0.26 -0.39
Eigenvalues
variance %
51.62 30.07 56.01 28.81 6.75 2.31 52.62 38.05 5.06 3.40 5.57 2.58 6.86 1.94 4.00 2.72
Cumulative
variance %
51.62 81.69 56.01 84.81 67.55 90.73 52.62 90.68 50.64 84.66 55.71 81.54 68.67 88.08 40.00 67.27
Yield = total yield; NT = Number of tubers; Small = small tubers; Medium = medium tubers; Large = large tubers; DMC = dry matter content.


121
4.5 Discussion
Understanding potato quality traits that play an important role in improving adaptation to low
water environments is critical in the identification of drought tolerant genotypes for breeding
programmes and marking industry (Carputo et al., 2005). Therefore, the current study
assessed the response of drought tolerant potato (Solanum tuberosum L.) genotypes by means
of quality traits under well- and water-deficit conditions to select favourable for processing
industry. Genotype x water condition x growth stage interaction effect were significant for
the evaluated traits signifying difference response of genotype across studied growth stages.
This is useful to identify exact growth stage and select potato genotypes with better
adaptation for a recommendation for processing industry (Table 3).
Quality traits such as total yield, number of tubers produced per plant, tuber size distribution
(small, medium and large), dry matter content and specific gravity have been extensively
used in assessing potato quality (Patel et al., 2008; Abong and Kabira, 2011; Al-Mahmud et
al., 2015; Cavalcante et al., 2019). Reducing water supply during tuber initiation stage and
tuber bulking negatively affect tuber size and number produced (Alsharari et al., 2007; Hirut
et al., 2017; Rudack et al., 2017). Despite extensive number of tubers observed for the
studied genotypes, most of them were small tubers under water deficit condition. In the
current study, water deficit affected quality traits of the studied potato genotypes to various
degrees (Figure 1(a–b), 2 and Table 3(a-d)). Low water supply at the tuber initiation and
tuber bulking significantly reduced all studied genotype total yield and negligible effect on
maturation stage across the tested potato genotypes (Figure 1(a–b)). The observation that
water deficit significantly affected total yield on both tuber initiation and tuber bulking stage
but not affected at vegetative stage and maturity stage, is contained in studies by Lahlou et al.
(2003); Alsharari et al. (2007); Khan et al. (2011) and Aya (2013). These results are
consistent with the findings of Alsharari et al. (2007) who found that water deficit imposed at
30th and 60th day after planting reduced both number and fresh tuber yield of tested
genotypes.
This suggests that exposing genotypes to water deficit at the maturity stage has no much
impact on total yield except tuber quality. Overall, Tyson, Electra and Sifra produced high
yield throughout the growth stage, they can, therefore, be identified as tolerant genotypes to a
low water supply (Figure 1(a–b). Panamera and Sababa cannot be recommended under a low

122
water supply environment because of their sensitive response. The pot experiment during
watering pots period below field capacity could have contributed to the yield reduction
genotypes. Also, high soil evaporation accelerated by high temperatures (Rebetzke and
Richards, 1999; Rykaczewska, 2013). According to Geofrey et al. (2014) when soil water
drops below 65 % of the field capacity, tuber yield and quality are reduced. Metabolic
imbalance of photosynthesis rate due to stomatal closure and low transpiration rate caused by
water deficit at tuber initiation and tuber bulking probably contributing to low yield and
fewer number of tubers (Onder et al., 2005). Also, during stolon formation, water deficit
restrained vegetation which resulted in a reduction of tuber numbers with effects on final
yield (Deblonde and Ledent, 2001 and Tourneux et al., 2003b).
In the present study, dry matter content was poorly correlated with tuber size distribution
(small, medium and large) under water deficit conditions, suggesting this trait contributed
very little to tuber size distribution among the tested potato genotypes. A significant and
positive correlation observed between dry matter content and large tubers (Table 4) under
water deficit condition suggests low dry matter allocation. A negative correlation between
dry matter content and large tubers (Table 4) suggested rapid accumulation rates of dry
matter content in large tubers than other tuber size among the studied potato population at
tuber initiation. Based on the tubers' dry matter percentage of each genotype obtained, it
seems like Panamera was the most sensitive genotype whereas Tyson and Challenger were
tolerant in water deficit in all growth stages (Figure 2). These results corroborate those of
Solaiman et al. (2015); Elfnesh et al. (2011) who reported that dry matter content increased
with the maturity of the tuber. Further reported that more time to mature means a high
percentage of dry matter content provided that there's an adequate amount of water. Based on
the results obtained in this study, it can be concluded that withholding water at the tuber
bulking and maturity stage is detrimental to the dry matter content. It is at these stages
(bulking stage and maturity) where the partitioning of sugars and dry matter content occurs
(Sharma and Singh, 2009; Solaiman et al., 2015). High temperatures contributed to the
significant decreased dry matter content in tested genotypes. Struik et al. (1991) stated that
the thickness and the number of stems compete for assimilates and that affects tuber size
distribution. Genetic and environmental factors alter the partitioning of dry matter,
consequently, tuber size is also affected.
In this study, it was observed that potato genotypes responded differently in different growth
stages to water deficit in terms of tuber size distribution (Table 2). Highest percentage of

123
small tubers from Sababa, Bikini and Challenger were observed during vegetative stage and
tuber initiation (Table 2a and b). These results were supported by Sharma and Singh (2009)
and Abba et al. (2012) who reported that the highest percentage of small size tubers may be
due to higher vigour of plants at the vegetative stage. Khan et al. (2011) indicated that
planting the crop later and harvesting early, increased the number of smaller sized tubers,
whereas early planting and late harvesting, resulted in a high percentage of large and
medium-sized tubers. Tyson, Mondial and Sababa showed a tolerance response by producing
large and medium-sized tubers, whereas Bikini and Challenger showed sensitive response by
producing a high percentage of the smaller tuber at tuber also referred as baby potatoes at
tuber bulking stage (Table 3c). Tuber bulking, and maturity stages were identified as a critical
stage for the expansion of tubers. Therefore, factors such as planting date, environmental
condition, developmental stages and harvest time attributed to the variation among genotypes
in terms of the tuber size distribution of this study. Overall, genotypes such as Bikini,
Mondial, Sababa and Sifra were identified and selected possessing yield promoting quality
traits such as higher number of tubers per plant, medium-large size tubers and dry matter
under water deficit condition (Figure 3(a-b)).
4.6 Conclusion
The study showed that water deficit has a notably effect on the growth, yield and quality of
potato genotypes. The amount of irrigation increased the quantity of potato tuber but affected
tuber quality. In most cases, potato traits were more affected during tuber initiation and tuber
bulking stage, of which it can be identified as critical stages to water deficit. Therefore,
potato growers can be advised to pay more attention during these stages when irrigating, as
the crop is more prone to yield loss and poor quality. Although the response of other traits
such as the number of a tuber, tuber size distribution and dry matter content are important
especial for the processing industry (quality control); but genotypes recorded a higher yield
are applicable ones to be grown under limited water environments. Therefore, genotypes
Tyson, Sifra, Challenger and Electra can be suggested since they appeared as tolerance to
water deficit at tuber initiation stage, tuber bulking and maturity stage whereas Panamera and
Sababa showed to be the most sensitive water deficit in growth stages all growth stages. It is
advised that more studies characterising these genotypes under water deficit are conducted to
confirm the result of this study.
124
4.7 References
Abbas, G., Hafiz, I.A., Abbasi, N.A., Hussain, A., 2012. Determination of processing and
nutritional quality attributes of potato genotypes in Pakistan. Pakistan Journal of
Botany 44(1): 201-208.
Abong, G.O., Kabira, J.N., 2011. Suitability of three newly released Kenyan potato varieties
for processing into crisps and French fries. African Journal of Food, Agriculture,
Nutrition and Development, 11(6): 5266-5281.
Al-Mahmud, A., Hossain, M.M., Zakaria, M., Mian, M.A.K., Karim, M.A., 2015. Effects of
water stress on plant canopy, yield attributes and yield of potato. Kasetsart Journal-
Natural Science, 49(4): 491-505.
Alsharari, S.F., Alsadon, A.A., Alharbi, A.R., 2007. Evaluation of drought tolerance of potato
cultivars under greenhouse conditions. Acta Horticulture, 747: 67-74.
Bekele, T., Haile, B., 2019. Evaluation of improved potato (Solanum tuberosum L.) varieties
for some quality attributes at Shebench Woreda of Bench-Maji Zone, South western
Ethiopia. African Journal of Agricultural Research, 14(7): 389-394.
Carputo, D., Aversano, R., Frusciante, L., 2005. Breeding potato for quality traits. In Acta
horticulturae, DOI: 10.17660/ActaHortic.2005.684.7.
Cavalcante, A.C.P., Soares, M.E.P., de Andrade, G.A.V., da Silva, C.D., dos Santos, C.E.M.,
de Aquino, L.A., 2019. Influence of seed tuber size and sprouting stage on the
phytotechnical characteristics of the potato var. Ágata. Australian Journal of Crop
Science, 13(02): 282-286.
Deblonde, P.M.K., Ledent, J.F., 2001. Effects of moderate drought conditions on green leaf
number, stem height, leaf length and tuber yield of potato cultivars. European Journal
of Agronomy, 14: 31-41.
Denner, F.D.N., Venter, S.L., Niederwieser, J.G., 2012. Guide to potato production in South
Africa. Agricultural Research Council-Vegetable and Ornamental Plant Institute,
Pretoria.
Dreyer, H., 2017. Towards sustainable potato production: partnering to support family
farmers in Africa. Potato Research, 60: 237-238.

125
Elfnesh, F., Tekalign, T., Solomon, W., 2011. Processing quality of improved potato
(Solanum tuberosum L.) cultivars as influenced by growing environment and
blanching. African Journal Food Science, 5: 324-332.
FAOSTAT. 2019. http://www.fao.org/faostat/en/#data/QC (Accessed on the 19/12/2019).
Geofrey, K.G., Joseph, N.A., Dorcas, K.I., 2014. Effects of irrigation water and mineral
nutrients application rates on tissue contents and use efficiencies in seed potato tuber
production. International Journal of Plant and Soil Science, 3(9): 1153-1166.
Gultekin, R., Ertek, A., 2018. Effects of deficit irrigation on the potato tuber development
and quality. International Journal of Agriculture, Environment and Food Sciences,
2(3): 93-98.
Hirut, B., Shimelis, H., Fentahun, M., Bonierbale, M., Gastelo, M., Asfaw, A., 2017.
Combining ability of highland tropic adapted potato for tuber yield and yield
components under drought. PLoS ONE 12(7):e0181541.
https://doi.org/10.1371/journal.pone.0181541.
Khan, A.A., Jilani, M.S., Khan, M.Q., Zubair, M., 2011. Effect of seasonal variation on tuber
bulking rate of potato. The Journal of Animal & Plant Sciences, 21(1): 31-37.
Kiptoo, S., Kipkorir, E.C., Kiptum, C.K., 2018. Effects of deficit irrigation and mulch on
yield and quality of potato crop. African Journal of Education, Science and
Technology, 4(4): 65-77.
Lahlou, O., Ouattar, S., Ledent, J.-F., 2003. The effect of drought and cultivar on growth
parameters, yield and yield components of potato. Agronomie, 23: 257-268.
Levy, D., Coleman, W.K., Veilleux, R.E., 2013. Adaptation of potato to water shortage:
irrigation management and enhancement of tolerance to drought and salinity.
American Journal Potato Research, 90: 186-206.
Ngobese, N.Z., Workneh, T.S., Alimi, B.A., Tesfay, S.,2017. Nutrient composition and starch
characteristics of eight European potato cultivars cultivated in South Africa. Journal
of Food Composition and Analysis, 55; 1-11.
Obidiegwu, J.E., Bryan, G.J., Jones, H.G., Prashar, A., 2015. Coping with drought: stress and
adaptive responses in potato and perspectives for improvement. Frontiers in Plant
Science, 6:542-565. https://doi.org/10.3389/fpls.2015.00542 PMID: 26257752.

126
Onder, S., Caliskan, M.E., Onder, D., Caliskan, S., 2005. Different irrigation methods and
water stress effects on potato yield and yield components. Agricultural Water
Management, 73: 73-86.
Patel, C.K., Patel, P.T., Chaudhari, S.M., 2008. Effect of physiological age and seed size on
seed production of potato in north Gujarat. Potato Journal, 35(1 - 2): 85-87.
Rebetzke, G.J., Richards, R.A., 1999. Genetic improvement of early vigour in wheat.
Australian Journal of Agricultural Research, 50: 291-301.
https://doi:10.1071/A98125.
Rudack, K., Seddig, S., Sprenger, H., Kohl, K., Uptmoor, R., Ordon, F., 2017. Drought
stress-induced changes in starch yield and physiological traits in potato. Journal of
Agronomy in Crop Science, 203: 494-505.
Rykaczewska, K., 2013.The impact of high temperature during growing season on potato
cultivars with different response to environmental stresses. American Journal of Plant
Science, 4: 2386-2393. doi:10.4236/ajps.2013.412295.
Sharma, A.K., Singh, S., 2009. Effect of seed tuber DE sprouting on potato production in
kufri Griraj. Potato Journal, 36(1/2): 51-56.
Solaiman, A.H.M., Nishizawa, T., Roy, T.S., Rahman, M., Chakraborty, R., Choudhury, J.,
Sarkar, D., Hasanuzzaman, M., 2015. Yield, dry matter, specific gravity and colour of
three Bangladeshi local potato cultivars as influenced by stage of maturity. Journal of
Plant Sciences, ISSN 1816-4951 / DOI: 10.3923/jps.2015.
Stark, J.C., Love, S.L., King, B.A., Marshall, J.M., 2013. Potato Cultivar Response to
Seasonal Drought Patterns. American Journal of Potato Research, 90: 207-216.
Steyn, J.M., du Plessis, H.F., Fourie, P., Hammes, P.S., 1998. Yield response of potato
genotypes to different soil water regimes in contrasting seasons of a subtropical
climate. Potato Research, 41: 239-254.
Struik, P.C., Vreugdenhil, D., Haverkort, A.J., Bus, C.B., Dankert, R., 1991. Possible
mechanisms of size hierarchy among tubers on one stem of a potato (Solanum
tuberosum L.) plant. Potato Research, 34: 187-203.
Tabatabaeefar, A., 2002. Size and shape of potato tubers. International Agrophysics, 16: 301-
305.

127
Tourneux, C., Devaux, A., Camacho, M.R., Mamani, P., Ledent, J.F., 2003a. Effects of water
shortage on six potato genotypes in the highlands of Bolivia (I): morphological
parameters, growth and yield. Agronomie, 23: 169-179.
Tourneux, C., Devaux, A., Camacho, M.R., Mamani, P., Ledent, J.F., 2003b. Effect of water
shortage on six potato genotypes in the highlands of Bolivia (II): water relations,
physiological parameters. Agronomie, 23: 181-190.
van Niekerk, C., Schonfeldt, H., Hall, N., Pretorius, B., 2016. The role of biodiversity in food
security and nutrition: a potato cultivar case study. Food and Nutrition Sciences, 7:
371-382.
VIB Facts Series, 2019. Potato in Africa. International Plant Biotechnology Outreach.
http://ipbo.vib-ugent.be/wp-content/uploads/2018/11/VIB_Facts-Series_Potato-in-
Africa.pdf (Accessed 29/07/2019).
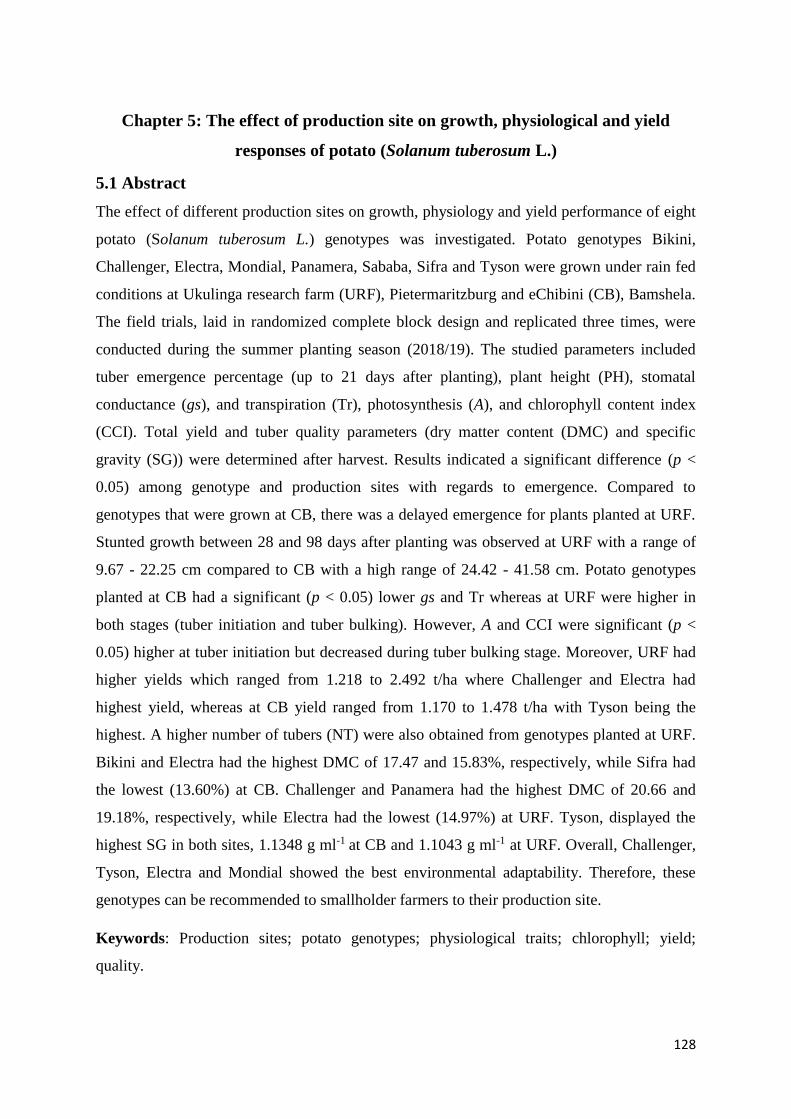
128
Chapter 5: The effect of production site on growth, physiological and yield
responses of potato (Solanum tuberosum L.)
5.1 Abstract
The effect of different production sites on growth, physiology and yield performance of eight
potato (Solanum tuberosum L.) genotypes was investigated. Potato genotypes Bikini,
Challenger, Electra, Mondial, Panamera, Sababa, Sifra and Tyson were grown under rain fed
conditions at Ukulinga research farm (URF), Pietermaritzburg and eChibini (CB), Bamshela.
The field trials, laid in randomized complete block design and replicated three times, were
conducted during the summer planting season (2018/19). The studied parameters included
tuber emergence percentage (up to 21 days after planting), plant height (PH), stomatal
conductance (gs), and transpiration (Tr), photosynthesis (A), and chlorophyll content index
(CCI). Total yield and tuber quality parameters (dry matter content (DMC) and specific
gravity (SG)) were determined after harvest. Results indicated a significant difference (p <
0.05) among genotype and production sites with regards to emergence. Compared to
genotypes that were grown at CB, there was a delayed emergence for plants planted at URF.
Stunted growth between 28 and 98 days after planting was observed at URF with a range of
9.67 - 22.25 cm compared to CB with a high range of 24.42 - 41.58 cm. Potato genotypes
planted at CB had a significant (p < 0.05) lower gs and Tr whereas at URF were higher in
both stages (tuber initiation and tuber bulking). However, A and CCI were significant (p <
0.05) higher at tuber initiation but decreased during tuber bulking stage. Moreover, URF had
higher yields which ranged from 1.218 to 2.492 t/ha where Challenger and Electra had
highest yield, whereas at CB yield ranged from 1.170 to 1.478 t/ha with Tyson being the
highest. A higher number of tubers (NT) were also obtained from genotypes planted at URF.
Bikini and Electra had the highest DMC of 17.47 and 15.83%, respectively, while Sifra had
the lowest (13.60%) at CB. Challenger and Panamera had the highest DMC of 20.66 and
19.18%, respectively, while Electra had the lowest (14.97%) at URF. Tyson, displayed the
highest SG in both sites, 1.1348 g ml-1 at CB and 1.1043 g ml-1 at URF. Overall, Challenger,
Tyson, Electra and Mondial showed the best environmental adaptability. Therefore, these
genotypes can be recommended to smallholder farmers to their production site.
Keywords: Production sites; potato genotypes; physiological traits; chlorophyll; yield;
quality.

129
5.2 Introduction
Potato is an important perennial, tuberous and leafy crop from the Solanaceae family (Zhu et
al., 2010) and it is the leading tuber crop produced in South Africa (Chauvin et al., 2012).
The crop plays an important role in alleviating hunger and is highly recommended for food
security in most developing countries (Devaux et al., 2014; Hirut et al., 2017). The crop is
nutritionally rich in carbohydrates, vitamin C, zinc, protein and iron (Sanginga and Mbabu,
2015). It also contributes to the South African economy in terms of its (3 %) contribution to
the gross domestic product (Strydom et al., 2012). Under rain-fed conditions, potato yields
are threatened by extreme temperatures, soil moisture and other factors (Hirut et al., 2017;
Yuan et al., 2003).
Being a C3 crop, potato crop is sensitive to harsh conditions like moisture stress and extreme
temperatures. The optimum soil temperature for the tuber development should range between
15 ºC and 18 °C and soil pH of 5.5 to 6.0 in the lower and upper highland regions (FAO,
2018; Nyawade et al., 2018). High temperatures are recommended for vegetative growth
while low temperature favours tuber initiation. The ideal temperature for net photosynthesis
ranges from 16 - 18 ºC (FAO, 2018; Levy and Veilleux, 2007). Temperatures above 21 °C
are detrimental to potato growth (Muthoni and Kabira, 2015). Soil moisture defined as the
amount of water available in soil pores, which increases and decreases after rainfall or
irrigation and drought. Low soil moisture at an early stage (emergence) of the crop growth
period is detrimental to the yield (Nyawade et al., 2018). As a result, the soil moisture should
not drop below 50 % to meet the crop demand (FAO, 2008b). The combination of high
temperatures and low soil moisture decreased potato yield and quality (Muthoni and Kabira,
2015).
In South Africa, potatoes are cultivated under both dryland and irrigated conditions in 16
different agronomic regions. It is widely planted in highland tropics and sub-tropics with
short summer days, lowland temperate regions with long summer days, and lowland sub-
tropics with shorter winter days (Bradshaw et al., 2006). Cool temperate regions with humid
climate ensure optimum growth whereas insufficient rainfall or inadequate irrigation reduces
crop production (Maralian et al., 2014). Many factors have led to a decrease in potato
production (Kiptoo et al., 2018). These factors influence crop physiological mechanisms such
as photosynthesis, transpiration and respiration processes. Consequently, low yield and poor
tuber quality are produced (Liao et al., 2016). Van Zyl and van der Westhuizen (2018)
reported that drought significantly reduced potato yield in Eastern Free State and KwaZulu-

130
Natal (KZN) regions, by 12.5 and 4.5 t/ha, respectively. On the other hand, Mangani et al.
(2015) reported that different potato spacing in a field affects crop development, tuber yield
and quality. Getachew et al., (2012) conducted a study on the influence of early and late
earthing-up on potato yield. Their findings demonstrated that early earthing-up improves
potato yield. A study by Rosen et al., (2014) reported that fertilizer plays a vital role in plant
growth, cell division, photosynthesis and respiration. Overall, these findings indicate that a
combination of cultural practices and environmental conditions have an enormous effect on
potato yields. There have been limited studies conducted that identify suitable potato
genotypes and cultural practices for different production sites in the KZN region. Therefore,
the lack of information may result in potato growers planting inappropriate genotypes to
certain production sites.
The province of KwaZulu-Natal is located on the eastern seaboard of the country is a
subtropical region, with a summer rainfall of 600 - 2 000 mm/annum (Steyn et al., 2009). The
province has a diverse climate, topography and soils (Joubert, 2012). Its soils range from
sandy loamy, loam to clay-loam soils (Steyn et al., 2009). Potato cultivation takes place
during August when temperatures range from 12.9 and 24.3 ºC (Steyn et al., 2009). Naidoo,
(n.d) in association with the department of agriculture and environmental affairs, tested
potato genotypes (including Mondial and Sifra among those genotypes) at different sites
(Nyangweni and Ndwedwe) in KZN regions to determine their adaptability and potential
production under smallholder farmers’ management practices. The author reported that
uneven irrigation affected potato yields at Nyangweni, especially for Sifrain the 2010 season.
But in 2011, the potato yields greatly improved due to reliable irrigation. All genotypes
planted at Ndwedwe site had high yield compared to Nyangweni site. The researcher
concluded that Mondial and Sifra can be recommended for smallholder farmers because of
their adaptability, rapid tuber initiation and high yield.
It is important to evaluate the adaptability of potato genotypes to various production sites.
Such information will enable potato growers to select the best suitable genotypes, the
production site and management practices that can be employed to ensure high yield. It was
hypothesized that location has no effect on potato growth and yield. Hence, the specific
objective of this study was to evaluate potato growth, physiological parameters, yield and
tuber quality of different potato genotypes grown under different production sites (Ukulinga
and eChibini) of KwaZulu-Natal.

131
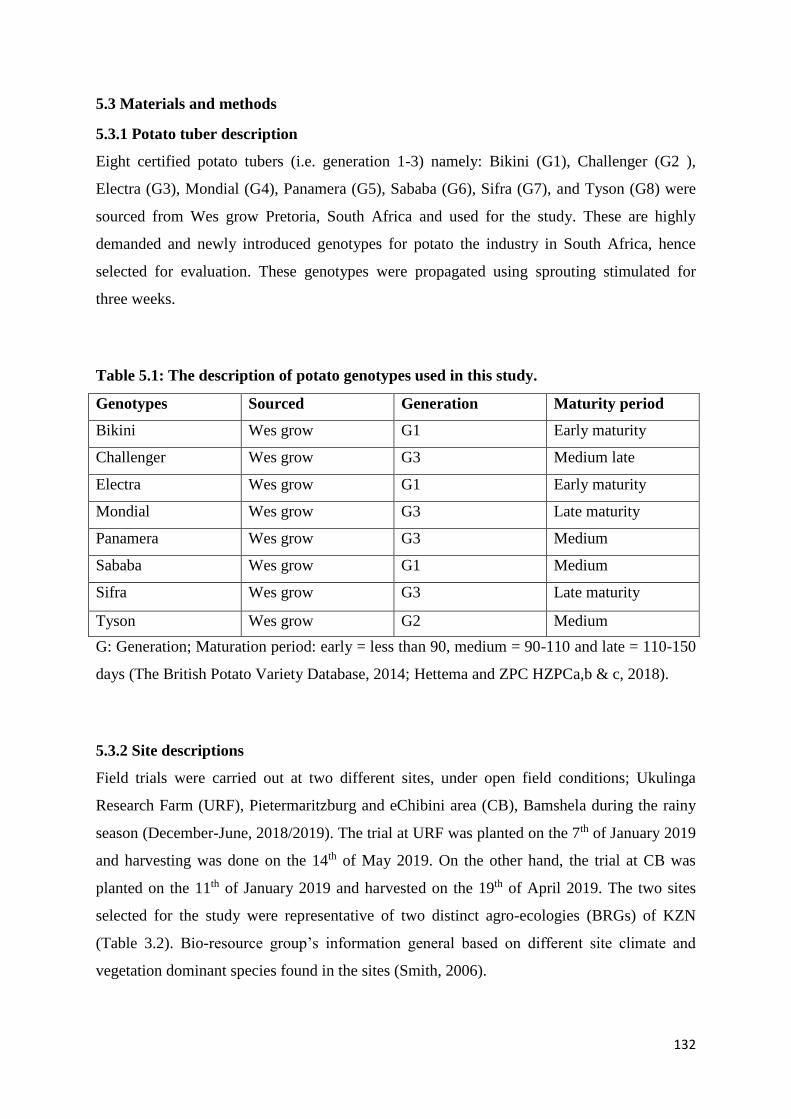
132
5.3 Materials and methods
5.3.1 Potato tuber description
Eight certified potato tubers (i.e. generation 1-3) namely: Bikini (G1), Challenger (G2 ),
Electra (G3), Mondial (G4), Panamera (G5), Sababa (G6), Sifra (G7), and Tyson (G8) were
sourced from Wes grow Pretoria, South Africa and used for the study. These are highly
demanded and newly introduced genotypes for potato the industry in South Africa, hence
selected for evaluation. These genotypes were propagated using sprouting stimulated for
three weeks.
Table 5.1: The description of potato genotypes used in this study.
Genotypes Sourced Generation Maturity period
Bikini Wes grow G1 Early maturity
Challenger Wes grow G3 Medium late
Electra Wes grow G1 Early maturity
Mondial Wes grow G3 Late maturity
Panamera Wes grow G3 Medium
Sababa Wes grow G1 Medium
Sifra Wes grow G3 Late maturity
Tyson Wes grow G2 Medium
G: Generation; Maturation period: early = less than 90, medium = 90-110 and late = 110-150
days (The British Potato Variety Database, 2014; Hettema and ZPC HZPCa,b & c, 2018).
5.3.2 Site descriptions
Field trials were carried out at two different sites, under open field conditions; Ukulinga
Research Farm (URF), Pietermaritzburg and eChibini area (CB), Bamshela during the rainy
season (December-June, 2018/2019). The trial at URF was planted on the 7th of January 2019
and harvesting was done on the 14th of May 2019. On the other hand, the trial at CB was
planted on the 11th of January 2019 and harvested on the 19th of April 2019. The two sites
selected for the study were representative of two distinct agro-ecologies (BRGs) of KZN
(Table 3.2). Bio-resource group’s information general based on different site climate and
vegetation dominant species found in the sites (Smith, 2006).

133
5.3.3 Experimental design and agronomic practices
The two experiments were laid out in a randomized complete block design replicated three
times. A total area of 313.1 m2 field made up of 8.1 m2 in size (3×2.7 m) single plot with
intra-spacing and inter-spacing of 0.3 x 0.9 m, respectively. Each plot had three of 3-meter
rows and 10 plants per row. Each plot contained 30 plants which made a total of 720 plants in
24 plots. Sites and potato genotypes were the main factors that were considered.
Prior to land preparation, soil samples were taken for soil fertility and textural analyses. At
URF, land preparation involved mowing the weeds, ripping, tilling and discing to achieve
fine soil particles. The crop was grown under dryland conditions with no supplementary
irrigation. Land preparation at CB only included tilling and disking. The organic fertilizer
composed of nitrogen (N), phosphorus (P) and potassium (K) at rate 164:32:16 kg ha-1
(N:P:K) was applied based on the results of soil fertility analyses of each site. According to
the local (CB) farmers' knowledge, no supplementary irrigation is required for the period of
crop growth. Planting rows from both sites were opened with a hand-hoe followed by (NPK)
organic fertilizer slightly buried with soil before aligning ten seed tubers in a three-meter row
(avoiding tuber being in contact with the fertilizer) and one meter (row) apart. Periodic weeds
and earthing-up were done by hand-hoeing.
Table 5.2: Experimental site description for Ukulinga Research Farm and eChibini,
Bamshela.
Description Ukulinga research farm eChibini
Geographic sites 29° 29'S, 30° 92' E 29° 29'S, 30° 92' E
Altitude range (m.a.s.l) 1 400 - 1 800 m 900 - 1 400 m
Bio-resource group (BRU) Moist highland sourveld Warm moist grassveld
Annual rainfall (mm) 800 - 1 265 mm 800 - 1 280 mm
Mean annual temperature (°C) 14.1 °C 17.1 °C
Frost amount Moderate frost Light and occasional
Soil texture Clay loamy soils Sandy loam soils
Clay content (%) 32 % 26 %
*Soil Classification, a Taxonomic System for South Africa 1991; y Metres above sea level. z
Values of soil water content are in percentage of volumetric water content (Smith, 2006).

134
5.3.4 Data collection
Plant development and plant physiology data were collected every two weeks in both sites.
Data collection included emergence %, plant growth, time to flowering, leaf physiology, total
yield, number of tubers, dry matter and specific gravity.
5.3.4.1 Tuber emergence percentage
Potato emergence rate is the percentage of tubers that emerge over the period of time (7, 14
and 21 DAP). Emergence percentage was recorded up to 21 days (Getachew et al., 2012).
The following formula was used to calculate the emergence rate:
Emergence rate (%) = Number of tubers emerged
Total number of tubers in a row× 100
5.3.4.2 Plant growth and leaf physiological response
Plant height was measured by a ruler from the base to the second youngest fully-formed leaf.
This average of randomly selected four plants, from each genotype, was determined. Time to
flowering were determined from the beginning of flowering from each genotype to the end.
Stomatal conductance, transpiration, photosynthesis and chlorophyll content index (CCI)
were determined at two weeks interval. Stomatal conductance, transpiration and
photosynthesis were determined simultaneously using the LI-6400 XT Portable
Photosynthesis System (Licor Bioscience, Inc. Lincoln, Nebraska, USA) measured from a
fully developed leaf. Chlorophyll content index was measured on the adaxial surface of the
second youngest fully formed, fully unfolded leaf using a SPAD 502 chlorophyll content
meter (Minolta, USA).
5.3.4.3 Determination of total yield and number of tubers per plant
The yield was determined according to Solaiman et al. (2015) with some modifications. At
physiological maturity, four plants from the middle-center row randomly selected of each 8.1
m2 plot in each replication and genotype were harvested and the tubers weighed immediately.
The following formula was used to calculate the tuber yield.
Tuber yield (t ha-1) =Yield (kg m¯2 )×10000 m2
1000 kg

135
At harvest, the average number of tubers per plant was physically counted from four plants in
each genotype randomly selected from each plot according to Khan et al. (2018) with some
modification.
5.3.4.4 Determination of dry matter content
Dry matter content was determined according to Bekele and Haile, (2019) using 200 g of
fresh sample tubers. The fresh sample was chopped into small pieces to accelerate the oven
drying process. Dry weights were determined by the oven to dry chopped samples at 70 oC
for 72 hours and re-weighed at 65 oC till constant weight obtained. The dry matter content
was calculated as a percentage of dry weight over fresh weight (g). Dry matter content (%)
was determined using the following equation.
Dry matter content (%) =Dry weight
Fresh weight× 100
5.3.4.5 Determination of specific gravity
The specific gravity was determined according to Steyn et al. (2009) with some
modifications. Washed potato tubers of 250 g (weighed in the air) were randomly taken from
each genotype and plot in both locations. Tubers were measured using weighed in air (Ma)
and water (Mw) method. The specific gravity of tubers was determined using the following
formula.
Specific gravity (gml-1) =Ma
Ma−Mw
5.3.5 Data analysis
Data were subjected to analysis of variance (ANOVA) using GenStat (Version 18, VSN
International, UK) and the significance of the difference between means was determined
using the Least Significant Difference (LSD) at 5% level of significance. The replications and
blocks were treated as fixed factors whereas genotypes, water regimes and their interactions
were considered as random factors.

136
5.4 Results
5.4.1 Emergence percentage
Emergence percentage results showed a highly significant (p < 0.001) difference among
genotypes, production sites and time to emergence. Interactions between genotypes and
emergence; production sites and emergence days were also highly significant (p < 0.001).
Genotypes and production sites (URF and CB) were significant (p < 0.05). Interaction
between genotypes, production sites and emergency days did not have a significant influence
on emergence percentage (Figure 5.1). There were no significant differences among
genotypes at seven days after planting in both sites. There was a delay in genotypes planted at
URF while those grown at CB shown a greater emergence % for all genotypes except for
Panamera. Emergence percentage at 14 days after planting ranged from 8.82 to 52.22 % at
CB while at URF emergence percentage ranged from 16.67 to 52.22 % after 14 days of
planting. Genotype Bikini had significantly higher emergence % followed by Tyson and
Electra whereas the lowest was recorded for Panamera and Mondial at CB after 14 days of
the plantation. At URF both Panamera (16.67 %) and Sifra (18.89 %) recorded the lowest %
while Challenger and Sababa had the highest emergence percentage of 52.22 and 48.89 %
respectively.
At 21 days after planting, the emergence percentage varied significantly between 22.22 %
(Panamera) and 92.22 % (Electra) among genotypes at CB while URF had an emergence
percentage ranged from 26.67 % (Panamera) to 66.67 % (Tyson) (Figure 5.1). All genotypes
at CB site recorded higher emergence > 60 % (except Panamera). At URF Panamera and
Sifra were affected by the site as they had the lowest emergence % compared to other
genotypes.
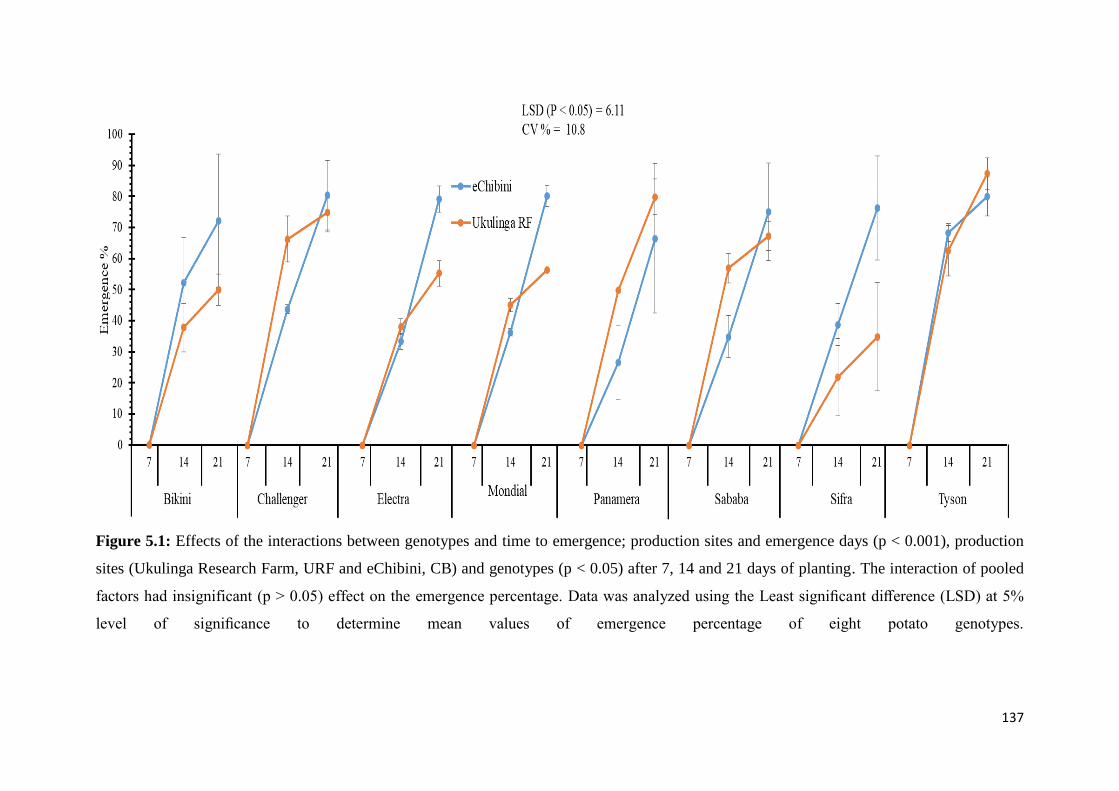
137
Figure 5.1: Effects of the interactions between genotypes and time to emergence; production sites and emergence days (p < 0.001), production
sites (Ukulinga Research Farm, URF and eChibini, CB) and genotypes (p < 0.05) after 7, 14 and 21 days of planting. The interaction of pooled
factors had insignificant (p > 0.05) effect on the emergence percentage. Data was analyzed using the Least significant difference (LSD) at 5%
level of significance to determine mean values of emergence percentage of eight potato genotypes.

138
5.4.2 Plant height
The plant height (PH) of potato genotypes was significantly (p < 0.001) influenced by the
interaction between genotypes, time and production site. Genotypes and time also showed a
significant interaction (p < 0.001; Table 5.3). The significant interaction between genotypes
and production site might be explained by higher PH at CB than at URF after 28 days after
planting (DAP). This was expected since CB had a faster emergence percentage compared to
genotypes grown at URF. Genotypes Bikini, Sifra and Mondial recorded lower PH while
Panamera, Tyson and Electra showed significantly higher PH at URF. The genotypes at CB
had significantly higher PH where Tyson and Electra were the tallest while Sifra and Bikini
were the shortest. At 98 DAP (Table 5.3) the interaction between genotypes, time and
production site influenced genotypes at URF where Sifra and Challenger were highly affected
whereas Panamera and Mondial were unaffected. At CB Panamera and Mondial showed
stunted growth and the rest of genotypes had >50 cm PH.

139
Table 5.3: Different production sites (URF and CB) effect on plant height for eight
potato genotypes, the pooled data of interaction for genotypes, time and production sites
showed significant.
Genotypes Plant height (cm)
28 DAP 98 DAP
URF CB URF CB
Bikini 14.58b 24.42de 48.08ab 56.50cde
Challenger 21.58c 28.42f 45.33a 60.17de
Electra 20.83c 35.33g 51.67bc 67.42f
Mondial 9.67a 35.00g 55.00cd 49.17ab
Panamera 14.42b 41.58h 60.58e 48.00ab
Sababa 22.25cd 28.83f 47.67ab 59.33de
Sifra 17.08b 25.58e 45.08a 55.17cd
Tyson 20.75c 35.75g 52.75bc 58.75de
p-value p < 0.05 p < 0.05 p < 0.05 p < 0.05
l.s.d 2.560 2.560 4.741 4.741
s.e.d 1.297 1.297 2.402 2.402
c.v 1.5 1.5 1.3 1.3
Note: Means in a column and treatment group followed by the same letter are not significantly
different from each other using the Least significant difference (LSD) at 5% level of significance,
sites; URF, Ukulinga research farm; CB, Chibini, Bamshela; DAP, Days after planting; p-value =
Significance of interaction between treatment x genotype; SE, standard error deviation; CV,
Coefficient of variation.

140
5.4.3 Stomatal conductance and transpiration rate
The results showed that the environmental condition (Table 5.2) highly affected potato
genotypes stomatal conductance (gs) during the initiation and tuber bulking stage (Figure
5.2). Highly significant differences (p < 0.001) were observed between production sites. The
interaction between genotypes and production sites showed significant differences (p < 0.05)
also genotypes and production site revealed significant differences, but the interaction
between genotypes, the production site and the stage were insignificant (p > 0.05).
Comparing both production sites genotypes at URF recorded high gs than CB during tuber
initiation as well tuber bulking stage. Chibini gs during tuber bulking it was highly affected
by the environmental condition. The high annual temperature during the day and drizzling
afternoon could be one of the factors in lowering gs at CB. All genotypes maintained similar
gs ranging from 2.09 to 2.18 molH2O m-2s-2 during tuber initiation but it gradually decreased
at the tuber bulking stage where Challenger (1.2768 molH2O m-2s-2) was highly affected
followed by Panamera (1.2943 molH2O m-2s-2). Genotypes planted at URF also recorded
similar gs ranging from 2.18 to 2. 34 molH2O m-2s-2) during tuber initiation but Electra (2.18
molH2O m-2s-2) and Mondial (2.21 molH2O m-2s-2) were affected since they recorded lower
values whereas Panamera (2.34 molH2O m-2s-2) followed by Sifra (2.29 molH2O m-2s-2) had
higher values.
Highly significant differences (p < 0.001) among genotypes and production sites at tuber
initiation and tuber bulking were also observed with respect to the transpiration rate (Figure
5.3). Significant differences were also recorded in the interaction between production site,
treatment and stage. As expected, genotypes planted at URF recorded a higher Tr throughout
compared to those grown at CB due to high gs. At tuber initiation, genotypes planted from
URF recorded a higher Tr > 24.48 mmol H2O m-2s-1. Electra and Mondial had lower Tr
during tuber initiation in both sites. Higher Tr was recorded for Panamera, (32.71 mmol H2O
m-2s-1) and Tyson (33.28 mmol H2O m-2s-1) during tuber initiation, Sifra (41.27 mmol H2O m-
2s-1) and Sababa (37.05 mmol H2O m-2s-1) during tuber bulking at URF while at CB was
observed for Challenger(29.82 mmol H2O m-2s-1) and Sifra (29.61 mmol H2O m-2s-1) during
tuber initiation, Sababa (28.55 mmol H2O m-2s-1) and Tyson (27.72 mmol H2O m-2s-1).

141
Figure 5.2: The effect of different production sites (CB and URF) on tuber initiation and tuber bulking stage on the stomatal conductance.
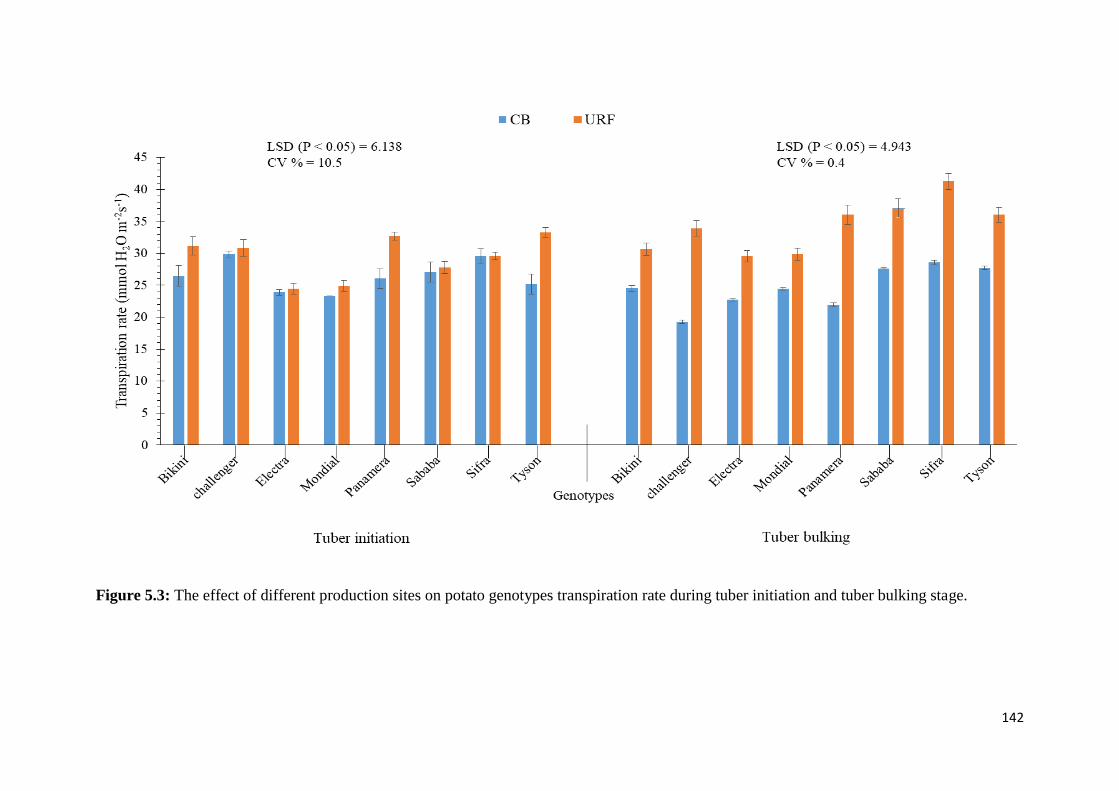
142
Figure 5.3: The effect of different production sites on potato genotypes transpiration rate during tuber initiation and tuber bulking stage.
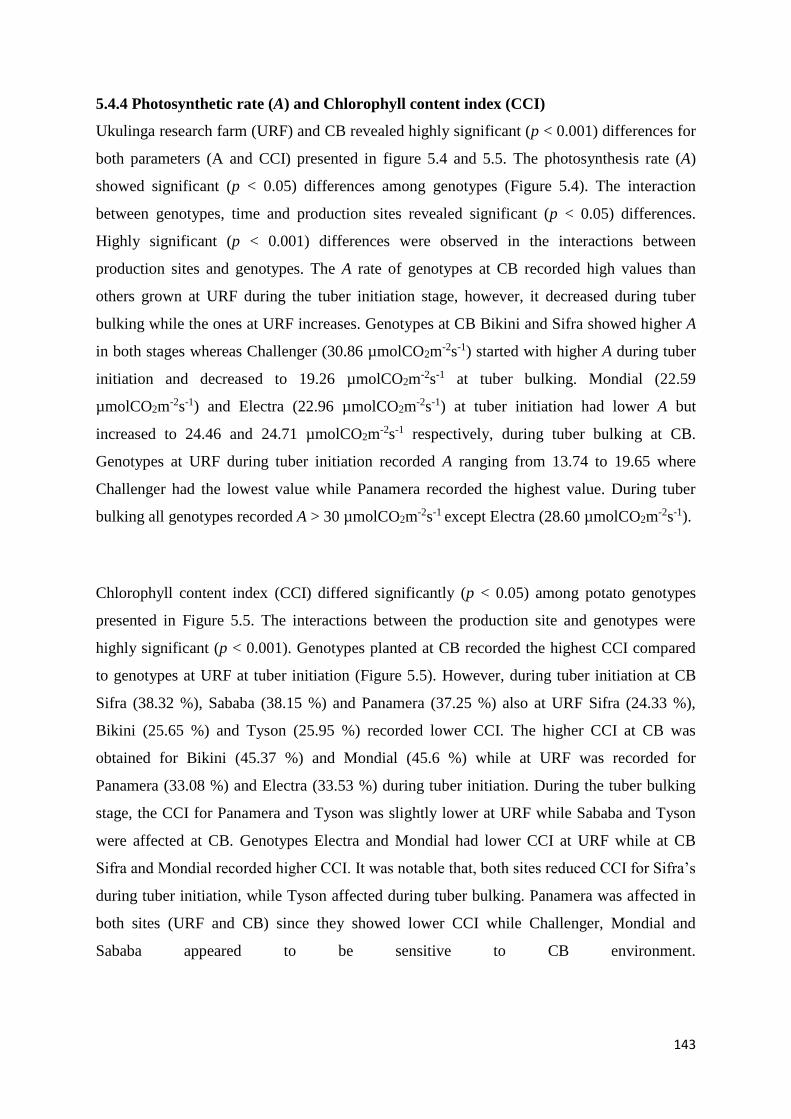
143
5.4.4 Photosynthetic rate (A) and Chlorophyll content index (CCI)
Ukulinga research farm (URF) and CB revealed highly significant (p < 0.001) differences for
both parameters (A and CCI) presented in figure 5.4 and 5.5. The photosynthesis rate (A)
showed significant (p < 0.05) differences among genotypes (Figure 5.4). The interaction
between genotypes, time and production sites revealed significant (p < 0.05) differences.
Highly significant (p < 0.001) differences were observed in the interactions between
production sites and genotypes. The A rate of genotypes at CB recorded high values than
others grown at URF during the tuber initiation stage, however, it decreased during tuber
bulking while the ones at URF increases. Genotypes at CB Bikini and Sifra showed higher A
in both stages whereas Challenger (30.86 µmolCO2m-2s-1) started with higher A during tuber
initiation and decreased to 19.26 µmolCO2m-2s-1 at tuber bulking. Mondial (22.59
µmolCO2m-2s-1) and Electra (22.96 µmolCO2m
-2s-1) at tuber initiation had lower A but
increased to 24.46 and 24.71 µmolCO2m-2s-1 respectively, during tuber bulking at CB.
Genotypes at URF during tuber initiation recorded A ranging from 13.74 to 19.65 where
Challenger had the lowest value while Panamera recorded the highest value. During tuber
bulking all genotypes recorded A > 30 µmolCO2m-2s-1 except Electra (28.60 µmolCO2m
-2s-1).
Chlorophyll content index (CCI) differed significantly (p < 0.05) among potato genotypes
presented in Figure 5.5. The interactions between the production site and genotypes were
highly significant (p < 0.001). Genotypes planted at CB recorded the highest CCI compared
to genotypes at URF at tuber initiation (Figure 5.5). However, during tuber initiation at CB
Sifra (38.32 %), Sababa (38.15 %) and Panamera (37.25 %) also at URF Sifra (24.33 %),
Bikini (25.65 %) and Tyson (25.95 %) recorded lower CCI. The higher CCI at CB was
obtained for Bikini (45.37 %) and Mondial (45.6 %) while at URF was recorded for
Panamera (33.08 %) and Electra (33.53 %) during tuber initiation. During the tuber bulking
stage, the CCI for Panamera and Tyson was slightly lower at URF while Sababa and Tyson
were affected at CB. Genotypes Electra and Mondial had lower CCI at URF while at CB
Sifra and Mondial recorded higher CCI. It was notable that, both sites reduced CCI for Sifra’s
during tuber initiation, while Tyson affected during tuber bulking. Panamera was affected in
both sites (URF and CB) since they showed lower CCI while Challenger, Mondial and
Sababa appeared to be sensitive to CB environment.

144
Figure 5.4: The rate of photosynthesis during tuber initiation and tuber bulking stage of potato genotypes grown at different production sites.

145
Figure 5.5: The influence of production sites on chlorophyll content index (CCI) during tuber initiation and tuber bulking stage of potato
genotypes grown under rainfed conditions (CB and URF).
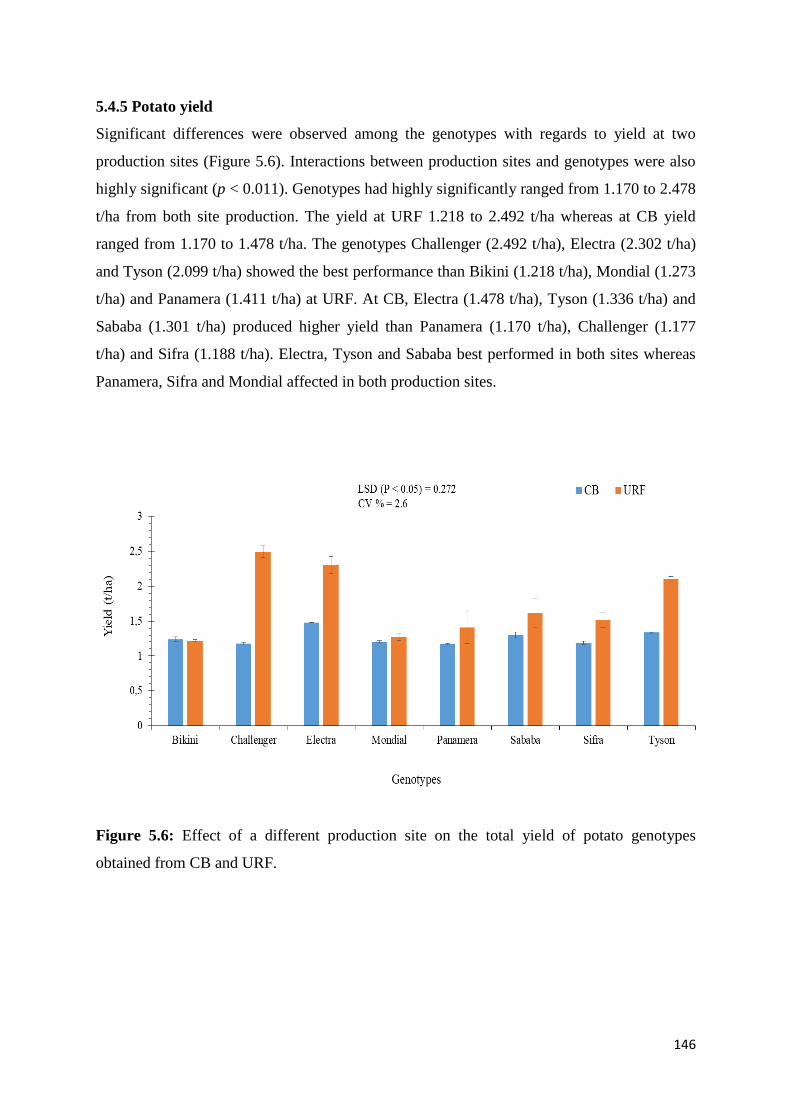
146
5.4.5 Potato yield
Significant differences were observed among the genotypes with regards to yield at two
production sites (Figure 5.6). Interactions between production sites and genotypes were also
highly significant (p < 0.011). Genotypes had highly significantly ranged from 1.170 to 2.478
t/ha from both site production. The yield at URF 1.218 to 2.492 t/ha whereas at CB yield
ranged from 1.170 to 1.478 t/ha. The genotypes Challenger (2.492 t/ha), Electra (2.302 t/ha)
and Tyson (2.099 t/ha) showed the best performance than Bikini (1.218 t/ha), Mondial (1.273
t/ha) and Panamera (1.411 t/ha) at URF. At CB, Electra (1.478 t/ha), Tyson (1.336 t/ha) and
Sababa (1.301 t/ha) produced higher yield than Panamera (1.170 t/ha), Challenger (1.177
t/ha) and Sifra (1.188 t/ha). Electra, Tyson and Sababa best performed in both sites whereas
Panamera, Sifra and Mondial affected in both production sites.
Figure 5.6: Effect of a different production site on the total yield of potato genotypes
obtained from CB and URF.
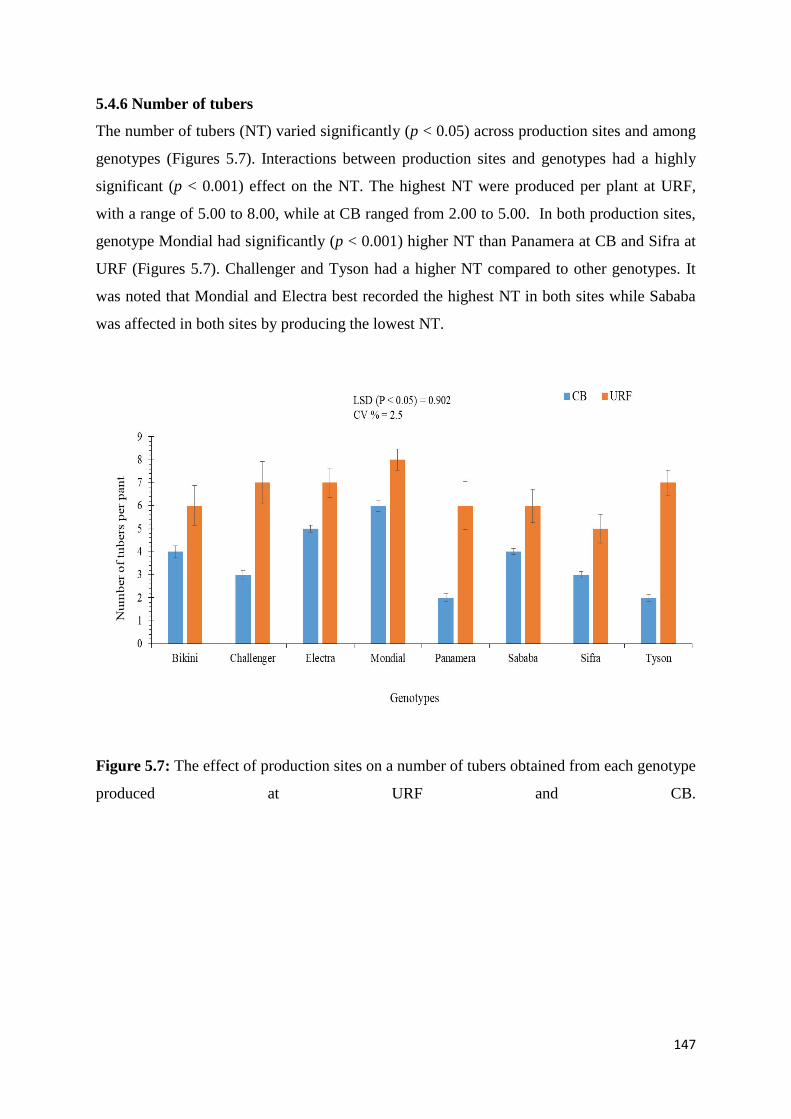
147
5.4.6 Number of tubers
The number of tubers (NT) varied significantly (p < 0.05) across production sites and among
genotypes (Figures 5.7). Interactions between production sites and genotypes had a highly
significant (p < 0.001) effect on the NT. The highest NT were produced per plant at URF,
with a range of 5.00 to 8.00, while at CB ranged from 2.00 to 5.00. In both production sites,
genotype Mondial had significantly (p < 0.001) higher NT than Panamera at CB and Sifra at
URF (Figures 5.7). Challenger and Tyson had a higher NT compared to other genotypes. It
was noted that Mondial and Electra best recorded the highest NT in both sites while Sababa
was affected in both sites by producing the lowest NT.
Figure 5.7: The effect of production sites on a number of tubers obtained from each genotype
produced at URF and CB.

148
5.4.7 Dry matter content (%)
The interaction between genotypes and production sites showed a significant difference with
Challenger and Panamera displaying a significantly higher DMC (20 and 19.18%) when
compared to the other genotypes at URF (Figure 5.8). The dry matter percentage obtained at
CB genotypes had a DMC percentage ranged from 13.71 to 17.47% with Sifra displaying a
significantly lower DMC (13%) when compared to higher Bikini and Electra (17.47 and
16.00%).
Figure 5.8: The influence of different production sites on tuber dry matter content of potato
genotypes.
5.4.8 Specific gravity
Specific gravity varied significantly (p < 0.05) among genotypes. The interaction between
production and genotypes was significant (p < 0.05) (Figure 5.9). The range of specific
gravity (gml-1) 1.0416 to 1.1043 gml-1 tubers harvested at URF and 1.0251 to 1.1348 gml-1
from tubers harvested at CB. Challenger and Sifra had higher SG in both production sites
whereas Bikini, Sababa and Electra (1.0251 gml-1, 1.0391 gml-1and 1.048 gml-1, respectively)
recorded lowest SG at CB. The lowest SG at URF was observed for Bikini (1.0416 gml-1) and
Electra (1.0445 gml-1).

149
Figure 5.9: The effect of production sites on the specific gravity of potato genotypes
produced at URF and CB.
5.5 Discussion and conclusion
Change in climatic conditions (Table 5.2) at the URF and CB production sites had a
significant effect on plant height, physiological traits, growth stages, yield and quality. High
clay content at URF might have contributed to the root stress which reduces nutrients uptake,
leading to delayed plant growth. On the other hand at CB sufficient soil moisture for growth
attributed to better plant growth as an indication of nutrients availability. Khanal et al. (2014)
and FAO, (2018) reported that temperatures below 15 °C (Table 5.2) and above 18 °C
influence plant development while below 10 °C causes little growth. This could have been
the main cause for the stunted plant growth at URF whereas at CB high photoperiod
improved genotypes vegetative growth.
During tuber initiation, genotypes stomatal conductance were high in both production sites
(Figure 5.2). It started to decrease at CB as the crop moved into the tuber bulking stage which
automatically reduced the transpiration rate while at URF increased for most genotypes
(Figure 5.3). At these stages coincided with increased demand for water by the crop, since
many leaves were transpiring, therefore the crop had to regulate stomata by closing it.
Stomatal closure is an indication of a water stress avoidance mechanism by a crop, however,
it also decreases carbon dioxide (CO2) intake from the atmosphere (Chaves et al., 2002). The
unavailability of CO2 affects the photosynthesis rate since it is the key substrate.

150
Environmental conditions such as sandy soils with low water holding capacity and high
temperatures create a drought stress condition, as a result, crops lower stomatal conductance
and CCI in response. This was evident at CB where grown genotypes recorded low values of
stomatal conductance, CCI and photosynthesis during tuber bulking and this translated into
low yield compared to URF (Figure 5.4 & 5.5). The difference in maturity period (Table 5.1)
of genotypes contributed to the flux in photosynthesis also planting season.
Further observation that explained the low stomatal conductance, photosynthesis and CCI
recorded at CB is a loss of water through the porous soil due to the poor holding water
capacity of the sandy soil (Table 5.2). Even though the environment has sufficient annual
temperature, but soil became problematic. Usually, crops grown in kind of soils can simply
experience water deficit despite significant rainfall, much water is drained away from the root
crop. Osakabe et al. (2014) reported that the decrease in stomatal conductance affirms the
closely related to the availability of soil water content.
The genotypes grown at URF had higher stomatal conductance and CCI which suggests that
photosynthesis was not limited. As a result, the leaves showed green pigment with no signs of
chlorosis. This advocated that there was adequate soil water to meet crop demands for growth
and evaporative even though plant height was slow compared to CB (Table 5.2). This
observation stresses the important role played by temperatures during planting dates at the
growth stage of potato crop (DAFF, 2015). The variations brought by climate change also
emphases the importance for small-scale farmers to stay vigilant about their environmental
conditions before the beginning of planting seasons to adjust their planting date based on the
environmental conditions. For example, genotypes seemed to be adaptive at URF than URF
based on the total yield obtained.
Potato genotypes with high dry matter content and specific gravity content (> 1.08 g ml- 1) are
targeted for processing, particularly when frying (Figure 5.8 & 5.9). The processing involves
limiting oil absorption, less water loss and guaranteeing textural stability in products (de
Freitas et al., 2012). Therefore, Bikini, Challenger, Panamera and Tyson showed good
potential for processing through frying and baking, due to a high dry matter content and
specific gravity, which would result in good textural quality end-products. Potatoes with
lower dry matter content and specific gravity (< 1.08 g ml- 1) could be used for canning and
boiling as advised by Rady and Guyer (2015). The above findings are in agreement with

151
those of Roy et al. (2017) who found that lower tuber weight and lower dry matter content of
tuber result to the lower specific gravity. These results indicate that the internal quality of a
potato is highly affected by the planting date, fertilizer type used and harvest day as stated by
Solaiman et al. (2015). Furthermore, Abong et al. (2009) concluded that potato genotypes
and stage of maturity are two important factors that significantly influenced dry matter
content and specific gravity in potato tubers.
In conclusion, this study provided evidence that environmental conditions can stress the
normal growth of potato genotypes through restricting crop growth patterns thus affecting
optimum yield. Based on the study Challenger, Electra, Tyson and Sababa had higher yield in
both sites. Notably, Mondial and Sifra performed best at URF and CB, respectively. The
similarities on dry mass of these genotypes were also reported by van Niekerk et al. (2016),
as they displayed characteristics of a waxy potato, evident from low dry matter content.
These genotypes can be recommended for these production sites. However, the results of this
study may need to be repeated since the climates always change as well as soil structure.

152
5.6 References
Abong, G.O., Okoth, M.W., Karuri, E.G., Kabira, J.N., Mathooko, F.M., 2009. Influence of
potato cultivar and stage of maturity on oil content of French fries (chips) made from
eight Kenyan potato cultivars. African Journal of Food Agriculture Nutrition and
Development, 9(8): 1667-1682.
Bradshaw, J.E., Bryan, G.J., Ramsay, G., 2006. Genetics resources (Including wild and
cultivated Solunum species) and progress in their utilisation in potato breeding. Potato
Research, 49: 49-65.
Chauvin, N.D., Mulangu, F., Porto, G., 2012. Food production and consumption trends in
sub-Saharan Africa: prospects for the transformation of the agricultural sector. United
Nation Development Programme, 24-26.
Chaves, M.M., Pereira, J.S., Maroco, J., Rodrigues, M.L., Richardo, Osorio, M.L., Carvalho,
I., Faria, T., Pinheiro, C., 2002. How plants cope with water stress in the field.
Photosynthesis and growth. Annals of Botany, 89: 907-916.
DAFF, [Department of Agriculture, Forestry and Fisheries]. 2015. Potatoes Production
guidelines. Compiled by Directorate Plant Production in collaboration with the ARC.
de Freitas, S.T., Pereira, E.I.P., Gomez, A.C.S., Brackmann, A., Nicoloso, F., Bisognin, D.,
2012. Processing quality of potato tubers produced during autumn and spring and
stored at different temperatures. Horticulture. Brasileira 30, 91-98.
Devaux, A., Kromann, P., Ortiz, O., 2014. Potatoes for sustainable global food security.
Potato Research, 57: 185-199.
FAO 2008a. The International Year of Potato. The Global Crop Diversity Trust and FAO’s
Plant Production and Protection Division. Rome, Italy. www.fao.org/potato-
2008/en/potato/index.html (Accessed on 13/05/2018).
FAO 2018b. Crop water information: Potato. Available from: www.fao.org/land-
water/databases-and-software/crop-information/potato/en/ (Accessed on14/05/2018).
Franke, A.C., Haverkort, A.J., Steyn, J. M., 2013. Climate change and potato production in
contrasting South African agro-ecosystems 2. Assessing risks and opportunities of
adaptation strategies. Potato Research, 56:51-66. DOI 10.1007/s11540-013-9229-x.

153
Getachew, T., Belew, D., Tulu, S., 2012. Yield and growth parameters of potato (Solanum
tuberosum L.) as influenced by intra row spacing and time of earthing up: in Boneya
degem district, central highlands of Ethiopia. International Journal of Agricultural
Research, 7(5): 255-265.
Hirut, B., Shimelis, H., Fentahun, M., Bonierbale, M., Gastelo, M., Asfaw, A., 2017.
Combining ability of highland tropic adapted potato for tuber yield and yield
components under drought. PLoS ONE 12(7): e0181541. https://doi.
org/10.1371/journal.pone.0181541.
Khanal, B., Uprety, D., 2014. Effects of storage temperature on post-harvest of potato.
International Journal of Research, 1(7): 2348-6848.
Kiptoo, S., Kipkorir, E.C., Kiptum, C.K., 2018. Effects of deficit irrigation and mulch on
yield and quality of potato crop. African Journal of Education, Science and
Technology, 4(4): 65-77.
Levy, D., Veilleux, R.E., 2007. Adaptation of potato to high temperatures and salinity: a
review. American Journal of Potato Research, 84: 487-506.
Liao, X., Su, Z., Liu, G., Zotarelli, L., Cui, Y., Snodgrass, C., 2016. Impact of soil moisture
and temperature on potato growth production using seepage and center pivot
irrigation. Agricultural Water Management, 165: 230-236.
Maralian, H., Nasrollahzadeh, S., Raiyi, Y., Hassanapanah, D., 2014. Responses of potato
genotypes to limited irrigation. International Journal of Agronomy and Agriculture
Research, 5(5): 13-19.
Muthoni, J., Kabira, J.N., 2015. Potato production in the hot tropical areas of Africa: progress
made in breeding for heat tolerance. Journal of Agricultural Science, 7(9): 220-227.
Naidoo, M., (n.d). Potato production for small-scale farmers. Department of agriculture and
environmental affairs. Province of KwaZulu-Natal.
https://www.kzndard.gov.za/images/Documents/RESOURCE CENTRE/fact-sheets-
brochures-and-
leaflets/Research%20and%20Technology%20Bulletins/POTATO_PRODUCTION_F
OR_SMALL-SCALE_FARMERS.pdf (Accessed on 12/05/2019).

154
Nyawade, S.O., Karanja, N.N., Gachene, C.K.K., Schulte-Geldermann, E., Parker, M., 2018.
Effect of potato hilling on soil temperature, soil moisture distribution and sediment
yield on a sloping terrain. Soil and Tillage Research, 184: 24-36.
Osakabe, Y., Osakabe, K., Shinozaki, K., Tran, L.S.P., 2014. Response of plants to water
stress. Plant Physiology, 5, 86.
Rady, A.M., Guyer, D.E., 2015. Rapid and/or non-destructive quality evaluation methods for
potatoes: A review. Computers and Electronics in Agriculture, 117, 31-48.
Rosen, C.J., Kelling, K.A., Stark, J.C., Porter, G.A., 2014. Optimizing phosphorus fertilizer
management in potato production. America Journal Potato Research, 91: 145-160.
Roy, T.S., Chakraborty, R., Parvez, N., Mostofa, M., Ferdous, J., Ahmed, S., 2017. Yield, dry
matter and specific gravity of exportable potato: response to salt. Universal Journal of
Agricultural Research, 5(2): 98-103.
Sanginga, N., Mbabu, A., 2015. Root and Tuber Crops (Cassava, Yam, Potato and Sweet
Potato). Feeding Africa: An Action plan for African Agricultural Transformation, 16-
21.
https://www.afdb.org/fileadmin/uploads/afdb/Documents/Events/DakAgri2015/Root
and Tuber Crops Cassava Yam Potato and Sweet Potato .pdf (Accessed on
13/09/2019).
Solaiman, A.H.M., Nishizawa, T., Roy, T.S., Rahman, M., Chakraborty, R., Choudhury, J.,
Sarkar, D., Hasanuzzaman, M., 2015. Yield, dry matter, specific gravity and colour of
three Bangladeshi local potato cultivars as influenced by stage of maturity. Journal of
Plant Sciences, ISSN 1816-4951 / DOI: 10.3923/jps.2015.
Steyn, J.M., Geremew, E.B., Annandale, J.G., Steyn, P.J., 2009. Frodo and Darius: South
African potato cultivars with good processing quality. South African Journal of Plant
and Soil, 26(1): 24-30.
Strydom, D.B., Terblanche, L., van Zy, H., Willemse, B.J., 2012. Reduction of transaction
cost within the South African potato processing industry. African Journal of
Agricultural Research, 7(47): 6265-6273.
Tessema, B.B., 2017. Genetic studies towards elucidation of drought tolerance of potato. PhD
thesis. Wageningen University, Wageningen, the Netherlands.

155
van Zyl, P., van der Westhuizen, D., 2018. South African potato production in a global
context. Bureau for Food and Agricultural Policy, 33-37.
Yuan, B.-Z., Nishiyama, S., Kang, Y., 2003. Effects of different irrigation regimes on the
growth and yield of drip-irrigated potato. Agricultural Water Management 63: 153-
167.
Zhu, F., Cai, Y-Z., Ke, J., Corke, H., 2010. Compositions of phenolic compounds, amino
acids and reducing sugars in commercial potato varieties and their effects on
acrylamide formation. Journal of the Science of Food and Agriculture, 90: 2254-2262.

156
Chapter 6: General discussion, conclusion and recommendations for future work
6.1 General discussion
Potato growers in South Africa are dependent on irrigation water (about 80 %) and rainfall
for production of potato (PSA, 2017). Potato yields output are relatively low particularly
under dry-land conditions, and this could be partly attributed to varied responses of the crop
at different growth stages. An understanding of crop responses and sensitive of key growth
stages to water stress is important under dryland conditions. To date, little is known on the
studied potato genotypes water usage on different growth stages because it has received little
research attention. Therefore, the overall aim of this study was to determine the responses of
locally popular and newly introduced potato genotypes to water stress under controlled and
field conditions.
A level of sensitivity to water deficit occurs at all growth stages of the crop but the sensitivity
varies among growth stages and genotype and that has effects on the final yield of the crop.
The yield formation stage is the most sensitive to water stress and this was confirmed in the
controlled study (Chapter 3 and 4).
The first objective investigated the effect of water deficit imposed at different growth stages
on morpho-physiological traits of different potato genotypes. Potato genotypes Bikini
exhibited drought tolerance at the vegetative stage, Challenger at the tuber initiation stage,
Electra at the tuber bulking and Mondial at maturity stage.
The study revealed that water deficit during tuberazation significantly affects tuber yield (fig
1a) and quality (Chapter 4), in agreement with reports by (Rodriguez et al., 2016; Saravia et
al., 2016; Rodríguez-Perez et al., 2017). The present study revealed that potato genotypes
Bikini, Challenger, Mondial and Sababa produced high tuber yields and high dry matter
content (fig 2) therefore they are suitable for the processing industry and baking.
The significant genotype x environment effect on growth, physiological traits and tuber yield
(chapter 5) suggested that the adaptation of different potato genotypes to different
agronomical areas varies. Potato genotypes planted at Ukulinga research farm (humid
environment) had higher yield compared to at eChibini. Challenger, Electra, and Tyson had
high yield at Ukulinga whereas at eChibini yield Tyson, Electra and Sababa were the higher.
Electra and Tyson were high-yielding in both sites but Ukulinga had higher number of tubers.
This indicate wide adaptation. The outcome noted that most genotypes (such as Panamera
157
and Sifra) struggled in areas highly dominated with sandy soil. Therefore, they should not be
grown in sandy soil areas without performing proper agronomic practices (correct planting
season, proper irrigation and ridging/earthing) that would ensures holding water capacity in
the soil.
6.2 Conclusion
The study aimed to gain a deeper understanding of growth, physiology and yield that may
determine the effect of production sites and water deficit occurring at different growth stages
of potato growth and development; and how these affect yield performance and subsequent
biomass production. The studied potato genotypes differed in relation to morpho-
physiological and quality traits when subjected to water deficit at different growth stages. For
this reason, we concluded that differences in physiological and morphological traits are
associated with water stress of the studied potato genotypes at various growth stages. This
allowed selection and recommendation of growth-stage specific drought tolerance potato
genotypes for production and processing. Farmers situated in areas with warm, temperate and
mild-climate with soils that vary from sandy loamy, light loamy to clay loamy can grow these
genotypes (Challenger, Electra, Tyson and Mondial) however they should mindful of
temperature and planting dates, since they tend to be sensitive to changes in environmental
conditions, particularly extreme temperatures. The study was able to validate that potato
growth, yield and quality are affected by various environmental conditions such as
temperature, soil type and climate change not only water deficit.
6.3 Recommendations and future prospects
The differences among potato genotypes in response to production sites and water deficit
imposed at different growth stages were successfully detected using physiological and
morphological traits, the best performing genotypes in terms of yield were also identified.
Vegetative stage and in between late tuber bulking to maturity stage were identified as
drought tolerant stages compared to other growth stages, but potato genotypes response were
dependent. However, the biochemical changes could not be analysed, therefore, further
experiment on determination of sugar content using high standard apparatuses such as high-
performance liquid chromatography (HPLC) and other secondary properties (phenolics and
ascorbic acid (AA)) linked with water deficit, are recommended. It is also recommended to

158
repeat the experiment using many potato genotypes and more regions so that adaptation can
be in viewed in wide areas.

159
References
Onder, S., Caliskan, M.E., Onder, D., Caliskan, S., 2005. Different irrigation methods and
water stress effects on potato yield and yield components. Agricultural Water
Management, 73: 73-86. Potato South Africa. 2014-2017. Potato Industry Research
Strategy. Published report. Potato South Africa, Pretoria. RSA. (Accessed on
22/03/2018).
Rodríguez, L.P., Sanjuanelo, D.C., Nustez, C.E.L., Moreno-Fonseca, L.P., 2016. Growth and
phenology of three Andean potato varieties (Solanum tuberosum L.) under water
stress. Agronomia Colombiana, 34(2): 141-154.
Rodriguez-Perez, L., Nustez, C.E.L., Moreno, L.P.F., 2017. Drought stress affects
physiological parameters but not tuber yield in three Andean potato (Solanum
tuberosum L.) cultivars. Agronomia Colombiana, 35(2): 158-170.
Saravia, D., Farfán-Vignolo, E.R., Gutiérrez, R., De Mendiburu, F., Schafleitner, R.,
Bonierbale, M., Khan, M.A., 2016. Yield and physiological response of potatoes
indicate different strategies to cope with drought stress and nitrogen fertilization.
American Journal of Potato Research, 93: 288-295.