response by the southern regional education board to
TRANSCRIPT

Response by the Southern Regional Education Board to Sunset Hearing
Questions
For Southern Regional Education Compact
(Section 49‐12‐101, Tennessee Code Annotated)
Sunset Termination June 2020
1. Provide a brief introduction to the Southern Regional Education Compact and
the Southern Regional Education Board. Who, in Tennessee, has primary
responsibility for execution of provisions of the Compact?
The Southern Regional Education Board, created in 1948, is the nation’s first interstate compact for
education. It is the only one involved in all levels of education, from PreK to workforce. SREB’s mission is
to guide and support states as they advance all levels of education to improve the social and economic
vitality of the SREB region. SREB’s vision is that each child and adult in the SREB region will have high‐
quality educational opportunities that build on the rich diversity of the region and lead to productive,
meaningful lives and robust economies.
NOTE: In June 2019, the SREB Board approved a strategic plan for the organization. SREB staff are
currently working on identifying strategies for reaching those goals and metrics to measure its progress.
SREB’s strategic plan (mission, vision and goals) and a How We Work graphic are attached.
Working cooperatively with the states, SREB helps government and education leaders improve
educational quality and opportunity. SREB assists states leaders by identifying and directing attention to
key issues and collecting, compiling and analyzing comparable data. In addition, SREB conducts broad
studies and initiates discussions that lead to recommendations for state and institutional long‐range
planning, actions, and policy proposals.
SREB also serves as administrator and fiscal agent in arrangements for multi‐state educational services
and programs. As one example, the SREB Academic Common Market (ACM) enables Tennessee
residents to earn degrees in specialized university programs throughout the SREB states while still
paying in‐state tuition. Through the ACM, Tennessee residents have access to 262 programs in other
states that are not available in Tennessee, and Tennessee institutions offer 288 programs to students
from other states in the ACM.
SREB’s governing Board is composed of 80 members, five from each of the SREB states. The SREB staff,
based in Atlanta on the Georgia Institute of Technology campus, is led by Dr. Stephen Pruitt, president.
Advisory groups to the Board include the SREB Legislative Advisory Council. Currently, two special SREB
working groups are currently examining critical education topics, the SREB Dual Enrollment Initiative and
the Commission on Strategic Partnerships for Work‐Ready Students. Shanita Brown, Director of
Enrollment Management, Southwest Tennessee Community College, serves on the Dual Initiative’s
Advisory Panel. The Initiative’s work will inform SREB work with the states on those topics. In December
of 2018, the SREB Teacher Preparation Commission released its recommendations. Commission
members from Tennessee were L. Anthony Wise, President of Pellissippi State College, former state

legislator Roger Kane and Jamie Woodson, Executive Chairman and CEO, Tennessee State Collaborative
on Reforming Education The report’s findings have spurred a new phase of work in some SREB states—
Education Human Capitol Roundtables.
2. What other states have entered into the Compact with Tennessee? Have any
states beyond the fourteen (14) states enumerated in Section 49‐12‐101,
Tennessee Code Annotated, entered into the Compact?
The 16 members of the Compact are: Alabama, Arkansas, Delaware, Florida, Georgia, Kentucky,
Louisiana, Maryland, Mississippi, Oklahoma, North Carolina, South Carolina, Tennessee, Texas, Virginia,
West Virginia.
Tennessee and 14 of the states listed above (excluding Delaware) were the original states who
participated in drafting the Compact and whose legislatures ratified it. The Tennessee legislature ratified
the SREB Compact in 1949, becoming the seventh state to do so.
3. Who are Tennessee’s representatives on the Board of Control for Southern
Regional Education?
The Board includes the governor and four gubernatorial appointees from each member state, including
at least one state legislator and one educator. Board members serve four‐year staggered terms, with
one member being appointed annually. Section 49‐12‐101 of the Tennessee Code states that the
members of the Board “shall consist of the governor of each state ex‐officio and four (4) additional
citizens of each state to be appointed by the governor thereof, at least one of whom shall be a member
of the legislature of the state.” Tennessee’s current representative on the Board are:
Bill Lee, Governor of Tennessee, Nashville, ex officio
Beth Cox, Hendersonville
Eddie Smith, former State Representative, Knoxville
Mark White, State Representative, Memphis
L. Anthony Wise, President, Pellissippi State College, Knoxville
The Legislative Advisory Council of legislators from each state advises the Board. Members are
appointed by the governor. Tennessee’s current representatives on the Legislative Advisory Council are:
John DeBerry, State Representative, Memphis
Bill Dunn, State Representative, Knoxville
Ferrell Haile, State Senator, Gallatin
Mark White, State Representative, Memphis
4. Have any party states withdrawn from the Compact or filed notice of their
intent to withdraw? If so, which states and what were their stated reasons for
withdrawal?

All the 15 original states that created the Southern Regional Education Board and Delaware are current
members of the Compact. No state has indicated its intention to withdraw from the Compact.
5. How is the Compact funded? What were the compacts revenues and
expenditures for Fiscal Years 2018 and 2019? What is the cost for Tennessee to
participate in the Compact? What types of expenses are involved?
The Board of Control for the Southern Regional Education, d/b/a/ the Southern Regional Education
Board, has 16 member states. Each of those states pays the same amount in a compact appropriation
and that amount is determined by a vote of the Board each year at its annual meeting. For FY 2017‐
2018, the appropriation was $202,391. For FY 2018‐19, the appropriation was $205,497. For FY 2019‐20,
the appropriation is $208,508. Appropriations from each member state support core operations and
services. SREB leverages the long‐standing commitments of states to attract external funding—as much
as 10 to 15 times in funding‐‐in external grants and contracts for specific education improvement
projects to members states. The financial reports attached detail the sources of revenues and the expenditures for FYs 2018-2019.
6. Are the Compact’s revenues and expenditures periodically audited? If so, by
whom? Who gets copies of these reports? If available, please provide either a
copy of or a link to the most recent audit report.
The Board of Control for Southern Regional Education is audited annually by an outside auditing firm,
Warren Averett. The audits are sent to the entire board. The last two audited financial statements are
attached.
7. How many times did the Board of Control meet in Fiscal Years 2018 and
2019? Which representatives from Tennessee attended these meetings? Are
minutes of these meetings maintained, and if yes, where are they maintained?
The Board or its committees have met four times in the past two years. The Annual Meeting is held each
year in June. The Executive Committee meets during Annual Meeting and usually once more during the
year to continue the Board’s business during the interim. The Finance Committee meets as needed by
conference call. Minutes of the Board’s Annual Meeting and meetings of the Executive Committee are
kept in the President’s Office of the Southern Regional Education Board.
November 2017 Executive Committee Meeting
Executive Committee member attending: Representative Harry Brooks
June 2018 Southern Regional Education Board Annual Meeting and 67th Legislative Work Conference
Board members attending: Representative Mark White; L Anthony Wise
Legislative Advisory Council members attending: Senator Reginald Tate; Representative Eddie Smith

Delegates to the Legislative Work Conference designated by Legislative leadership to attend:
Senator Ferrell Haile, Representative John DeBerry
November 2018 Executive Committee meeting at the Winter Meeting of the Legislative Advisory
Council
No member from Tennessee attended
June 2019 Southern Regional Education Board Annual Meeting and 68th Legislative Work Conference
Board member attending: Representative Mark White
Delegates to the Legislative Work Conference designated by legislative leadership to attend:
Representative Bill Dunn, Senator Delores Gresham
The Finance Committee has a conference call scheduled for December 17, 2019.
8. PER DIEM QUESTIONS
Additional information for THEC:
SREB covers expenses of members of the Board and the Legislative Advisory Council to attend its
meetings, consistent with its reimbursement process. Some items are covered as general expenses
charged to SREB (such as meals at the meeting and hotel rooms; some items are reimbursed directly to
the member who incurs the expense (mileage if the member drives, etc. Legislative Work Conference
designees’ expenses at the meeting are covered; they are expected to seek reimbursements from
according to their state’s procedures. No registration fee is charged for SREB meetings. We have records
of reimbursements to Tennessee members attending meetings since 2014 totaling $12,948.82
9. Do the Tennessee representatives meet to confer other than at Board of Control meetings? If so, what records are kept of these meetings and by whom?
Additional meetings and conferences were held in 2018 and 2019, often in tandem with other
convenings. For the Legislative Advisory Council and the Legislative Work Conference, attendance and
program session information is kept in the office of State Services at SREB. For commissions and work
groups, the SREB office staffing the group keeps attendance and program session records.
These meetings include:
November 2017: Meeting of the Southern Regional Education Board Legislative Advisory Council:
Tennessee LAC members attending: Senator Reginald Tate, Representative Mark White
November 2018: Meeting of the Southern Regional Education Board Legislative Advisory Council
Tennessee LAC member attending: Representative Mark White
November 2019: Meeting of the Southern Regional Education Board Legislative Advisory Council

Tennessee LAC member attending: Representative Bill Dunn
10. Did the Board of Control create an executive committee and a finance
committee? If yes, which representatives from Tennessee serve on each
committee? If no representative from Tennessee is currently serving on either
committee, who were the last Tennessee members to serve in those
committees and when did they serve?
The Board of Control has an Executive Committee that also acts as the Finance Committee. One member
of the Board from each state serves on Executive Committee. Currently, Tennessee is not represented
on the Executive Committee, but SREB is working to correct that. Tennessee has a vacancy because
former Representative Harry Brooks, a member of the Board who served as Tennessee’s Executive
Committee representative, is no longer on the Board. He served from 2013‐2018 in that capacity.
11. What reports are prepared in conjunction with the operations and activities
of the Compact? Who receives these reports? Please provide a copy of or
attach a link to any relevant reports prepared in Fiscal Years 2018 and 2019.
Copies of SREB reports are mailed to Board members, LAC members, and others, including state
legislative education committee members and others, depending on the topic. The list below provides a
representative sampling our recent publications. All publications can be found on the SREB website at
https://www.sreb.org/
Tennessee Specific Reports
Tennessee: State Economic Outlook
https://www.sreb.org/publication/tennessee‐0
Tennessee Featured Facts from the Fact Book on Higher Education
https://www.sreb.org/publication/tennessee‐featured‐facts
Tennessee College Affordability Profile
https://www.sreb.org/publication/tennessee
Tennessee: Looking Closer: 2018 Biennial State Progress Report
https://www.sreb.org/publication/pre‐k‐benefits‐2018‐update
Tennessee Professional Learning
https://www.sreb.org/post/tennessee‐professional‐learning
Tennessee ESSA Accountability Provisions and Expectation for College and Career Readiness
https://www.sreb.org/post/tennessee‐accountability

Policy reports and briefs
Educators
State Policies to Improve Teacher Preparation: Report of the SREB Teacher Preparation Commission
https://www.sreb.org/publication/state‐policies‐improve‐teacher‐preparation
Mentoring New Teachers: A Fresh Look
https://www.sreb.org/mentoring
Improving Educator Feedback and Support: Lessons from Eight SREB States
https://www.sreb.org/publication/improving‐educator‐feedback‐and‐support‐lessons‐eight‐sreb‐states
Workforce
Unprepared and Unaware: Upskilling the Workforce for a Decade of Uncertainty
https://www.sreb.org/publication/unprepared‐and‐unaware
The SREB Region’s Economic Outlook: The Potential Impact of Automation and AI
https://www.sreb.org/publication/sreb‐regions‐economic‐outlook
A Unified Statewide Vision: Aligning ESSA, Perkins V and WIOA Across the Lifespan
https://www.sreb.org/publication/three‐federal‐statutes‐one‐state‐plan
Three Federal Statutes — One State Plan: Coordinating ESSA, Perkins V and WIOA
https://www.sreb.org/publication/three‐federal‐statutes‐one‐state‐plan
Above and Beyond: How SREB States Prioritize College and Career Readiness in ESSA Accountability
Plans
https://www.sreb.org/publication/above‐and‐beyond‐how‐sreb‐states‐prioritize‐college‐and‐career‐
readiness‐essa
Reading and mathematics in the early grades
Early Math Matters: Factoring in Teacher Knowledge and Practice
https://www.sreb.org/publication/early-math-matters
Ready to Read, Ready to Succeed: State Policies That Support Fourth‐Grade Reading Success
https://www.sreb.org/publication/ready‐read‐ready‐succeed
Dyslexia Policies to Improve Teacher Preparation
https://www.sreb.org/publication/dyslexia‐policies‐sreb‐states

Repeating a Grade: How Well Does It Work?
https://www.sreb.org/publication/repeating‐grade‐how‐well‐does‐it‐work
Research Recommendations for Dyslexia Screening
https://www.sreb.org/sites/main/files/file‐
attachments/dyslexia_screening_requirements_in_sreb_states_rev_oct_2018.pdf?1540405426 Reading and Dyslexia Screening Components and Instruments in SREB States
https://www.sreb.org/publication/addressing‐dyslexia‐schools Pre‐K Benefits: 2018 Update
https://www.sreb.org/publication/pre‐k‐benefits‐2018‐update Other 10 Critical Issues in Educational Technology
https://www.sreb.org/news/10‐critical‐issues‐educational‐technology
Emerging Technologies and New Learning Models That Engage Students
https://www.sreb.org/publication/emerging‐technologies‐and‐new‐learning‐models‐engage‐
students
Expanding Accessibility to Digital Spaces Through Improved Policy and Practice
https://www.sreb.org/publication/expanding‐accessibility‐digital‐spaces‐through‐improved‐policy‐
and‐practice
Alignment of Instructional Materials: Trends in State Efforts and State Profiles
https://www.sreb.org/publication/alignment‐instructional‐materials
Promising practices and case studies
Literacy Across the Curricula: Teacher Success Stories
https://www.sreb.org/publication/literacy‐across‐curricula
Addressing Dyslexia in Schools: Lessons Learned From Two Texas School Systems
https://www.sreb.org/publication/addressing‐dyslexia‐schools
Beginning the Bachelor of Science in Nursing in High School: How Kentucky Created a 120 Credit Hour
Nursing Career Pathway

Legislative and budget actions on education and briefs
Improving School Climate
https://www.sreb.org/publication/improving‐school‐climate
School District Consolidation
https://www.sreb.org/publication/school‐district‐consolidation
State Legislative Reports
https://www.sreb.org/legislative‐actions‐education SREB tools for state policymakers and education leaders High School to College and Career Policies by topic and by state These profiles look at policies that affect students as they make their way from middle grades to high
school graduation and into college and careers. https://www.sreb.org/state‐policies‐high‐school‐
graduation‐and‐postsecondary‐readiness
SREB Insights (Compare and understand state policy and practice) https://insights.sreb.org/#/
SREB Data Exchange https://www.sreb.org/test‐sreb‐state‐data‐exchange‐about
2019 Fact Book on Higher Education https://www.sre.org/fact‐book‐ed‐data
12. What were the Compact’s major accomplishments during Fiscal Years 2018
and 2019? What plans and recommendations have been made to agencies and
officials of Tennessee regarding the development, establishment, acquisition,
operation, and maintenance of educational schools and institutions within
Tennessee? What, if any, actions have been taken based on these plans and
recommendations?
SREB received $400,000 in new grants in 2019.
Major publications, specifically the Teacher Preparation Commission report State Policies to
Improve Teacher Preparation and Unprepared and Unaware, were released, both leading to
requests for follow‐up work in states.
SREB staff testified in multiple states on issues ranging from states on issues ranging from school
climate and safety to dyslexia and from early reading to school finance to Perkins V.
SREB hosted numerous well attended and high quality convenings including the Legislative
Advisory Council, Legislative and Governors’ Staff, Go Alliance, Doctoral Scholars Institute, SREB‐
SARA, Making Schools Work and College and Career‐Readiness Standards Networking
Conferences and SREB State Leaders Forum.
SREB hosted numerous well attended and high quality convenings including the Legislative
Advisory Council, Legislative and Governors’ Staff, Go Alliance, Doctoral Scholars Institute, SREB‐

SARA, Making Schools Work and College and Career‐Readiness Standards Networking
Conferences and SREB State Leaders Forum.
SREB developed tools that states, districts and schools can use to evaluate quality.
Wrapped up the five‐year educator effectiveness grant and submitted reports to states on
progress monitoring and technical assistance.
Launched Networks for School Improvement in one urban district and developed rural districts
initiative.
SREB finalized work in Georgia related to a need‐based financial aid project and in Oklahoma
with an evaluation of the state’s promise program.
SREB increased collaboration with the other three regional compacts and several national and
regional agencies and organizations such as the National Governors Association, State Higher
Education Executive Officers, the Federal Reserve Bank of Atlanta and the Southern Association
of Colleges and Schools accrediting organization.
SREB research, testimony and assistance was used extensively by state legislators and state
education agencies in the areas of dyslexia and workforce education.
SREB’s report Unprepared and Unaware, released in February of 2019, was a call to action for states,
and generated interest among state policymakers. In 10 years, the impact of automation and AI will
mean that the SREB states may have as many as 18 million unemployable workers who will lack the skills
for the jobs that will be available. Meeting this challenge requires focusing both on adults currently in
the workforce and on students just beginning their educational journeys. To support state
conversations about this challenge, SREB produced state specific economic reports to help state
policymakers understand the impact of the changing job market and how prepared their workforce is
for the jobs of the future. Next up is a series of focused publications that will help states examine
solutions to many different aspects of being college or career ready.
SREB made a significant move into supporting states’ vision for improving the workforce by providing
technical assistance and guidance on the alignment of three federal grants, the Every Student Succeeds
Act, Perkins V, and the Workforce Innovation and Opportunity Act, signifying a significant tie to our
historical mission and niche that SREB fills well. This work began with a presentation to the Legislative
Advisory Council, followed by a discussion at the 2018 SREB State Leaders Forum. The work has
continued with additional publications and tools and a webinar series.
As states worked on their K‐12 accountability systems, SREB facilitated regular calls for a State
Accountability network, usually held monthly, between 4/28/17 and 12/3/ 18. The calls allowed SEA
colleagues around the region to share information about their ESSA accountability system planning, ask
each other questions, and request information from SREB to support their planning. Tennessee
Department of Education staff participated.
Based on research and self‐assessments, SREB School Improvement workgroups developed a new guide
for the curriculum and instruction review and college and career academy implementation rubric. A
team is working on a new site development workshop to assist schools in targeting gaps between
current practices and student achievement.
SREB’s School Improvement Office works actively in SREB states at the school and district level. The
information below summarizes some School Improvement activities.

Making Schools Work
For more than 30 years, SREB has helped teachers, counselors and school leaders empower youth to
connect the classroom with the real world. SREB’s efforts began in 1987 with High Schools That Work,
our premier school improvement process. Now known as Making Schools Work and spanning grades 3‐
14, the process is grounded in the belief that increased achievement starts with motivating students to
make the effort to succeed. Making Schools Work employs a distributed leadership approach to involve
the whole school in identifying problems that impact achievement and developing plans to solve them.
With designs for elementary grades (under development), middle grades, high schools and technology
centers, Making Schools Work shows school teams how to create improvement plans that address five
focus areas:
engaging students through quality instruction
• aligning curricula with state readiness standards
• ensuring that students can explore careers and complete career pathways that align with their
interests and aptitudes
• providing student supports that promote readiness
• promoting leadership for creating and supporting cultures of continuous improvement
Making Schools Work helps schools transform their practices so that students never have to ask, “Why
do I need to know this?” With Making Schools Work, students connect classroom learning with their
personal goals. Focus teams of teachers, counselors and school leaders collaboratively identify the steps
they need to take to address problems of practice. Based on W. Edward Deming’s Plan‐Do‐ Check‐Act
process, our facilitated approach to problem‐solving supports focus teams as they foster supportive
learning environments, integrate academic and technical content, improve achievement and empower
youth to explore and achieve their career goals. During the process, focus teams create a profile of a
college‐ and career‐ready graduate that clearly articulates the experiences, skills and knowledge
students should have. These profiles help teams establish improvement goals and revise their school’s
mission and vision to meet the needs of each student. Structured activities, shared resources and
ongoing coaching and professional development deepen teams’ understanding of effective school and
classroom practices.
School Improvement Services in Tennessee schools (note that these are fee for service contracts)
15‐16
Provided ongoing school improvement support including both Powerful Literacy Practices (PLP)
and Powerful Math Practices (PMP) as well as leadership coaching to Whittle Springs Middle
School in Knox County.
Provided ongoing school improvement support including both Powerful Literacy Practices and
Powerful Math Practices as well as leadership coaching to Dalewood Middle School in
Chattanooga.

Provided literacy support and Leadership Professional Development to middle and high schools
in Shelby County. This included workshops to all low performing schools and leadership
professional development to all middle and high schools.
Provided intensive school improvement support to Trezevant High School in Shelby County.
Provide PLP and PMP ongoing professional development to Campbell County Middle and High
School.
16‐17
Provided ongoing school improvement support to Howard High School in Chattanooga.
Conducted Technical Assistance Visits at four shared time career centers in Shelby County
Schools.
Provided intensive school improvement technical support to Trezevant High School in Shelby
County.
Provided literacy and leadership support to Jere Baxter Middle School in Metro Nashville Public
Schools.
Provided literacy and leadership support to nine identified middle schools that were in danger of
dropping into an at‐risk category.
17‐18
Facilitated strategic planning for a complete revamp of career technical education in Shelby
County Schools. This included preparing a report to the board with recommendations for
improvement.
Provided intensive school improvement technical support to Trezevant High School in Shelby
County.
Provided ongoing literacy and leadership support to three struggling middle schools in Metro
Nashville Public Schools.
Provided ongoing school improvement technical support to Howard High School in Chattanooga.
18‐19
Conducted a curriculum and instructional review and site development workshop in Rutherford
County Schools.
Conducted needs assessments in Shelby County Schools and facilitated the work for
reorganizing the division of college and career readiness. District is using SREB’s school
improvement process to increase early postsecondary opportunities for students.
Conducted a curriculum and instructional review and site development workshop at Brainerd
High School in Hamilton County.
Collierville High School implemented an Advanced Career pathway and teachers participated in
the summer teacher training institute.
19‐20
Providing instructional training and coaching to elementary and middle school teachers on
powerful literacy practices, and the high school is receiving training and coaching related to
powerful math practices.

Providing instructional training and coaching to two middle schools on powerful literacy
practices. The high school is implementing the Ready for High School Literacy and Mathematics
courses.
Participation at State Leaders Forum
SREB’s State Leaders Forum convenes legislators, policymakers, state board members, secondary and
postsecondary education leaders, and workforce development agency representatives to explore
policies that help youth graduate from high school with a head start on the postsecondary credentials
they need to secure good jobs in high‐demand fields.
Tennessee attendees at SREB’s State Leaders Forum in October 2015: 6
Tennessee attendees at SREB’s State Leaders Forum in November 2016: 3
Tennessee attendees at SREB’s State Leaders Forum in November 2017: 5
Tennessee attendees at SREB’s State Leaders Forum in December 2018: 1
Tennessee attendees at SREB’s State Leaders Forum in November 2019: 1
SREB Making Schools Work Conference
SREB’s Making Schools Work Conference features over 400 sessions that go to the heart of K‐12
educational challenges, such as ensuring equitable access to quality learning and addressing the effects
of poverty. Approximately, 3,500 educators in grades K‐12 attend this premiere professional learning
event. The conference was held at the Gaylord Opryland Hotel and Conference Center in 2014 (4,328
attendees) and 2017 (3,324 attendees). During the same years, SREB hosted the College and Career
Readiness Networking Conferences in Nashville. In 2014 the CCR Networking Conference had 1,197
attendees, and the 2017 conference had 1,015 attendees.
Teaching to Lead
SREB’s Teaching to Lead teacher preparation program helps new career and technical education
teachers become great teachers. Developed by SREB and the National Research Center for Career and
Technical Education (NRCCTE), Teaching to Lead supports CTE teachers who are entering the classroom
after successful careers. Teaching to Lead has been shown to improve teacher competence and self‐
efficacy in a study of the model conducted by the NRCCTE at SREB. Two districts in Tennessee have
implemented Teaching to Lead—Nashville Public Schools and Rutherford County Schools.
13. What, if any, agreements and arrangements has the board entered into with
and state(s) and educational institutions or agencies to provide facilities or
services for graduate, professional, and technical education during Fiscal Years
2018 and 2019? What were the results of these agreements?
Technology Purchasing
Schools, universities and agencies in SREB states saved $8.3 million on over $83 million in technology
purchases during fiscal year 2018 — more than double the FY2017 savings — through SREB’s
participation in MHECtech discount agreements. Organizations in each of the 16 SREB states
participated. Tennessee saved $640,238 on $6,473,518 in technology purchases in fiscal year 2018.

Academic Common Market
SREB’s Academic Common Market, previously mentioned, saved Tennessee students $1,905,230 in
tuition in 2017. That represents an average tuition savings of $13,609 per student participating. Updated
information for 2018‐19 is being prepared.
Reciprocity for On‐line Course Authorization
NC‐SARA is a nationwide system to offer more high‐quality distance education programs for students
and ease the regulatory burden on institutions through a state authorization reciprocity agreement. The
agreement allows states to authorize participating institutions within their borders to offer distance
education to students in other states. It eliminates the need for those institutions to offer distance
approvals from other states to where they serve students. The agreement is organized through the four
regional education compacts and states join SARA through their compact; colleges and universities join
through their states. By participating, colleges and universities in the SREB region save almost $30
million annually. Tennessee is an approved member of SARA. Colleges and universities in Tennessee
saved $8.9 million for initial authorization and save $2.6 million annually on renewals, according to
estimates in a return‐on‐investment study by the National Center for Higher Education Management
Systems. The attached charts display Tennessee date related to NC‐SARA.
The Regional Contract Program
The SREB Regional Contract Program gives students the opportunity to earn a professional health
degree from participating institutions in other states through in‐state tuition rates at public institutions,
or reduced tuition at private institutions. More than 600 students participate each year. Three different
colleges in Tennessee participate in the Regional Contract Program: Meharry Medical College, Southern
College of Optometry, and the University of Tennessee. Currently, TN does not pay RCP tuition for any
students; the state only receives Regional Contract Program funds for students. That means Tennessee’s
import ratio is 100%, since it doesn’t pay fees for any Tennessee students to go to other states.
More information about these programs, and the previously mentioned Academic Common Market, are
attached.
14. Describe any items related to the Compact that require legislative attention
and your proposed legislative changes.
No recommended changes.
15. Should Tennessee’s participation in the Compact be continued? To what
extent and in what ways would the absence of the Compact affect the citizens
of the Tennessee.
Yes, Tennessee’s participation in the Compact should be continued. SREB has 71 years of experience
that it can use to help Tennessee policymakers think strategically about improving education. As a
compact member, Tennessee can learn from other SREB states about best practices and can share its
achievements to help other states. SREB believes that states, districts, and universities can often do
more together than they can alone. Making this happen has been central to SREB’s work since its

beginning. SREB strives to help states find unique solutions to common problems. If Tennessee was not
a member of the compact, its students and institutions would not benefit from SREB‐administered
programs. For just four programs‐‐‐ the Academic Common Market, the Regional Contract Program,
SARA, and Technology Purchasing Savings—Tennessee colleges, schools, agencies and students gained
or saved $9.1 in the most recent year for which information is available.
SREB stepped forward decades ago and called for its states to reject double standards, aim for outpacing
national measures of performance and ensure high‐quality education for all students. In 2012, it set
goals for 2020. As states gauge their progress state leaders realize they will reach some goals that
seemed daunting, and they will also realize they need to accelerate the pace of gains if they are to reach
more goals by 2020. With a decision to aim for national measures and high quality, they made a claim—
“SREB states can lead the nation in educational progress.” That claim is as important today as it has
always been. SREB stands ready to help each of its states, including Tennessee, realize the bright future
that will result from educational progress. SREB can provide information, resources and facilitation on a
wealth of topics. As a compact member, that assistance is always available to Tennessee policymakers
and institutions to support Tennessee’s vision for education.

BOARD OF CONTROL FOR SOUTHERN REGIONAL EDUCATION
FINANCIAL STATEMENTS AND
SUPPLEMENTARY INFORMATION
FOR THE YEAR ENDED JUNE 30, 2018

BOARD OF CONTROL FOR SOUTHERN REGIONAL EDUCATION TABLE OF CONTENTS
JUNE 30, 2018
INDEPENDENT AUDITORS’ REPORT 1 FINANCIAL STATEMENTS
Statements of Financial Position 3 Statement of Activities 4 Statements of Cash Flows 7 Notes to the Financial Statements 8
SUPPLEMENTARY INFORMATION
Statement of Revenues and Expenses by Program 16
1
INDEPENDENT AUDITORS’ REPORT To the Board of Directors Board of Control for Southern Regional Education Report on the Financial Statements We have audited the accompanying financial statements of the Board of Control for Southern Regional Education (the “Board”) (a nonprofit organization) which comprise the statements of financial position as of June 30, 2018 and the related statements of activities and cash flows for the year then ended, and the related notes to the financial statements. Management’s Responsibility for the Financial Statements Management is responsible for the preparation and fair presentation of these financial statements in accordance with accounting principles generally accepted in the United States of America; this includes the design, implementation, and maintenance of internal control relevant to the preparation and fair presentation of financial statements that are free from material misstatement, whether due to fraud or error. Auditors’ Responsibility Our responsibility is to express an opinion on these financial statements based on our audit. We conducted our audit in accordance with auditing standards generally accepted in the United States of America. Those standards require that we plan and perform the audit to obtain reasonable assurance about whether the financial statements are free from material misstatement. An audit involves performing procedures to obtain audit evidence about the amounts and disclosures in the financial statements. The procedures selected depend on the auditor’s judgment, including the assessment of the risks of material misstatement of the financial statements, whether due to fraud or error. In making those risk assessments, the auditor considers internal control relevant to the entity’s preparation and fair presentation of the financial statements in order to design audit procedures that are appropriate in the circumstances, but not for the purpose of expressing an opinion on the effectiveness of the entity’s internal control. Accordingly, we express no such opinion. An audit also includes evaluating the appropriateness of accounting policies used and the reasonableness of significant accounting estimates made by management, as well as evaluating the overall presentation of the financial statements. We believe that the audit evidence we have obtained is sufficient and appropriate to provide a basis for our audit opinion.
2
Opinion In our opinion, the financial statements referred to above present fairly, in all material respects, the financial position of the Board as of June 30, 2018 and the changes in its net assets and its cash flows for the year then ended in conformity with accounting principles generally accepted in the United States of America. Report on Summarized Comparative Information We have previously audited the Board’s 2017 financial statements, and we expressed an unmodified opinion on those audited financial statements in our report dated September 30, 2017. In our opinion, the summarized comparative information presented herein as of and for the year ended June 30, 2017, is consistent, in all material respects, with the audited financial statements from which it has been derived. Report on Supplemental Information Our audit was performed for the purpose of forming an opinion on the basic financial statements of the Board taken as a whole. The supplemental schedule listed in the Table of Contents is presented for the purposes of additional analysis and is not a required part of the basic financial statements. Such information has been subjected to the auditing procedures applied in the audit of the basic financial statements and, in our opinion, is fairly stated in all material respects in relation to the basic financial statements taken as a whole.
Atlanta, Georgia October 18, 2018

BOARD OF CONTROL FOR SOUTHERN REGIONAL EDUCATION STATEMENTS OF FINANCIAL POSITION
JUNE 30, 2018 AND 2017
See notes to the financial statements. 3
2018 2017
CURRENT ASSETSCash and cash equivalents 12,860,290$ 11,611,499$ Investments 22,830,640 24,020,125Reimbursements receivable from grantors 2,415,113 2,533,240 Other current assets 938,789 909,560
Total current assets 39,044,832 39,074,424
NET PROPERTY AND EQUIPMENT 896,963 944,244
TOTAL ASSETS 39,941,795$ 40,018,668$
CURRENT LIABILITIESAccounts payable and accrued expenses 3,505,170$ 3,329,208$ Deferred revenues –
membership dues and grants 7,339,131 6,305,762Grants payable 2,251,424 1,897,021
Total current liabilities 13,095,725 11,531,991
NET ASSETSUnrestricted
Board designated 1,328,079 2,303,642 Undesignated 4,071,652 4,328,427
Total unrestricted 5,399,731 6,632,069 Temporarily restricted 21,425,339 21,833,608 Permanently restricted 21,000 21,000
Total net assets 26,846,070 28,486,677
TOTAL LIABILITIES AND NET ASSETS 39,941,795$ 40,018,668$
ASSETS
LIABILITIES AND NET ASSETS
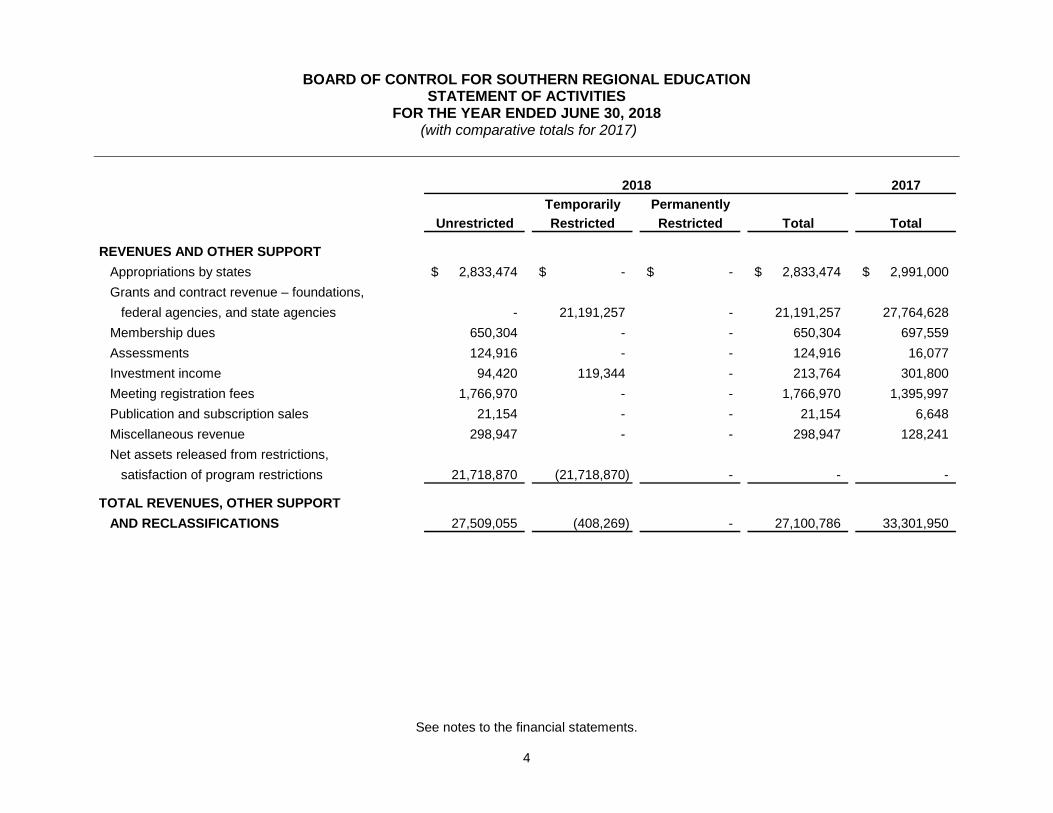
BOARD OF CONTROL FOR SOUTHERN REGIONAL EDUCATION STATEMENT OF ACTIVITIES
FOR THE YEAR ENDED JUNE 30, 2018 (with comparative totals for 2017)
See notes to the financial statements. 4
2017Temporarily Permanently
Unrestricted Restricted Restricted Total Total
REVENUES AND OTHER SUPPORTAppropriations by states 2,833,474$ -$ -$ 2,833,474$ 2,991,000$ Grants and contract revenue – foundations,
federal agencies, and state agencies - 21,191,257 - 21,191,257 27,764,628 Membership dues 650,304 - - 650,304 697,559 Assessments 124,916 - - 124,916 16,077 Investment income 94,420 119,344 - 213,764 301,800 Meeting registration fees 1,766,970 - - 1,766,970 1,395,997 Publication and subscription sales 21,154 - - 21,154 6,648 Miscellaneous revenue 298,947 - - 298,947 128,241 Net assets released from restrictions,
satisfaction of program restrictions 21,718,870 (21,718,870) - - -
TOTAL REVENUES, OTHER SUPPORTAND RECLASSIFICATIONS 27,509,055 (408,269) - 27,100,786 33,301,950
2018

BOARD OF CONTROL FOR SOUTHERN REGIONAL EDUCATION STATEMENT OF ACTIVITIES – CONTINUED
FOR THE YEAR ENDED JUNE 30, 2018 (with comparative totals for 2017)
See notes to the financial statements. 5
2017Temporarily Permanently
EXPENSES Unrestricted Restricted Restricted Total Total
RESEARCH AND PROGRAMSSalaries to staff 9,955,094$ -$ -$ 9,955,094$ 9,786,097$ Deferred annuity, group insurance premiums, and social security tax 2,082,849 - - 2,082,849 2,062,287 Fees for part-time consultants and assistants 3,976,783 - - 3,976,783 5,274,501 Contract services and grants 240,518 - - 240,518 2,356,990 Grants to agencies 3,015,404 - - 3,015,404 3,616,477 Travel and conferences 4,821,427 - - 4,821,427 5,573,384 Office operations 251,166 - - 251,166 261,801 Printing and production 267,744 - - 267,744 303,368 Rent and maintenance 166,050 - - 166,050 189,224 Professional services 679,112 - - 679,112 1,021,984 Computer services 177,742 - - 177,742 211,599 Other expenses 69,352 - - 69,352 279,734 Allocated general and administrative 513,353 - - 513,353 550,299
Total research and programs 26,216,594 - - 26,216,594 31,487,745
2018

BOARD OF CONTROL FOR SOUTHERN REGIONAL EDUCATION STATEMENT OF ACTIVITIES – CONTINUED
FOR THE YEAR ENDED JUNE 30, 2018 (with comparative totals for 2017)
See notes to the financial statements. 6
2017Temporarily Permanently
Unrestricted Restricted Restricted Total Total
GENERAL AND ADMINISTRATIVESalaries to staff 1,200,087$ -$ -$ 1,200,087$ 983,422$ Deferred annuity, group insurance
premiums, and social security tax 268,847 - - 268,847 232,637 Fees for part-time consultants and assistants 53,473 - - 53,473 44,967 Grants to individuals 491,744 - - 491,744 111,223 Travel and conferences 329,116 - - 329,116 205,916 Office operations 44,168 - - 44,168 33,456Printing and production 143 - - 143 902 Rent and maintenance 151,334 - - 151,334 152,207Depreciation 124,034 - - 124,034 139,149 Professional services 163,065 - - 163,065 75,369 Computer services 148,087 - - 148,087 130,895 Other expenses 64,054 - - 64,054 56,332 Allocated general and administrative (513,353) - - (513,353) (550,299)
Total general and administrative 2,524,799 - - 2,524,799 1,616,176
TOTAL EXPENSES 28,741,393 - - 28,741,393 33,103,921
CHANGES IN NET ASSETS (1,232,338) (408,269) - (1,640,607) 198,029
NET ASSETS AT BEGINNING OF YEAR 6,632,069 21,833,608 21,000 28,486,677 28,288,648
NET ASSETS AT END OF YEAR 5,399,731$ 21,425,339$ 21,000$ 26,846,070$ 28,486,677$
2018

BOARD OF CONTROL FOR SOUTHERN REGIONAL EDUCATION STATEMENTS OF CASH FLOWS
FOR THE YEARS ENDED JUNE 30, 2018 AND 2017
See notes to the financial statements. 7
2018 2017
CASH FLOWS FROM OPERATING ACTIVITIESChanges in net assets $ (1,640,607) $ 198,029 Adjustments to reconcile changes in net assets to
net cash provided by operating activitiesDepreciation 124,034 139,149 Net loss on investments 241,697 83,167 Changes in operating assets and liabilities
Reimbursements receivable from grantors 118,127 9,871,567 Other current assets (29,229) (88,519) Accounts payable and accrued expenses 175,962 (391,415) Deferred revenues 1,033,369 (5,591,379) Grants payable 354,403 88,204
Net cash provided by operating activities 377,756 4,308,803
CASH FLOWS FROM INVESTING ACTIVITIESRedemptions (purchases) of investments, net 947,788 (1,639,891) Purchases of equipment (76,753) -
Net cash provided by (used in) investing activities 871,035 (1,639,891)
NET INCREASE IN CASH AND CASH EQUIVALENTS 1,248,791 2,668,912
CASH AND CASH EQUIVALENTS
AT BEGINNING OF YEAR 11,611,499 8,942,587
AT END OF YEAR 12,860,290$ 11,611,499$

BOARD OF CONTROL FOR SOUTHERN REGIONAL EDUCATION NOTES TO THE FINANCIAL STATEMENTS
JUNE 30, 2018 AND 2017
8
1. ORGANIZATION The Board of Control for Southern Regional Education (the Board) was created in 1948 to serve as the operating agency of the nation’s first interstate compact working to improve public pre-K through 12th grade and higher education. Sixteen member states contribute funds to the Board to be used for administration, development, research and education programs. 2. SUMMARY OF SIGNIFICANT ACCOUNTING POLICIES Basis of Accounting The Board prepares its financial statements on the accrual basis of accounting in conformity with accounting principles generally accepted in the United States of America (GAAP). The Board presents its financial statements in accordance with Financial Accounting Standards Board (FASB) Accounting Standards Codification (ASC) 958-205, Not-for-Profit Entities Presentation of Financial Statements. Under FASB ASC 958, the Board reports information regarding its financial position and activities according to three classes of net assets: unrestricted net assets, temporarily restricted net assets, and permanently restricted net assets. Presentation The amounts shown for the year ended June 30, 2017 in the accompanying financial statements are included to provide a basis for comparison with 2018 and present summarized totals only. Accordingly, the 2017 totals are not intended to present all information necessary for a fair presentation in conformity with GAAP. Such information should be read in conjunction with the Board’s financial statements for the year ended June 30, 2017, from which the summarized information was derived. Reclassifications Certain 2017 accounts have been reclassified to conform to the 2018 presentation. Total net assets and changes in net assets, as previously reported for 2017, were unchanged due to these reclassifications. Cash and Cash Equivalents The Board considers all highly liquid instruments with an original maturity of three months or less to be cash equivalents. Money market funds and certificates of deposits with a maturity of greater than three months are classified as investments. Contributions, Grants and Net Assets Contributions are recognized when the donor makes a promise to give to the Board that is, in substance, unconditional. Contributions that are restricted by the donor are reported as increases in temporarily or permanently restricted net assets depending on the nature of the restrictions. When a restriction expires, temporarily restricted net assets are reclassified to unrestricted net assets.

BOARD OF CONTROL FOR SOUTHERN REGIONAL EDUCATION NOTES TO THE FINANCIAL STATEMENTS
JUNE 30, 2018 AND 2017
9
2. SUMMARY OF SIGNIFICANT ACCOUNTING POLICIES – CONTINUED Contributions, Grants and Net Assets – Continued The Board receives grants that are structured as contributions. The related revenue is recognized as described above. In addition the Board receives reimbursement basis grants for which revenue is recognized as expenditures are made. The permanently restricted classification is used if the donor stipulations are restricted for a specified purpose whereby gifts of cash and other assets must be invested in perpetuity to provide a permanent source of income for the Board. All of the income from permanently restricted net assets is derived from the Plunkett Endowment. The income from this endowment is used to provide an annual award to recognize an outstanding educator. Investments The Board adheres to the provisions of FASB ASC 820, Fair Value Measurements, for its investments. The standard provides guidance for using fair value to measure assets and liabilities. Under the standard, fair value refers to the price that would be received to sell an asset or paid to transfer a liability in an orderly transaction between market participants in the market in which the reporting entity transacts. It clarifies the principle that fair value should be based on the assumptions market participants would use when pricing the asset or liability. Investments measured and reported at fair value are classified and disclosed in one of the following categories:
• Level 1: Quoted prices for identical instruments in active markets at the measurement date. Investments that are listed on a United States securities exchange are valued at their last sales price on the largest United States securities exchange on which such securities have traded.
• Level 2: Quoted prices for similar instruments in active markets; quoted prices for identical or similar instruments in markets that are not active and model-derived valuation in which all significant inputs and significant value drivers are observable in active markets at the date and for the anticipated term of the instrument.
• Level 3: Valuation derived from valuation techniques in which one or more significant inputs or significant value drivers are unobservable inputs that reflect the reporting entity’s own assumptions about the assumptions market participants would use in pricing the asset or liability developed based on the best information available in the circumstances.
In certain cases, the inputs used to measure fair value may fall into different levels of the fair value hierarchy. In such cases, an investment’s level within the fair value hierarchy is based on the lowest level of input that is significant to the fair value measurement. The Board’s assessment of the significance of a particular input to the fair value measurement in its entirety requires judgment, and considers factors specific to the investment.
BOARD OF CONTROL FOR SOUTHERN REGIONAL EDUCATION NOTES TO THE FINANCIAL STATEMENTS
JUNE 30, 2018 AND 2017
10
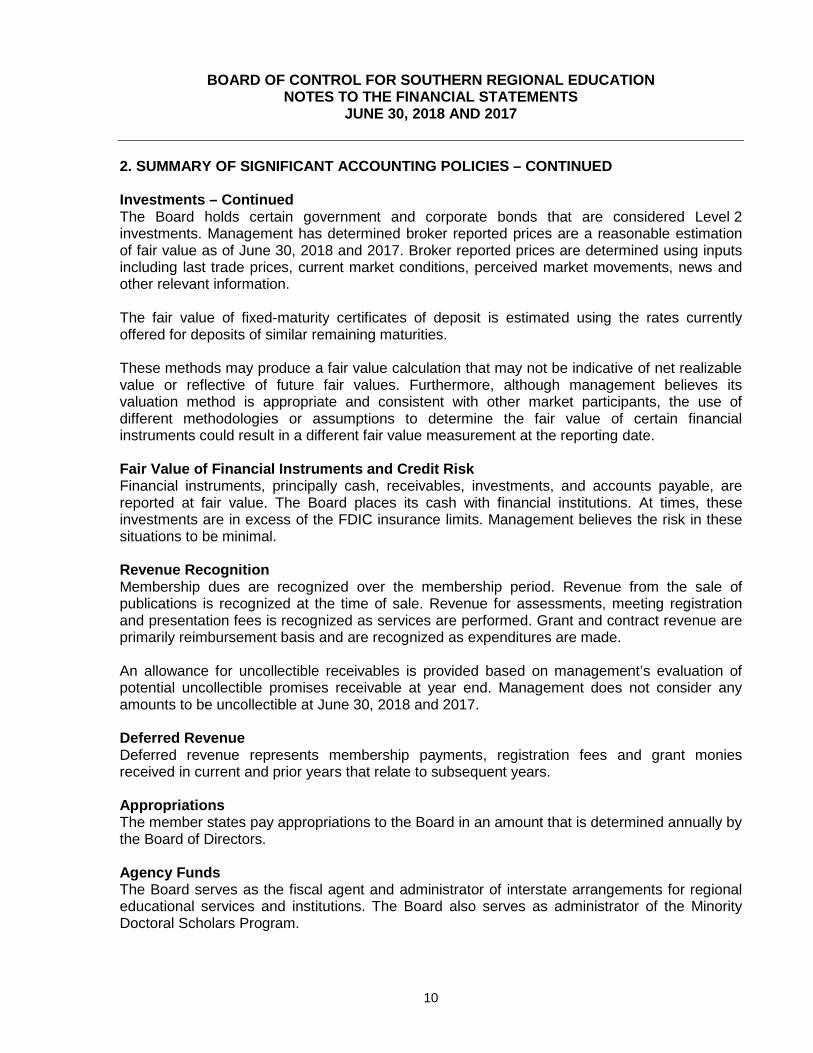
2. SUMMARY OF SIGNIFICANT ACCOUNTING POLICIES – CONTINUED Investments – Continued The Board holds certain government and corporate bonds that are considered Level 2 investments. Management has determined broker reported prices are a reasonable estimation of fair value as of June 30, 2018 and 2017. Broker reported prices are determined using inputs including last trade prices, current market conditions, perceived market movements, news and other relevant information. The fair value of fixed-maturity certificates of deposit is estimated using the rates currently offered for deposits of similar remaining maturities. These methods may produce a fair value calculation that may not be indicative of net realizable value or reflective of future fair values. Furthermore, although management believes its valuation method is appropriate and consistent with other market participants, the use of different methodologies or assumptions to determine the fair value of certain financial instruments could result in a different fair value measurement at the reporting date. Fair Value of Financial Instruments and Credit Risk Financial instruments, principally cash, receivables, investments, and accounts payable, are reported at fair value. The Board places its cash with financial institutions. At times, these investments are in excess of the FDIC insurance limits. Management believes the risk in these situations to be minimal. Revenue Recognition Membership dues are recognized over the membership period. Revenue from the sale of publications is recognized at the time of sale. Revenue for assessments, meeting registration and presentation fees is recognized as services are performed. Grant and contract revenue are primarily reimbursement basis and are recognized as expenditures are made. An allowance for uncollectible receivables is provided based on management’s evaluation of potential uncollectible promises receivable at year end. Management does not consider any amounts to be uncollectible at June 30, 2018 and 2017. Deferred Revenue Deferred revenue represents membership payments, registration fees and grant monies received in current and prior years that relate to subsequent years. Appropriations The member states pay appropriations to the Board in an amount that is determined annually by the Board of Directors. Agency Funds The Board serves as the fiscal agent and administrator of interstate arrangements for regional educational services and institutions. The Board also serves as administrator of the Minority Doctoral Scholars Program.
BOARD OF CONTROL FOR SOUTHERN REGIONAL EDUCATION NOTES TO THE FINANCIAL STATEMENTS
JUNE 30, 2018 AND 2017
11
2. SUMMARY OF SIGNIFICANT ACCOUNTING POLICIES – CONTINUED Concentration For the year ended June 30, 2018, there was one individual donor who represented 49% of the Board’s revenue. There were two program members representing 29% of accounts receivable at June 30, 2018. For the year ended June 30, 2017, there were two individual donors who represented 56% of the Board’s revenue. There were two program members representing 37% of accounts receivable at June 30, 2017. Property and Equipment Property and equipment are stated at cost less accumulated depreciation. Depreciation is computed using the straight-line method based on the estimated useful lives of the classes of depreciable property. The Board capitalizes all expenditures for property and equipment over $10,000. Useful lives are as follows: Furniture and equipment 3-10 years Leasehold improvements 5-10 years Building 50 years Use of Estimates The preparation of financial statements in conformity with GAAP requires management to make estimates and assumptions that affect the reported amounts of assets and liabilities and disclosure of contingent assets and liabilities at the date of the financial statements and the reported amounts of revenues and expenses during the reporting period. Actual results could differ from those estimates. Tax Status The Board is exempt from income taxes under Section 501(c)(3) of the U.S. Internal Revenue Code and is classified as an organization which is not a private foundation under Section 509(a) of the U.S. Internal Revenue Code. New Accounting Pronouncements In August 2016 FASB issued Accounting Standards Update (ASU) No. 2016-14, Presentation of Financial Statements of Not-for-Profit Entities. ASU 2016-14 (1) reduces the number of net asset classes presented from three to two; (2) requires the presentation of expense by functional and natural classification in one location; (3) requires quantitative and qualitative disclosures about liquidity and availability of financial assets; and (4) requires additional policy disclosures regarding board designated funds. The ASU is effective for annual financial statements issued for fiscal years beginning after December 15, 2017. The Board expects to implement the provisions of ASU 2016-14 during 2019. The Board is evaluating the impact of the new standard on its current policies and reporting methodologies.
BOARD OF CONTROL FOR SOUTHERN REGIONAL EDUCATION NOTES TO THE FINANCIAL STATEMENTS
JUNE 30, 2018 AND 2017
12
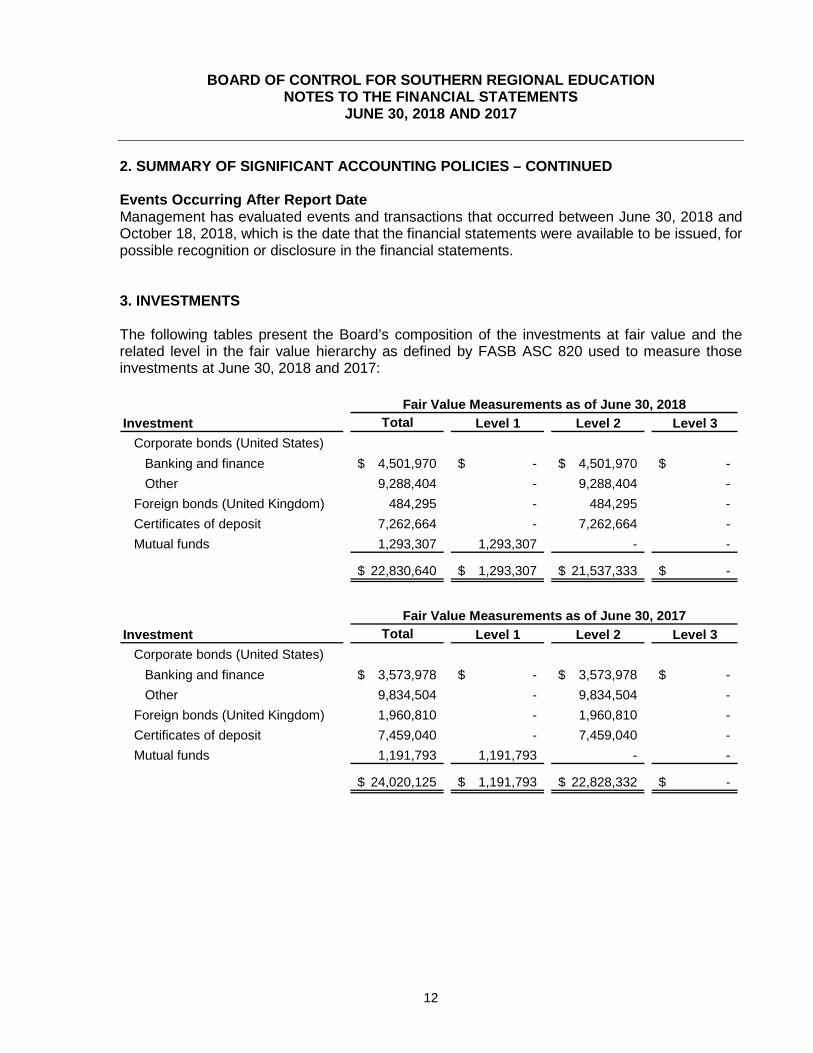
2. SUMMARY OF SIGNIFICANT ACCOUNTING POLICIES – CONTINUED Events Occurring After Report Date Management has evaluated events and transactions that occurred between June 30, 2018 and October 18, 2018, which is the date that the financial statements were available to be issued, for possible recognition or disclosure in the financial statements. 3. INVESTMENTS The following tables present the Board’s composition of the investments at fair value and the related level in the fair value hierarchy as defined by FASB ASC 820 used to measure those investments at June 30, 2018 and 2017:
Investment Total Level 1 Level 2 Level 3Corporate bonds (United States)
Banking and finance 4,501,970$ -$ 4,501,970$ -$ Other 9,288,404 - 9,288,404 -
Foreign bonds (United Kingdom) 484,295 - 484,295 - Certificates of deposit 7,262,664 - 7,262,664 - Mutual funds 1,293,307 1,293,307 - -
22,830,640$ 1,293,307$ 21,537,333$ -$
Fair Value Measurements as of June 30, 2018
Investment Total Level 1 Level 2 Level 3Corporate bonds (United States)
Banking and finance 3,573,978$ -$ 3,573,978$ -$ Other 9,834,504 - 9,834,504 -
Foreign bonds (United Kingdom) 1,960,810 - 1,960,810 - Certificates of deposit 7,459,040 - 7,459,040 - Mutual funds 1,191,793 1,191,793 - -
24,020,125$ 1,191,793$ 22,828,332$ -$
Fair Value Measurements as of June 30, 2017
BOARD OF CONTROL FOR SOUTHERN REGIONAL EDUCATION NOTES TO THE FINANCIAL STATEMENTS
JUNE 30, 2018 AND 2017
13
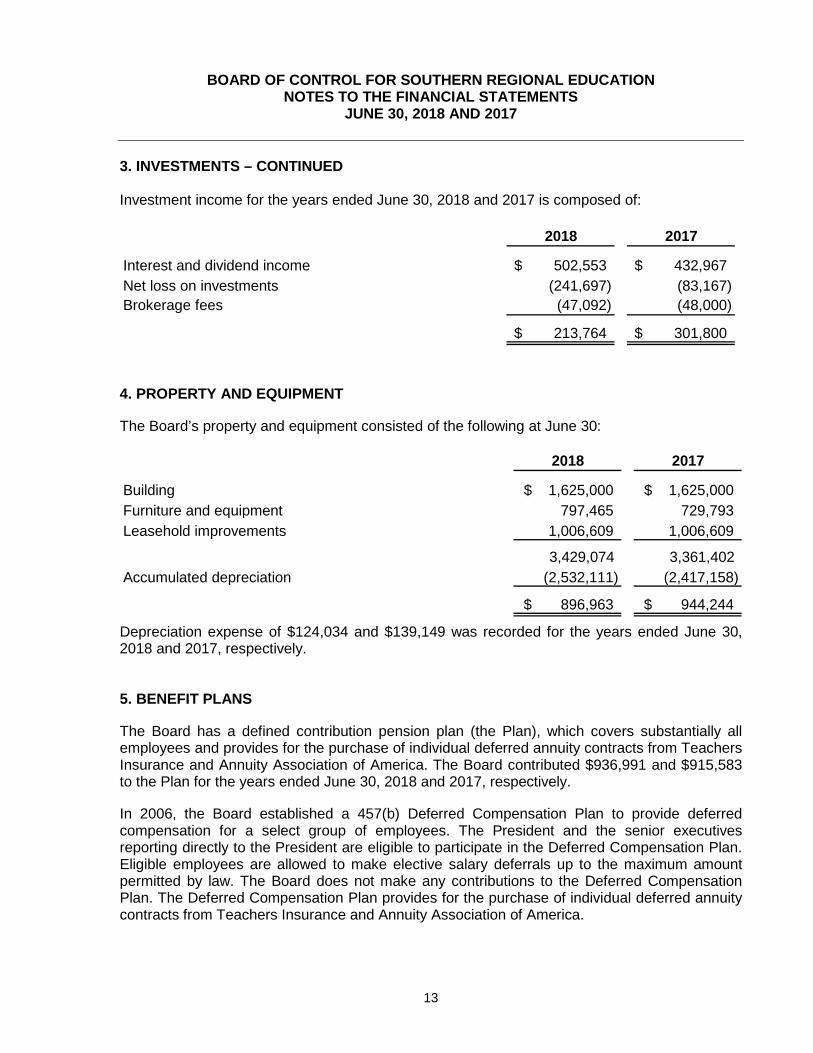
3. INVESTMENTS – CONTINUED Investment income for the years ended June 30, 2018 and 2017 is composed of:
2018 2017
Interest and dividend income 502,553$ 432,967$ Net loss on investments (241,697) (83,167) Brokerage fees (47,092) (48,000)
213,764$ 301,800$
4. PROPERTY AND EQUIPMENT The Board’s property and equipment consisted of the following at June 30:
2018 2017
Building 1,625,000$ 1,625,000$ Furniture and equipment 797,465 729,793Leasehold improvements 1,006,609 1,006,609
3,429,074 3,361,402 Accumulated depreciation (2,532,111) (2,417,158)
896,963$ 944,244$
Depreciation expense of $124,034 and $139,149 was recorded for the years ended June 30, 2018 and 2017, respectively. 5. BENEFIT PLANS The Board has a defined contribution pension plan (the Plan), which covers substantially all employees and provides for the purchase of individual deferred annuity contracts from Teachers Insurance and Annuity Association of America. The Board contributed $936,991 and $915,583 to the Plan for the years ended June 30, 2018 and 2017, respectively. In 2006, the Board established a 457(b) Deferred Compensation Plan to provide deferred compensation for a select group of employees. The President and the senior executives reporting directly to the President are eligible to participate in the Deferred Compensation Plan. Eligible employees are allowed to make elective salary deferrals up to the maximum amount permitted by law. The Board does not make any contributions to the Deferred Compensation Plan. The Deferred Compensation Plan provides for the purchase of individual deferred annuity contracts from Teachers Insurance and Annuity Association of America.

BOARD OF CONTROL FOR SOUTHERN REGIONAL EDUCATION NOTES TO THE FINANCIAL STATEMENTS
JUNE 30, 2018 AND 2017
14
6. CAPITAL LEASE The Board entered into a lease obligation in 1987 with the Board of Regents of the State of Georgia to occupy an office building for a 50-year period. The lease required annual payments of $90,000 through 2011. For the remaining 25 years under the lease term, no further lease payments are required, and the Board is entitled to occupy the building. This obligation has been recorded as a capital lease. However, the Board does not own the building and the lease does not address extension or purchase options when the lease terminates in 2036. At June 30, 2018 the cost of assets under capital lease was $1,625,000. Depreciation expense for the year ended June 30, 2018 related to the capitalized building was $32,500 and at June 30, 2018 accumulated depreciation was $1,040,000. 7. LEASE COMMITMENTS The Board has obligations under various non-cancelable operating leases for office equipment. Related rental expense for the years ended June 30, 2018 and 2017 amounted to approximately $20,000. Future minimum lease payments under these leases are as follows: Year ending June 30,
2019 20,550$ 2020 6,7332021 2,805
8. COMPOSITION OF NET ASSETS Unrestricted net assets have been designated by the Board of Directors as follows:
2018 2017
Reserve for contingencies 324,489$ 324,489$ Quality of Education Program 1,003,590 1,979,153
1,328,079$ 2,303,642$
Temporarily restricted net assets of $21,245,339 and $21,833,608 for 2018 and 2017, respectively, are available for various educational programs specifically restricted by the respective donors. Permanently restricted net assets of $21,000 represent the Plunkett Endowment.
BOARD OF CONTROL FOR SOUTHERN REGIONAL EDUCATION NOTES TO THE FINANCIAL STATEMENTS
JUNE 30, 2018 AND 2017
15
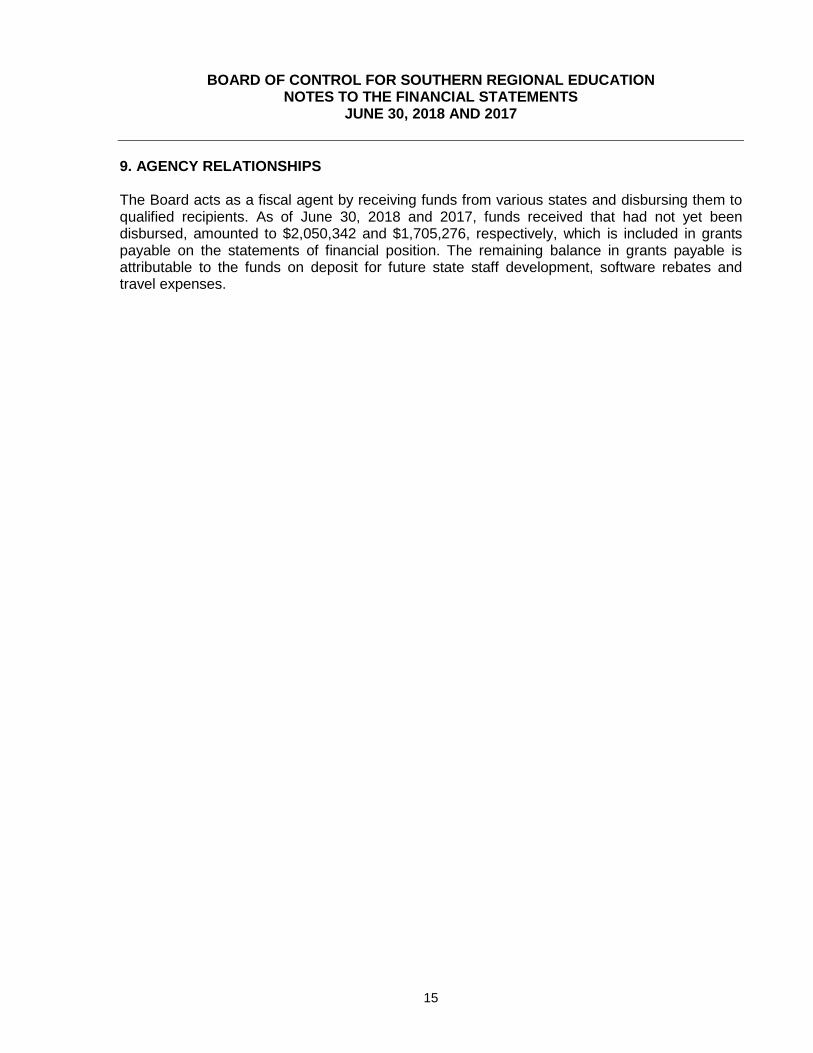
9. AGENCY RELATIONSHIPS The Board acts as a fiscal agent by receiving funds from various states and disbursing them to qualified recipients. As of June 30, 2018 and 2017, funds received that had not yet been disbursed, amounted to $2,050,342 and $1,705,276, respectively, which is included in grants payable on the statements of financial position. The remaining balance in grants payable is attributable to the funds on deposit for future state staff development, software rebates and travel expenses.

SUPPLEMENTARY INFORMATION
BOARD OF CONTROL FOR SOUTHERN REGIONAL EDUCATION STATEMENT OF REVENUES AND EXPENSES BY PROGRAM FOR THE YEAR ENDED JUNE 30, 2018
16
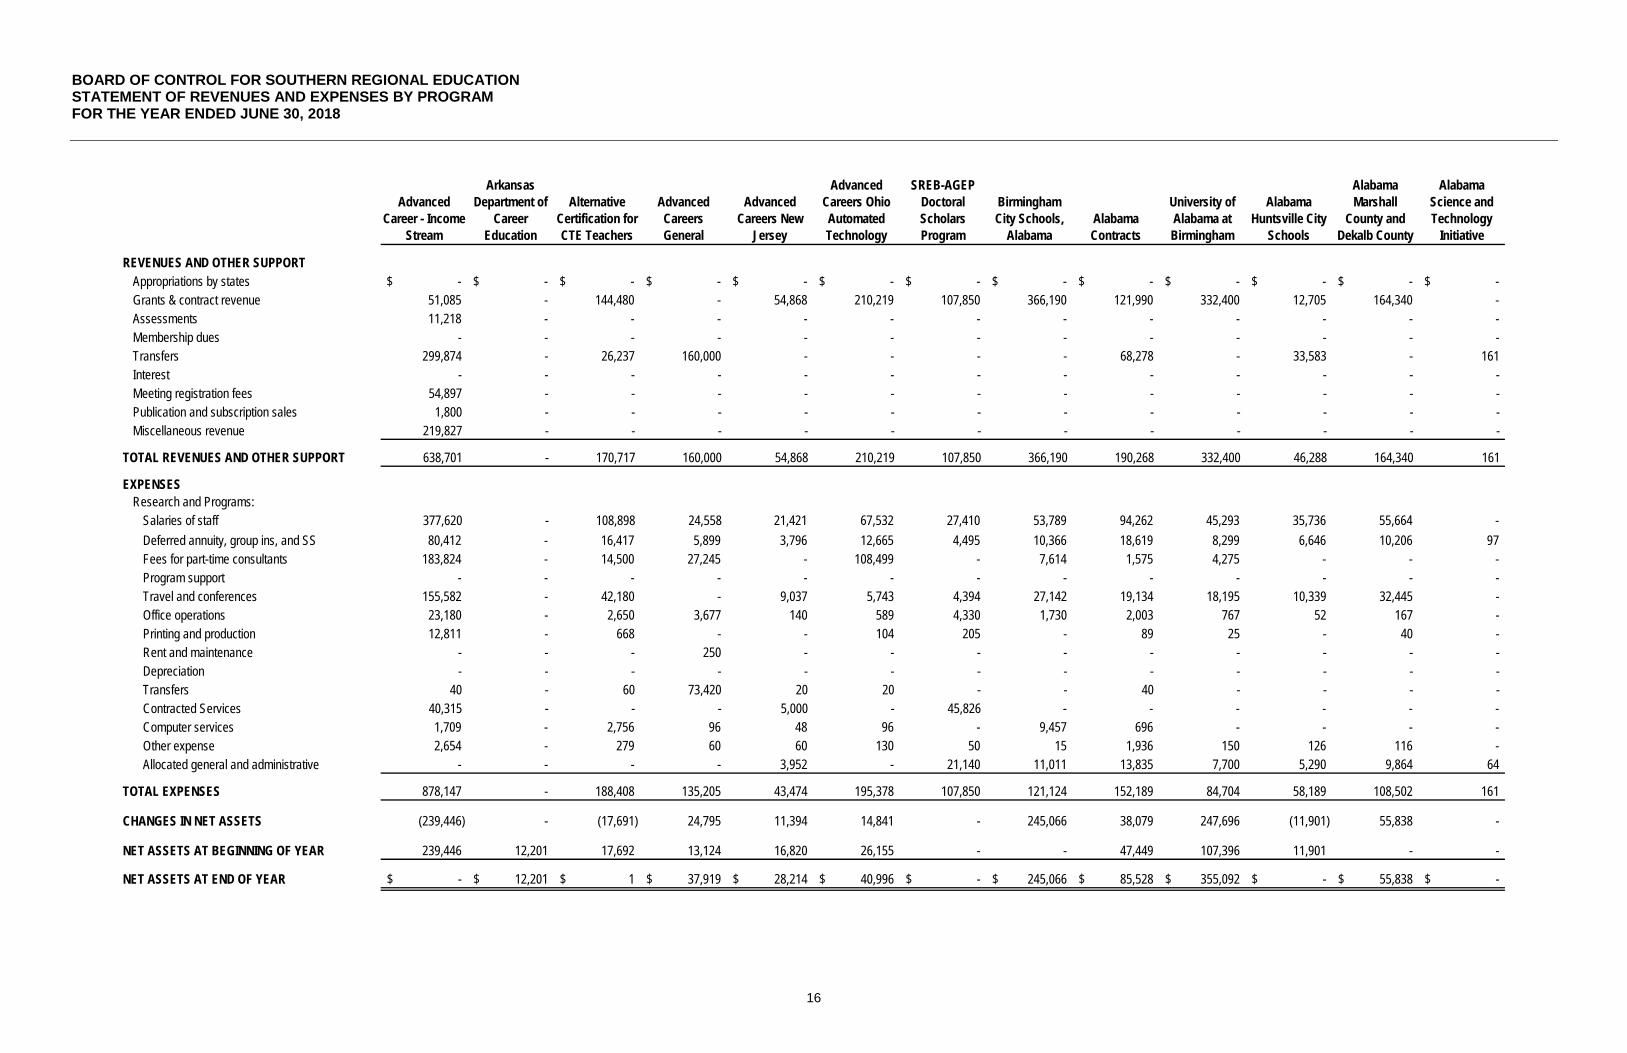
REVENUES AND OTHER SUPPORTAppropriations by statesGrants & contract revenueAssessmentsMembership duesTransfersInterestMeeting registration feesPublication and subscription salesMiscellaneous revenue
TOTAL REVENUES AND OTHER SUPPORT
EXPENSESResearch and Programs:
Salaries of staffDeferred annuity, group ins, and SSFees for part-time consultants Program supportTravel and conferencesOffice operationsPrinting and productionRent and maintenanceDepreciationTransfersContracted ServicesComputer servicesOther expenseAllocated general and administrative
TOTAL EXPENSES
CHANGES IN NET ASSETS
NET ASSETS AT BEGINNING OF YEAR
NET ASSETS AT END OF YEAR
Advanced Career - Income
Stream
Arkansas Department of
Career Education
Alternative Certification for CTE Teachers
Advanced Careers General
Advanced Careers New
Jersey
Advanced Careers Ohio Automated Technology
SREB-AGEP Doctoral Scholars Program
Birmingham City Schools,
AlabamaAlabama Contracts
University of Alabama at Birmingham
Alabama Huntsville City
Schools
Alabama Marshall
County and Dekalb County
Alabama Science and Technology
Initiative
-$ -$ -$ -$ -$ -$ -$ -$ -$ -$ -$ -$ -$ 51,085 - 144,480 - 54,868 210,219 107,850 366,190 121,990 332,400 12,705 164,340 - 11,218 - - - - - - - - - - - -
- - - - - - - - - - - - - 299,874 - 26,237 160,000 - - - - 68,278 - 33,583 - 161
- - - - - - - - - - - - - 54,897 - - - - - - - - - - - -
1,800 - - - - - - - - - - - - 219,827 - - - - - - - - - - - -
638,701 - 170,717 160,000 54,868 210,219 107,850 366,190 190,268 332,400 46,288 164,340 161
377,620 - 108,898 24,558 21,421 67,532 27,410 53,789 94,262 45,293 35,736 55,664 - 80,412 - 16,417 5,899 3,796 12,665 4,495 10,366 18,619 8,299 6,646 10,206 97
183,824 - 14,500 27,245 - 108,499 - 7,614 1,575 4,275 - - - - - - - - - - - - - - - -
155,582 - 42,180 - 9,037 5,743 4,394 27,142 19,134 18,195 10,339 32,445 - 23,180 - 2,650 3,677 140 589 4,330 1,730 2,003 767 52 167 - 12,811 - 668 - - 104 205 - 89 25 - 40 -
- - - 250 - - - - - - - - - - - - - - - - - - - - - -
40 - 60 73,420 20 20 - - 40 - - - - 40,315 - - - 5,000 - 45,826 - - - - - - 1,709 - 2,756 96 48 96 - 9,457 696 - - - - 2,654 - 279 60 60 130 50 15 1,936 150 126 116 -
- - - - 3,952 - 21,140 11,011 13,835 7,700 5,290 9,864 64
878,147 - 188,408 135,205 43,474 195,378 107,850 121,124 152,189 84,704 58,189 108,502 161
(239,446) - (17,691) 24,795 11,394 14,841 - 245,066 38,079 247,696 (11,901) 55,838 -
239,446 12,201 17,692 13,124 16,820 26,155 - - 47,449 107,396 11,901 - -
-$ 12,201$ 1$ 37,919$ 28,214$ 40,996$ -$ 245,066$ 85,528$ 355,092$ -$ 55,838$ -$
BOARD OF CONTROL FOR SOUTHERN REGIONAL EDUCATION STATEMENT OF REVENUES AND EXPENSES BY PROGRAM – CONTINUED FOR THE YEAR ENDED JUNE 30, 2018
17
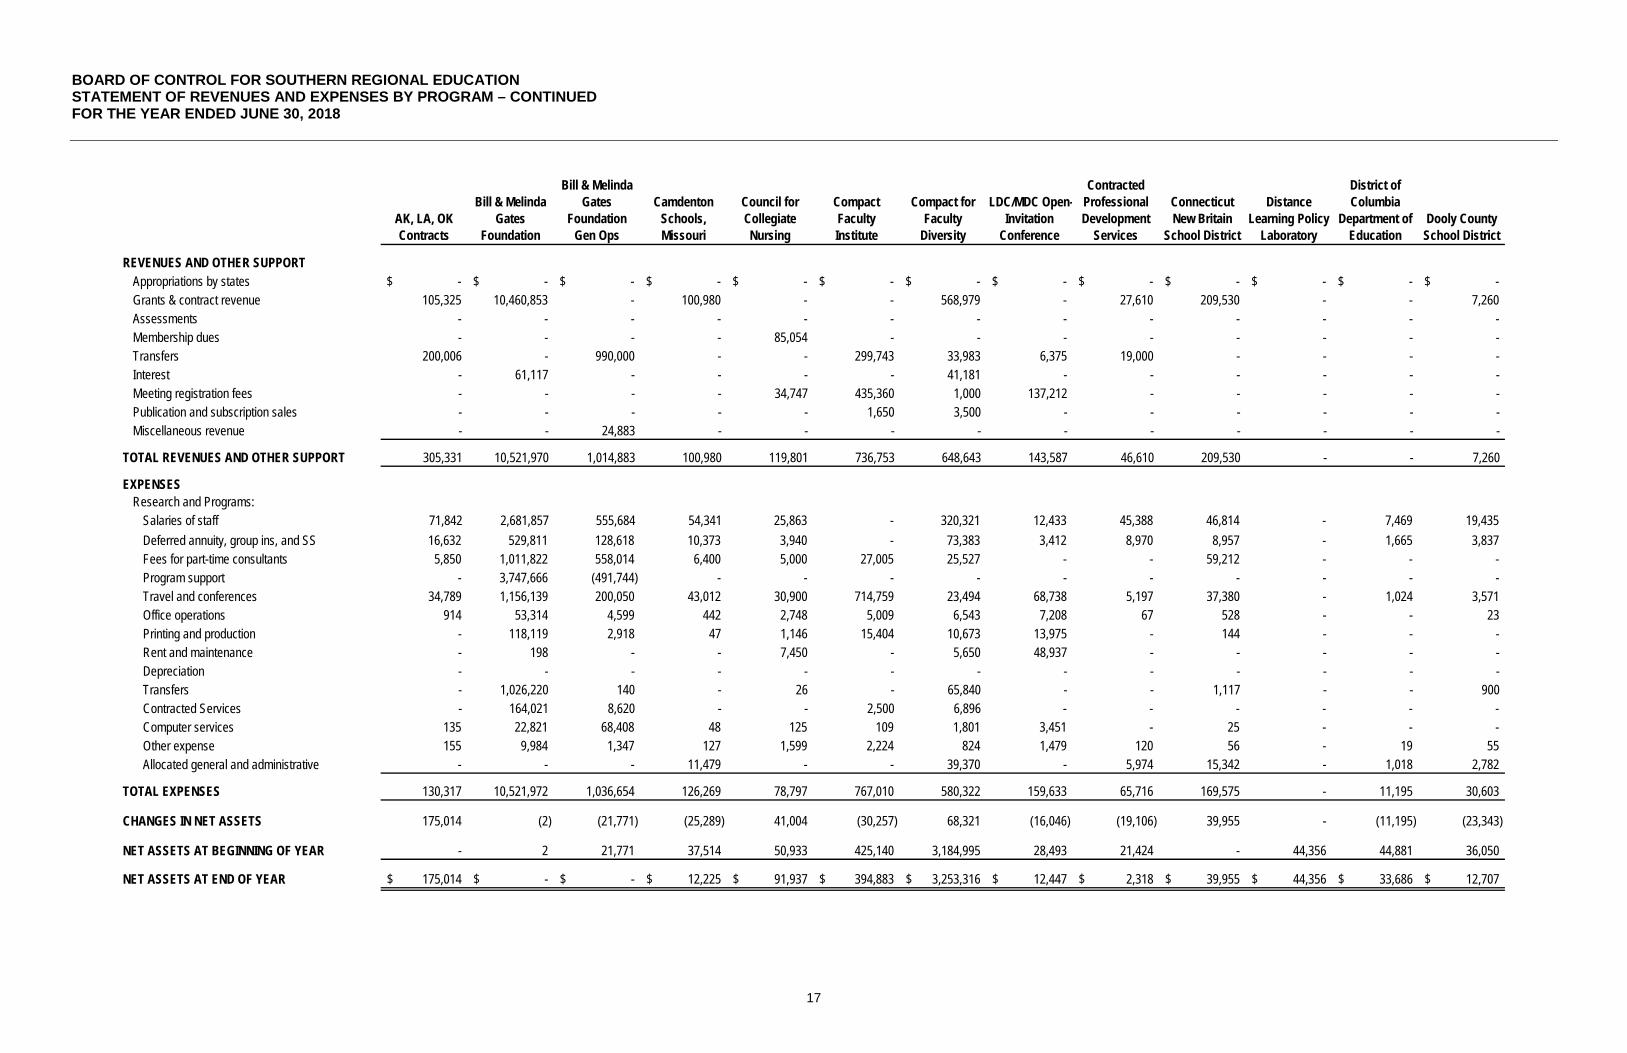
REVENUES AND OTHER SUPPORTAppropriations by statesGrants & contract revenueAssessmentsMembership duesTransfersInterestMeeting registration feesPublication and subscription salesMiscellaneous revenue
TOTAL REVENUES AND OTHER SUPPORT
EXPENSESResearch and Programs:
Salaries of staffDeferred annuity, group ins, and SSFees for part-time consultants Program supportTravel and conferencesOffice operationsPrinting and productionRent and maintenanceDepreciationTransfersContracted ServicesComputer servicesOther expenseAllocated general and administrative
TOTAL EXPENSES
CHANGES IN NET ASSETS
NET ASSETS AT BEGINNING OF YEAR
NET ASSETS AT END OF YEAR
AK, LA, OK Contracts
Bill & Melinda Gates
Foundation
Bill & Melinda Gates
Foundation Gen Ops
Camdenton Schools, Missouri
Council for Collegiate Nursing
Compact Faculty Institute
Compact for Faculty
Diversity
LDC/MDC Open-Invitation
Conference
Contracted Professional Development
Services
Connecticut New Britain
School District
Distance Learning Policy
Laboratory
District of Columbia
Department of Education
Dooly County School District
-$ -$ -$ -$ -$ -$ -$ -$ -$ -$ -$ -$ -$ 105,325 10,460,853 - 100,980 - - 568,979 - 27,610 209,530 - - 7,260
- - - - - - - - - - - - - - - - - 85,054 - - - - - - - -
200,006 - 990,000 - - 299,743 33,983 6,375 19,000 - - - - - 61,117 - - - - 41,181 - - - - - - - - - - 34,747 435,360 1,000 137,212 - - - - - - - - - - 1,650 3,500 - - - - - - - - 24,883 - - - - - - - - - -
305,331 10,521,970 1,014,883 100,980 119,801 736,753 648,643 143,587 46,610 209,530 - - 7,260
71,842 2,681,857 555,684 54,341 25,863 - 320,321 12,433 45,388 46,814 - 7,469 19,435 16,632 529,811 128,618 10,373 3,940 - 73,383 3,412 8,970 8,957 - 1,665 3,837
5,850 1,011,822 558,014 6,400 5,000 27,005 25,527 - - 59,212 - - - - 3,747,666 (491,744) - - - - - - - - - -
34,789 1,156,139 200,050 43,012 30,900 714,759 23,494 68,738 5,197 37,380 - 1,024 3,571 914 53,314 4,599 442 2,748 5,009 6,543 7,208 67 528 - - 23
- 118,119 2,918 47 1,146 15,404 10,673 13,975 - 144 - - - - 198 - - 7,450 - 5,650 48,937 - - - - - - - - - - - - - - - - - - - 1,026,220 140 - 26 - 65,840 - - 1,117 - - 900 - 164,021 8,620 - - 2,500 6,896 - - - - - -
135 22,821 68,408 48 125 109 1,801 3,451 - 25 - - - 155 9,984 1,347 127 1,599 2,224 824 1,479 120 56 - 19 55
- - - 11,479 - - 39,370 - 5,974 15,342 - 1,018 2,782
130,317 10,521,972 1,036,654 126,269 78,797 767,010 580,322 159,633 65,716 169,575 - 11,195 30,603
175,014 (2) (21,771) (25,289) 41,004 (30,257) 68,321 (16,046) (19,106) 39,955 - (11,195) (23,343)
- 2 21,771 37,514 50,933 425,140 3,184,995 28,493 21,424 - 44,356 44,881 36,050
175,014$ -$ -$ 12,225$ 91,937$ 394,883$ 3,253,316$ 12,447$ 2,318$ 39,955$ 44,356$ 33,686$ 12,707$

BOARD OF CONTROL FOR SOUTHERN REGIONAL EDUCATION STATEMENT OF REVENUES AND EXPENSES BY PROGRAM – CONTINUED FOR THE YEAR ENDED JUNE 30, 2018
18
REVENUES AND OTHER SUPPORTAppropriations by statesGrants & contract revenueAssessmentsMembership duesTransfersInterestMeeting registration feesPublication and subscription salesMiscellaneous revenue
TOTAL REVENUES AND OTHER SUPPORT
EXPENSESResearch and Programs:
Salaries of staffDeferred annuity, group ins, and SSFees for part-time consultants Program supportTravel and conferencesOffice operationsPrinting and productionRent and maintenanceDepreciationTransfersContracted ServicesComputer servicesOther expenseAllocated general and administrative
TOTAL EXPENSES
CHANGES IN NET ASSETS
NET ASSETS AT BEGINNING OF YEAR
NET ASSETS AT END OF YEAR
Dover High School
Dalton Public Schools GA
Direct Services Developmental
Dothan City Schools, Alabama
Doctoral Scholars
Professional Devevlopment
Camden County GA
Public SchoolsGeorgia
Contracts
Georgia's Career
Pathways Audit
Georgia Fulton County Schools
Gates Award Post Secondary
EducationGates Student
Surveys
Geneva County Board of
Education
Gwinnett County
Schools, GA
-$ -$ -$ -$ -$ -$ -$ -$ -$ -$ -$ -$ -$ - 8,250 - 290,400 - 52,774 38,115 82,500 - 126,681 89,258 - 163,350 - - - - - - - - - - - - - - - - - - - - - - - - - - - 2,762 - - - - 102,840 - - - - - - - - - - 1,825 - - - - 916 1,574 - - - - - - - - - - - - - - - - - - - - - - - - - - - - - - - - - - - - - - - - -
- 11,012 - 290,400 1,825 52,774 140,955 82,500 - 127,597 90,832 - 163,350
2,942 17,761 17,746 113,391 - 29,360 46,213 32,525 - 38,370 713 13,580 112,389 493 3,742 3,089 21,219 - 5,375 9,755 6,263 - 7,346 55 2,561 21,802
- - - - - 5,200 9,750 - - 28,300 2,999 - - - - - - - - - - - - - - -
580 - 1,289 41,579 9,962 12,162 10,229 518 - 12,969 4,451 - 42,298 81 - - 313 - 6 69 2 - 561 - - 2,249
- - - 272 - - 110 - - 199 - - 45 - - - 540 - - - - - - - - - - - - - - - - - - - - - - - - - - - 225 3,062 - 2,840 - - 8,278 9,327 - - - - 2,000 - - - - 23,000 72,437 - -
100 - - - - - 325 - - - - - 48 2 42 51 251 - 71 116 36 - 106 3 38 272
420 2,155 - 17,757 - 5,240 7,687 - - 16,744 10,174 1,618 18,030
4,618 23,700 22,175 195,322 11,962 57,639 87,316 39,344 2,840 127,595 90,832 26,075 206,460
(4,618) (12,688) (22,175) 95,078 (10,137) (4,865) 53,639 43,156 (2,840) 2 - (26,075) (43,110)
13,111 12,688 22,484 125,755 170,107 11,245 38,505 - 2,840 - - 26,075 44,588
8,493$ -$ 309$ 220,833$ 159,970$ 6,380$ 92,144$ 43,156$ -$ 2$ -$ -$ 1,478$
BOARD OF CONTROL FOR SOUTHERN REGIONAL EDUCATION STATEMENT OF REVENUES AND EXPENSES BY PROGRAM – CONTINUED FOR THE YEAR ENDED JUNE 30, 2018
19
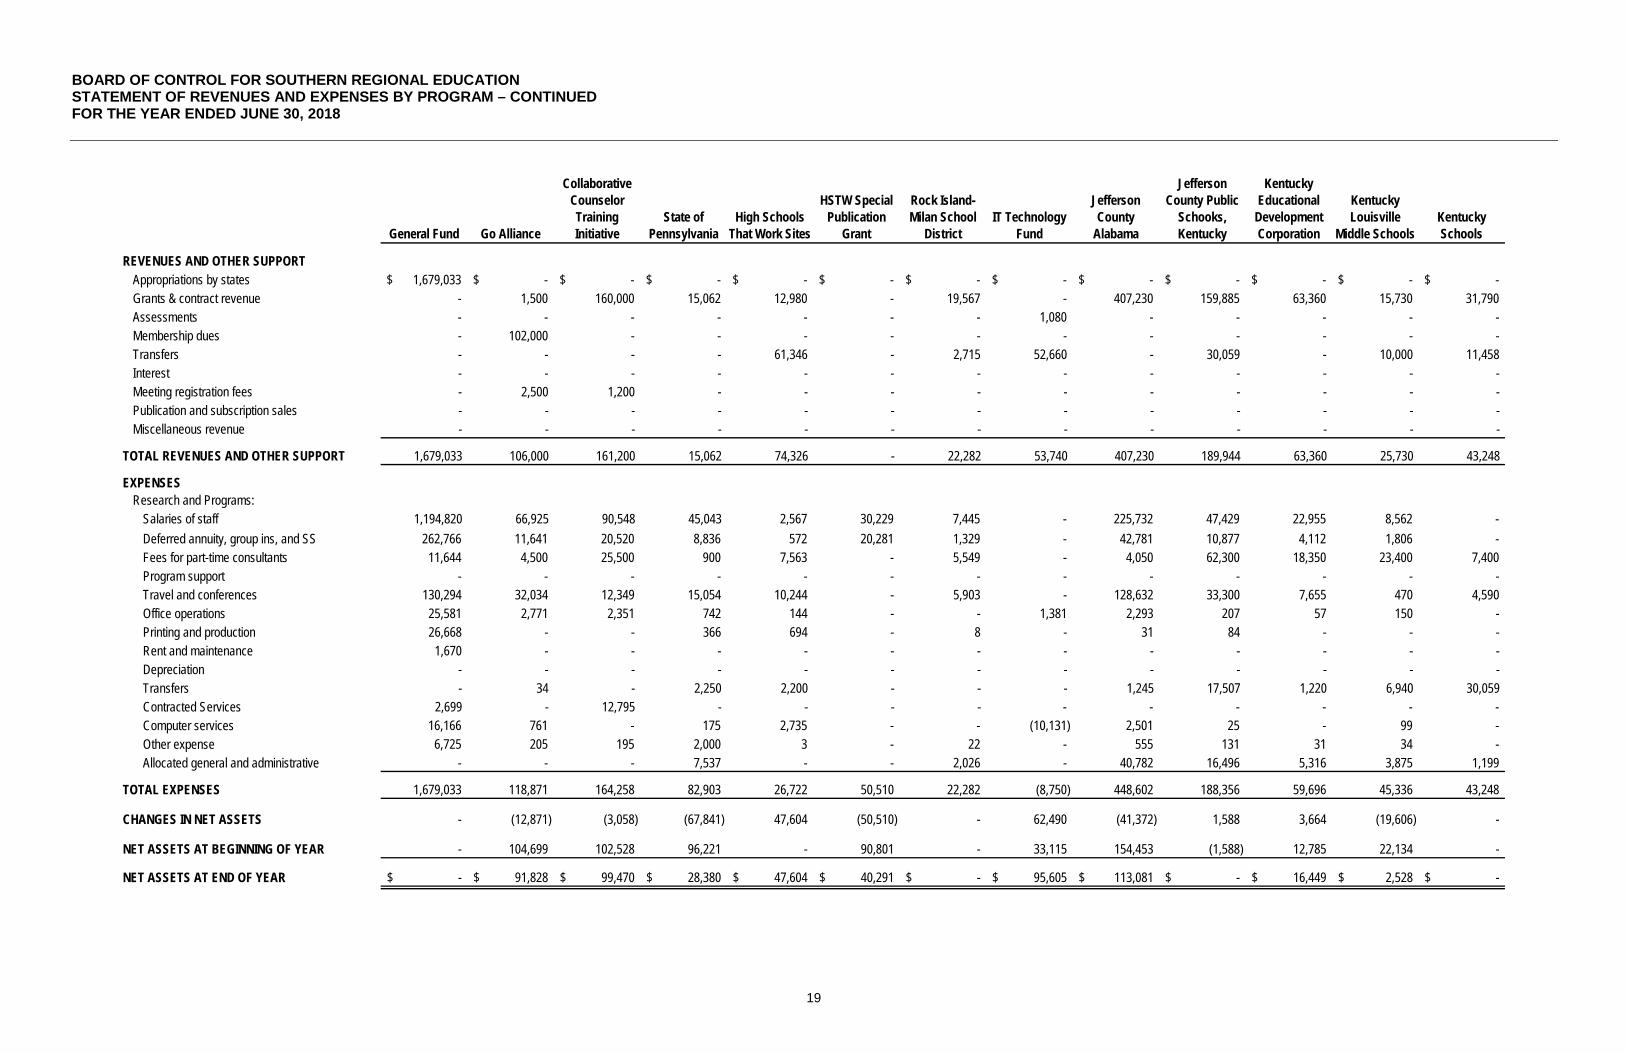
REVENUES AND OTHER SUPPORTAppropriations by statesGrants & contract revenueAssessmentsMembership duesTransfersInterestMeeting registration feesPublication and subscription salesMiscellaneous revenue
TOTAL REVENUES AND OTHER SUPPORT
EXPENSESResearch and Programs:
Salaries of staffDeferred annuity, group ins, and SSFees for part-time consultants Program supportTravel and conferencesOffice operationsPrinting and productionRent and maintenanceDepreciationTransfersContracted ServicesComputer servicesOther expenseAllocated general and administrative
TOTAL EXPENSES
CHANGES IN NET ASSETS
NET ASSETS AT BEGINNING OF YEAR
NET ASSETS AT END OF YEAR
General Fund Go Alliance
Collaborative Counselor Training Initiative
State of Pennsylvania
High Schools That Work Sites
HSTW Special Publication
Grant
Rock Island-Milan School
DistrictIT Technology
Fund
Jefferson County
Alabama
Jefferson County Public
Schooks, Kentucky
Kentucky Educational
Development Corporation
Kentucky Louisville
Middle SchoolsKentucky Schools
1,679,033$ -$ -$ -$ -$ -$ -$ -$ -$ -$ -$ -$ -$ - 1,500 160,000 15,062 12,980 - 19,567 - 407,230 159,885 63,360 15,730 31,790 - - - - - - - 1,080 - - - - - - 102,000 - - - - - - - - - - - - - - - 61,346 - 2,715 52,660 - 30,059 - 10,000 11,458 - - - - - - - - - - - - - - 2,500 1,200 - - - - - - - - - - - - - - - - - - - - - - - - - - - - - - - - - - - -
1,679,033 106,000 161,200 15,062 74,326 - 22,282 53,740 407,230 189,944 63,360 25,730 43,248
1,194,820 66,925 90,548 45,043 2,567 30,229 7,445 - 225,732 47,429 22,955 8,562 - 262,766 11,641 20,520 8,836 572 20,281 1,329 - 42,781 10,877 4,112 1,806 -
11,644 4,500 25,500 900 7,563 - 5,549 - 4,050 62,300 18,350 23,400 7,400 - - - - - - - - - - - - -
130,294 32,034 12,349 15,054 10,244 - 5,903 - 128,632 33,300 7,655 470 4,590 25,581 2,771 2,351 742 144 - - 1,381 2,293 207 57 150 - 26,668 - - 366 694 - 8 - 31 84 - - -
1,670 - - - - - - - - - - - - - - - - - - - - - - - - - - 34 - 2,250 2,200 - - - 1,245 17,507 1,220 6,940 30,059
2,699 - 12,795 - - - - - - - - - - 16,166 761 - 175 2,735 - - (10,131) 2,501 25 - 99 -
6,725 205 195 2,000 3 - 22 - 555 131 31 34 - - - - 7,537 - - 2,026 - 40,782 16,496 5,316 3,875 1,199
1,679,033 118,871 164,258 82,903 26,722 50,510 22,282 (8,750) 448,602 188,356 59,696 45,336 43,248
- (12,871) (3,058) (67,841) 47,604 (50,510) - 62,490 (41,372) 1,588 3,664 (19,606) -
- 104,699 102,528 96,221 - 90,801 - 33,115 154,453 (1,588) 12,785 22,134 -
-$ 91,828$ 99,470$ 28,380$ 47,604$ 40,291$ -$ 95,605$ 113,081$ -$ 16,449$ 2,528$ -$

BOARD OF CONTROL FOR SOUTHERN REGIONAL EDUCATION STATEMENT OF REVENUES AND EXPENSES BY PROGRAM – CONTINUED FOR THE YEAR ENDED JUNE 30, 2018
20
REVENUES AND OTHER SUPPORTAppropriations by statesGrants & contract revenueAssessmentsMembership duesTransfersInterestMeeting registration feesPublication and subscription salesMiscellaneous revenue
TOTAL REVENUES AND OTHER SUPPORT
EXPENSESResearch and Programs:
Salaries of staffDeferred annuity, group ins, and SSFees for part-time consultants Program supportTravel and conferencesOffice operationsPrinting and productionRent and maintenanceDepreciationTransfersContracted ServicesComputer servicesOther expenseAllocated general and administrative
TOTAL EXPENSES
CHANGES IN NET ASSETS
NET ASSETS AT BEGINNING OF YEAR
NET ASSETS AT END OF YEAR
Literacy and Math Contracts
Leadership State Initiatives
The Springfield Public Schools
Doctoral Scholars Program
Middle Grades Consortium
Board of School
Commissioners of Mobile
County, Al
Mississippi Contracted
Sites
National Assessment Education Progress NASA
North Carolina Advanced
Manufacturing Skills
North Carolina Brunswick
County School District
North Carolina Guilford County Schools
Hoke County Schools, NC
-$ -$ -$ -$ -$ -$ -$ -$ -$ -$ -$ -$ -$ 157,158 14,968 47,353 - 44,440 91,300 50,350 1,000 75,000 75,295 84,040 13,750 167,998
- - - - - - - 112,600 - - - - - - - - - 47,000 - - - - - - - -
20,448 - 12,000 - - - 100,000 69,110 - - - 391 8,431 - - - 12,720 - - - - - - - - - - 2,550 - - - - - - - - - - - - - - - - - - - - - - - - - - - 11,044 - - - - - - - - -
177,606 17,518 59,353 23,764 91,440 91,300 150,350 182,710 75,000 75,295 84,040 14,141 176,429
15,570 93,270 22,441 - 46,043 58,822 13,127 199,992 - 35,453 23,147 8,063 65,425 2,808 22,117 4,884 - 9,965 11,530 2,884 45,450 - 8,626 5,115 1,298 11,851 6,825 30,525 - - 2,550 4,300 35,250 19,950 - - 37,050 - 44,200
- - - - - - - - - - - - - 6,131 25,032 12,839 - 23,436 11,764 19,445 2,853 - 7,028 12,971 3,058 21,499
166 1,666 118 - 1,912 1,058 257 2,700 - 435 65 - 447 401 45 19 - 92 62 - 16 - - 128 - -
- 540 - - - - - 250 - - - - - - - - - - - - - - - - - - - 140 1,319 - 1,990 20 20 60 64,980 7,350 1,200 750 -
2,250 - - - - - - 113,475 - - - - - - 2,048 123 - 287 96 - 1,682 - 50 25 - 75
53 3,642 40 158 1,669 178 38 1,840 - 84 60 - 146 3,420 - 4,178 - - 8,783 7,102 - - 5,903 7,976 - 14,364
37,624 179,025 45,961 158 87,944 96,613 78,123 388,268 64,980 64,929 87,737 13,169 158,007
139,982 (161,507) 13,392 23,606 3,496 (5,313) 72,227 (205,558) 10,020 10,366 (3,697) 972 18,422
- 449,477 (157) 361,418 164,875 185,566 92,652 795,440 - (577) 6,956 96 104
139,982$ 287,970$ 13,235$ 385,024$ 168,371$ 180,253$ 164,879$ 589,882$ 10,020$ 9,789$ 3,259$ 1,068$ 18,526$
BOARD OF CONTROL FOR SOUTHERN REGIONAL EDUCATION STATEMENT OF REVENUES AND EXPENSES BY PROGRAM – CONTINUED FOR THE YEAR ENDED JUNE 30, 2018
21
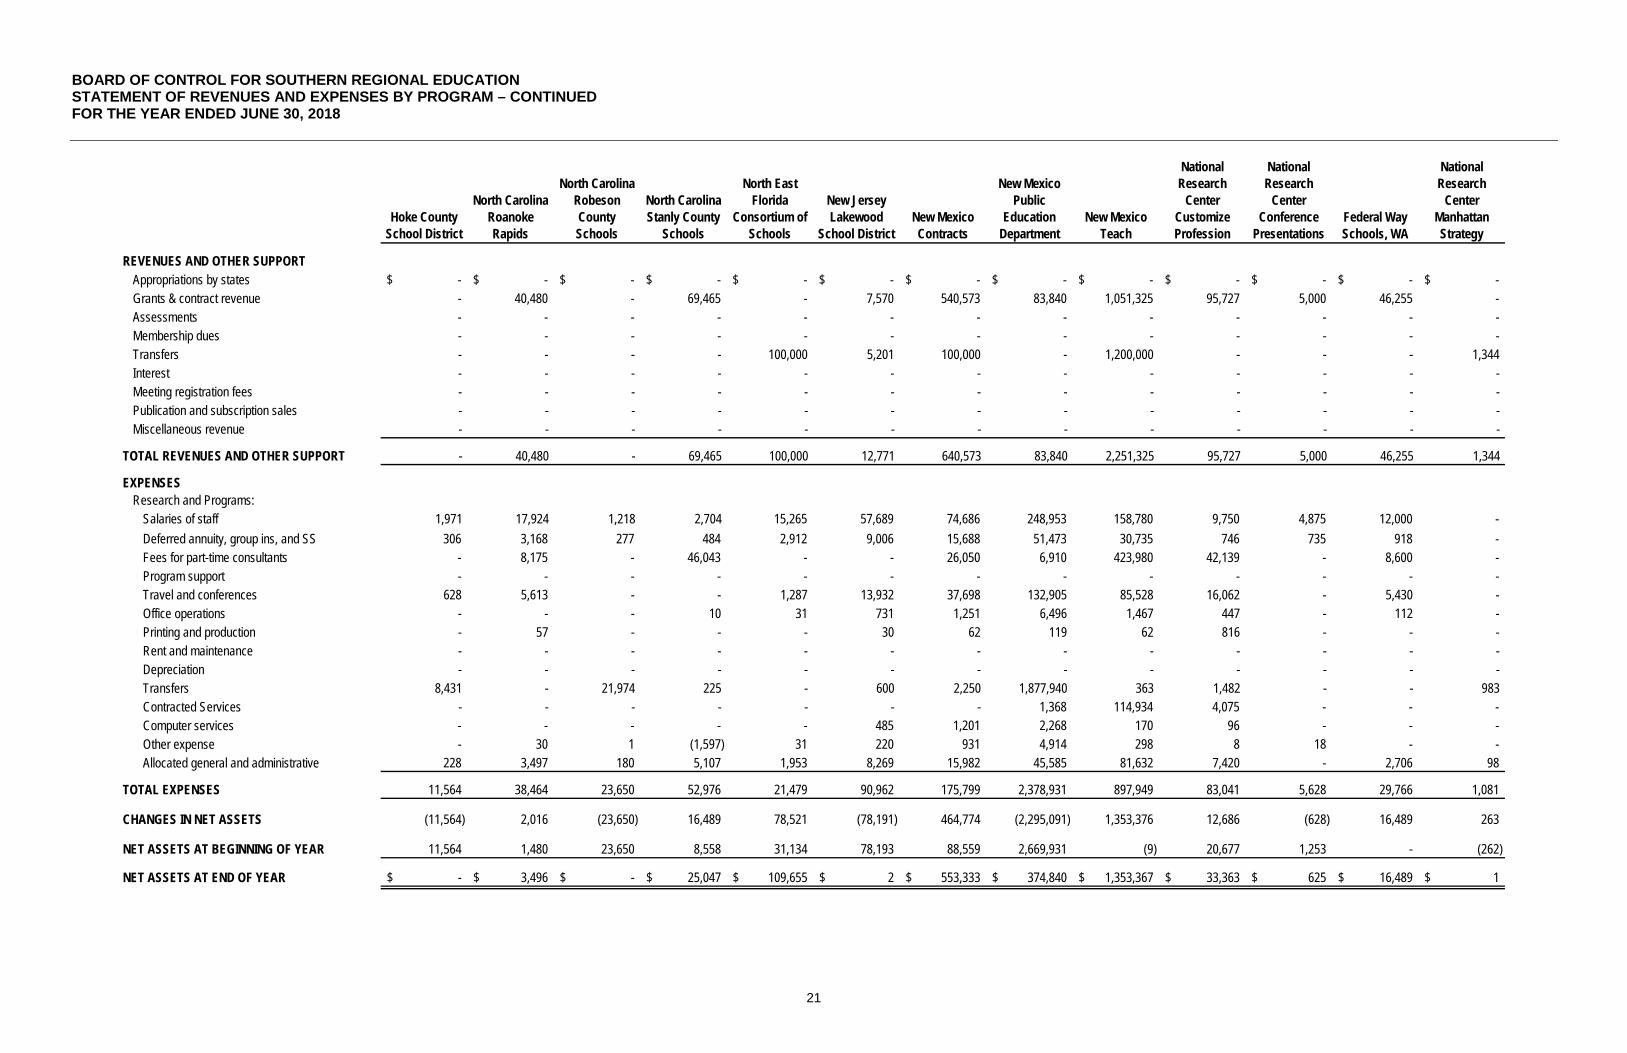
REVENUES AND OTHER SUPPORTAppropriations by statesGrants & contract revenueAssessmentsMembership duesTransfersInterestMeeting registration feesPublication and subscription salesMiscellaneous revenue
TOTAL REVENUES AND OTHER SUPPORT
EXPENSESResearch and Programs:
Salaries of staffDeferred annuity, group ins, and SSFees for part-time consultants Program supportTravel and conferencesOffice operationsPrinting and productionRent and maintenanceDepreciationTransfersContracted ServicesComputer servicesOther expenseAllocated general and administrative
TOTAL EXPENSES
CHANGES IN NET ASSETS
NET ASSETS AT BEGINNING OF YEAR
NET ASSETS AT END OF YEAR
Hoke County School District
North Carolina Roanoke Rapids
North Carolina Robeson County Schools
North Carolina Stanly County
Schools
North East Florida
Consortium of Schools
New Jersey Lakewood
School DistrictNew Mexico Contracts
New Mexico Public
Education Department
New Mexico Teach
National Research
Center Customize Profession
National Research
Center Conference
PresentationsFederal Way Schools, WA
National Research
Center Manhattan Strategy
-$ -$ -$ -$ -$ -$ -$ -$ -$ -$ -$ -$ -$ - 40,480 - 69,465 - 7,570 540,573 83,840 1,051,325 95,727 5,000 46,255 - - - - - - - - - - - - - - - - - - - - - - - - - - - - - - - 100,000 5,201 100,000 - 1,200,000 - - - 1,344 - - - - - - - - - - - - - - - - - - - - - - - - - - - - - - - - - - - - - - - - - - - - - - - - - - - -
- 40,480 - 69,465 100,000 12,771 640,573 83,840 2,251,325 95,727 5,000 46,255 1,344
1,971 17,924 1,218 2,704 15,265 57,689 74,686 248,953 158,780 9,750 4,875 12,000 - 306 3,168 277 484 2,912 9,006 15,688 51,473 30,735 746 735 918 -
- 8,175 - 46,043 - - 26,050 6,910 423,980 42,139 - 8,600 - - - - - - - - - - - - - -
628 5,613 - - 1,287 13,932 37,698 132,905 85,528 16,062 - 5,430 - - - - 10 31 731 1,251 6,496 1,467 447 - 112 - - 57 - - - 30 62 119 62 816 - - - - - - - - - - - - - - - - - - - - - - - - - - - - -
8,431 - 21,974 225 - 600 2,250 1,877,940 363 1,482 - - 983 - - - - - - - 1,368 114,934 4,075 - - - - - - - - 485 1,201 2,268 170 96 - - - - 30 1 (1,597) 31 220 931 4,914 298 8 18 - -
228 3,497 180 5,107 1,953 8,269 15,982 45,585 81,632 7,420 - 2,706 98
11,564 38,464 23,650 52,976 21,479 90,962 175,799 2,378,931 897,949 83,041 5,628 29,766 1,081
(11,564) 2,016 (23,650) 16,489 78,521 (78,191) 464,774 (2,295,091) 1,353,376 12,686 (628) 16,489 263
11,564 1,480 23,650 8,558 31,134 78,193 88,559 2,669,931 (9) 20,677 1,253 - (262)
-$ 3,496$ -$ 25,047$ 109,655$ 2$ 553,333$ 374,840$ 1,353,367$ 33,363$ 625$ 16,489$ 1$

BOARD OF CONTROL FOR SOUTHERN REGIONAL EDUCATION STATEMENT OF REVENUES AND EXPENSES BY PROGRAM – CONTINUED FOR THE YEAR ENDED JUNE 30, 2018
22
REVENUES AND OTHER SUPPORTAppropriations by statesGrants & contract revenueAssessmentsMembership duesTransfersInterestMeeting registration feesPublication and subscription salesMiscellaneous revenue
TOTAL REVENUES AND OTHER SUPPORT
EXPENSESResearch and Programs:
Salaries of staffDeferred annuity, group ins, and SSFees for part-time consultants Program supportTravel and conferencesOffice operationsPrinting and productionRent and maintenanceDepreciationTransfersContracted ServicesComputer servicesOther expenseAllocated general and administrative
TOTAL EXPENSES
CHANGES IN NET ASSETS
NET ASSETS AT BEGINNING OF YEAR
NET ASSETS AT END OF YEAR
National Research New
Mexico Cooperative Education
National Council State Authorization
Reciprocal
National-Staff Develment
Project
New York Boards of
Cooperative Educational SE
Buffalo Public Schools
New York City Small Learning Communities
Oklahoma Contracts
Pinellas County Schools
Plunkett Award Fund
Principal Preparation for Excellence and
Equity
Quitman County School
District
Richland County School
District One, SC
Readiness Courses
-$ -$ -$ -$ -$ -$ -$ -$ -$ -$ -$ -$ -$ - 640,000 - 61,051 179,140 138,550 - 166,676 - 175,266 43,560 70,000 - - - - 18 - - - - - - - - - - - - - - - - - - - - - -
78 - 250 11,422 - 30,040 - 18,495 - 26,030 - - - - - - - - - - - 11 - - - - - - 61,400 8,050 - - - - - - - - - - - - - - - - - - - - - 14,082 - - - - - - - - - - - - -
78 640,000 61,650 80,541 179,140 168,590 - 185,171 11 201,296 43,560 70,000 14,082
4,076 150,311 7,253 13,386 73,249 60,288 - 54,995 - 47,868 18,583 16,452 - 637 32,984 1,867 1,682 15,288 10,261 - 12,405 - 11,266 3,158 3,264 -
- 159,000 - 13,438 41,963 21,575 - 53,340 - 146,121 23,600 52,500 - - - - - - - - - - - - - - - 78,338 71,116 4,234 65,867 50,299 - 24,875 - 7,866 8,860 14,575 -
749 7,786 1,939 28 1,561 982 - 1,337 - 215 10 - 1,675 - 3,776 2,718 - 178 - - 1,547 - 29 - - 2,350 - - - - - - - - - - - - - - - - - - - - - - - - - - - 65,060 - 750 19,278 7,740 6 17,195 - - 900 20 631 - - - - - - - - - - - - - - 1,481 - - 150 389 - - - - - - -
572 6,990 25 39 183 111 - 151 - 127 51 44 - 603 107,500 - 3,356 20,091 15,164 - 16,585 - 17,079 5,516 6,080 466
6,637 613,226 84,918 36,913 237,808 166,809 6 182,430 - 230,571 60,678 92,935 5,122
(6,559) 26,774 (23,268) 43,628 (58,668) 1,781 (6) 2,741 11 (29,275) (17,118) (22,935) 8,960
6,560 515,572 152,740 2,708 106,186 (1,782) 6 (2,741) 4,133 29,275 42,183 25,956 (203)
1$ 542,346$ 129,472$ 46,336$ 47,518$ (1)$ -$ -$ 4,144$ -$ 25,065$ 3,021$ 8,757$

BOARD OF CONTROL FOR SOUTHERN REGIONAL EDUCATION STATEMENT OF REVENUES AND EXPENSES BY PROGRAM – CONTINUED FOR THE YEAR ENDED JUNE 30, 2018
23
REVENUES AND OTHER SUPPORTAppropriations by statesGrants & contract revenueAssessmentsMembership duesTransfersInterestMeeting registration feesPublication and subscription salesMiscellaneous revenue
TOTAL REVENUES AND OTHER SUPPORT
EXPENSESResearch and Programs:
Salaries of staffDeferred annuity, group ins, and SSFees for part-time consultants Program supportTravel and conferencesOffice operationsPrinting and productionRent and maintenanceDepreciationTransfersContracted ServicesComputer servicesOther expenseAllocated general and administrative
TOTAL EXPENSES
CHANGES IN NET ASSETS
NET ASSETS AT BEGINNING OF YEAR
NET ASSETS AT END OF YEAR
Readiness Contracts
SARA Reserves Fund
South Carolina Contracts
Sharable Content Object
Repositories for Education
South Carolina Department of
EducationSumter County School District
SC Williamsburg
County School District
State Educa-Tech Co-Operative
Sloan Foundation
Sloan Foundation
DirectorsTeacher Supply
and Demand
Technology Centers That
Work
Technology Centers Alabama
-$ -$ -$ -$ -$ -$ -$ -$ -$ -$ -$ -$ -$ 9,500 115,000 120,556 - 64,600 21,230 17,880 - 136,464 66,572 - 349,974 78,250
- - - - - - - - - - - - - - - - - - - - 144,000 - - - 20,000 - - - - - - - 5,652 52,982 - - - 6,300 - - - - - - - - - - - - - - - - - - - - - 1,410 - - - 1,800 - - - - - - - - - - - - - - - - - - - - - - - - - - -
9,500 115,000 120,556 - 64,600 21,230 23,532 198,392 136,464 66,572 - 378,074 78,250
1,318 - 61,382 - 41,440 10,468 - 44,474 - - - 234,027 31,637 236 - 13,213 - 8,100 2,258 - 10,664 - - - 54,029 7,957
- - 7,575 - 1,500 - - (12,700) - - - 72,119 35,125 - - - - - - - - - - - - -
1,994 - 22,152 - 6,758 1,954 - 5,247 - - - 94,586 18,708 - - 744 - 662 25 - 560 - - - 4,605 84 - - 62 - - - - 3,533 - - - 629 - - - - - - - - - - - - - - - - - - - - - - - - - - - - - 24,672 37,982 13,000 27 21,393 10 136,464 66,572 - 4,108 1,500 - - - - - - - 380 - - - - - - - 269 - 200 25 - 4,294 - - - 4,012 - 5 - 1,953 - 742 27 - 114 - - - 600 63
355 - 10,737 - 7,852 1,478 2,139 - - - - - -
3,908 - 142,759 37,982 80,254 16,262 23,532 56,576 136,464 66,572 - 468,715 95,074
5,592 115,000 (22,203) (37,982) (15,654) 4,968 - 141,816 - - - (90,641) (16,824)
5,000 100,000 24,635 37,982 51,803 (580) - 215,830 - - 33,256 165,779 62,603
10,592$ 215,000$ 2,432$ -$ 36,149$ 4,388$ -$ 357,646$ -$ -$ 33,256$ 75,138$ 45,779$

BOARD OF CONTROL FOR SOUTHERN REGIONAL EDUCATION STATEMENT OF REVENUES AND EXPENSES BY PROGRAM – CONTINUED FOR THE YEAR ENDED JUNE 30, 2018
24
REVENUES AND OTHER SUPPORTAppropriations by statesGrants & contract revenueAssessmentsMembership duesTransfersInterestMeeting registration feesPublication and subscription salesMiscellaneous revenue
TOTAL REVENUES AND OTHER SUPPORT
EXPENSESResearch and Programs:
Salaries of staffDeferred annuity, group ins, and SSFees for part-time consultants Program supportTravel and conferencesOffice operationsPrinting and productionRent and maintenanceDepreciationTransfersContracted ServicesComputer servicesOther expenseAllocated general and administrative
TOTAL EXPENSES
CHANGES IN NET ASSETS
NET ASSETS AT BEGINNING OF YEAR
NET ASSETS AT END OF YEAR
Technology Centers that
Work KentuckyState of
Pennsylvania
Technology Centers That
Work Philadelphia
Tennessee First to the Top
Schools
Metropolitan Government of
Nashville
Texas Enhanced Network
Texas San Antonio
Independent School District
Vocational Education
Consortium
Vocational Education Summer
Conference Project
Vermont Agency of Education WICHE Pass
WV High Schools, Tech Centers and
Advanced Car
WV Literacy/Math Design Collaborative
-$ -$ -$ -$ -$ -$ -$ -$ -$ -$ -$ -$ -$ 68,460 190,257 27,540 195,473 89,700 281,988 14,740 - - - - 330,197 (9,350)
- - - - - - - - - - - - - - - - - - - - 252,250 - - - - - - 103,401 18,153 - - 7,560 1,220 96,089 21,953 - - - - - - - - - - - - - - - - - - - - - - - - - 1,024,494 - - - - - - - - - - - 65 - - - - - - - - - - - - - - - - - -
68,460 293,658 45,693 195,473 89,700 289,548 15,960 348,404 1,046,447 - - 330,197 (9,350)
4,666 130,429 9,583 142,172 26,321 152,569 21,377 183,698 180,861 554 1,383 100,463 2,434 1,134 31,729 2,698 18,458 3,509 29,224 3,382 42,409 47,592 85 - 31,136 570
16,875 87,888 21,000 4,875 34,150 32,381 - 10,774 5,500 - - 93,099 500 - - - - - - - - - - - - -
7,488 104,724 3,855 27,939 21,506 72,530 11,048 95,933 339,935 - 8,988 41,506 1,152 - 958 - 1,104 2,029 2,198 362 19,363 21,529 - - 1,147 -
29 61 - 127 3 468 - 12,949 32,118 - - 413 - - - - - 200 - - 250 100,115 - - - - - - - - - - - - - - - - -
6,300 20 187 2,590 - 520 3,810 388,564 290,080 39,672 - 47,880 20,448 - - - - - - - 41,218 15,303 - - - - - 208 - 2,575 150 171 - 12,133 18,398 - - 96 - 6 1,749 27 325 49 378 95 646 6,821 - - 220 - - - 3,735 20,016 8,792 29,044 3,686 (336,696) - 64 - 31,596 402
36,498 357,766 41,085 220,181 96,709 319,483 43,760 471,241 1,058,252 40,375 10,371 347,556 25,506
31,962 (64,108) 4,608 (24,708) (7,009) (29,935) (27,800) (122,837) (11,805) (40,375) (10,371) (17,359) (34,856)
96,287 64,108 (4,609) 31,132 22,557 29,935 27,800 4,644,613 4,551,212 40,375 10,371 200,078 34,856
128,249$ -$ (1)$ 6,424$ 15,548$ -$ -$ 4,521,776$ 4,539,407$ -$ -$ 182,719$ -$
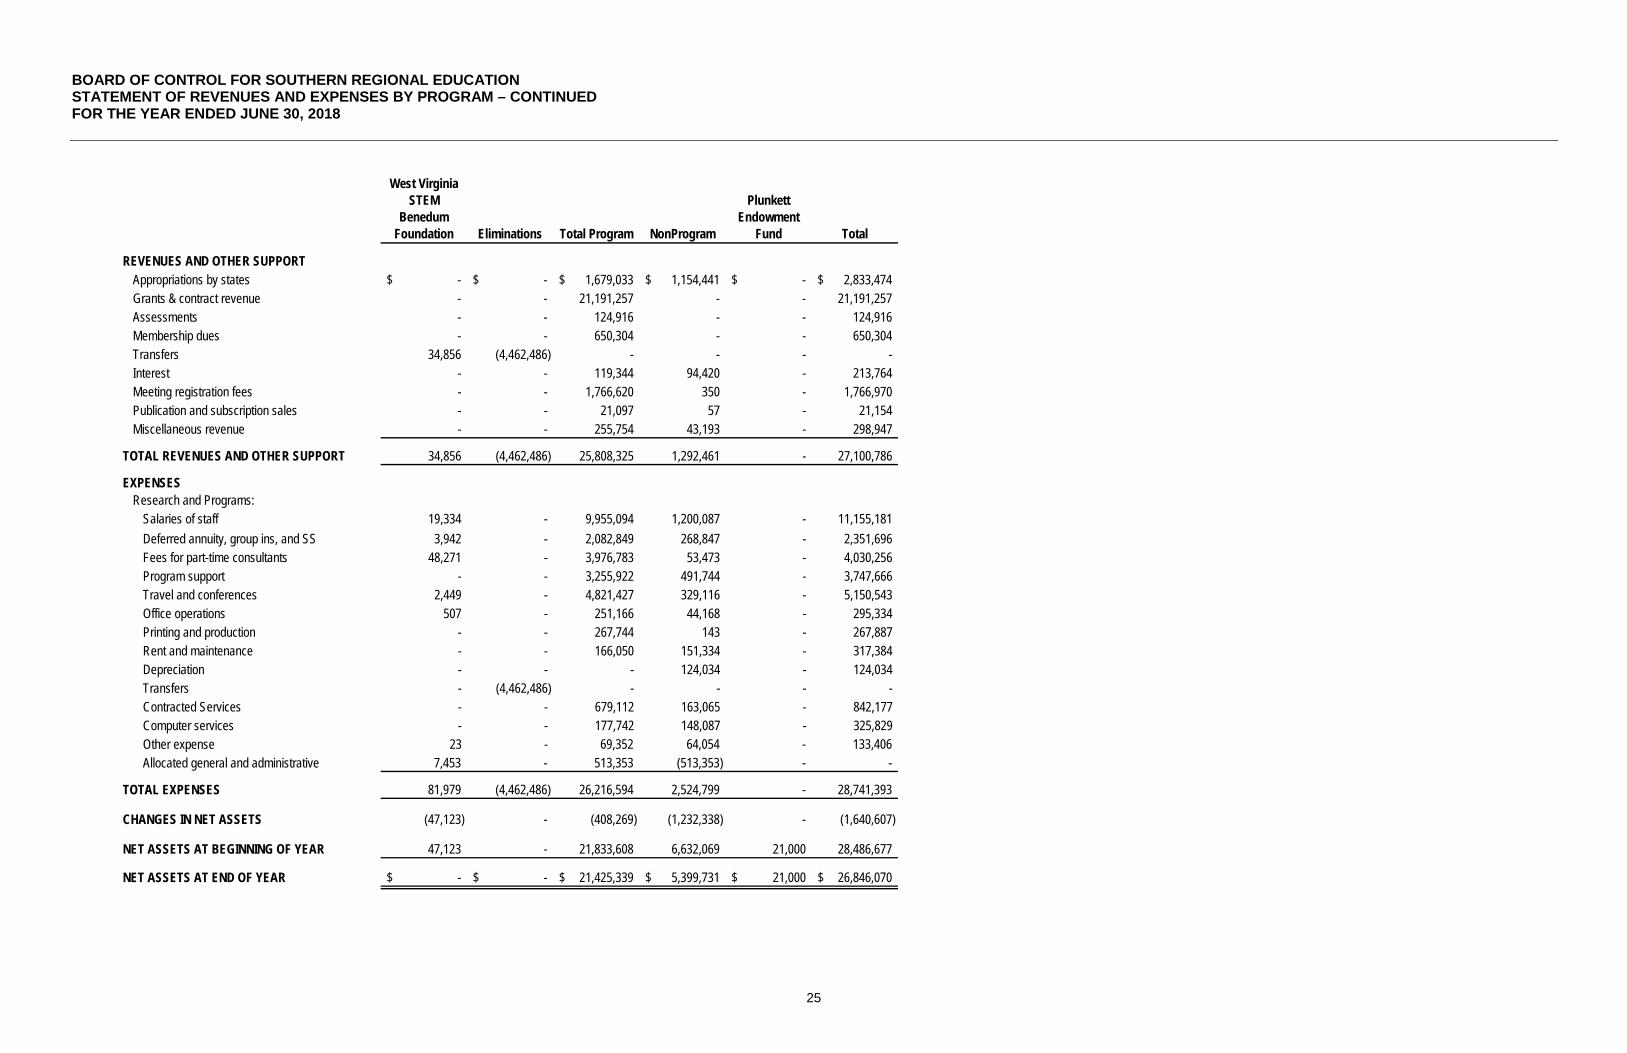
BOARD OF CONTROL FOR SOUTHERN REGIONAL EDUCATION STATEMENT OF REVENUES AND EXPENSES BY PROGRAM – CONTINUED FOR THE YEAR ENDED JUNE 30, 2018
25
REVENUES AND OTHER SUPPORTAppropriations by statesGrants & contract revenueAssessmentsMembership duesTransfersInterestMeeting registration feesPublication and subscription salesMiscellaneous revenue
TOTAL REVENUES AND OTHER SUPPORT
EXPENSESResearch and Programs:
Salaries of staffDeferred annuity, group ins, and SSFees for part-time consultants Program supportTravel and conferencesOffice operationsPrinting and productionRent and maintenanceDepreciationTransfersContracted ServicesComputer servicesOther expenseAllocated general and administrative
TOTAL EXPENSES
CHANGES IN NET ASSETS
NET ASSETS AT BEGINNING OF YEAR
NET ASSETS AT END OF YEAR
West Virginia STEM
Benedum Foundation Eliminations Total Program NonProgram
Plunkett Endowment
Fund Total
-$ -$ 1,679,033$ 1,154,441$ -$ 2,833,474$ - - 21,191,257 - - 21,191,257 - - 124,916 - - 124,916 - - 650,304 - - 650,304
34,856 (4,462,486) - - - - - - 119,344 94,420 - 213,764 - - 1,766,620 350 - 1,766,970 - - 21,097 57 - 21,154 - - 255,754 43,193 - 298,947
34,856 (4,462,486) 25,808,325 1,292,461 - 27,100,786
19,334 - 9,955,094 1,200,087 - 11,155,181 3,942 - 2,082,849 268,847 - 2,351,696
48,271 - 3,976,783 53,473 - 4,030,256 - - 3,255,922 491,744 - 3,747,666
2,449 - 4,821,427 329,116 - 5,150,543 507 - 251,166 44,168 - 295,334
- - 267,744 143 - 267,887 - - 166,050 151,334 - 317,384 - - - 124,034 - 124,034 - (4,462,486) - - - - - - 679,112 163,065 - 842,177 - - 177,742 148,087 - 325,829
23 - 69,352 64,054 - 133,406 7,453 - 513,353 (513,353) - -
81,979 (4,462,486) 26,216,594 2,524,799 - 28,741,393
(47,123) - (408,269) (1,232,338) - (1,640,607)
47,123 - 21,833,608 6,632,069 21,000 28,486,677
-$ -$ 21,425,339$ 5,399,731$ 21,000$ 26,846,070$
BOARD OF CONTROL FOR SOUTHERN REGIONAL EDUCATION
FINANCIAL STATEMENTS
FOR THE YEAR ENDED JUNE 30, 2019
BOARD OF CONTROL FOR SOUTHERN REGIONAL EDUCATION TABLE OF CONTENTS
JUNE 30, 2019
INDEPENDENT AUDITORS’ REPORT 1 FINANCIAL STATEMENTS
Statements of Financial Position 3 Statement of Activities 4 Statement of Functional Expenses 5 Statements of Cash Flows 6 Notes to the Financial Statements 7

1
INDEPENDENT AUDITORS’ REPORT To the Board of Directors Board of Control for Southern Regional Education Report on the Financial Statements We have audited the accompanying financial statements of the Board of Control for Southern Regional Education (the Board) (a nonprofit organization) which comprise the statements of financial position as of June 30, 2019 and the related statements of activities, functional expenses and cash flows for the year then ended, and the related notes to the financial statements. Management’s Responsibility for the Financial Statements Management is responsible for the preparation and fair presentation of these financial statements in accordance with accounting principles generally accepted in the United States of America; this includes the design, implementation, and maintenance of internal control relevant to the preparation and fair presentation of financial statements that are free from material misstatement, whether due to fraud or error. Auditors’ Responsibility Our responsibility is to express an opinion on these financial statements based on our audit. We conducted our audit in accordance with auditing standards generally accepted in the United States of America. Those standards require that we plan and perform the audit to obtain reasonable assurance about whether the financial statements are free from material misstatement. An audit involves performing procedures to obtain audit evidence about the amounts and disclosures in the financial statements. The procedures selected depend on the auditor’s judgment, including the assessment of the risks of material misstatement of the financial statements, whether due to fraud or error. In making those risk assessments, the auditor considers internal control relevant to the entity’s preparation and fair presentation of the financial statements in order to design audit procedures that are appropriate in the circumstances, but not for the purpose of expressing an opinion on the effectiveness of the entity’s internal control. Accordingly, we express no such opinion. An audit also includes evaluating the appropriateness of accounting policies used and the reasonableness of significant accounting estimates made by management, as well as evaluating the overall presentation of the financial statements. We believe that the audit evidence we have obtained is sufficient and appropriate to provide a basis for our audit opinion.

2
Opinion In our opinion, the financial statements referred to above present fairly, in all material respects, the financial position of the Board as of June 30, 2019 and the changes in its net assets and its cash flows for the year then ended in conformity with accounting principles generally accepted in the United States of America. Report on Summarized Comparative Information We have previously audited the Board’s 2018 financial statements, and we expressed an unmodified opinion on those audited financial statements in our report dated October 18, 2018. In our opinion, the summarized comparative information presented herein as of and for the year ended June 30, 2018, is consistent, in all material respects, with the audited financial statements from which it has been derived. Atlanta, Georgia October 14, 2019
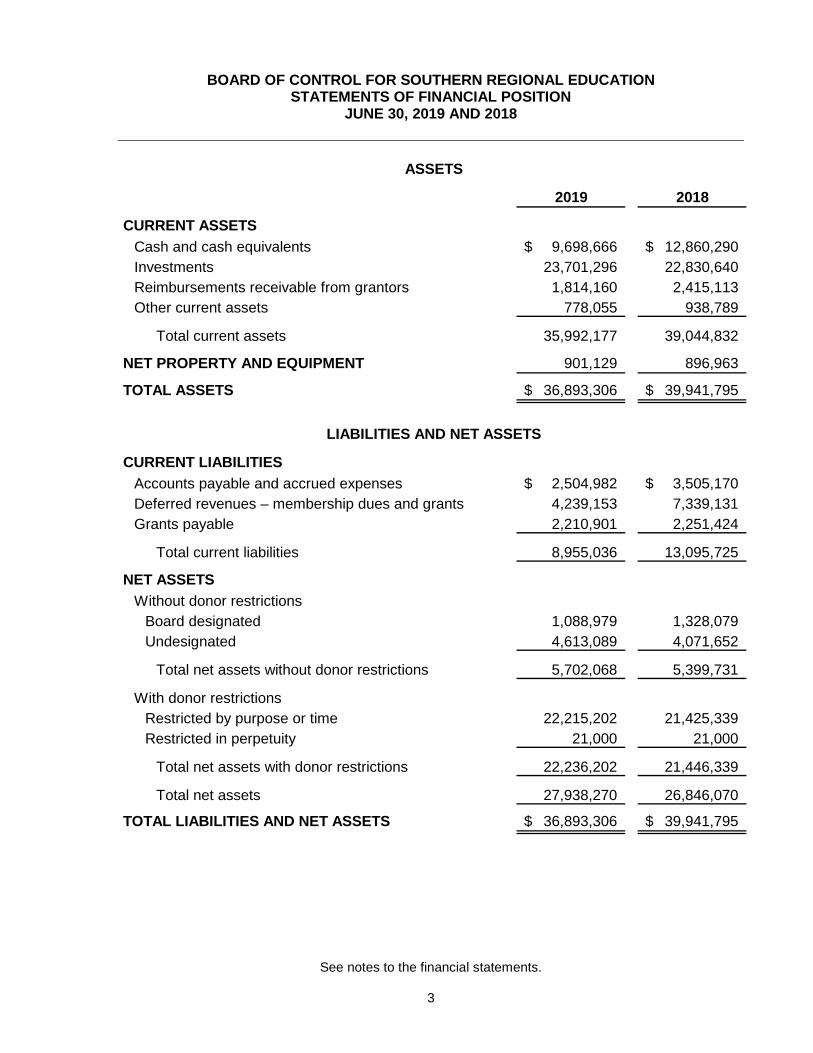
BOARD OF CONTROL FOR SOUTHERN REGIONAL EDUCATION STATEMENTS OF FINANCIAL POSITION
JUNE 30, 2019 AND 2018
See notes to the financial statements. 3
2019 2018
CURRENT ASSETSCash and cash equivalents 9,698,666$ 12,860,290$ Investments 23,701,296 22,830,640Reimbursements receivable from grantors 1,814,160 2,415,113 Other current assets 778,055 938,789
Total current assets 35,992,177 39,044,832
NET PROPERTY AND EQUIPMENT 901,129 896,963
TOTAL ASSETS 36,893,306$ 39,941,795$
CURRENT LIABILITIESAccounts payable and accrued expenses 2,504,982$ 3,505,170$ Deferred revenues – membership dues and grants 4,239,153 7,339,131Grants payable 2,210,901 2,251,424
Total current liabilities 8,955,036 13,095,725
NET ASSETSWithout donor restrictions
Board designated 1,088,979 1,328,079 Undesignated 4,613,089 4,071,652
Total net assets without donor restrictions 5,702,068 5,399,731
With donor restrictionsRestricted by purpose or time 22,215,202 21,425,339 Restricted in perpetuity 21,000 21,000
Total net assets with donor restrictions 22,236,202 21,446,339
Total net assets 27,938,270 26,846,070
TOTAL LIABILITIES AND NET ASSETS 36,893,306$ 39,941,795$
ASSETS
LIABILITIES AND NET ASSETS
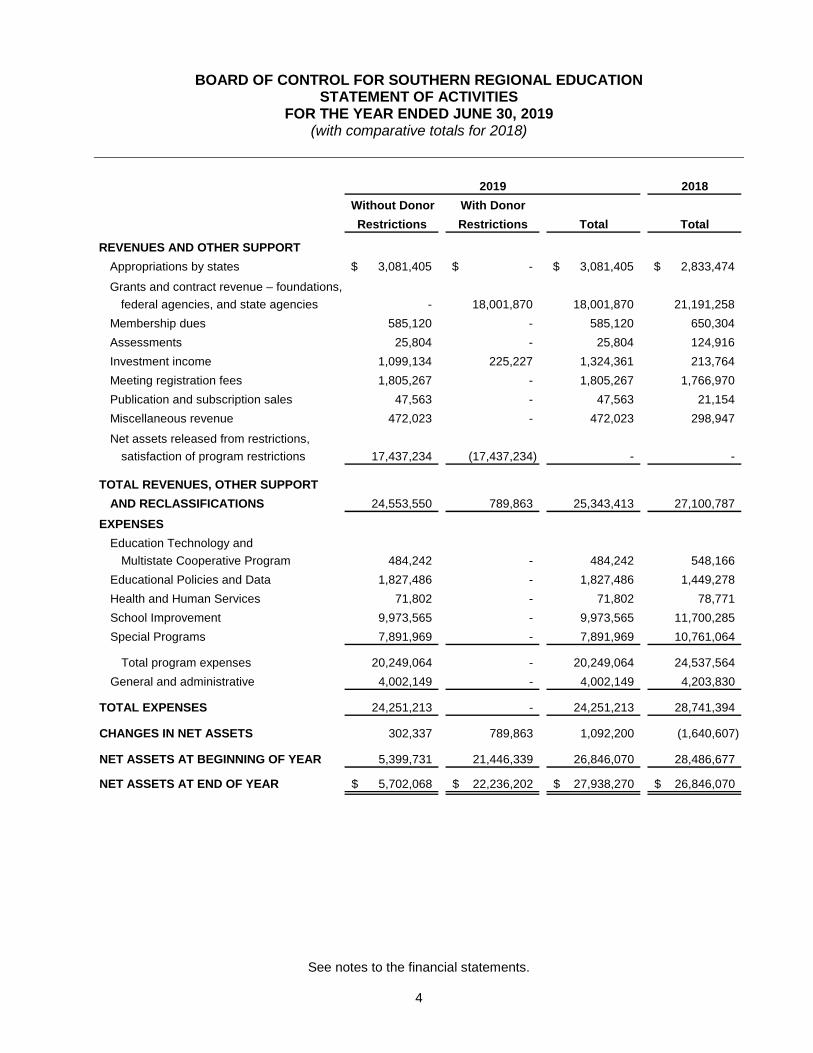
BOARD OF CONTROL FOR SOUTHERN REGIONAL EDUCATION STATEMENT OF ACTIVITIES
FOR THE YEAR ENDED JUNE 30, 2019 (with comparative totals for 2018)
See notes to the financial statements. 4
2018Without Donor With DonorRestrictions Restrictions Total Total
REVENUES AND OTHER SUPPORTAppropriations by states 3,081,405$ -$ 3,081,405$ 2,833,474$ Grants and contract revenue – foundations,
federal agencies, and state agencies - 18,001,870 18,001,870 21,191,258 Membership dues 585,120 - 585,120 650,304 Assessments 25,804 - 25,804 124,916 Investment income 1,099,134 225,227 1,324,361 213,764 Meeting registration fees 1,805,267 - 1,805,267 1,766,970 Publication and subscription sales 47,563 - 47,563 21,154 Miscellaneous revenue 472,023 - 472,023 298,947 Net assets released from restrictions,
satisfaction of program restrictions 17,437,234 (17,437,234) - -
TOTAL REVENUES, OTHER SUPPORTAND RECLASSIFICATIONS 24,553,550 789,863 25,343,413 27,100,787
EXPENSESEducation Technology and
Multistate Cooperative Program 484,242 - 484,242 548,166 Educational Policies and Data 1,827,486 - 1,827,486 1,449,278 Health and Human Services 71,802 - 71,802 78,771 School Improvement 9,973,565 - 9,973,565 11,700,285 Special Programs 7,891,969 - 7,891,969 10,761,064
Total program expenses 20,249,064 - 20,249,064 24,537,564 General and administrative 4,002,149 - 4,002,149 4,203,830
TOTAL EXPENSES 24,251,213 - 24,251,213 28,741,394
CHANGES IN NET ASSETS 302,337 789,863 1,092,200 (1,640,607)
NET ASSETS AT BEGINNING OF YEAR 5,399,731 21,446,339 26,846,070 28,486,677
NET ASSETS AT END OF YEAR 5,702,068$ 22,236,202$ 27,938,270$ 26,846,070$
2019
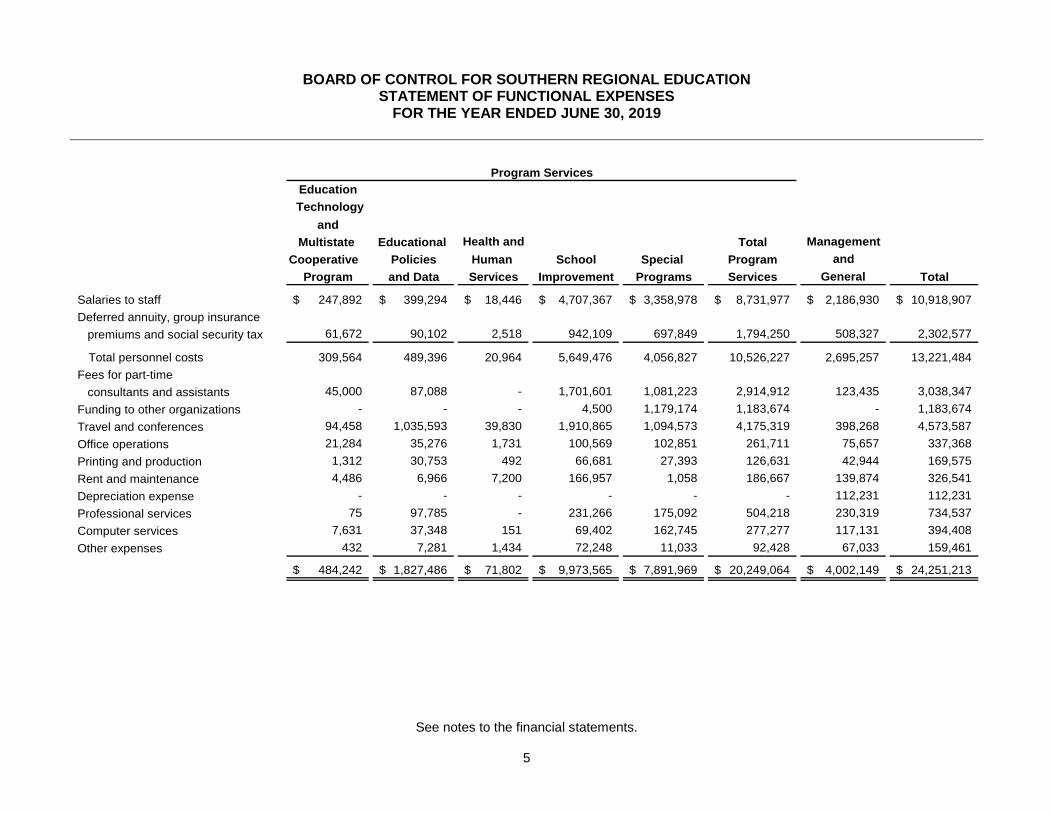
BOARD OF CONTROL FOR SOUTHERN REGIONAL EDUCATION STATEMENT OF FUNCTIONAL EXPENSES
FOR THE YEAR ENDED JUNE 30, 2019
See notes to the financial statements. 5
Education Technology
and Multistate Educational Health and Total Management
Cooperative Policies Human School Special Program andProgram and Data Services Improvement Programs Services General Total
Salaries to staff 247,892$ 399,294$ 18,446$ 4,707,367$ 3,358,978$ 8,731,977$ 2,186,930$ 10,918,907$ Deferred annuity, group insurance premiums and social security tax 61,672 90,102 2,518 942,109 697,849 1,794,250 508,327 2,302,577
Total personnel costs 309,564 489,396 20,964 5,649,476 4,056,827 10,526,227 2,695,257 13,221,484 Fees for part-time consultants and assistants 45,000 87,088 - 1,701,601 1,081,223 2,914,912 123,435 3,038,347 Funding to other organizations - - - 4,500 1,179,174 1,183,674 - 1,183,674 Travel and conferences 94,458 1,035,593 39,830 1,910,865 1,094,573 4,175,319 398,268 4,573,587 Office operations 21,284 35,276 1,731 100,569 102,851 261,711 75,657 337,368 Printing and production 1,312 30,753 492 66,681 27,393 126,631 42,944 169,575 Rent and maintenance 4,486 6,966 7,200 166,957 1,058 186,667 139,874 326,541 Depreciation expense - - - - - - 112,231 112,231 Professional services 75 97,785 - 231,266 175,092 504,218 230,319 734,537 Computer services 7,631 37,348 151 69,402 162,745 277,277 117,131 394,408 Other expenses 432 7,281 1,434 72,248 11,033 92,428 67,033 159,461
484,242$ 1,827,486$ 71,802$ 9,973,565$ 7,891,969$ 20,249,064$ 4,002,149$ 24,251,213$
Program Services

BOARD OF CONTROL FOR SOUTHERN REGIONAL EDUCATION STATEMENTS OF CASH FLOWS
FOR THE YEARS ENDED JUNE 30, 2019 AND 2018
See notes to the financial statements. 6
2019 2018
CASH FLOWS FROM OPERATING ACTIVITIESChanges in net assets $ 1,092,200 $ (1,640,607)Adjustments to reconcile changes in net assets to
net cash (used in) provided by operating activitiesDepreciation expense 112,231 124,034 Net (gain) loss on investments (603,521) 241,697
Changes in operating assets and liabilitiesReimbursements receivable from grantors 600,953 118,127 Other current assets 160,734 (29,229) Accounts payable and accrued expenses (1,000,188) 175,962 Deferred revenues (3,099,978) 1,033,369 Grants payable (40,523) 354,403
Net cash (used in) provided by operating activities (2,778,092) 377,756
CASH FLOWS FROM INVESTING ACTIVITIES(Purchases) redemptions of investments, net (267,135) 947,788 Purchases of equipment (116,397) (76,753)
Net cash (used in) provided by investing activities (383,532) 871,035
NET (DECREASE) INCREASE IN CASH AND CASH EQUIVALENTS (3,161,624) 1,248,791
CASH AND CASH EQUIVALENTS AT BEGINNING OF YEAR 12,860,290 11,611,499
AT END OF YEAR 9,698,666$ 12,860,290$

BOARD OF CONTROL FOR SOUTHERN REGIONAL EDUCATION NOTES TO THE FINANCIAL STATEMENTS
JUNE 30, 2019 AND 2018
7
1. ORGANIZATION The Board of Control for Southern Regional Education (the Board) was created in 1948 to serve as the operating agency of the nation’s first interstate compact working to improve public pre-K through 12th grade and higher education. Sixteen member states contribute funds to the Board to be used for administration, development, research and education programs. The Board’s programs include: • Education Technology and Multistate Cooperative Programs – manages programs that help
states, colleges and schools share resources. • Educational Policies and Data – compiles, analyzes and publishes reports on education
data and policies. • School Improvement – contracts with the states, districts and schools on a range of school
improvement services, including consulting, professions development, coaching, curricula, and teaching strategies.
• Health and Human Services – brings together nursing deans from universities in the Board states and pursues projects to strengthen nursing schools.
• Special Programs – originates from the President’s office and includes grants and contracts that cross programs.
2. SUMMARY OF SIGNIFICANT ACCOUNTING POLICIES Adoption of New Accounting Pronouncement In August 2016 the FASB issued ASU 2016-14-Not-for-Profit Entities (Topic 958): Presentation of Financial Statements of Not-for-Profit Entities, which made several improvements to current financial reporting for not-for-profits. The guidance was effective for the Board’s annual financial statements for the year ended June 30, 2019. The changes in the ASU were applied on a retrospective basis, which means that all financial statements presented reflected the changes and the effect was disclosed for each period presented. The standard does not require the presentation of the statement of functional expenses for 2018. Basis of Presentation The financial statements of the Board have been prepared on the accrual basis of accounting and accordingly reflect all significant receivables, payables, and other liabilities at year-end. Net assets, revenues, expenses, gains, and losses are recorded based on the existence or absence of donor-imposed restrictions. Accordingly, the net assets of the Board and changes therein are classified and reported as follows: Without Donor Restrictions Net assets that are not subject to donor-imposed restrictions. Board Designated Assets designated by the Board to be held for specified purposes. The Board can elect to remove these designations in the future.

BOARD OF CONTROL FOR SOUTHERN REGIONAL EDUCATION NOTES TO THE FINANCIAL STATEMENTS
JUNE 30, 2019 AND 2018
8
2. SUMMARY OF SIGNIFICANT ACCOUNTING POLICIES – CONTINUED With Donor Restrictions Net assets subject to donor-imposed stipulations that may or will be met either by actions of the Board and/or passage of time as well as net assets subject to donor-imposed stipulations that the Board maintain them permanently. Earnings from the Board’s net assets held in perpetuity are restricted by donors to provide a permanent source of income. Presentation The amounts shown for the year ended June 30, 2018 in the accompanying financial statements are included to provide a basis for comparison with 2019 and present summarized totals only. Accordingly, the 2018 totals are not intended to present all information necessary for a fair presentation in conformity with accounting principles generally accepted in the United States of America (GAAP). Such information should be read in conjunction with the Board’s financial statements for the year ended June 30, 2018, from which the summarized information was derived. Reclassifications Certain 2018 accounts have been reclassified to conform to the 2019 presentation. Total net assets and changes in net assets, as previously reported for 2018, were unchanged due to these reclassifications. Cash and Cash Equivalents The Board considers all highly liquid instruments with an original maturity of three months or less to be cash equivalents. Money market funds and certificates of deposits with a maturity of greater than three months are classified as investments. Accounting for Contributions The Board records contributions at the date of the gift. Donated investments are recorded at their fair value on the date donated. All contributions are considered to be available for unrestricted use unless specifically restricted by the donor. Contributions received that are designated by the donor for specific purposes or for use in a future period are reported as an increase to net assets with donor restrictions. The Board receives grants that are structured as contributions. The related revenue is recognized as described above. In addition the Board receives reimbursement basis grants for which revenue is recognized as expenditures are made. Restrictions on contributions expire when a purpose or time restriction is accomplished. Upon satisfaction, net assets with donor restrictions are reclassified to net assets without donor restrictions and are reported in the accompanying statement of activities as net assets released from restrictions. Net assets with donor restrictions include the principal amount of contributions accepted with the stipulation from the donors that the principal be maintained in perpetuity.

BOARD OF CONTROL FOR SOUTHERN REGIONAL EDUCATION NOTES TO THE FINANCIAL STATEMENTS
JUNE 30, 2019 AND 2018
9
2. SUMMARY OF SIGNIFICANT ACCOUNTING POLICIES – CONTINUED Investments The Board adheres to the provisions of Financial Accounting Standards Board (FASB) Accounting Standards Codification (ASC) 820, Fair Value Measurements, for its investments. The standard provides guidance for using fair value to measure assets and liabilities. Under the standard, fair value refers to the price that would be received to sell an asset or paid to transfer a liability in an orderly transaction between market participants in the market in which the reporting entity transacts. It clarifies the principle that fair value should be based on the assumptions market participants would use when pricing the asset or liability. Investments measured and reported at fair value are classified and disclosed in one of the following categories:
• Level 1: Quoted prices for identical instruments in active markets at the measurement date. Investments that are listed on a United States securities exchange are valued at their last sales price on the largest United States securities exchange on which such securities have traded.
• Level 2: Quoted prices for similar instruments in active markets; quoted prices for identical or similar instruments in markets that are not active and model-derived valuation in which all significant inputs and significant value drivers are observable in active markets at the date and for the anticipated term of the instrument.
• Level 3: Valuation derived from valuation techniques in which one or more significant inputs or significant value drivers are unobservable inputs that reflect the reporting entity’s own assumptions about the assumptions market participants would use in pricing the asset or liability developed based on the best information available in the circumstances.
In certain cases, the inputs used to measure fair value may fall into different levels of the fair value hierarchy. In such cases, an investment’s level within the fair value hierarchy is based on the lowest level of input that is significant to the fair value measurement. The Board’s assessment of the significance of a particular input to the fair value measurement in its entirety requires judgment, and considers factors specific to the investment. The Board holds certain government and corporate bonds that are considered Level 2 investments. Management has determined broker reported prices are a reasonable estimation of fair value as of June 30, 2019 and 2018. Broker reported prices are determined using inputs including last trade prices, current market conditions, perceived market movements, news and other relevant information. The fair value of fixed-maturity certificates of deposit is estimated using the rates currently offered for deposits of similar remaining maturities.

BOARD OF CONTROL FOR SOUTHERN REGIONAL EDUCATION NOTES TO THE FINANCIAL STATEMENTS
JUNE 30, 2019 AND 2018
10
2. SUMMARY OF SIGNIFICANT ACCOUNTING POLICIES – CONTINUED These methods may produce a fair value calculation that may not be indicative of net realizable value or reflective of future fair values. Furthermore, although management believes its valuation method is appropriate and consistent with other market participants, the use of different methodologies or assumptions to determine the fair value of certain financial instruments could result in a different fair value measurement at the reporting date. Fair Value of Financial Instruments and Credit Risk Financial instruments, principally cash, receivables, investments and accounts payable, are reported at fair value. The Board places its cash with financial institutions. At times, these investments are in excess of the Federal Deposit Insurance Corporation (FDIC) insurance limits. Management believes the risk in these situations to be minimal. Revenue Recognition Membership dues are recognized over the membership period. Revenue from the sale of publications is recognized at the time of sale. Revenue for assessments, meeting registration and presentation fees is recognized as services are performed. Grant and contract revenue are primarily reimbursement basis and are recognized as expenditures are made. An allowance for uncollectible receivables is provided based on management’s evaluation of potential uncollectible promises receivable at year end. Management does not consider any amounts to be uncollectible at June 30, 2019 and 2018. Deferred Revenue Deferred revenue represents membership payments, registration fees and grant monies received in current and prior years that relate to subsequent years. Appropriations The member states pay appropriations to the Board in an amount that is determined annually by the Board of Directors. Agency Funds The Board serves as the fiscal agent and administrator of interstate arrangements for regional educational services and institutions. The Board also serves as administrator of the Minority Doctoral Scholars Program. Concentration For the year ended June 30, 2019, there was one individual donor who represented 43% of the Board’s revenue. There was one program member representing 11% of accounts receivable at June 30, 2019. For the year ended June 30, 2018, there was one individual donor who represented 49% of the Board’s revenue. There were two program members representing 29% of accounts receivable at June 30, 2018.

BOARD OF CONTROL FOR SOUTHERN REGIONAL EDUCATION NOTES TO THE FINANCIAL STATEMENTS
JUNE 30, 2019 AND 2018
11
2. SUMMARY OF SIGNIFICANT ACCOUNTING POLICIES – CONTINUED Property and Equipment Property and equipment are stated at cost less accumulated depreciation. Depreciation is computed using the straight-line method based on the estimated useful lives of the classes of depreciable property. The Board capitalizes all expenditures for property and equipment over $10,000. Useful lives are as follows: Furniture and equipment 3-10 years Leasehold improvements 5-10 years Building 50 years Use of Estimates The preparation of financial statements in conformity with GAAP requires management to make estimates and assumptions that affect the reported amounts of assets and liabilities and disclosure of contingent assets and liabilities at the date of the financial statements and the reported amounts of revenues and expenses during the reporting period. Actual results could differ from those estimates. Functional Allocation of Expenses The costs of providing the various programs and activities have been summarized on a functional basis in the statement of activities and functional expenses. Accordingly, certain costs have been allocated among the program services benefited based a personnel-cost basis. Tax Status The Board is exempt from income taxes under Section 501(c)(3) of the U.S. Internal Revenue Code (IRC) and is classified as an organization which is not a private foundation under Section 509(a) of the IRC. Recently Issued Accounting Standards In May 2014 the FASB issued ASU 2014-09, Revenue from Contracts with Customers (Topic 606) superseding the guidance in former ACS 605, Revenue Recognition. It requires entities to recognize revenue based on the transfer of promised goods or services to customers in an amount that reflects the consideration to which the entity expects to be entitles in exchange for those goods or services. The new guidance will be effective for fiscal year ending June 30, 2020 for the Board. The Board does not expect the adoption to have a material impact on the financial statements. In June 2018 the FASB issued ASU 2018-08 Not-for-Profit Entities (Topic 958-605) clarifying the accounting guidance for contributions received and contributions made to further improve the scope and the accounting guidance for revenue recognition, to assist entities distinguishing between contributions (non-reciprocal) and exchange (reciprocal) transactions and to determine whether a contribution is conditional. The effective date of the amendment is fiscal year ending June 30, 2020. The Board does not expect the adoption to have a material impact on the financial statements.
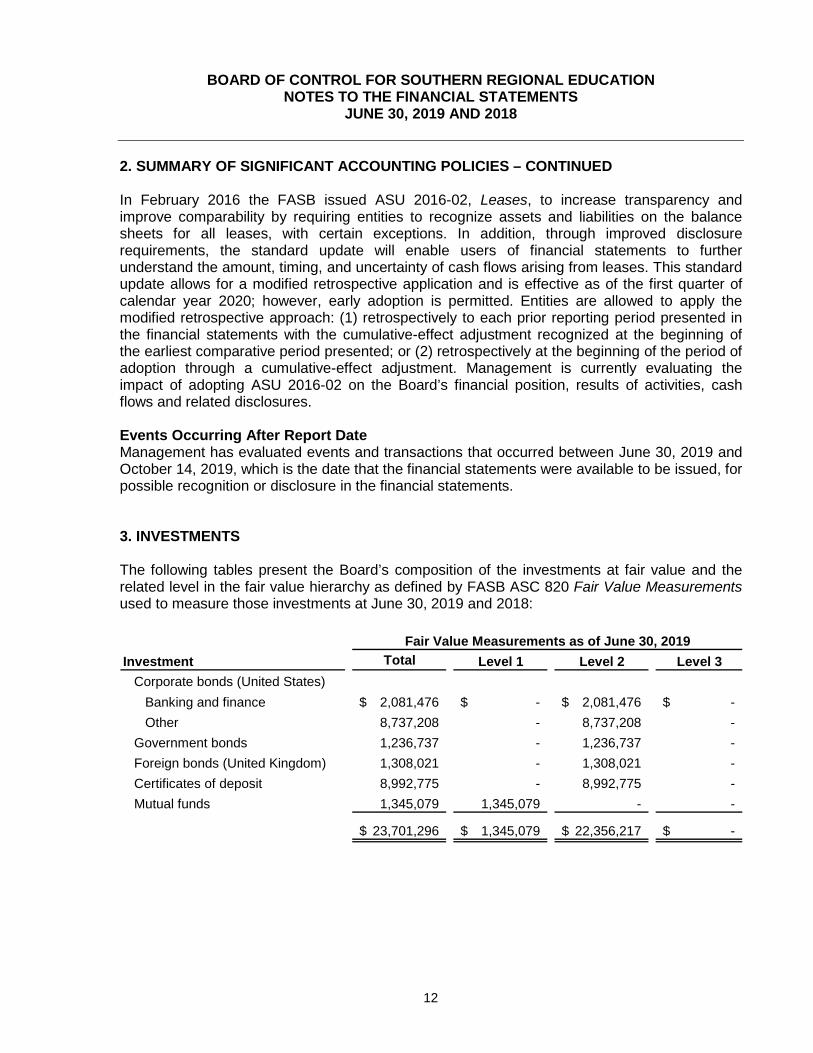
BOARD OF CONTROL FOR SOUTHERN REGIONAL EDUCATION NOTES TO THE FINANCIAL STATEMENTS
JUNE 30, 2019 AND 2018
12
2. SUMMARY OF SIGNIFICANT ACCOUNTING POLICIES – CONTINUED In February 2016 the FASB issued ASU 2016-02, Leases, to increase transparency and improve comparability by requiring entities to recognize assets and liabilities on the balance sheets for all leases, with certain exceptions. In addition, through improved disclosure requirements, the standard update will enable users of financial statements to further understand the amount, timing, and uncertainty of cash flows arising from leases. This standard update allows for a modified retrospective application and is effective as of the first quarter of calendar year 2020; however, early adoption is permitted. Entities are allowed to apply the modified retrospective approach: (1) retrospectively to each prior reporting period presented in the financial statements with the cumulative-effect adjustment recognized at the beginning of the earliest comparative period presented; or (2) retrospectively at the beginning of the period of adoption through a cumulative-effect adjustment. Management is currently evaluating the impact of adopting ASU 2016-02 on the Board’s financial position, results of activities, cash flows and related disclosures. Events Occurring After Report Date Management has evaluated events and transactions that occurred between June 30, 2019 and October 14, 2019, which is the date that the financial statements were available to be issued, for possible recognition or disclosure in the financial statements. 3. INVESTMENTS The following tables present the Board’s composition of the investments at fair value and the related level in the fair value hierarchy as defined by FASB ASC 820 Fair Value Measurements used to measure those investments at June 30, 2019 and 2018:
Investment Total Level 1 Level 2 Level 3Corporate bonds (United States)
Banking and finance 2,081,476$ -$ 2,081,476$ -$ Other 8,737,208 - 8,737,208 -
Government bonds 1,236,737 - 1,236,737 - Foreign bonds (United Kingdom) 1,308,021 - 1,308,021 - Certificates of deposit 8,992,775 - 8,992,775 - Mutual funds 1,345,079 1,345,079 - -
23,701,296$ 1,345,079$ 22,356,217$ -$
Fair Value Measurements as of June 30, 2019

BOARD OF CONTROL FOR SOUTHERN REGIONAL EDUCATION NOTES TO THE FINANCIAL STATEMENTS
JUNE 30, 2019 AND 2018
13
3. INVESTMENTS – CONTINUED
Investment Total Level 1 Level 2 Level 3Corporate bonds (United States)
Banking and finance 4,501,970$ -$ 4,501,970$ -$ Other 9,288,404 - 9,288,404 -
Foreign bonds (United Kingdom) 484,295 - 484,295 - Certificates of deposit 7,262,664 - 7,262,664 - Mutual funds 1,293,307 1,293,307 - -
22,830,640$ 1,293,307$ 21,537,333$ -$
Fair Value Measurements as of June 30, 2018
Investment income for the years ended June 30, 2019 and 2018 is composed of:
2019 2018
Interest and dividend income 771,732$ 502,553$ Net gain (loss) on investments 603,521 (241,697) Brokerage fees (50,892) (47,092)
1,324,361$ 213,764$
4. PROPERTY AND EQUIPMENT The Board’s property and equipment consisted of the following at June 30:
2019 2018
Building 1,625,000$ 1,625,000$ Furniture and equipment 797,465 797,465Leasehold improvements 1,123,005 1,006,609
3,545,470 3,429,074 Accumulated depreciation (2,644,341) (2,532,111)
901,129$ 896,963$
Depreciation expense of $112,231 and $124,034 was recorded for the years ended June 30, 2019 and 2018, respectively.

BOARD OF CONTROL FOR SOUTHERN REGIONAL EDUCATION NOTES TO THE FINANCIAL STATEMENTS
JUNE 30, 2019 AND 2018
14
5. BENEFIT PLANS The Board has a defined contribution pension plan (the Plan), which covers substantially all employees and provides for the purchase of individual deferred annuity contracts from Teachers Insurance and Annuity Association of America. The Board contributed $916,162 and $936,991 to the Plan for the years ended June 30, 2019 and 2018, respectively. In 2006 the Board established a 457(b) Deferred Compensation Plan to provide deferred compensation for a select group of employees. The President and the senior executives reporting directly to the President are eligible to participate in the Deferred Compensation Plan. Eligible employees are allowed to make elective salary deferrals up to the maximum amount permitted by law. The Board does not make any contributions to the Deferred Compensation Plan. The Deferred Compensation Plan provides for the purchase of individual deferred annuity contracts from Teachers Insurance and Annuity Association of America. 6. CAPITAL LEASE The Board entered into a lease obligation in 1987 with the Board of Regents of the State of Georgia to occupy an office building for a 50-year period. The lease required annual payments of $90,000 through 2011. For the remaining 25 years under the lease term, no further lease payments are required, and the Board is entitled to occupy the building. This obligation has been recorded as a capital lease. However, the Board does not own the building and the lease does not address extension or purchase options when the lease terminates in 2036. At June 30, 2019 the cost of assets under capital lease was $1,625,000. Depreciation expense for the year ended June 30, 2019 related to the capitalized building was $32,500 and at June 30, 2019 accumulated depreciation was $1,072,500. 7. LEASE COMMITMENTS The Board has obligations under various non-cancelable operating leases for office equipment. Related rental expense for the years ended June 30, 2019 and 2018 amounted to approximately $20,000. Future minimum lease payments under these leases are as follows:
Year Ending June 30,2020 6,733$ 2021 2,805

BOARD OF CONTROL FOR SOUTHERN REGIONAL EDUCATION NOTES TO THE FINANCIAL STATEMENTS
JUNE 30, 2019 AND 2018
15
8. COMPOSITION OF NET ASSETS At June 30, 2019 and 2018 net assets without donor restrictions have been designated by the Board of Directors as follows:
2019 2018
Reserve for contingencies 324,489$ 324,489$ Quality of Education Program 764,490 1,003,590
1,088,979$ 1,328,079$
Net assets with donor restrictions were available for the following purposes at June 30, 2019 and 2018:
2019 2018Subject to expenditures for specific purpose:
High Schools That Work 16,201,547$ 15,646,536$ Education policies 5,093,687 4,885,163 Council for Collegiate Nursing 132,508 91,939 Other educational programs 787,460 801,701
22,215,202 21,425,339 Subject to restriction in perpetuity:
Plunkett Endowment 21,000 21,000
22,236,202$ 21,446,339$
Net assets with donor restrictions released from restrictions during the year ended June 30, 2019 was as follows:
High Schools That Work 14,143,621$ Education policies 2,083,553 Council for Collegiate Nursing 71,801 Other educational programs 1,138,259
17,437,234$
Net assets subject to restrictions in perpetuity are restricted to provide an annual award to recognize an outstanding educator.

BOARD OF CONTROL FOR SOUTHERN REGIONAL EDUCATION NOTES TO THE FINANCIAL STATEMENTS
JUNE 30, 2019 AND 2018
16
9. AGENCY RELATIONSHIPS The Board acts as a fiscal agent by receiving funds from various states and disbursing them to qualified recipients. As of June 30, 2019 and 2018, funds received that had not yet been disbursed, amounted to $2,053,456 and $2,050,342, respectively, which is included in grants payable on the statements of financial position. The remaining balance in grants payable is attributable to the funds on deposit for future state staff development, software rebates and travel expenses. 10. LIQUIDITY AND FUNDS AVAILABLE The following table reflects the Board’s financial assets as of June 30, 2019 and 2018, reduced by amounts not available for expenditure within one year. Financial assets are considered unavailable when illiquid or not convertible to cash within one year, perpetual endowments, and accumulated earnings net of appropriations within one year.
2019 2018Financial assets:
Cash and cash equivalents 9,698,666$ 12,860,290$ Investments 23,701,296 22,830,640 Reimbursements receivable from grantors 1,814,160 2,415,113
Financial assets, at year-end 35,214,122 38,106,043 Less: Assets unavailable for general expenditures
within one year:Board designated 1,088,979 1,328,079 Net assets with donor purpose or time restrictions 22,215,202 21,425,339 Net assets restricted in perpetuity 21,000 21,000
Financial assets available to meet cash needs forgeneral expenditures within one year 11,888,941$ 15,331,625$
The Board is substantially supported by grants and contract revenue. Because a donor’s restrictions requires resources to be used in a particular manner or in a future period, the Board must maintain sufficient resources to meet those responsibilities to donors. The Board’s endowment funds consist of donor-restricted endowments. Therefore, certain financial assets may not be available for general expenditures within one year. As part of the Board’s liquidity management, it has a policy to structure its financial assets to be available as its general expenditures, liabilities, and other obligations come due.

2015-2016 Arkansas Dentistry 2 $19,000 $38,000
2015-2016 Institutional Tuition Earned: $38,000
2016-2017 Arkansas Dentistry 2 $20,300 $40,600
2016-2017 Institutional Tuition Earned: $40,600
2017-2018 Arkansas Dentistry 2 $21,300 $42,600
2017-2018 Institutional Tuition Earned: $42,600
2018-2019 Arkansas Dentistry 1 $21,900 $21,900
2018-2019 Institutional Tuition Earned: $21,900
Fall 2019 Arkansas Dentistry 1 $21,900 $10,950
Fall 2019 Institutional Tuition Earned: $10,950
5-year Total Institutional Tuition Earned: $154,050
History and Statistics
Meharry Medical College
SREB Regional Contract Program
Academic Year
Participating State
ProgramTotal Slots Filled
Per SREB records, Meharry Medical College last updated its master contract with SREB for the Regional Contract Program for Academic Year 2018-19, with Exhibit A-1 amendment for 2019-20. Following are the RCP stats per academic year for the last 5 years:
RCP Contract
Rate
State Rate (Exception)
Total Paid by State

2015-2016 Arkansas Optometry 20 $16,700 $334,0002015-2016 Georgia Optometry 24 $16,700 $400,8002015-2016 Kentucky Optometry 18 $16,700 $300,6002015-2016 Louisiana Optometry 20 $16,700 $334,0002015-2016 Mississippi Optometry 30 $16,700 $501,0002015-2016 South Carolina Optometry 13.5 $16,700 $225,450
2015-2016 Institutional Tuition Earned: $2,095,850
2016-2017 Arkansas Optometry 20 $17,800 $356,0002016-2017 Georgia Optometry 24 $17,800 $427,2002016-2017 Kentucky Optometry 19 $17,800 $16,700 $317,3002016-2017 Louisiana Optometry 23 $17,800 $409,4002016-2017 Mississippi Optometry 29 $17,800 $516,2002016-2017 South Carolina Optometry 10 $17,800 $178,000
2016-2017 Institutional Tuition Earned: $2,204,100
2017-2018 Arkansas Optometry 20 $18,700 $374,0002017-2018 Georgia Optometry 24 $18,700 $448,8002017-2018 Kentucky Optometry 17 $18,700 $17,600 $299,2002017-2018 Louisiana Optometry 21 $18,700 $392,7002017-2018 Mississippi Optometry 24 $18,700 $448,8002017-2018 South Carolina Optometry 11 $18,700 $205,700
2017-2018 Institutional Tuition Earned: $2,169,200
2018-2019 Arkansas Optometry 20 $19,200 $384,0002018-2019 Georgia Optometry 24 $19,200 $460,8002018-2019 Kentucky Optometry 13 $19,200 $249,6002018-2019 Louisiana Optometry 23 $19,200 $441,6002018-2019 Mississippi Optometry 25 $19,200 $480,0002018-2019 South Carolina Optometry 12 $19,200 $230,400
2018-2019 Institutional Tuition Earned: $2,246,400
Fall 2019 Arkansas Optometry 20 $19,200 $192,000Fall 2019 Georgia Optometry 24 $19,200 $230,400Fall 2019 Kentucky Optometry 13 $19,200 $124,800Fall 2019 Louisiana Optometry 31 $19,200 $297,600Fall 2019 Mississippi Optometry 24 $19,200 $230,400Fall 2019 South Carolina Optometry 8 $19,200 $76,800
Fall 2019 Institutional Tuition Earned: $1,152,0005-year Total Institutional Tuition Earned: $9,867,550
Southern College of Optometry
State Rate (Exception)
Total Paid by State
SREB Regional Contract Program
History and Statistics
Per SREB records, Southern College of Optometry entered into a master contract with SREB for the Regional Contract Program for Academic Year 2018-19, with Exhibit A-1 amendment for 2019-20. Following are the RCP stats per academic year for the last 5 years:
Academic Year
Participating State
ProgramTotal Slots Filled
RCP Contract
Rate

2015-2016 Arkansas Dentistry 86 $19,000 $1,634,000
2015-2016 Institutional Tuition Earned: $1,634,000
2016-2017 Arkansas Dentistry 84 $20,300 $1,705,200
2016-2017 Institutional Tuition Earned: $1,705,200
2017-2018 Arkansas Dentistry 83 $21,300 $1,767,900
2017-2018 Institutional Tuition Earned: $1,767,900
2018-2019 Arkansas Dentistry 86.5 $21,900 $1,894,350
2018-2019 Institutional Tuition Earned: $1,894,350
Fall 2019 Arkansas Dentistry 92 $21,900 $1,007,400
Fall 2019 Institutional Tuition Earned: $1,007,400
5-year Total Institutional Tuition Earned: $8,008,850
SREB Regional Contract Program
History and Statistics
Per SREB records, the University of Tennessee entered into a master contract with SREB for the Regional Contract Program for Academic Year 2015-16, with Exhibit A-1 amendments each year thereafter. Following are the RCP stats per academic year for the last 5 years:
Academic Year
Participating State
ProgramTotal Slots Filled
RCP Contract
Rate
University of Tennessee
State Rate (Exception)
Total Paid by State

2017 Tuition Savings ACM Tuition Savings by State of Residence State Tuition Savings Alabama $1,582,597 Arkansas $1,059,953 Delaware $1,785,136 Florida $260,740 Georgia $19,182,377 Kentucky $3,224,207 Louisiana $1,035,069 Maryland $9,020,644 Mississippi $871,720 Oklahoma $526,105 South Carolina $1,087,018 Tennessee $1,905,230 Texas $366,138 Virginia $8,419,259 West Virginia $978,585 Total $51,304,778 *Tuition savings by state were calculated by determining the difference between in- and out-of-state tuition for each program during the AY 16-17 then adding the difference for each student certified. Savings reflected are only for the AY 16-17.
ACM Average Tuition Savings per Student by State of Residence State Tuition Savings Alabama $12,763 Arkansas $14,520 Delaware $15,389 Florida $11,852 Georgia $16,623 Kentucky $16,367 Louisiana $12,623 Maryland $16,224 Mississippi $13,621 Oklahoma $37,579 South Carolina $8,984 Tennessee $13,609 Texas $10,769 Virginia $16,476 West Virginia $14,606 *Average savings per student, for the AY 16-17 were calculated by taking the total state savings and dividing it by the number of certified students.

State Authorization Reciprocity Agreement: Institutional Cost/Savings Analysis
Tennessee's Estimated Costs for Initial Authorization
Small Institution Medium Institution Large Institution Total Estimated
Authorization Costs
Estimated Costs $ 3,024,000 $ 3,864,000 $ 2,368,800 $ 9,256,800 % of Total Costs 0.33 0.42 0.26
Tennessee's Estimated Costs for Renewal Authorization
Small Institution Medium Institution Large Institution Total Estimated
Authorization Costs
Estimated Costs $ 1,056,000 $ 1,232,800 $ 640,800 $ 2,929,600 % of Total Costs 0.36 0.42 0.22
Tennessee's Estimated Savings for Initial Authorization
State Estimated Costs for S/M/L Institutions
State and NC SARA Costs
SREB Affiliation Fee Estimated Savings
TN $ 9,256,800 $ 352,000 $ 8,904,800
Tennessee's Estimated Savings for Renewal Authorization
State Estimated Costs for S/M/L Institutions
State and NC SARA Costs
SREB Affiliation Fee Estimated Savings
TN $ 2,929,600 $ 352,000 $ 2,577,600

SREB Services to Tennessee
SREB.org | June 2019
A nonpartisan interstate compact formed among legislators and governors in 1948, the Southern Regional Education Board serves states and districts to improve education, from early childhood through graduate degrees and adult learning.
Sharing scarce resources. Maximizing state dollars.
FY 2019-20 appropriations for each SREB state: $208,508 SREB leverages this support from states to attract 10 to 15 times as much in grants and contracts for specific projects for compact states. With just the four SREB programs below, Tennessee colleges, schools, agencies and students saved or gained $9.1 million in the most recent year.
Academic Common Market
In 2017, 132 Tennessee students participated, saving $13,609 each on average and a total of $1.9 million in out-of-state tuition.
Regional Contract Program
Tennessee institutions received over $4 million from contracts for in-state tuition with other SREB states in 2018-19.
State Authorization Reciprocity Agreement (SARA)
Colleges and universities in Tennessee avoided $8.9 million in initial authorization fees and save an estimated $2.6 million annually on renewals through this collaboration among states to bring high-quality distance offerings to students and ease financial and regulatory burdens on states.
Technology Purchasing Savings
With tech purchasing contracts available through SREB, Tennessee schools, colleges and state agencies saved $640,238 on $6.5 million in purchases in fiscal year 2018.
Helping K-12 schools improve
SREB states have priority access to effective research-based school improvement services, from career pathway reviews to curricula to professional development. A few examples in Tennessee:
Making Schools Work
Tennessee is a member of this network. SREB is delivering 60 days of on-site coaching and professional development in two Tennessee districts during 2018-19.
Summer PD Conferences
19 Tennessee teachers and other school leaders attended in 2018.
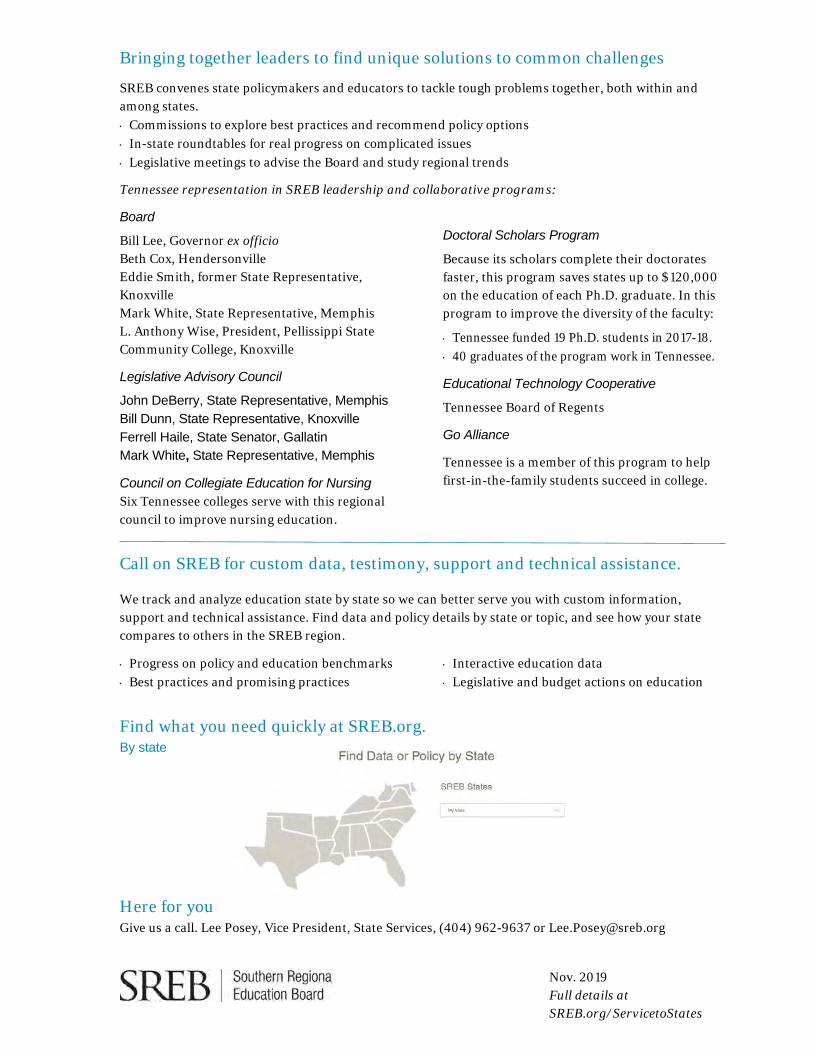
Nov. 2019 Full details at SREB.org/ServicetoStates
Bringing together leaders to find unique solutions to common challenges
SREB convenes state policymakers and educators to tackle tough problems together, both within and among states.
⋅ Commissions to explore best practices and recommend policy options
⋅ In-state roundtables for real progress on complicated issues
⋅ Legislative meetings to advise the Board and study regional trends
Tennessee representation in SREB leadership and collaborative programs:
Board
Bill Lee, Governor ex officio Beth Cox, Hendersonville Eddie Smith, former State Representative, Knoxville Mark White, State Representative, Memphis L. Anthony Wise, President, Pellissippi State Community College, Knoxville
Legislative Advisory Council
John DeBerry, State Representative, Memphis Bill Dunn, State Representative, Knoxville Ferrell Haile, State Senator, Gallatin Mark White, State Representative, Memphis
Council on Collegiate Education for Nursing Six Tennessee colleges serve with this regional council to improve nursing education.
Doctoral Scholars Program
Because its scholars complete their doctorates faster, this program saves states up to $120,000 on the education of each Ph.D. graduate. In this program to improve the diversity of the faculty:
⋅ Tennessee funded 19 Ph.D. students in 2017-18.
⋅ 40 graduates of the program work in Tennessee.
Educational Technology Cooperative
Tennessee Board of Regents
Go Alliance
Tennessee is a member of this program to help first-in-the-family students succeed in college.
Call on SREB for custom data, testimony, support and technical assistance.
We track and analyze education state by state so we can better serve you with custom information, support and technical assistance. Find data and policy details by state or topic, and see how your state compares to others in the SREB region.
⋅ Progress on policy and education benchmarks
⋅ Best practices and promising practices ⋅ Interactive education data
⋅ Legislative and budget actions on education
Find what you need quickly at SREB.org. By state Here for you Give us a call. Lee Posey, Vice President, State Services, (404) 962-9637 or [email protected]