response burden ii: how to reduce and manage burden?bar chart & time -series line chart: ... the...
TRANSCRIPT

Visualization
Presenter: Mojca Bavdaž ([email protected])
Guest: Jorge Camoes (excelcharts.com)
EMOS Webinar, 17 May 2017

Outline
Icon by Giuditta Valentina Gentile from Noun Project
16:30 Break 18:00
2
Classic
examples
Visual
processing
Representation
& perception
Official
statistics

Classic examples of visualization

Bar chart & time-series line chart:
Price of wheat & wages
4Chart shewing at one view the price of the quarter of wheat, & wages of labour by the week, from the year
1565 to 1821 by William Playfair (1822). (The second edition / with an additional chart.). Retrieved from
http://brbl-dl.library.yale.edu/vufind/Record/3566707
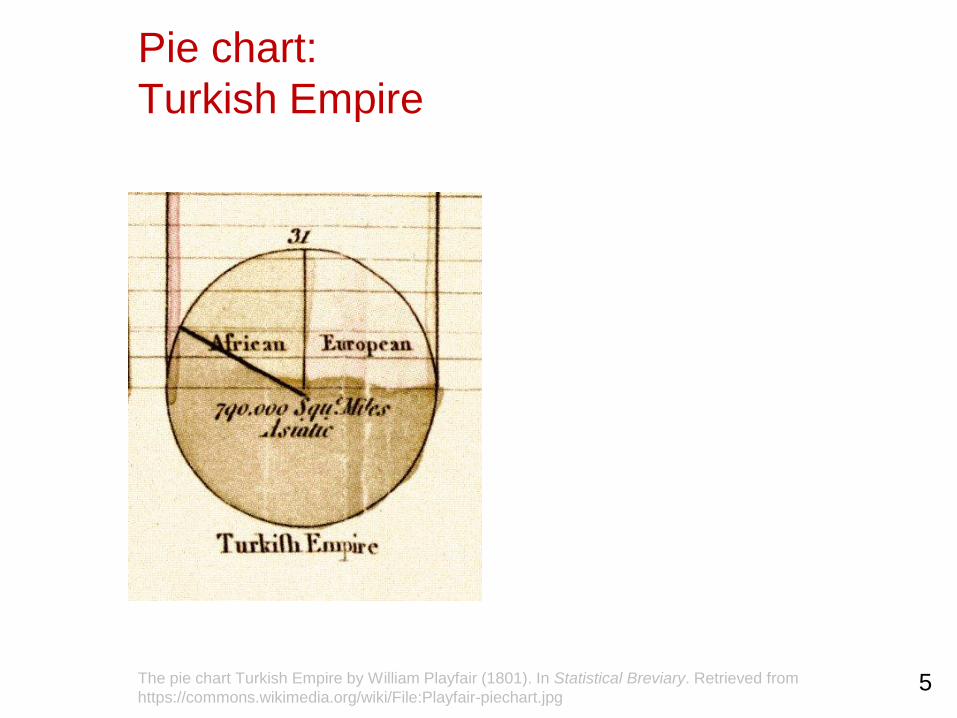
Pie chart:
Turkish Empire
5The pie chart Turkish Empire by William Playfair (1801). In Statistical Breviary. Retrieved from
https://commons.wikimedia.org/wiki/File:Playfair-piechart.jpg

Disease dot map:
Cholera in London
Variant of cholera map by John Snow (1854). In Wikimedia Commons, Retrieved from
https://commons.wikimedia.org/wiki/File:Snow-cholera-map.jpg6
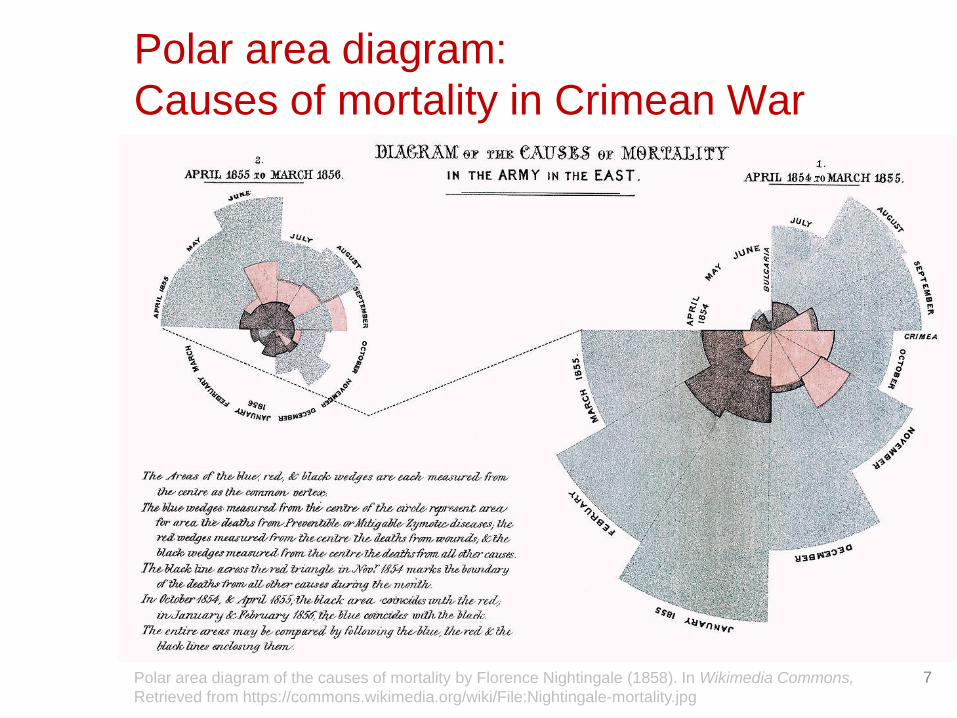
Polar area diagram:
Causes of mortality in Crimean War
Polar area diagram of the causes of mortality by Florence Nightingale (1858). In Wikimedia Commons,
Retrieved from https://commons.wikimedia.org/wiki/File:Nightingale-mortality.jpg
7

Flow map:
Napoleon's March on Moscow
8
By Charles Minard (1869). In Wikimedia Commons, Retrieved from https://commons.wikimedia.org/wiki/File%3AMinard.png

Role of design:
London Underground map
9By Henry C. Beck (1933). In Wikipedia, Retrieved from
https://en.wikipedia.org/wiki/File:Beck_Map_1933.jpg
Long list of other contributors
Baron Pierre Charles Dupin (1826): Choropleth map
Charles Joseph Minard (1861): Map with diagrams
Francis Amasa Walker (1874): Population pyramid
Michael George Mulhall (1884): Pictograms
Karl Pearson (1892)(?): Histogram
John W. Tukey (1969): Stem-and-leaf, box-and-whisker plots…
10Friendly, M. & Denis, D. J. (2001). Milestones in the history of thematic cartography, statistical graphics,
and data visualization. Retrieved on May 12, 2017 from http://datavis.ca/milestones/
Basics of visual processing
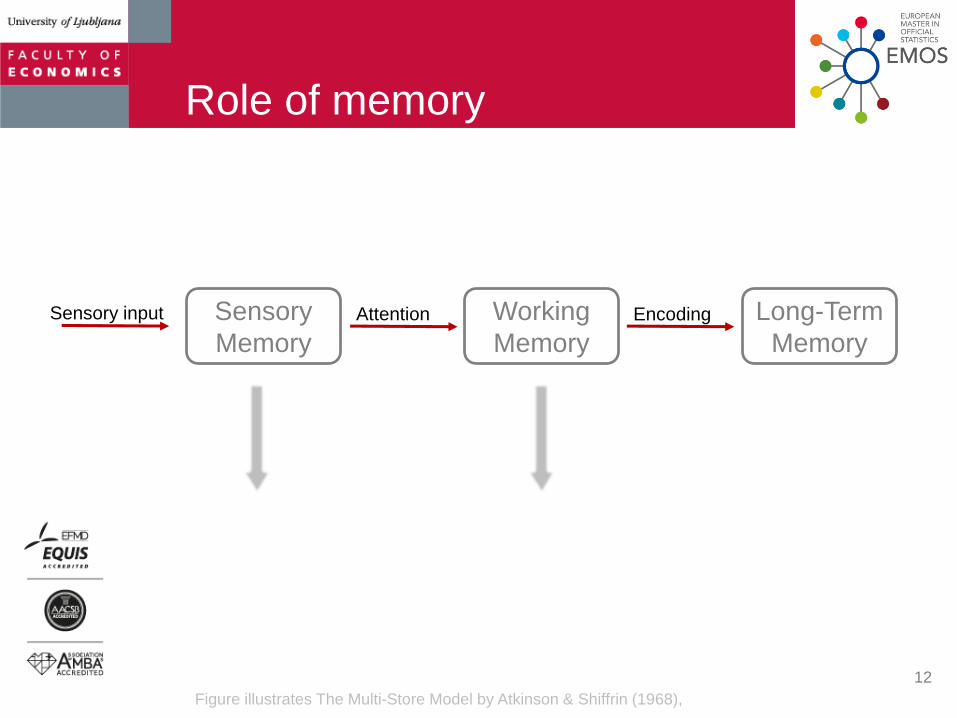
Role of memory
12
Sensory
Memory
Working
Memory
Long-Term
Memory
Sensory input Attention Encoding
Figure illustrates The Multi-Store Model by Atkinson & Shiffrin (1968),

Preattentive attributes
13
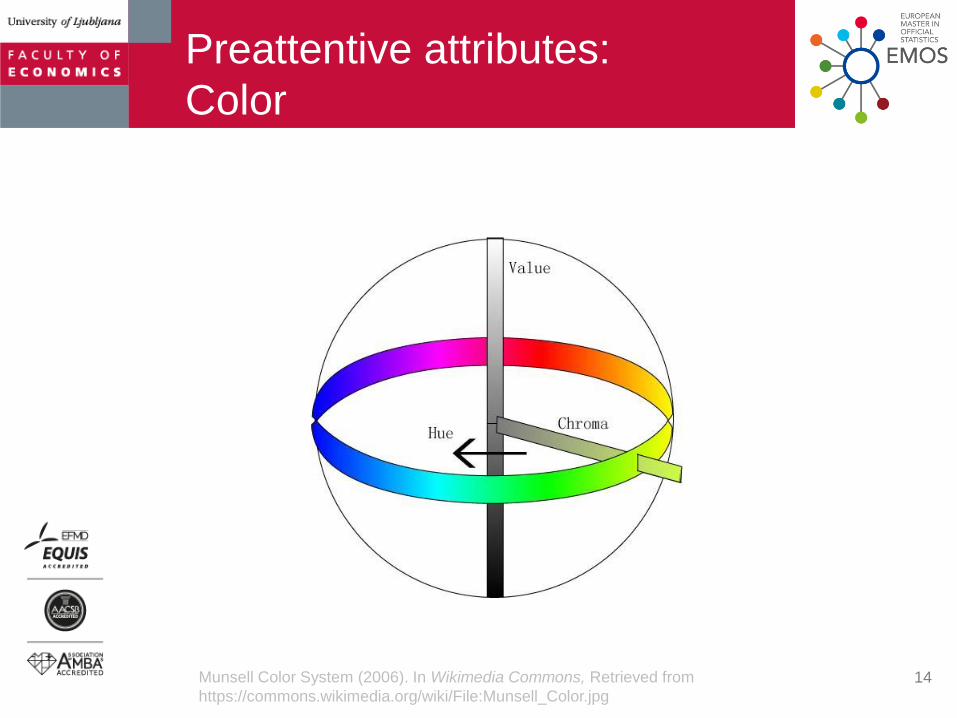
Preattentive attributes:
Color
14Munsell Color System (2006). In Wikimedia Commons, Retrieved from
https://commons.wikimedia.org/wiki/File:Munsell_Color.jpg
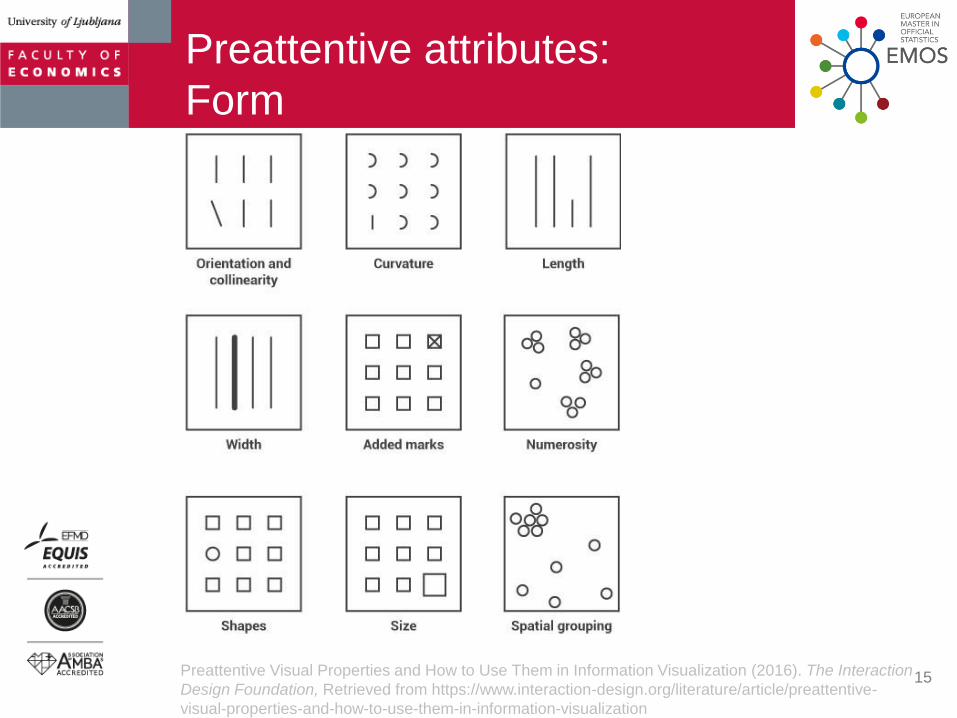
Preattentive attributes:
Form
15Preattentive Visual Properties and How to Use Them in Information Visualization (2016). The Interaction
Design Foundation, Retrieved from https://www.interaction-design.org/literature/article/preattentive-
visual-properties-and-how-to-use-them-in-information-visualization
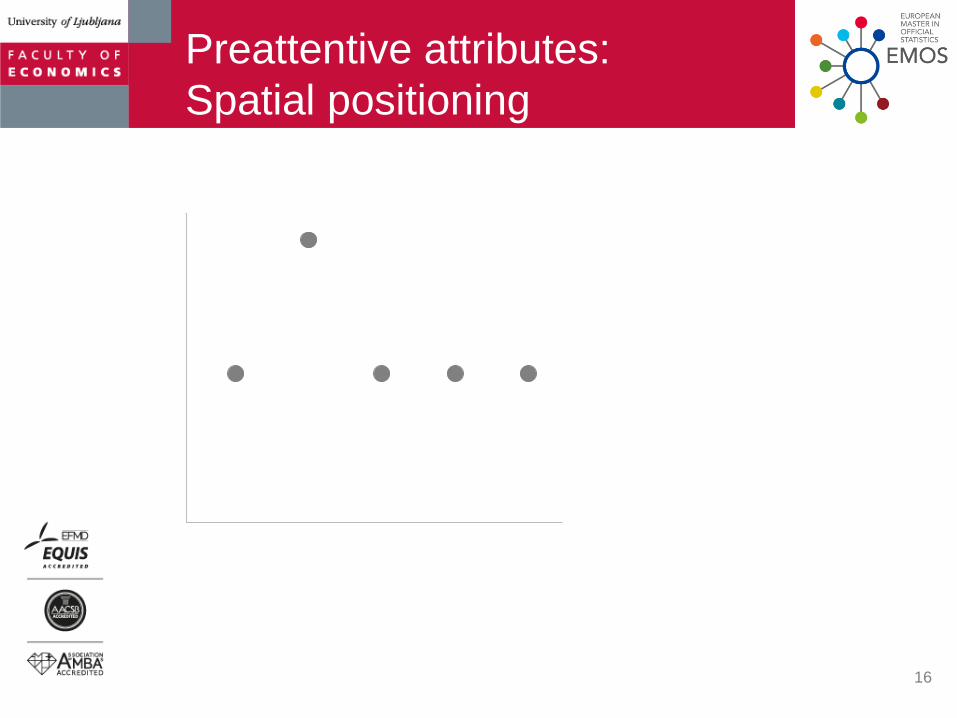
Preattentive attributes:
Spatial positioning
16

Gestalt principles
17

Gestalt principles:
Proximity
18Gestalt Proximity (2008). In Wikimedia Commons, Retrieved from
https://commons.wikimedia.org/wiki/File:Gestalt_proximity.svg

Gestalt principles:
Similarity
19Gestalt Similarity (2008). In Wikimedia Commons, Retrieved from
https://commons.wikimedia.org/wiki/File:Gestalt_similarity.svg
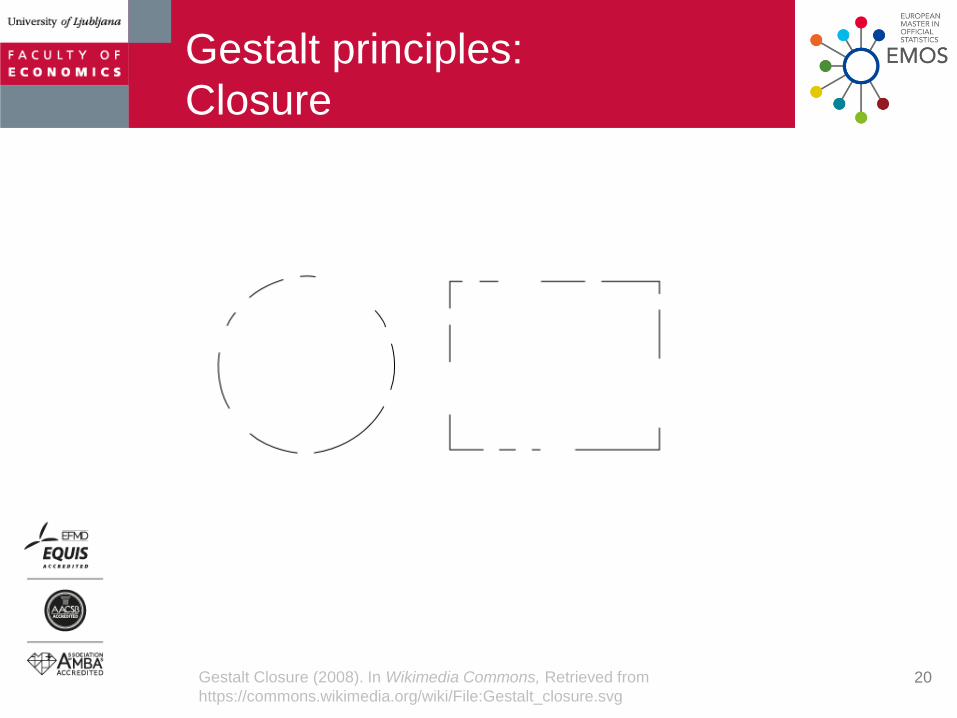
Gestalt principles:
Closure
20Gestalt Closure (2008). In Wikimedia Commons, Retrieved from
https://commons.wikimedia.org/wiki/File:Gestalt_closure.svg
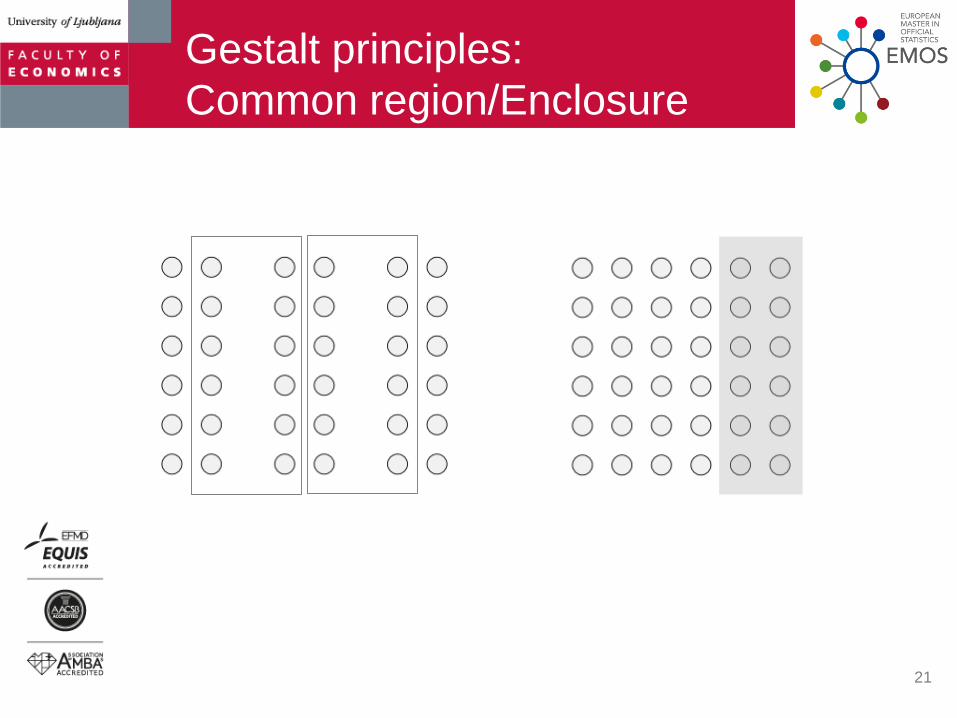
Gestalt principles:
Common region/Enclosure
21
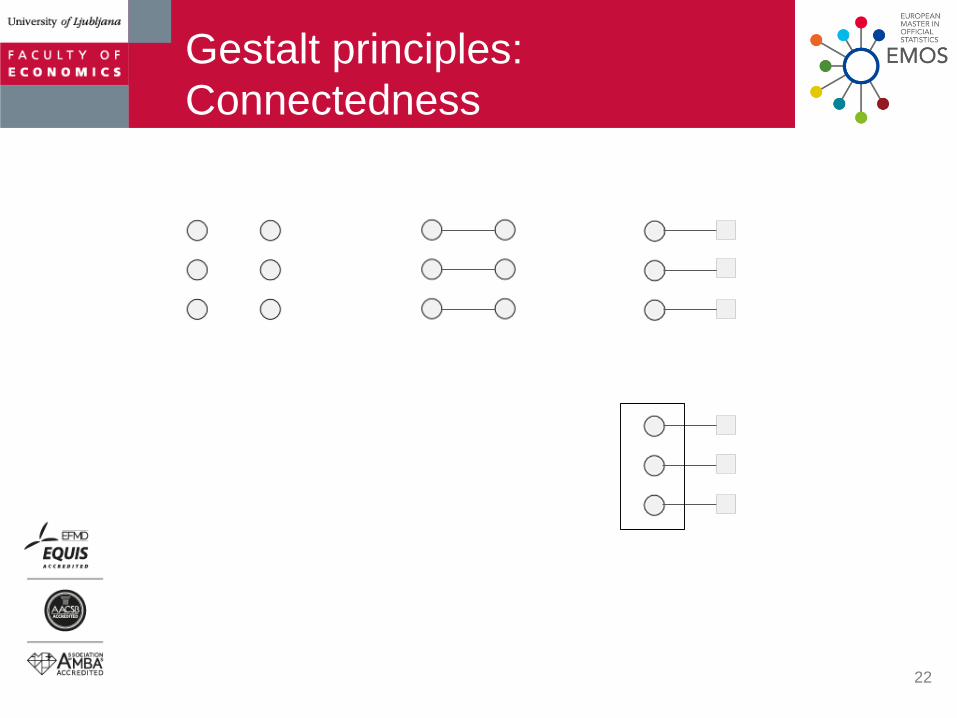
Gestalt principles:
Connectedness
22

Gestalt principles:
Continuity
23Dejan Todorovic (2008) Gestalt principles. Scholarpedia, 3(12):5345., revision #91314,
Retrieved from http://www.scholarpedia.org/article/Gestalt_principles

Gestalt principles:
Good Gestalt
24Dejan Todorovic (2008) Gestalt principles. Scholarpedia, 3(12):5345., revision #91314,
Retrieved from http://www.scholarpedia.org/article/Gestalt_principles

Gestalt principles:
Good Gestalt
25Dejan Todorovic (2008) Gestalt principles. Scholarpedia, 3(12):5345., revision #91314,
Retrieved from http://www.scholarpedia.org/article/Gestalt_principles
Visual representation of
statistical data and perception

Theory of graphic symbols by
Jacques Bertin
27
Basic visual units (marks): point, line, area.
Visual variables:
• position (position),
• size (taille),
• shape (forme),
• color (couleur),
• brightness (valeur),
• orientation (orientation),
• granularity (grain).
Jacques Bertin in Sémiologie graphique (1967)
Other visual variables:
• hue
• saturation
• resolution
• crispness
• transparency
• motion

Hans Rosling: Gapminder.org
& Moving bubble chart
28

Perception of graphical
elements
Weber. If difference between two lines is relatively
• large easy to detect
• small hard to detect
Stevens. Bias in judgments
length < area < volume
Cleveland. Perception tasks of decoding quantitative variables
from most to least accurate:
Position
Length
Angle, Slope
Area
Volume
Color
29

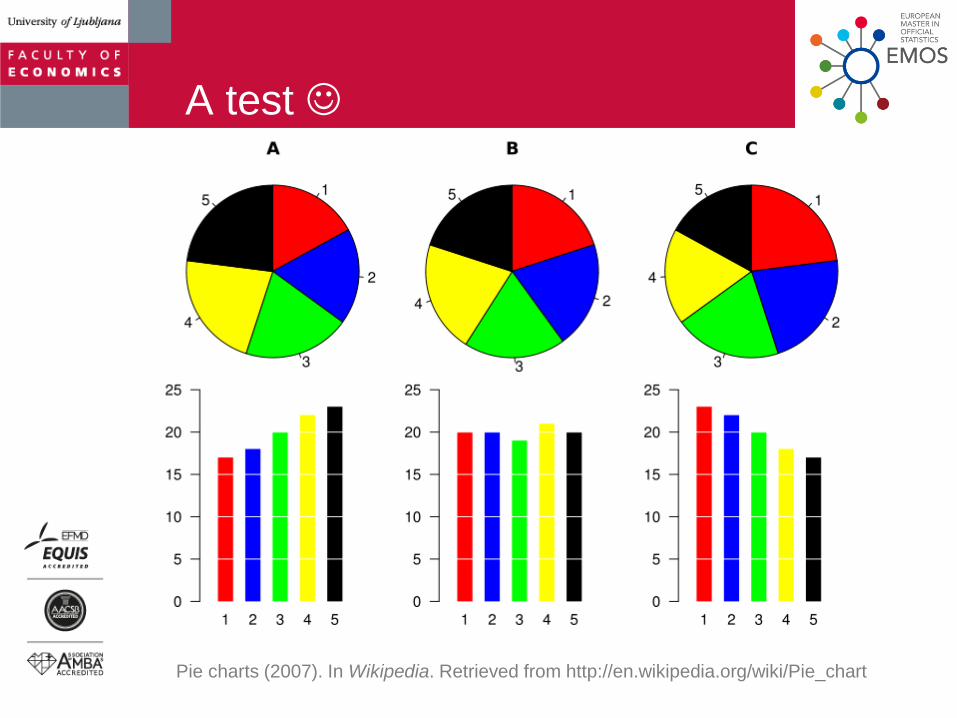
A test
I‘ll show you three pie charts.
Order the slices of each pie chart
by size from the largest to the smallest.
Pie charts (2007). In Wikipedia. Retrieved from http://en.wikipedia.org/wiki/Pie_chart
A test
Pie charts (2007). In Wikipedia. Retrieved from http://en.wikipedia.org/wiki/Pie_chart
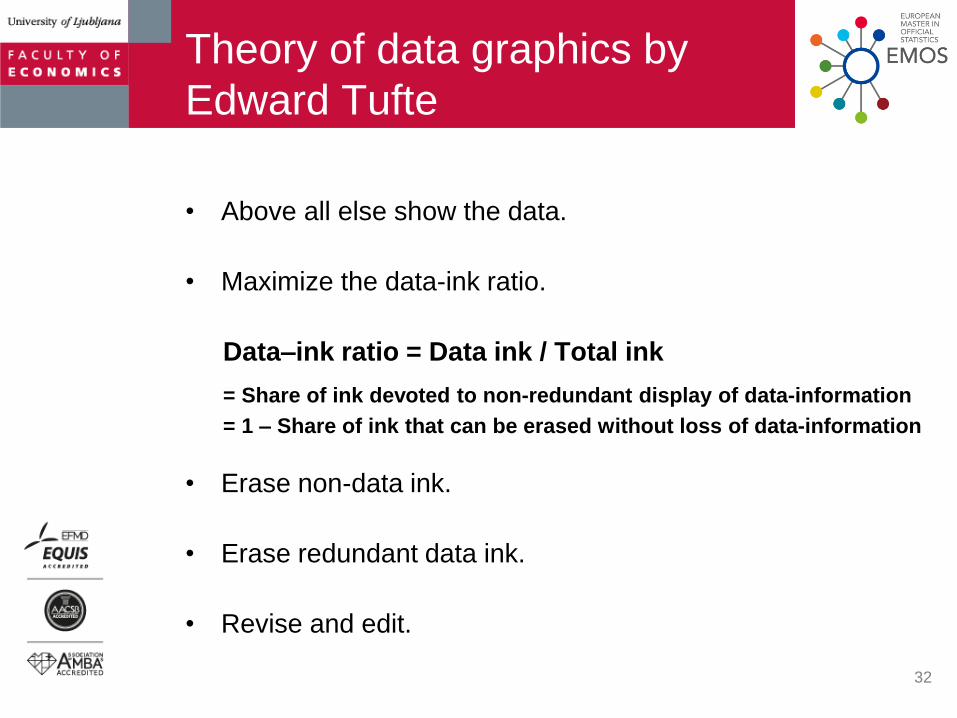
Theory of data graphics by
Edward Tufte
• Above all else show the data.
• Maximize the data-ink ratio.
Data–ink ratio = Data ink / Total ink
= Share of ink devoted to non-redundant display of data-information
= 1 – Share of ink that can be erased without loss of data-information
• Erase non-data ink.
• Erase redundant data ink.
• Revise and edit.
32
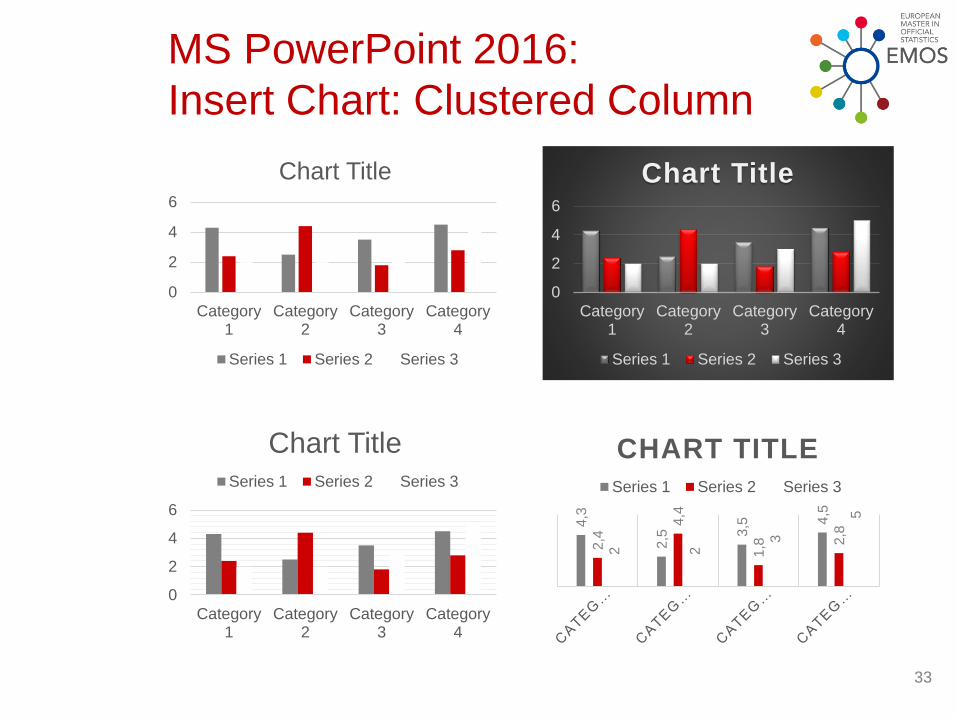
MS PowerPoint 2016:
Insert Chart: Clustered Column
33
0
2
4
6
Category1
Category2
Category3
Category4
Chart Title
Series 1 Series 2 Series 3
0
2
4
6
Category1
Category2
Category3
Category4
Chart TitleSeries 1 Series 2 Series 3
4,3
2,5 3
,5 4,5
2,4
4,4
1,8 2
,8
2 2
3
5
CHART TITLE
Series 1 Series 2 Series 3
0
2
4
6
Category1
Category2
Category3
Category4
Chart Title
Series 1 Series 2 Series 3
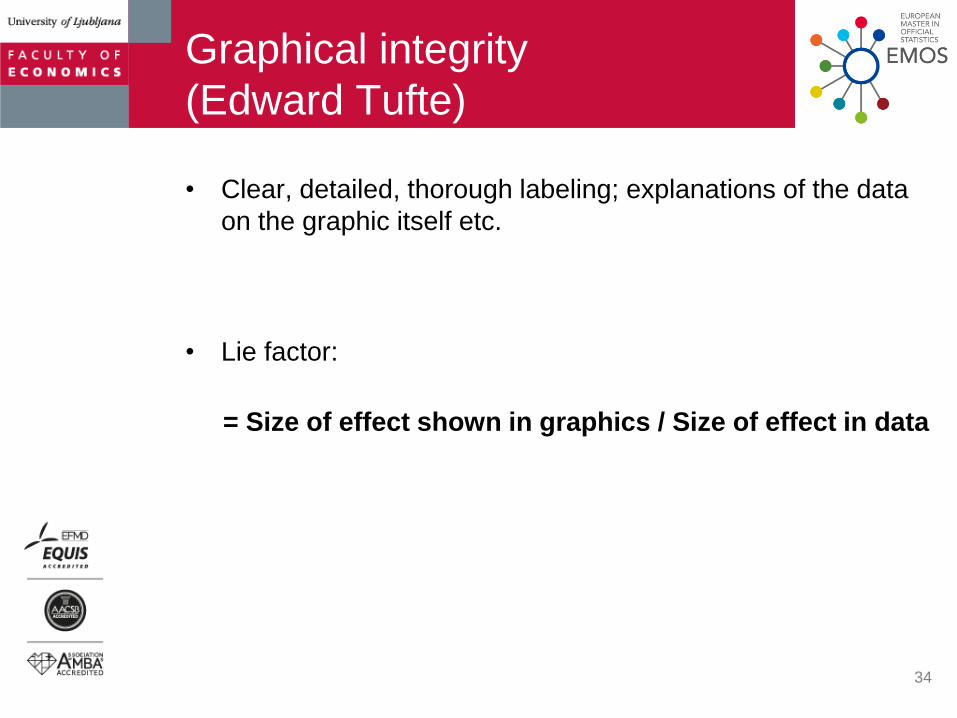
Graphical integrity
(Edward Tufte)
• Clear, detailed, thorough labeling; explanations of the data
on the graphic itself etc.
• Lie factor:
= Size of effect shown in graphics / Size of effect in data
34
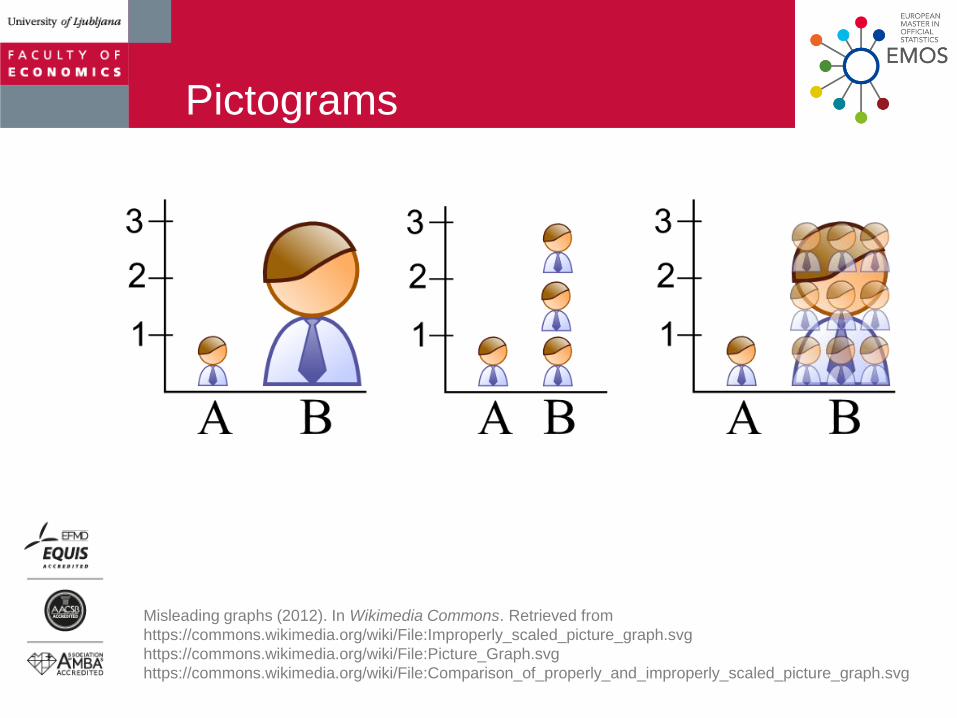
Pictograms
Misleading graphs (2012). In Wikimedia Commons. Retrieved from
https://commons.wikimedia.org/wiki/File:Improperly_scaled_picture_graph.svg
https://commons.wikimedia.org/wiki/File:Picture_Graph.svg
https://commons.wikimedia.org/wiki/File:Comparison_of_properly_and_improperly_scaled_picture_graph.svg
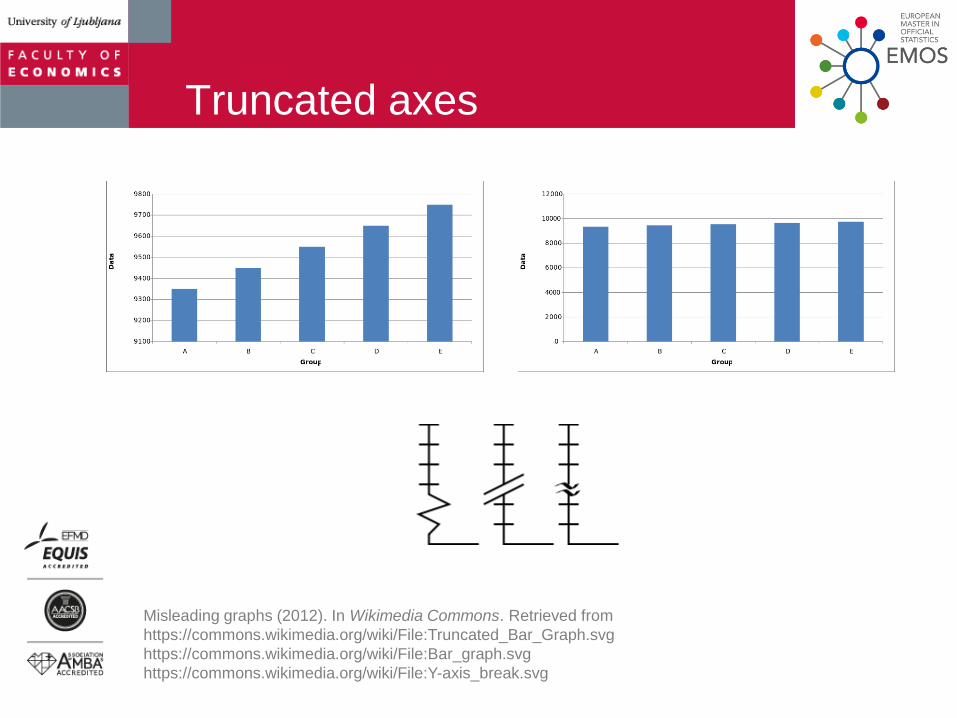
Truncated axes
Misleading graphs (2012). In Wikimedia Commons. Retrieved from
https://commons.wikimedia.org/wiki/File:Truncated_Bar_Graph.svg
https://commons.wikimedia.org/wiki/File:Bar_graph.svg
https://commons.wikimedia.org/wiki/File:Y-axis_break.svg

Role of visualization in official
statistics
European Statistics
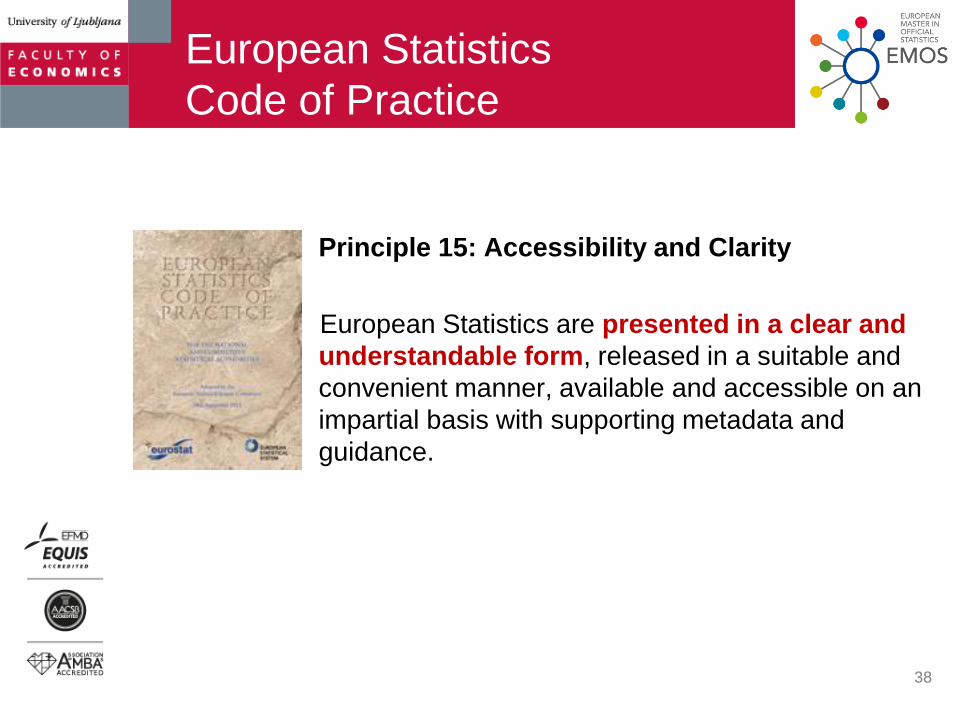
Code of Practice
Principle 15: Accessibility and Clarity
European Statistics are presented in a clear and
understandable form, released in a suitable and
convenient manner, available and accessible on an
impartial basis with supporting metadata and
guidance.
38

Generic Statistical Business
Process Model (GSBPM)
UNECE (2013). The Generic Statistical Business Process Model. v5.0. Retrieved fromhttp://www1.unece.org/stat/platform/display/metis/The+Generic+Statistical+Business+Process+Model

Questionnaire design
Jenkins & Dillman (1995) introduced into survey research
design principles that emphasize visual presentation of
information, e.g.:
• Present survey question + instruction in close proximity
• Deemphasize information that disturbs question-
answering process (e.g. legal basis)
• Use visual elements consistently throughout the
questionnaire
40
Jenkins, C., & Dillman, D. (1995). Towards a Theory of Self-Administered Questionnaire Design.In Survey Measurement and Process Quality by L. Lyberg et al., Wiley. Retrieved fromhttps://www.sesrc.wsu.edu/Dillman/papers/1997/A%20Theory%20of%20Self-Administered%20Questionnaire%20Design.pdf
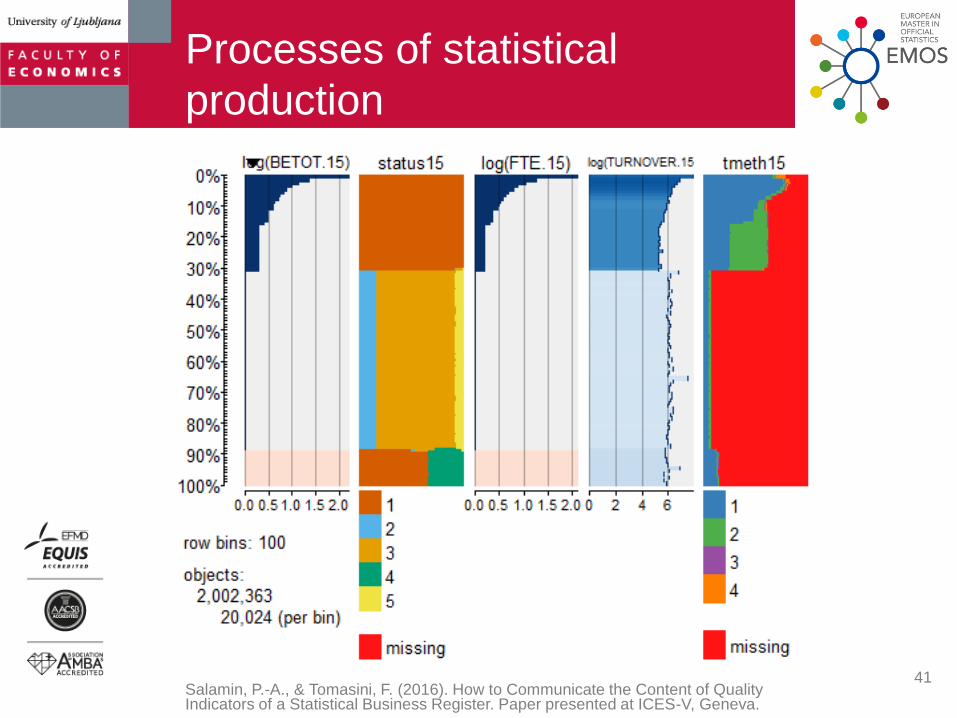
Processes of statistical
production
41Salamin, P.-A., & Tomasini, F. (2016). How to Communicate the Content of Quality Indicators of a Statistical Business Register. Paper presented at ICES-V, Geneva.
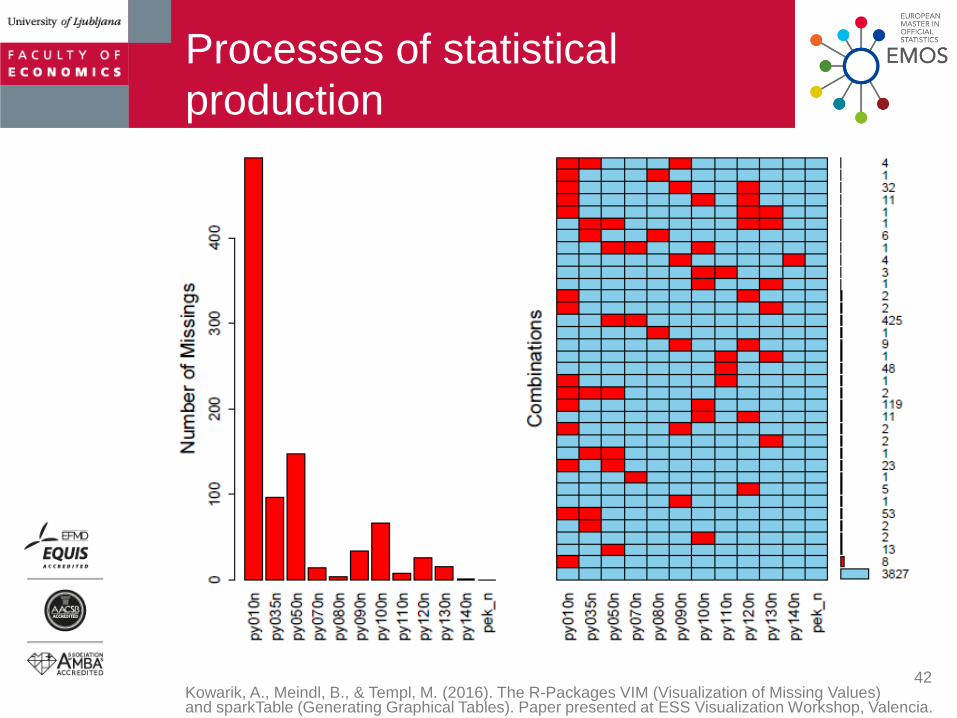
Processes of statistical
production
42Kowarik, A., Meindl, B., & Templ, M. (2016). The R-Packages VIM (Visualization of Missing Values) and sparkTable (Generating Graphical Tables). Paper presented at ESS Visualization Workshop, Valencia.
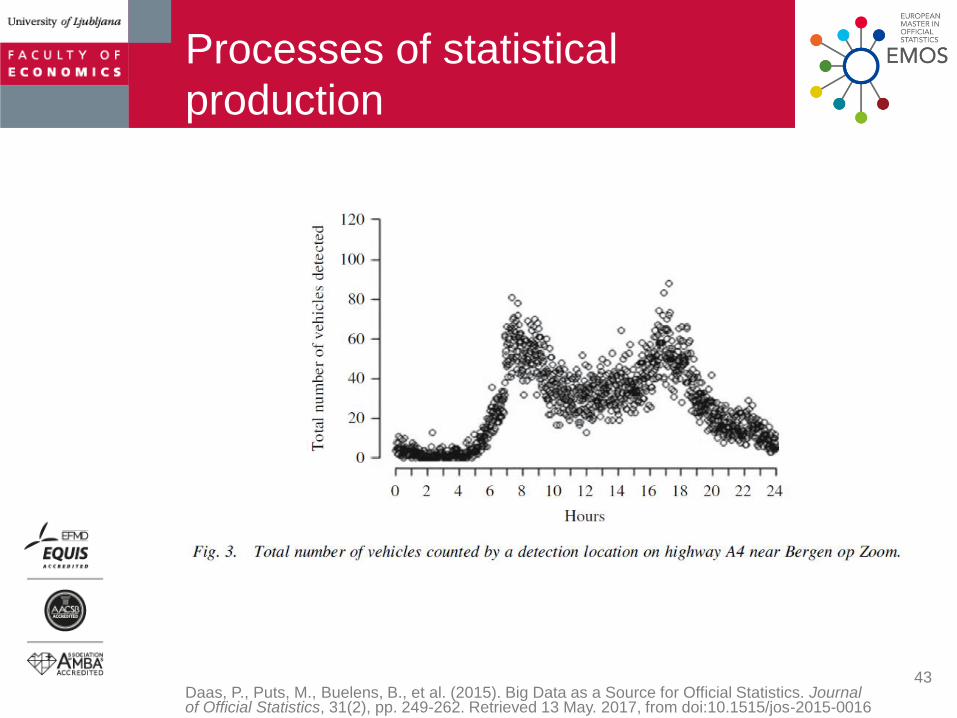
Processes of statistical
production
43Daas, P., Puts, M., Buelens, B., et al. (2015). Big Data as a Source for Official Statistics. Journal of Official Statistics, 31(2), pp. 249-262. Retrieved 13 May. 2017, from doi:10.1515/jos-2015-0016
Data dissemination
Nature of data
User groups & Purpose
Medium
44

Jorge Camoes
excelcharts.com

Color for non-designers:
make it functional, not aesthetic
Manage color stimuli intensity: create layers of meaning with
gray, pale colors and saturated colors
Minimize it, play with gray
Define functional tasks
Categorize
Group
Emphasize
Sequence
Diverge
Alert

05
09
32
07
22
02
16
06
Teacher Training Humanities
Social Sciences Science
Engineering Agriculture
Health Services
Teacher Training
05 Humanities09
Social Sciences
32
Science07
Engineering22
Agriculture02
Health16
Services06
Stimuli intensity
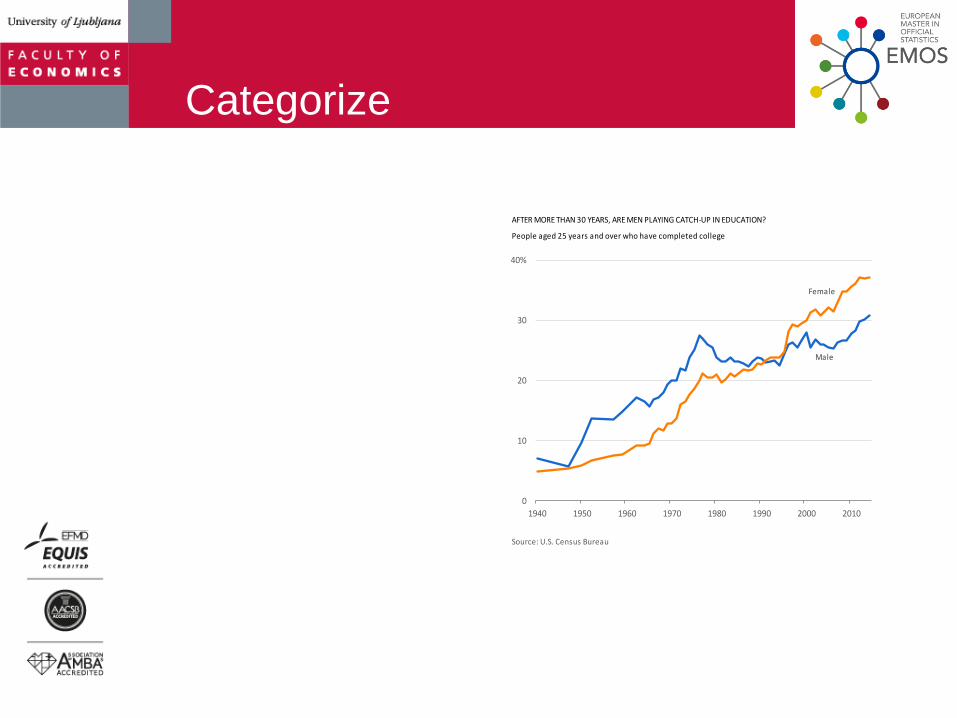
Categorize
AFTER MORE THAN 30 YEARS, ARE MEN PLAYING CATCH-UP IN EDUCATION?
People aged 25 years and over who have completed college
Source: US Census Bureau
Source: U.S. Census Bureau
Male
Female
0
10
20
30
40%
1940 1950 1960 1970 1980 1990 2000 2010
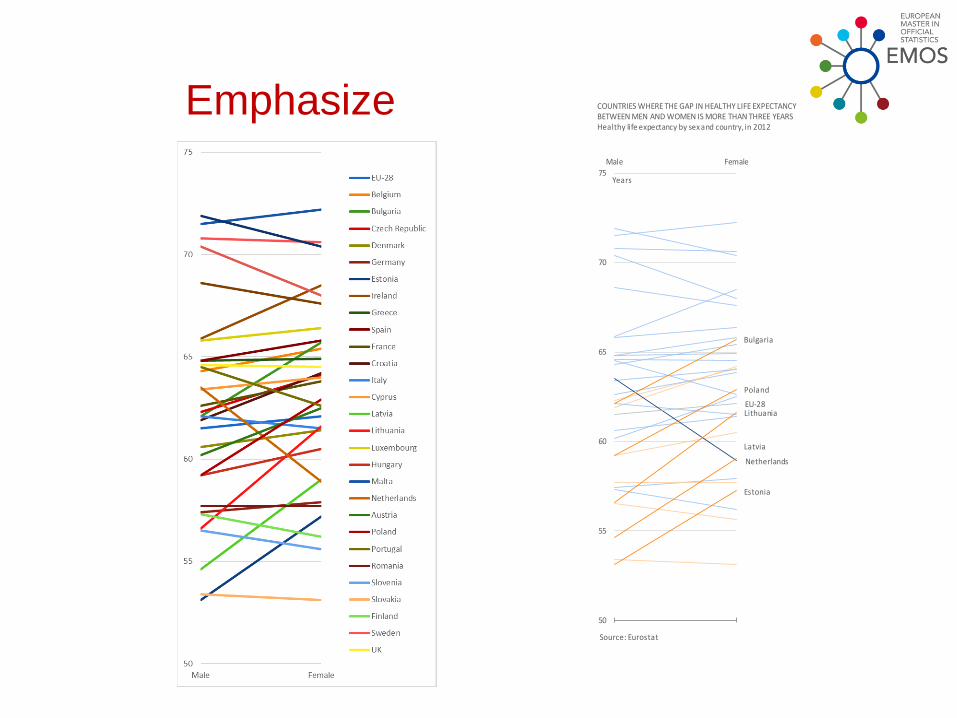
Emphasize
Source: Eurostat
Netherlands
EU-28
Estonia
Bulgaria
Poland
Latvia
Lithuania
50
55
60
65
70
75
Male Female
Years
COUNTRIES WHERE THE GAP IN HEALTHY LIFE EXPECTANCYBETWEEN MEN AND WOMEN IS MORE THAN THREE YEARS Healthy life expectancy by sex and country, in 2012

GroupIN MOST COUNTRIES, WOMEN ENJOY A LONGER AND HEALTHIER LIFE THAN MEN
Large gap in life expectancy at birth in Eastern Europe
Source: Eurostat
Belgium
Bulgaria Czech Rep.
Denmark
Germany
Estonia
Ireland
Greece
Spain
France
CroatiaItaly
Cyprus
Latvia
Lithuania
Luxembourg
Hungary
Malta
Netherlands
Austria
Poland
Portugal
Romania
Slovenia
Slovakia
Finland
Sweden
UK
Iceland
Norway
Switzerland
EU-28
50
55
60
65
70
75
65 70 75 80 85 90
Healthy life expectancy(years)
Life expectancy at birth (years)
WomenMen
Men have both lower life expectancy and lowerhealthy life expectancy.
Men have lower life expectancy but higher healthy life expectancy.
Eastern Europe
Western Europe

Sequence
LESS IN FOOD, MORE IN HOUSING: CHANGES IN EXPENDITURE IN SPAIN
Proportion of household expenditure per category and income quintile
1988 2010
Source: Eurostat
Q5Q4
Q3Q2
Q1
0 20 40%
Food and non-alcoholic beverages
Alcoholic beverages, tobacco, and narcotics
Clothing and footwear
Housing, water, electricity, gas,and other fuels
Furnishings, householdequipment, and routinehousehold maintenance
Health
Transport
Communications
Recreationand culture
Education
Restaurantsand hotels
Miscellaneousgoods and services
higher income
lower income
0 20 40%
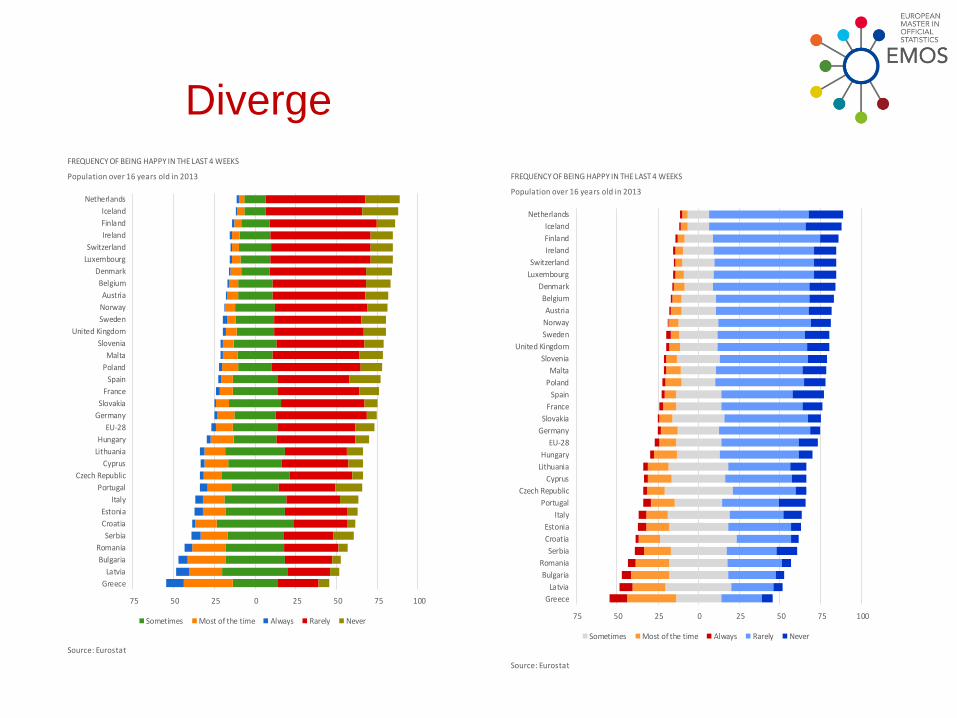
Diverge
FREQUENCY OF BEING HAPPY IN THE LAST 4 WEEKS
Population over 16 years old in 2013
Source: Eurostat
75 50 25 0 25 50 75 100
Greece
Latvia
Bulgaria
Romania
Serbia
Croatia
Estonia
Italy
Portugal
Czech Republic
Cyprus
Lithuania
Hungary
EU-28
Germany
Slovakia
France
Spain
Poland
Malta
Slovenia
United Kingdom
Sweden
Norway
Austria
Belgium
Denmark
Luxembourg
Switzerland
Ireland
Finland
Iceland
Netherlands
Sometimes Most of the time Always Rarely Never
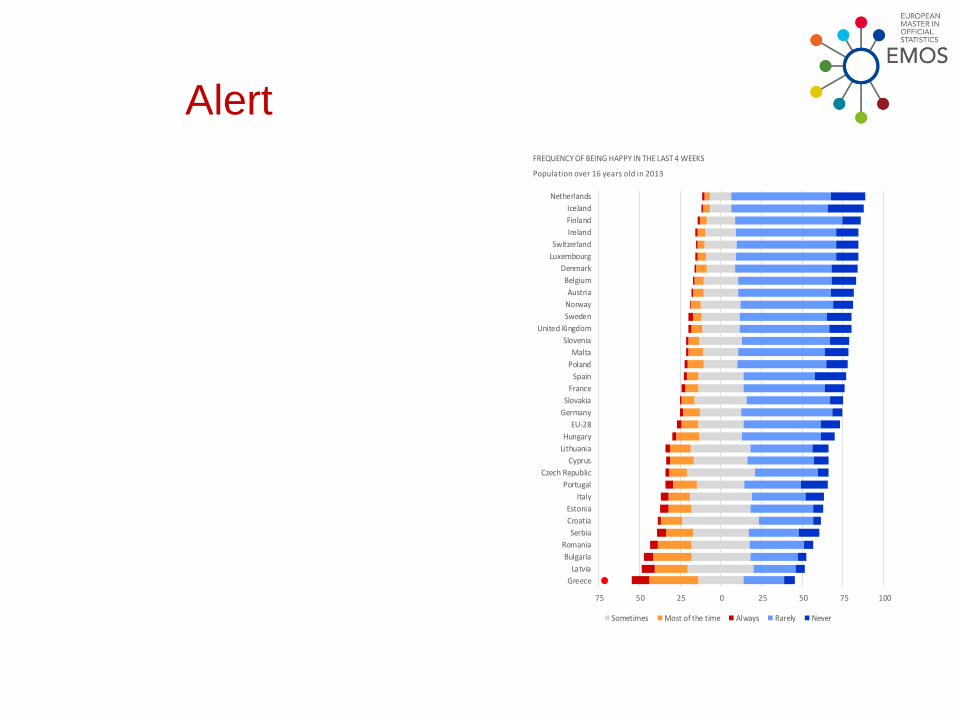
AlertFREQUENCY OF BEING HAPPY IN THE LAST 4 WEEKS
Population over 16 years old in 2013
75 50 25 0 25 50 75 100
Greece
Latvia
Bulgaria
Romania
Serbia
Croatia
Estonia
Italy
Portugal
Czech Republic
Cyprus
Lithuania
Hungary
EU-28
Germany
Slovakia
France
Spain
Poland
Malta
Slovenia
United Kingdom
Sweden
Norway
Austria
Belgium
Denmark
Luxembourg
Switzerland
Ireland
Finland
Iceland
Netherlands
Sometimes Most of the time Always Rarely Never

Play with gray
MAIN REASONS FOR PART-TIME EMPLOYMENT BY SEX
MAIN REASONS FOR PART-TIME EMPLOYMENT BY SEX From 15 to 64 years old, in the European Union (EU-28), in 2014
From 15 to 64 years old, in the European Union (EU-28), in 2014
Source: Eurostat Source: Eurostat
40%
4%
7%
19%
7%
23%
Males
Could not find a full-time job
Looking after children or incapacitated adults
Other family or personal responsibilities
In education or training
Own illness or disability
Other reasons
Other reasons; 20,6
Own illness or disability; 3,4
In education or training; 7,5
Could not find a full-time job; 26,3
Other family or personal responsibilities; 15,1
Looking after children or incapacitated adults; 27,1
0
15
30
45%
Males Females
Could not find a full-time job
26%
Looking after children or
incapacitated adults27%
Other family or personal
responsibilities15%
In education or training
8%
Own illness or disability
3%
Other reasons
21%
Females
No need for color Use gray for context
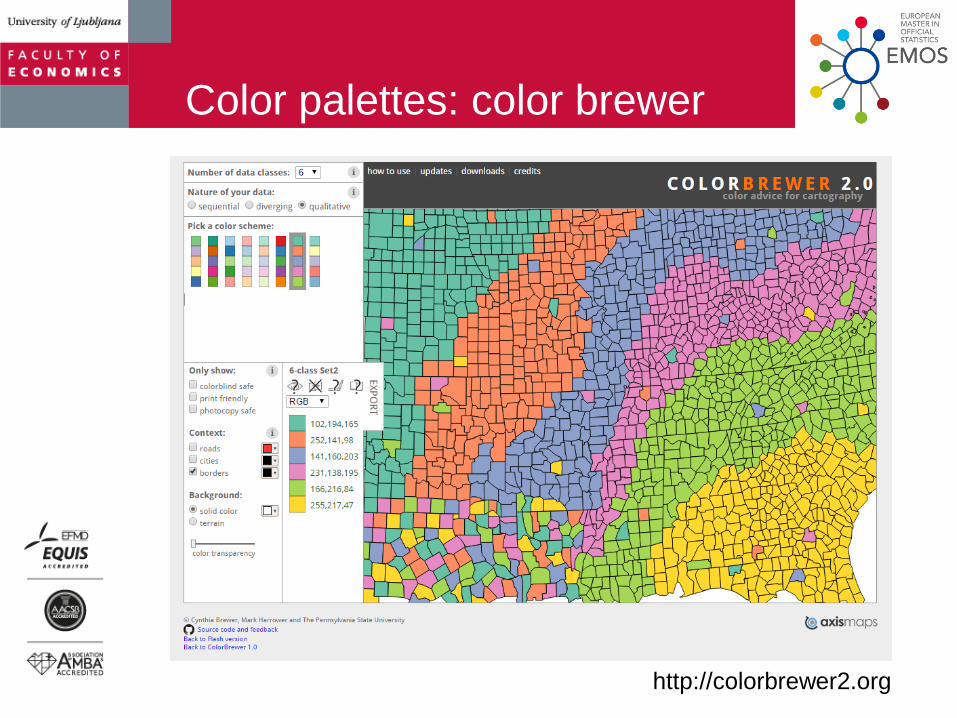
Color palettes: color brewer
http://colorbrewer2.org

Questions?
56
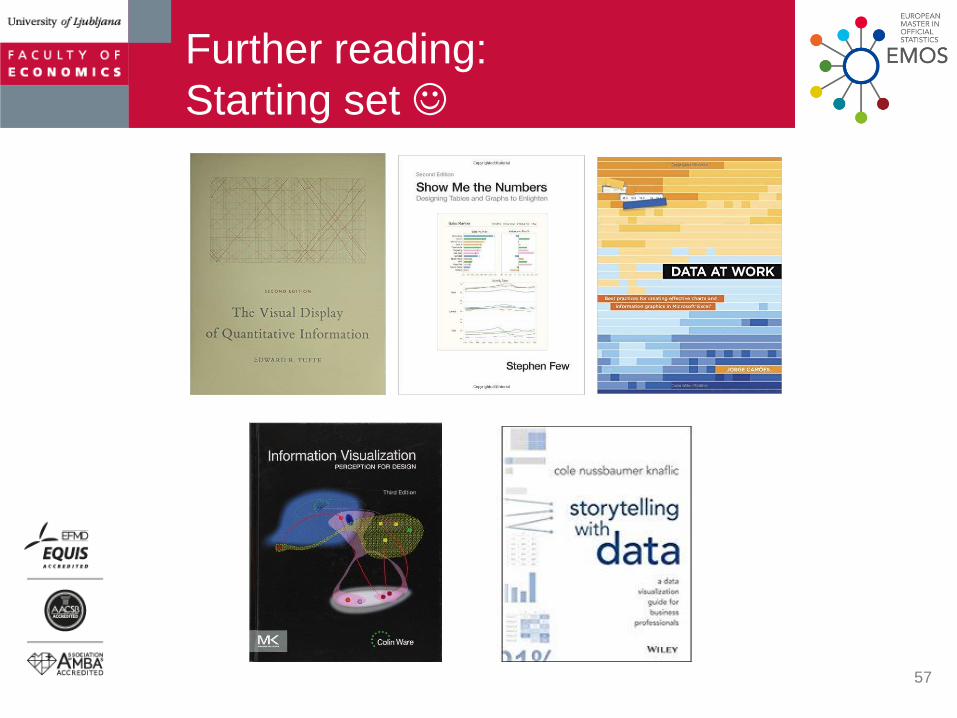
Further reading:
Starting set
57