resources prima group limited - links.sgx.com · continues to closely monitor the situation in this...
TRANSCRIPT

Page 1 of 27
This announcement has been prepared by the Company and its contents have been reviewed by the Company’s sponsor, SAC Capital Private Limited (the “Sponsor”), for compliance with the relevant rules of the Singapore Exchange Securities Trading Limited (“Exchange”). The Sponsor has not independently verified the contents of this announcement.
This announcement has not been examined or approved by the Exchange and the Exchange assumes no responsibility for the contents of this announcement, including the correctness of any of the statements or opinions made, or reports contained in this announcement.
The contact person for the Sponsor is Ms Tay Sim Yee, at 1 Robinson Road #21-02, AIA Tower, Singapore 048542, telephone (65) 6532-3829. Unaudited Full Year Financial Statements for the Financial Year Ended 31 December 2017
INTRODUCTION Resources Prima Group Limited (the “Company”, and together with its subsidiaries, the “Group”) makes reference to its announcement dated 11 May 2018, Update Pursuant to Catalist Rule 704(22), and provides the following update.
(A) Bankruptcy proceedings – PT Rinjani Kartanegara (“Rinjani”) Please refer to the announcements dated 22 January 2018 in relation to the update pursuant to Rule 704(22) of the Catalist Rules (“January 2018 monthly update”) and dated 6 April 2018 for updates on this matter. The Group continues to monitor the bankruptcy process and will update the shareholders should the Group be aware of any significant development in respect of the bankruptcy proceedings of Rinjani.
(B) State of negotiations between the Company and its principal bankers or trustee
The Company currently has no credit lines or facilities with its bankers or trustee.
(C) Litigation The Company refers to its announcement dated 9 February 2018 and advises that the Group’s subsidiary, PT Pilar Mas Utama Perkasa (“Pilar Mas”), received a notice dated 24 January 2018 from the State Court of West Jakarta, Indonesia (the “Notice”) in relation to a statement of claim filed by a former shareholder of PT Rinjani Kartanegara (“Rinjani”), being Ruznie Oms., S.H. M.Hum (“Ruznie”). The statement of claim is filed against, Pilar Mas, Agus Sugiono, the Group’s Executive Chairman and Chief Executive Officer (“Defendant II”), Rinjani (“Defendant III”), Nordiansyah Nasrie, the Group’s Chief Operating Officer (“Defendant IV”) and other third parties (collectively, the “Defendants”). The statement of claim against the Defendants, claims, inter alia, losses arising from events and transactions pertaining to the sale and purchase of Rinjani’s shares from its original shareholders prior to the reverse takeover back in 2014, one of which being Ruznie. The amount being claimed of Rp665 billion (approximately US$50 million), represents, amongst others, Ruznie’s loss of rights from the sale of Rinjani’s shares and loss of opportunity to profit from the sale of Rinjani coal. The Company in conjunction with Pilar Mas, the Defendants II and IV is seeking additional professional advice on the merits of the claim and will make further announcements on the matter as necessary.
Resources Prima Group Limited (Company Registration No: 198602949M)

Page 2 of 27
Other than as set out above, the Company has not been or is not a party in any other legal proceedings. As previously announced, with effect from 9 October 2017, all litigation matters and decisions with respect to the legal proceedings against Rinjani will be handled by the curators appointed by the Commercial Court Jakarta.
(D) Group’s future direction and other material developments that may have a significant impact on
the Group’s financial situation Ongoing Operations: As previously announced, EIR recommenced coal hauling operations in October 2017, prior to the contracted start date of 1 November 2017, under a coal hauling service agreement with PT Coalindo Adhi Nusantara (“CAN”). Commencement of coal hauling operations prior to the contracted start date was at the request of CAN. For the month of April 2018, EIR’s coal hauling activities under the coal hauling service agreement with CAN continued to be adversely affected by the ongoing heavy rainfall and the poor condition of the coal hauling road, as it is not an “all-weather” road and therefore easily damaged, resulting in lesser trips made by EIR’s trucks during the wet season. These factors have resulted in a substantial decrease in the quantities of coal obtained from CAN’s operations. As a result of the above, the actual coal hauled by EIR for April 2018 amounted to 25,599 tonnes. The average quantity of coal hauled of 32,206 tonnes per month for the 6-months November 2017 through April 2018 is significantly less than the 100,000 tonnes per month as set out in the Company’s announcement dated 6 October 2017. Management has taken the various steps set out in the announcement dated 22 January 2018 to address the situation noted above, including inter alia: 1. Renegotiated with CAN for higher rates for the coal hauling services; 2. Identified and resolved certain of the operational issues faced by EIR which are expected to improve
efficiency of the operation; 3. Reviewed EIR’s cost structure and implemented measures to control the cost involved in providing
the coal hauling services to CAN.
In spite of implementing the above steps, the profitability of the coal hauling contract with CAN has not improved due to the substantial difference in the actual quantity of coal hauled from initial expectations. EIR made a loss before tax for April and for the 6-month period (i.e. November 2017 to April 2018). Cashflows for the month of April 2018 were marginally negative due to the low tonnage of coal hauled whereas for the 6-month period (i.e. November 2017 to April 2018) cashflows were positive albeit marginal.
Management continues to work with CAN to try to improve the efficiency of the operations as well as commercial viability of the contract in view of the continued lower quantity hauled. As a result of these efforts and measures implemented (CAN procuring additional pumps for dewatering purposes at the pit, development of an alternative section of the coal hauling road to avoid congestion and minimize road damage and improvements to the jetty access area by strengthening the road condition) and assuming the onset of the dry season, the amount of coal to be hauled in the coming months is expected to be higher than the average quantity of coal hauled from November 2017 to April 2018, but it is still expected to be below 100,000 tonnes per month. Although coal quantities hauled in early May have increased compared to past months there continues to be no assurance that such efforts will be sustained and result in a positive outcome for EIR’s operations and/or for EIR to contribute significantly to the cashflows of the Group. The Management continues to closely monitor the situation in this regard
Cashflow analysis: As a result of the Rinjani situation (including without limitation the loss of control of Rinjani), the Group has been operating under severe cashflow constraints as there was no operating cashflows for the period from July to October 2017. The severe underperformance of the coal hauling agreement with

Page 3 of 27
CAN as set out above has added more uncertainty to the cash flows that can be generated by the Group. The Board also announced on 28 June 2017 that the Board is of the view that the Company is currently unable to demonstrate that it is able to continue as a going concern or reasonably assess its financial position.
Having regard to the above, the Company is currently in advanced discussions with a potential investor/investor group (“Investor”) to provide financing to the Company. The Company is confident that the negotiation of the definitive documentation with the Investor for the provision of financing will be completed in the near term. Upon execution of the definitive documentation with the Investor, there will be more certainty on the cashflows of the Company and the Company can then be expected to continue as a going concern.
In the meantime as announced on 6 April 2018, as an interim measure the Directors and Management of the Company continue not to take any fees/remuneration or to take only nominal salaries until there is more clarity on the Group’s cashflow situation.
(E) Board and board committee changes
Further to the changes and appointments to the Company’s Board and Board Committees noted in the Company’s announcement dated 11 May 2018, the Company will still be unable to meet the minimum number of members under Catalist Rule 704(7) in respect of the ARMC.
Although the Company has endeavoured to fill the vacant position within the 3 months from 13 February 2018, the Company makes reference to the announcement dated 6 April 2018, wherein it advised that due to the Group’s financial position, the independent directors, the executive chairman cum chief executive officer, the executive director, the chief operating officer and the chief financial officer have all agreed not to take any fees or remuneration or to take only nominal salaries until there is more clarity on the Group’s cashflow situation. Hence, it has been challenging for the Group to attract suitable candidates to act as an additional independent director of the Group on the same basis. As such on 11 May 2018 the Company submitted an application to the Singapore Exchange Securities Trading Limited (the “SGX-ST”), for a 6-month extension to 13 November 2018 to fill the vacancy in its ARMC (the “Extension Application”). As announced on 1 June 2018, the SGX-ST has, on 31 May 2018, informed the Company that, based on the information provided to the SGX-ST, it has no objection to granting a 3-month extension, till 10 August 2018 (the “Extension”), to appoint the third committee member.
The Waiver is subject to: a. the Company making an immediate announcement of the Waiver and Extension granted; b. disclosure of the reasons for seeking the Waiver and Extension; and c. disclosure that the Company and/or the Board of Directors are not aware of any material
information (including but not limited to financial information) in respect of the Company which was not formerly disclosed to the investors.
Please refer to the Company’s announcement dated 1 June 2018 for more details. The Company will continue to update shareholders via SGXNET when there are material developments in respect of any matters concerning the Group pursuant to Rule 704(7) of the Catalist Rules.
(F) Application for extension of time to announce the Group’s unaudited financial statements for
the full year ended 31 December 2017, hold the Company’s annual general meeting in respect of the financial year ended 31 December 2017 and announce the Group’s unaudited financial statements for the first quarter ended 31 March 2018.
On 23 February 2018 the Company announced, that the Company has, through its sponsor, made an application to the SGX-ST for a 6-month extension to 31 August 2018 to announce its unaudited financial statements for the full year ended 31 December 2017 (“FY2017 Results Announcement”), an extension of 8 months to 31 December 2018 to hold the Company’s annual general meeting (“AGM”) and an extension of 5-months to 15 October 2018 to announce the Group’s unaudited financial statements for the first quarter ended 31 March 2018 (“1QFY2018 Results Announcement”) (the

Page 4 of 27
“Extension Application”).
On 29 March 2018, the Company further announced that it was informed by the SGX-ST that the SGX-ST has no objection to granting, subject to the fulfilment of certain conditions (as disclosed in the announcement made on 29 March 2018), a shorter extension period than as stated in the Extension Application being: a. a 3-month extension, till 31 May 2018, to announce its FY2017 Results Announcement; b. a 4-month extension, till 31 August 2018, to hold its AGM for FY2017; and c. a 2.5-month extension, till 31 July 2018 to announce its 1QFY2018 Results Announcement. Further to 3-month extension, till 31 May 2018, to announce its FY2017 Results Announcement as granted by SGX-ST the Company makes reference to its announcement dated 1 June 2018 wherein the Company announced that it had, through its sponsor, made an application to the SGX-ST for a further 1-week extension to 7 June 2018 (the “Further Extension”) to announce its FY2017 Results Announcement (the “Further Extension Application”). The Company announced on 6 June 2018 that SGX-ST has no objection to granting the Further Extension to the Company. Please refer to the announcement dated 6 June 2018 for further details. The Company is currently working towards the deadlines set by the SGX-ST and the Further Extension Application and also applied to ACRA for the relevant extension for holding the AGM. Subsequently, on 30 April 2018, the Company announced that on 27 April 2018, it received ACRA’s letter dated 24 April 2018, notifying it that ACRA had granted an extension of time up to 31 August 2018, to hold its AGM for FY2017.
(G) Trading resumption
The Company is working towards submitting a resumption of trading proposal (“RTP”) to the SGX-ST before 28 June 2018 and in this respect, please refer to Note (D) above for details. In view of the above, it is likely that EIR will require more time to stablise its operations prior to the Company submitting a RTP. Accordingly, the Company is expected to submit, an application for an extension of time through the Company’s sponsor to SGX-ST. The Company will continue to update shareholders via SGXNET when there are material developments in respect.
GOING CONCERN As set out in (D) above, the Company is currently in advanced discussions with the Investor to provide financing to the Company. The Company is confident that the negotiation of the definitive documentation with the Investor for the provision of financing will be completed in the near term. Upon execution of the definitive documentation with the Investor, there will be more certainty on the cashflows of the Company and will secure the Company’s and Group’s financial position and ensure it can meet its debts and obligations as they fall due for the 12-month period from 31 December 2017 (the reporting date). In view of the above, the Company has updated its profitability and cashflow analysis for the 12-month period from the reporting date up to 31 December 2018 and the analysis confirms that the Company is able to meet all of its debts and obligations during the forecast period. The Board is therefore of the view that the Company is currently able to demonstrate that it can continue as a going concern and as such the financial statements of the Company and Group for the financial year ended 31 December 2017 have been prepared on a going concern basis. CONSOLIDATED FINANCIAL STATEMENTS – PRESENTATION AND PREPARATION Financial Reporting Standard 110 – Consolidated financial statements (“FRS 110”) establishes the principles for the presentation and preparation of consolidated financial statements when an entity controls one or more other entities. Based on FRS 110 and the Indonesian bankruptcy law, the Company has concluded that it lost its control over PT Rinjani Kartanegara (“Rinjani”), a subsidiary of the Company held through PT Pilar Mas Utama Perkasa (“Pilar Mas”), on 24 August 2017, which was the date: • the application for suspension of payment was approved by the Commercial Court in Jakarta, and • two administrators were appointed by the Commercial Court in Jakarta to administer the affairs of
Rinjani to protect the interest of Rinjani’s creditors. Since the approval of the suspension of payment on 24 August 2017, the Management and Board of

Page 5 of 27
Directors of Rinjani no longer had sole authority to administer or represent Rinjani or exercise any management or ownership decisions over the assets and operations of Rinjani. As such, the Company no longer had control over Rinjani, was no longer entitled to any returns from its investment in Rinjani, and was unable to affect the amount of returns from its investment in Rinjani. Due to the Company’s loss of control over Rinjani and the suspension of operations of RPG Trading Pte. Ltd. (“RPG Trading”) and EIR during the financial period reported herein due to the cessation of coal production from Rinjani, the Company’s fourth quarter and twelve months income statements for the financial years ended 31 December 2017 and 31 December 2016 present the results of Rinjani, RPG Trading and EIR (for the period up to 30 September 2017) as discontinued operations (”Discontinued Operations”) in accordance with ‘FRS 105 – Non Current Assets Held for Sale and Discontinued Operations’. However, following the recommencement of EIR’s operations in October 2017, after entering into a coal hauling service agreement with CAN, EIR’s results for the fourth quarter ended 31 December 2017 are presented under continuing operations (“Continuing Operations”). The results of the Company, Energy Prima Pte Ltd (“Energy Prima”) and Pilar Mas are presented for the financial years ended 31 December 2017 and 31 December 2016 as Continuing Operations. Due to the Company’s loss of control of Rinjani on 24 August 2017, the entire assets and liabilities of Rinjani at 31 December 2016 are deconsolidated and presented in the income statement for the financial year ended 31 December 2017 under “(Loss)/profit from Discontinued Operations” in accordance with FRS105. Results Announcement – Abbreviations For ease of reference, the following abbreviations are used in this announcement: • “12MFY2017”: The 12-month period ended 31 December 2017 of the financial year ended 31
December 2017; • “12MFY2016”: The 12-month period ended 31 December 2016 of the financial year ended 31
December 2016 (re-presented); • “4QFY2017”: The 3 months (fourth quarter) of the financial year ended 31 December 2017; and • “4QFY2016”: The 3 months (fourth quarter) of the financial year ended 31 December 2016 (re-
presented).
[This section is intentionally left blank]

Page 6 of 27
PART 1 – INFORMATION REQUIRED FOR ANNOUNCEMENTS OF QUARTERLY (Q1, Q2 & Q3), HALF-YEAR AND FULL YEAR RESULTS 1(a)(i) Income statement and statement of comprehensive income, or a statement of comprehensive income
for the group together with a comparative statement for the – corresponding period of immediately preceding year
INCOME STATEMENT
Group 3 months 3 months 12 months 12 months ended ended Inc/ ended ended Inc/ 31.12.17 31.12.16 (Dec) 31.12.17 31.12.16 (Dec) US$’000 US$’000
(Re-presented) % US$’000 US$’000
(Re-presented) % Ref
Continuing Operations Revenue 275 - N.M. 275 - N.M. 8.1.1 Cost of goods sold (291) - N.M. (291) - N.M. 8.1.2 Gross loss (16) - (16) - 8.1.3 Other (expenses)/income (897) (1,933) (53.6) 497 (70) N.M. 8.1.4 Selling and distribution
expenses
-
-
-
-
-
-
8.1.5 Administrative expenses (321) (390) (17.7) (1,100) (1,285) (14.4) 8.1.6 Finance costs - 9 N.M. - (38) N.M. 8.1.7 Other expenses - (1) N.M. - (1) N.M. 8.1.8 Loss before tax (1,234) (2,315) (46.7) (619) (1,394) (55.6) Tax expense - (3) N.M. - (3) N.M. 8.1.9 Loss from continuing
operations, net of tax
(1,234)
(2,318)
(46.8)
(619)
(1,397)
(55.7)
Net (loss)/profit from
discontinued operations
(3,548)
120
N.M.
(15,136)
(1,157)
>100.0
8.1.10 Loss for the financial
period/year (4,782) (2,198) >100.0 (15,755) (2,554) >100.0
Other comprehensive income Items that may be reclassified subsequently to profit or loss:
Currency translation differences arising on consolidation
(147)
(664)
(77.8)
562
(228)
N.M.
Items that will not be reclassified subsequently to profit or loss:
Remeasurement of post employee benefits (net of tax)
-
(145)
N.M.
-
(145)
N.M.
Total comprehensive loss for the period/year
(4,929)
(3,007)
63.9
(15,193)
(2,927)
>100.0
Loss attributable to: - Equity holders of the Company (4,773) (1,889) >100.0 (15,571) (1,866) >100.0 - Non-controlling interests (9) (309) (97.1) (184) (688) (73.3) (4,782) (2,198) >100.0 (15,755) (2,554) >100.0 Total comprehensive loss
attributable to:
- Equity holders of the Company (4,920) (2,670) 84.3 (15,009) (2,211) >100.0 - Non-controlling interests (9) (337) (97.3) (184) (716) (74.3) (4,929) (3,007) 63.9 (15,193) (2,927) >100.0
N.M. – Not Meaningful

Page 7 of 27
1(a)(ii) Income/(loss) before tax is stated after charging/(crediting) the following
Group* 3 months 3 months 12 months 12 months ended ended Inc/ ended ended Inc/ 31.12.17 31.12.16 (Dec) 31.12.17 31.12.16 (Dec) US$’000 US$’000 % US$’000 US$’000 % Unrealised foreign currency
exchange loss/(gain)
(1,273)
(434)
>100.0
(1,582)
44
N.M. Depreciation of property, plant and
equipment
71
824
(91.4)
1,633
2,987
(45.3) Amortisation of mining properties - 345 N.M. 1,070 2,278 (53.0) Amortisation of intangible assets - 10 N.M. 27 40 (32.5) Post-employment benefits - 233 N.M. 214 414 (48.3) Provision for mine reclamation and
rehabilitation
-
267
N.M.
119
474
(74.9) Operating lease expenses - 332 N.M. 392 1,099 (64.3) Interest income (2,799) (8) >100.0 (3,680) (28) >100.0 Interest expense - (7) N.M. 1,604 1,131 41.8 Impairment of investment in
subsidiary
2,189
-
N.M.
11,338
-
N.M. Allowance for doubtful account
receivables
4,233
2,174
94.7
23,874
2,174
>100.0 Loss on disposal of property, plant
and equipment
-
-
N.M.
368
-
N.M. Gain on deconsolidation of
subsidiary - - N.M. (18,988) - N.M.
N.M. – Not Meaningful * The balances disclosed above are the total balances respectively for both the continuing and discontinued operations
[This section is intentionally left blank]

Page 8 of 27
(b)(i) Statement of financial position (for the issuer and group), together with a comparative statement as at the end of the immediately preceding financial year.
Group Company As at As at Ref As at As at 31.12.17 31.12.16 31.12.17 31.12.16 US$’000 US$’000 US$’000 US$’000 (Unaudited) (Audited) (Unaudited) (Audited) Non-current assets Property, plant and equipment 705 21,836 8.2.1 - - Investment in subsidiaries - - 8.2.2 - 32,311 Intangible assets - 170 8.2.3 - - Mining properties - 6,765 8.2.4 - - Trade and other receivables - 8,162 8.2.5 - - Deferred tax assets - 1,900 8.2.6 - - 705 38,833 - 32,311 Current assets Available-for-sale investment -* -* -* -* Inventories 51 235 8.2.7 - - Trade and other receivables 129 5,934 8.2.5 50 11,180 Cash and cash equivalents 322 2,299 8.2.8 105 100 502 8,468 155 11,280 Total assets 1,207 47,301 155 43,591 Equity Share capital 100,480 100,480 236,508 236,508 Currency translation reserve (821) (1,383) 8.2.9 (15,835) (18,075) Accumulated losses (99,709) (84,139) (221,248) (175,139) Equity attributable to equity holders of the Company
(50) 14,958 (575) 43,294
Non-controlling interests (195) (4,537) 8.2.10 - - Total equity (245) 10,421 (575) 43,294 Non-current liabilities Trade and other payables - 12,512 8.2.11 - - Post-employment benefits - 1,171 8.2.12 - - Finance lease liabilities - 258 8.2.13 - - Provisions - 1,498 8.2.14 - - - 15,439 - - Current liabilities Trade and other payables 840 20,375 8.2.11 730 297 Finance lease liabilities 99 536 8.2.13 - - Tax payable 513 530 - - 1,452 21,441 730 297 Total liabilities 1,452 36,880 730 297 Net assets (245) 10,421 (575) 43,294 Total equity and liabilities
1,207
47,301
155
43,591
* Below US$1,000.
[This section is intentionally left blank]

Page 9 of 27
1(b)(ii) Aggregate amount of group’s borrowings and debt securities. (a) Amount repayable in one year or less, or on demand
As at 31.12.17 As at 31.12.16 US$’000 US$’000 US$’000 US$’000 Secured Unsecured Secured Unsecured
99 155 536 143 (b) Amount repayable after one year
As at 31.12.17 As at 31.12.16
US$’000 US$’000 US$’000 US$’000 Secured Unsecured Secured Unsecured
- - 258 - (c) Details of any collateral
Certain vehicles (such as coal hauling trucks) with an aggregate carrying amount of US$0.5 million as at 31 December 2017 (31 December 2016: US$2.0 million) are pledged under existing finance lease arrangements.
As at 31 December 2016, fiduciary security over the coal inventory of Rinjani and corporate guarantee by
Pilar Mas were provided as security for the debt owed by Rinjani to a main supplier amounting to approximately US$15 million which is included in trade and other payables of the Group as at 31 December 2016.
[This section is intentionally left blank]
Page 10 of 27
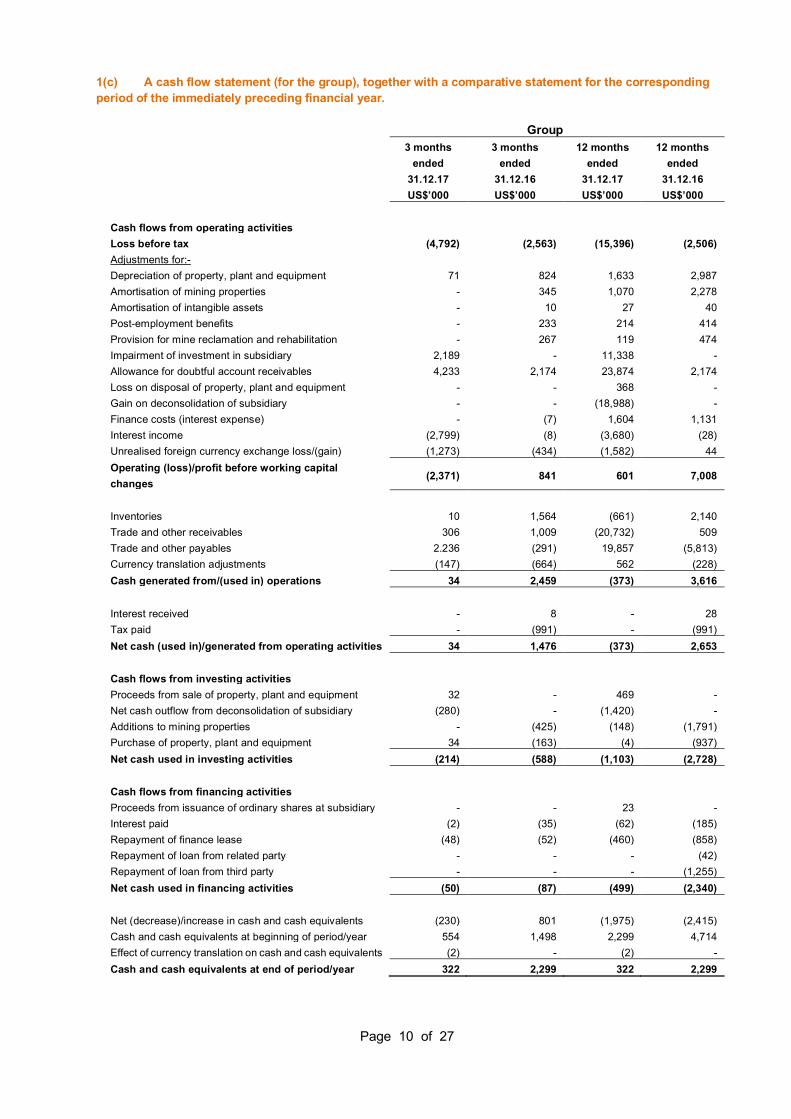
1(c) A cash flow statement (for the group), together with a comparative statement for the corresponding period of the immediately preceding financial year.
Group 3 months 3 months 12 months 12 months ended ended ended ended 31.12.17 31.12.16 31.12.17 31.12.16 US$’000 US$’000 US$’000 US$’000 Cash flows from operating activities Loss before tax (4,792) (2,563) (15,396) (2,506) Adjustments for:- Depreciation of property, plant and equipment 71 824 1,633 2,987 Amortisation of mining properties - 345 1,070 2,278 Amortisation of intangible assets - 10 27 40 Post-employment benefits - 233 214 414 Provision for mine reclamation and rehabilitation - 267 119 474 Impairment of investment in subsidiary 2,189 - 11,338 - Allowance for doubtful account receivables 4,233 2,174 23,874 2,174 Loss on disposal of property, plant and equipment - - 368 - Gain on deconsolidation of subsidiary - - (18,988) - Finance costs (interest expense) - (7) 1,604 1,131 Interest income (2,799) (8) (3,680) (28) Unrealised foreign currency exchange loss/(gain) (1,273) (434) (1,582) 44 Operating (loss)/profit before working capital changes (2,371) 841 601 7,008
Inventories 10 1,564 (661) 2,140 Trade and other receivables 306 1,009 (20,732) 509 Trade and other payables 2.236 (291) 19,857 (5,813) Currency translation adjustments (147) (664) 562 (228) Cash generated from/(used in) operations 34 2,459 (373) 3,616 Interest received - 8 - 28 Tax paid - (991) - (991) Net cash (used in)/generated from operating activities 34 1,476 (373) 2,653 Cash flows from investing activities Proceeds from sale of property, plant and equipment 32 - 469 - Net cash outflow from deconsolidation of subsidiary (280) - (1,420) - Additions to mining properties - (425) (148) (1,791) Purchase of property, plant and equipment 34 (163) (4) (937) Net cash used in investing activities (214) (588) (1,103) (2,728) Cash flows from financing activities Proceeds from issuance of ordinary shares at subsidiary - - 23 - Interest paid (2) (35) (62) (185) Repayment of finance lease (48) (52) (460) (858) Repayment of loan from related party - - - (42) Repayment of loan from third party - - - (1,255) Net cash used in financing activities (50) (87) (499) (2,340) Net (decrease)/increase in cash and cash equivalents (230) 801 (1,975) (2,415) Cash and cash equivalents at beginning of period/year 554 1,498 2,299 4,714 Effect of currency translation on cash and cash equivalents (2) - (2) - Cash and cash equivalents at end of period/year 322 2,299 322 2,299

Page 11 of 27
1(d)(i) A statement (for the issuer and group) showing either (I) all changes in equity or (ii) changes in equity other than those arising from capitalisation
issues and distributions to shareholders, together with a comparative statement for the corresponding period of the immediately preceding financial
year.
Statement of Changes in Equity
Group
Share
capital
US$’000
Currency
translation
reserve
US$’000
Accumulated
losses
US$’000
Equity
attributable to
equity holders of
the Company
US$’000
Non-
controlling
interests
US$’000
Total
equity
US$’000
At 1 January 2016 100,480 (1,155) (82,156) 17,169 (3,821) 13,348
Profit/(loss) for the 3 months ended 31 March 2016 - - 671 671 (29) 642
Other comprehensive income:
- Currency translation differences
-
567
-
567
-
567
Profit/(loss) and total comprehensive income/(loss) for the 3 months ended 31 March 2016
-
567
671
1,238
(29)
1,209
At 31 March 2016 100,480 (588) (81,485) 18,407 (3,850) 14,557
Loss for the 3 months ended 30 June 2016 - - (654) (654) (281) (935)
Other comprehensive income: - Currency translation differences - 18 - 18 - 18 Profit/(loss) and total comprehensive income/(loss) for the 3
months ended 30 June 2016
-
18
(654)
(636)
(281)
(917)
At 30 June 2016 100,480 (570) (82,139) 17,771 (4,131) 13,640
Profit/(loss) for the 3 months ended 30 September 2016 - - 6 6 (69) (63)
Other comprehensive income:
- Currency translation differences - (149) - (149) - (149) Loss and total comprehensive loss for the 3 months ended
30 September 2016
-
(149)
6
(143)
(69)
(212) At 30 September 2016 100,480 (719) (82,133) 17,628 (4,200) 13,428
Profit/(loss) for the 3 months ended 31 December 2016 - - (1,879) (1,879) (337) (2,216) Other comprehensive income: - Remeasurement of employee benefit, net of tax - - (145) (145) - (145) - Currency translation differences - (664) - (664) - (664) Loss and total comprehensive loss for the 3 months ended 31 December 2016 - (664) (2,024) (2,688) (337) (3,025)
Audit adjustment subsequent to full year results announcement - - 18 18 - 18
At 31 December 2016 100,480 (1,383) (84,139) 14,958 (4,537) 10,421

Page 12 of 27
Statement of Changes in Equity (continued)
Group
Share
capital
US$’000
Currency
translation
reserve
US$’000
Accumulated
losses
US$’000
Equity
attributable to
equity holders of
the Company
US$’000
Non-
controlling
interests
US$’000
Total
equity
US$’000
At 1 January 2017
100,480
(1,383)
(84,139)
14,958
(4,537)
10,421
Profit for the 3 months ended 31 March 2017 - - 1,113 1,113 221 1,334
Other comprehensive income:
- Currency translation differences
-
378
-
378
-
378
Profit and total comprehensive income for the 3 months ended 31 March 2017
-
378
1,113
1,491
221
1,712
At 31 March 2017 100,480 (1,005) (83,026) 16,449 (4,316) 12,133
Issuance of ordinary shares at subsidiary - - - - 23 23
Loss for the 3 months ended 30 June 2017
-
-
(899)
(899)
(237)
(1,136)
Other comprehensive income: - Currency translation differences - 162 - 162 - 162
Profit/(loss) and total comprehensive income/(loss) for the 3 months ended 30 June 2017
-
162
(899)
(737)
(214)
(951)
At 30 June 2017 100,480 (843) (83,925) 15,712 (4,530) 11,182
Loss for the 3 months ended 30 September 2017 - - (11,010) (11,010) (160) (11,170)
Other comprehensive income: - Currency translation differences - 169 - 169 - 169
Profit/(loss) and total comprehensive income/(loss) for the 3 months ended 30 September 2017
-
169
(11,010)
(10,841)
(160)
(11,001)
Deconsolidation of subsidiary - - - - 4,504 4,504
At 30 September 2017 100,480 (674) (94,935) 4,871 (186) 4,685
Loss for the 3 months ended 31 Decemberr 2017 - - (4,773) (4,773) (9) (4,782) Other comprehensive income: - Currency translation differences - (147) - (147) - (147) Loss and total comprehensive loss for the 3 months ended 31 December 2017 Rounding
- -
(147) -
(4,773) (1)
(4,920) (1)
(9) -
(4,929) (1)
At 31 December 2017 100,480 (821) (99,709) (50) (195) (245)
Page 13 of 27
Statement of Changes in Equity (continued)
Company
Share
capital US$’000
Currency
translation
reserve
US$’000
Accumulated
losses
US$’000
Total
equity
US$’000
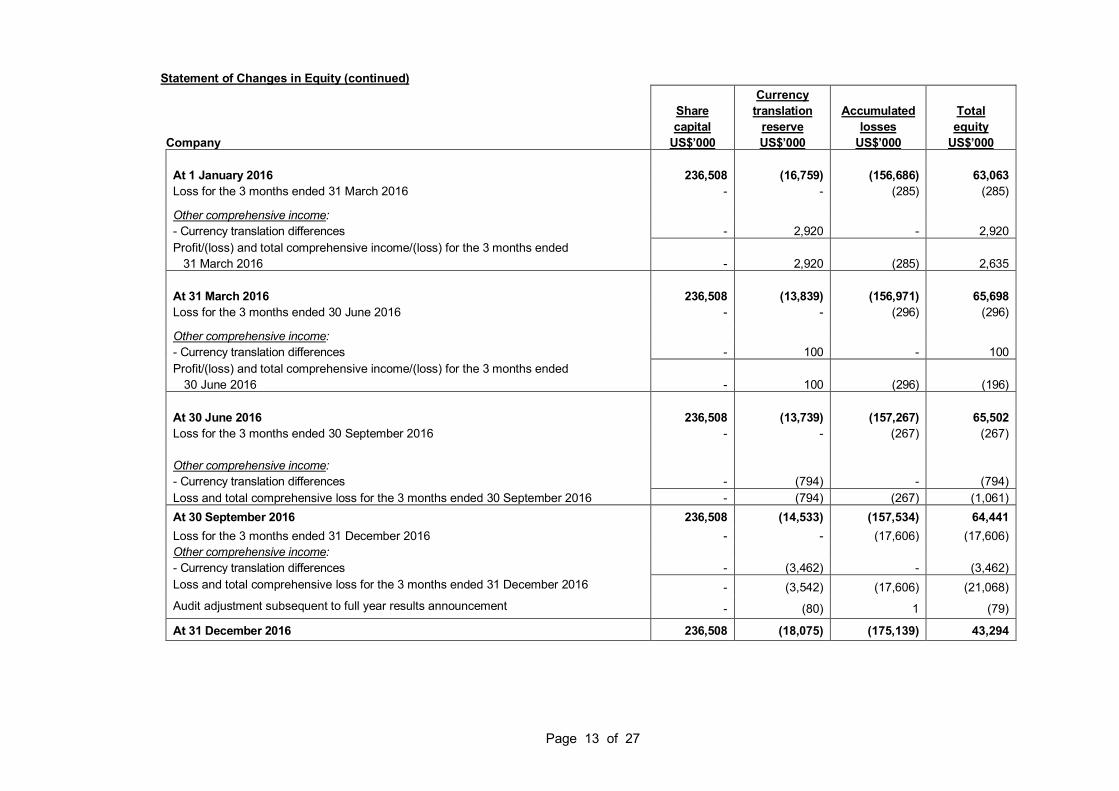
At 1 January 2016 236,508 (16,759) (156,686) 63,063 Loss for the 3 months ended 31 March 2016 - - (285) (285)
Other comprehensive income: - Currency translation differences - 2,920 - 2,920 Profit/(loss) and total comprehensive income/(loss) for the 3 months ended 31 March 2016
-
2,920
(285)
2,635
At 31 March 2016
236,508
(13,839)
(156,971)
65,698 Loss for the 3 months ended 30 June 2016 - - (296) (296)
Other comprehensive income: - Currency translation differences - 100 - 100 Profit/(loss) and total comprehensive income/(loss) for the 3 months ended
30 June 2016
-
100
(296)
(196)
At 30 June 2016
236,508
(13,739)
(157,267)
65,502 Loss for the 3 months ended 30 September 2016 - - (267) (267) Other comprehensive income:
- Currency translation differences - (794) - (794) Loss and total comprehensive loss for the 3 months ended 30 September 2016 - (794) (267) (1,061) At 30 September 2016 236,508 (14,533) (157,534) 64,441
Loss for the 3 months ended 31 December 2016 - - (17,606) (17,606) Other comprehensive income: - Currency translation differences - (3,462) - (3,462) Loss and total comprehensive loss for the 3 months ended 31 December 2016 - (3,542) (17,606) (21,068) Audit adjustment subsequent to full year results announcement - (80) 1 (79)
At 31 December 2016 236,508 (18,075) (175,139) 43,294

Page 14 of 27
Statement of Changes in Equity (continued)
Company (continued)
Share
capital US$’000
Currency
translation
reserve
US$’000
Accumulated
losses
US$’000
Total
equity
US$’000
At 1 January 2017 236,508 (18,075) (175,139) 43,294 Loss for the 3 months ended 31 March 2017 - - (264) (264) Other comprehensive income: - Currency translation differences - 1,498 - 1,498 Profit/(loss) and total comprehensive income/(loss) for the 3 months ended 31 March 2017
-
1,498
(264)
1,234
At 31 March 2017
236,508
(16,577)
(175,403)
44,528 Loss for the 3 months ended 30 June 2017 - - (280) (280) Other comprehensive income: - Currency translation differences - 660 - 660 Profit/(loss) and total comprehensive income/(loss) for the 3 months ended 30 June 2017
-
660
(280)
380
At 30 June 2017
236,508
(15,917)
(175,683)
44,908
Loss for the 3 months ended 30 September 2017 - - (40,420) (40,420) Other comprehensive income:
- Currency translation differences - 832 - 832
Profit/(loss) and total comprehensive income/(loss) for the 3 months ended 30 September 2017
-
832
(40,420)
(39,588)
At 30 September 2017 236,508 (15,085) (216,103) 5,320
Loss for the 3 months ended 31 December 2017 - - (5,145) (5,145) Other comprehensive income: - Currency translation differences - (750) - (750)
Loss and total comprehensive loss for the 3 months ended 31 December 2017 - (750) (5,145) (5,895) At 31 December 2017 236,508 (15,835) (221,248) (575)

Page 15 of 27
1(d)(ii) Details of any changes in the company's share capital arising from rights issue, bonus issue, share buy-backs, exercise of share options or warrants, conversion of other issues of equity securities, issue of shares for cash or as consideration for acquisition or for any other purpose since the end of the previous period reported on. State the number of shares that may be issued on conversion of all the outstanding convertibles, if any, against the total number of issued shares excluding treasury shares and subsidiary holdings of the issuer, as at the end of the current financial period reported on and as at the end of the corresponding period of the immediately preceding financial year. State also the number of shares held as treasury shares and the number of subsidiary holdings, if any, and the percentage of the aggregate number of treasury shares and subsidiary holdings held against the total number of shares outstanding in a class that is listed as at the end of the current financial period reported on and as at the end of the corresponding period of the immediately preceding financial year.
No. of Ordinary Shares Issued Share Capital (S$)
At 31 December 2017 and 2016 1,832,999,998 307,306,455
There were no changes in the Company’s issued and paid-up share capital from 30 September 2017 to 31 December 2017. As at 31 December 2017 and 2016, the Company had no outstanding share options, other convertibles, treasury shares and subsidiary holdings.
1(d)(iii) To show the total number of issued shares excluding treasury shares as at the end of the current financial period and as at the end of the immediately preceding year.
As at 31.12.17 As at 31.12.16 Total number of issued shares (excluding treasury shares)
1,832,999,998
1,832,999,998
1(d)(iv) A statement showing all sales, transfers, disposal, cancellation and/or use of treasury shares as at the end of the current financial period reported on.
Not applicable. The Company had no treasury shares at the beginning of the financial year and does not have any at the end of the financial year.
1(d)(v) A statement showing all sales, transfers, cancellation and/or use of subsidiary holdings as at the end of the current financial period reported on.
Not applicable. The Company had no subsidiary holdings at the beginning of the financial year and does not have any at the end of the financial year.
2. Whether the figures have been audited, or reviewed and in accordance with which standard.
The figures have not been audited or reviewed by the Company’s auditors.
3. Where the figures have been audited or reviewed, the auditors’ report (including any qualifications or emphasis of matter).
Not applicable.
[This section is intentionally left blank]

Page 16 of 27
4. Whether the same accounting policies and methods of computation as in the issuer’s most recently audited annual financial statements have been applied.
Except as disclosed in the Introduction (Consolidated financial statements – Presentation and Preparation) and item 5 below, the Group and the Company have applied the same accounting policies and methods of computation for the current reporting period as compared with the audited financial statements of the Group and the Company for the preceding financial year.
5. If there are any changes in the accounting policies and methods of computation, including any
required by an accounting standard, what has changed, as well as the reasons for, and the effect of, the change.
Except as noted in the Introduction (Consolidated financial statements – Presentation and Preparation), there have been no changes in the accounting policies and methods of computation. The Group and the Company have adopted all the new and revised standards and interpretations of the Singapore Financial Reporting Standards that are effective for annual periods beginning on or after 1 January 2017. The adoption of these standards and interpretations had no significant effect on the financial performance or position of the Group and the Company for the 4QFY2017 and 12MFY2017.
6. Earnings per ordinary share of the group for the current period reported on and the corresponding
period of the immediately preceding financial year, after deducting any provision for preference dividends.
Group 3 months
ended 3 months2
ended 12 months
ended 12 months
ended 31.12.17 31.12.16
31.12.17 31.12.16
(Re-presented) Continuing Operations1 Loss per ordinary share:- Basic (US$ cents) (0.07) (0.13) (0.03) 0.08
Diluted (US$ cents) (0.07) (0.13) (0.03) 0.08
Discontinued Operations (Loss)/earnings per ordinary share:- Basic (US$ cents) (0.19) 0.01 (0.83) (0.06) Diluted (US$ cents) (0.19) 0.01 (0.83) (0.06) Weighted average number of ordinary shares for basic earnings per share
1,832,999,998 1,832,999,998 1,832,999,998 1,832,999,998
Diluted earnings per share is the same as basic earnings per share for all reported financial periods ended 31 December 2017 and 2016 as there were no outstanding convertible instruments.
1Loss/Earnings per share for Continuing Operations excludes non-controlling interest. 2Not previously presented
[This section is intentionally left blank]

Page 17 of 27
7. Net asset value (for the issuer and group) per ordinary share based on the total number of issued shares excluding treasury shares of the issuer at the end of the (a) current period reported on and (b) immediately preceding financial year.
Group As at 31.12.17 As at 31.12.16 Net asset value per ordinary share (US$ cents) (0.003) 0.816 Number of ordinary shares in issue (excluding treasury shares)
1,832,999,998
1,832,999,998
Company
As at 31.12.17 As at 31.12.16 Net asset value per ordinary share (US$ cents) (0.031) 2.362
Number of ordinary shares in issue (excluding treasury shares)
1,832,999,998
1,832,999,998
[This section is intentionally left blank]

Page 18 of 27
8. A review of the performance of the group, to the extent necessary for a reasonable understanding of the group’s business. The review must discuss any significant factors that affected the turnover, costs, and earnings of the group for the current financial period reported on, including (where applicable) seasonal or cyclical factors. It must also discuss any material factors that affected the cash flow, working capital, assets or liabilities of the group during the current financial period reported on.
INTRODUCTION
The main factors affecting the Group’s financial performance are: (a) Re-presentation of the Group’s Income Statement
Due to the Company’s loss of control over Rinjani and the resultant suspension of operations of RPG Trading and EIR, the Company’s fourth quarter and twelve months income statements for the financial years ended 31 December 2016 have been re-presented in accordance with FRS. The re-presentation and previously announced presentation are noted below for information purposes only. Group
3 months 3 months1 12 months 12 months2 ended ended ended ended 31.12.16 31.12.16 31.12.16 31.12.16 Re-presented Re-presented Audited Revenue - 14,313 - 57,899 Cost of goods sold - (13,064) - (48,896) Gross profit - 1,249 - 9,003 Other (expenses)/income (1,933) 117 (70) 184 Selling and distribution expenses - (1,190) - (4,287) Administrative expenses (390) (1,065) (1,285) (3,843) Finance costs 9 7 (38) (1,131) Other expenses (1) (1,682) (1) (2,432) Loss before tax (2,315) (2,564) (1,394) (2,506) Tax expense (3) 366 (3) (48) Loss from continuing operations, net of tax
(2,318)
(2,198)
(1,397)
(2,554)
Discontinued Operations Gain/(loss) from discontinued operations
120 - (1,157) -
Loss for the financial period (2,198) (2,198) (2,554) (2,554) Other comprehensive income Items that may be reclassified
subsequently to profit or loss
Remeasurement of post-employment benefits, net of tax
Currency translation differences arising on consolidation
(145)
(664)
(145)
(664)
(145)
(228)
(145)
(228)
Total comprehensive loss for the period
(3,007)
(3,007)
(2,927)
(2,927)
1Not previously presented 2Announced via SGXNet on 28 February 2017
[This section is intentionally left blank]

Page 19 of 27
Group 3 months 3 months1 12 months 12 months2 ended ended ended ended 31.12.16 31.12.16 31.12.16 31.12.16 Re-presented Re-presented Audited Profit/(loss) attributable to: - Equity holders of the Company (1,889) (1,860) (1,866) (1,866) - Non-controlling interests (309) (338) (688) (688) (2,198) (2,198) (2,554) (2,554) Total comprehensive
(loss)/income attributable to:
- Equity holders of the Company (2,670) (2,669) (2,211) (2,211) - Non-controlling interests (337) (338) (716) (716) (3,007) (3,007) (2,927) (2,927)
1Not previously presented 2Announced via SGXNet on 28 February 2017
(b) Loss of control - Deconsolidation As a result of the Company’s loss of control of Rinjani on 24 August 2017, the entire assets and liabilities related to Rinjani are deconsolidated and as Rinjani was in a net liabilities position as set out below, the resultant gain on deconsolidation is presented in the statement of comprehensive income under loss from discontinued operations for 12MFY2017 (refer item 8.1.10 below). The indicative assets and liabilities of Rinjani are as follows:
31.08.17* US$’000
Assets associated with Rinjani are: Property, plant and equipment 18,699 Mining properties 5,790 Trade and other receivables 10,825 Deferred tax assets 1,638 Inventory 845 Cash and cash equivalents 1,139 Total 38,936 Liabilities associated with Rinjani are: Trade and other payable 51,769 Finance lease liabilities 235 Provisions 1,625 Tax payable 152 Total 53,781 *Deemed to be as at 24 August 2017
[This section is intentionally left blank]

Page 20 of 27
(c) Loss of control – Discontinued Operations Further to the Company’s loss of control of Rinjani and the suspension of operations of RPG Trading and EIR (see Introduction), the entire results from Rinjani as well as RPG Trading and EIR (for the period up to 30 September 2017) are presented separately in the statement of comprehensive income under loss from discontinued operations for 4QFY2017 and 12MFY2017 with comparative balances for 4QFY2016 and 12MFY2016 (refer item 8.1.10 below).
The results of the Discontinued Operations are as follows:
12 months
ended 12 months
ended 31.12.17 31.12.16 US$’000 US$’000 Revenue 38,006 57,899 Cost of goods sold (34,838) (48,896) Gross profit 3,168 9,003 Expenses (4,566) (10,115) Loss before tax (1,398) (1,112) Tax expense (358) (45) Loss after tax (1,756) (1,157)
8.1 INCOME STATEMENT 8.1.1 Revenue
Following the deconsolidation of Rinjani and discontinued operations of RPG Trading and EIR (for the period up to 30 September 2017) and the re-presentation of the comparative figures, there is no revenue from continuing operations other than for EIR for 4QFY2017.
Group 12 months 12 months ended
31.12.17 ended
31.12.16 Inc/
(Dec) US$’000 US$’000 % Revenue by division Coal hauling 275 - NM
EIR recommenced coal hauling operations in October 2017, prior to the contracted start date of 1 November 2017, under a coal hauling service agreement with CAN. Its revenue is derived based on a contracted coal hauling rate per tonne of coal per kilometre hauled. During 4QFY2017, EIR hauled a total of 93,742 tonnes of coal.
8.1.2 Cost of Goods Sold
Following the deconsolidation of Rinjani and discontinued operations of RPG Trading and EIR (for the period up to 30 September 2017) and the re-presentation of the comparative figures, there is no cost of goods sold (“COGS”) from continuing operations other than for EIR for 4QFY2017.
Group 12 months 12 months ended
31.12.17 ended
31.12.16 Inc/
(Dec) US$’000 US$’000 % Cost of goods sold by division Coal hauling 291 - NM
EIR’s COGS for 4QFY2017 includes primarily the costs of manpower, fuel, spare parts and depreciation of
its coal hauling trucks.

Page 21 of 27
8.1.3 Gross profit
Following the deconsolidation of Rinjani and discontinued operations of RPG Trading and EIR (for the period up to 30 September 2017) and the re-presentation of the comparative figures, there is no gross profit from continuing operations other than for EIR for 4QFY2017. EIR generated a gross loss of US$16,000 for the 12MFY2017 and 4QFY2017. This gross loss arose for the reasons as noted in the Introduction-point D.
8.1.4 Other expenses and income Other expenses and income comprise mainly interest income, gains/(losses) from foreign currency exchanges and other expenses. The changes between the financial years pertain to adjustments taken up to reflect the re-presentation of interest income to discontinued operations. Other income and expenses increased by US$0.6 million to net income of US$0.5 million in 12MFY2017 from a net expense of US$0.1 million in 12MFY2016 mainly due to net foreign exchange gains in 12MFY2017 of approximately US$1.6 million offset by the re-presentation of interest income to discontinued operations in 4QFY2017.
8.1.5 Selling and distribution expenses Following the deconsolidation of Rinjani and discontinued operations of RPG Trading and EIR (for the period up to 30 September 2017) and the re-presentation of the comparative figures, there are no selling and distribution expenses from continuing operations during 12MFY2017, 4QFY2017, 12MFY2016 and 4QFY2016.
8.1.6 Administrative expenses
Administrative expenses comprise mainly staff costs, professional fees (audit and legal), travelling and transportation, office rental, listing fees, sponsorship fees and investor relation costs.
Administrative expenses from continuing operations decreased by 14.4% (US$0.2 million) to US$1.1 million in 12MFY2017 from US$1.3 million in 12MFY2016 due to cost control measures in reducing administration expenses following the deconsolidation of Rinjani and discontinued operations of RPG Trading and EIR (for the period up to 30 September 2017). Administrative expenses decreased by 17.7% (US$0.1 million) to US$0.3 million in 4QFY2017 from US$0.4 million in 4QFY2016 for the same reasons noted above.
8.1.7 Finance costs
Finance costs from continuing operations decreased by US$0.04 million to Nil in 12MFY2017 from US$0.04 million in 12MFY2016 due to the disclosure of finance costs of Rinjani, RPG Trading and EIR (for the period up to 30 September 2017) under discontinued operations. Finance costs in 4QFY2017 were nil (4QFY2016 – US$0.01 million) as EIR’s lease agreements were under renegotiation with the lessor with all lease finance costs deferred until the execution of the new lease agreements in 2018.
8.1.8 Other expenses
Please refer to item 8.1.4 above for details. 8.1.9 Tax expense
The tax expense is calculated based on the current statutory income tax rates in Singapore and Indonesia. Following the deconsolidation of Rinjani and discontinued operations of RPG Trading and EIR (for the period up to 30 September 2017), there is no taxable income and therefore no tax expense for continuing operations in 12MFY2017 and 4QFY2017.

Page 22 of 27
8.1.10 Loss from discontinued operations The loss from discontinued operations comprises the following: 3 months 3 months 12 months 12 months ended ended ended ended 31.12.17 31.12.16 31.12.17 31.12.16 Re-presented Re-presented Loss from discontinued operations during FY2017
(277)
120
(1,756)
(1,157)
Impairment of the Group’s - receivables from Rinjani
(3,886)
-
(23,814)
-
- investment in Rinjani (2,169) - (11,338) - Interest income from the unwinding of the fair value adjustment of loans from Rinjani
2,784
-
2,784
-
Gain on the deconsolidation of Rinjani
-
-
18,988
-
Loss from discontinued operations (3,548) 120 (15,136) (1,157)
• Loss from discontinued operations represents the loss from operations of Rinjani, RPG Trading and EIR
(for the period from 1 January 2017 to 30 September 2017) for 12MFY2017 and 4QFY2017 with comparative balances for 12MFY2016 and 4QFY2016 (refer item 8(c) above).
• Impairment of the Group’s receivables from Rinjani represents an impairment of 100% of the Company’s and its subsidiaries’ receivables from Rinjani following the court decision that Rinjani enter bankruptcy.
• Impairment of the Group’s investment in Rinjani represents an impairment of 100% of the Group’s value of its investment in Rinjani following the court decision that Rinjani enter bankruptcy.
• Interest income, previously eliminated at Group consolidation level, arose from the unwinding of the fair value adjustment of the Company and its subsidiaries’ loans receivable from Rinjani following the court decision that Rinjani enter bankruptcy.
• Gain of the deconsolidation of Rinjani arises following the loss of control of Rinjani and the deconsolidation of Rinjani’s net liability position (refer item 8(b) above).
The loss from discontinued operations for 12MFY2017 includes depreciation of property, plant and equipment, of US$1.6 million (12MFY2016: US$3.0 million), amortization of mining properties of US$1.1 million (12MFY2016: US$2.3 million), and amortization of intangible assets of US$27,000 (12MFY2016: US$40,000). The decrease in the above expenses is primarily due to the cessation of Rinjani’s mining operations in June 2017 and the resultant suspension of operations of RPG Trading and EIR hence relatively lesser depreciation and amortisation charges for 12MFY2017.
8.2 ASSETS, LIABILITES AND EQUITY 8.2.1 Property, plant and equipment
Property, plant and equipment (“PP&E”) decreased by US$21.1 million to US$0.7 million as at 31 December 2017 from US$21.8 million as at 31 December 2016. The decrease was mainly due to the deconsolidation of Rinjani’s PP&E for the reasons noted in item 8(b) above, sale of coal hauling trucks by EIR and current period depreciation of EIR’s PP&E.
8.2.2 Investment in subsidiaries (Company Only)
Investment in subsidiaries decreased by US$32.3 million to nil as at 31 December 2017 from US$32.3 million as at 31 December 2016 due to the 100% impairment of the Company’s investment in a subsidiary. The impairment results from the loss of control and therefore the deconsolidation of Rinjani as noted in item 8(b) above. The impairment amount reflects the value previously attributed to the Company’s investment in Rinjani.

Page 23 of 27
8.2.3 Intangible assets
Intangible assets arise from the Company’s interest in Rinjani through Pilar Mas. Intangible assets decreased by US$170,000 to nil as at 31 December 2017 from US$170,000 as at 31 December 2016 due to the deconsolidation of Rinjani for the reasons noted in item 8(b) above.
8.2.4 Mining properties
Mining properties include costs transferred from deferred exploration and evaluation following the completion of technical feasibility and commercial viability of the Group’s IPPKH1 as well as mine development costs and certain costs related to IPPKH2. Mining properties decreased by US$6.8 million to nil as at 31 December 2017 from US$6.8 million as at 31 December 2016 due to the deconsolidation of Rinjani’s mining properties for the reasons noted in item 8(b) above.
8.2.5 Trade and other receivables (current and non-current)
Following the deconsolidation of Rinjani for the reasons noted in item 8(b) above, intercompany receivables due from Rinjani, previously eliminated on consolidation, have been recognized in the balance sheet of the Group as at 31 December 2017. However following the decision of the Commercial Court Jakarta on 9 October 2017 that Rinjani enter bankruptcy with immediate effect a 100% allowance for doubtful account receivables amounting to US$23.8 million (being US$22.7 million for the account receivables of the Company, Energy Prima and Pilar Mas and US$1.1 million for the account receivables of EIR) has been made. Trade and other receivables (current and non current) decreased by US$14.0 million to US$0.1 million as at 31 December 2017 from US$14.1 million as at 31 December 2016 mainly due to the deconsolidation of Rinjani’s receivables from third parties which were previously recorded in the Group’s balance sheet.
8.2.6 Deferred tax assets A deferred tax asset is an item that may be used to reduce future tax payable. A deferred tax asset is
recognised to the extent that it is probable that future taxable profit will be available against which the deductible temporary differences can be utilised.
Deferred tax assets decreased by US$1.9 million to nil as at 31 December 2017 from US$1.9 million as at 31 December 2016 due to the deconsolidation of Rinjani’s deferred tax asset for the reasons noted in item 8(b) above and the uncertainty that EIR will generate sufficient future taxable profit to utilize its deferred tax asset.
8.2.7 Inventories
Inventories include coal on hand, fuel and spare parts and are stated at the lower of cost and net realisable value. Inventories decreased by US$0.1 million to US$0.1 million as at 31 December 2017 from US$0.2 million as at 31 December 2016, due to the deconsolidation of Rinjani’s inventories for the reasons noted in item 8(b) above.
[This section is intentionally left blank]

Page 24 of 27
8.2.8 Cash and cash equivalents Group
3 months ended 12 months ended 31 Dec 17 31 Dec 17 US$’000 US$’000
Cash and cash equivalents at beginning of period/year 554 2,299
Cash flows generated from/(used in) operating activities 34 (373) Cash flows used in investing activities (214) (1,103) Cash flows used in financing activities (50) (499) Net decrease in cash and cash equivalents (230) (1,975) Effect of currency translation on cash and cash equivalents
(2)
(2)
Cash and cash equivalents at 31 December 2017 322 322
Cash flows from operating activities Cash flows generated from operating activities before working capital changes amounted to US$0.6 million for 12MFY2017 and used in operating activities before working capital changes amounted to US$2.4 million for 4QFY2017. For 4QFY2017, cash flows before working capital changes resulted primarily from a loss before tax of US$4.8 million, interest income of US$2.8 million and unrealized exchange gains of US$1.3 million, offset by impairment of investment in subsidiary amounting to US$2.2 million and allowance for doubtful account receivables of US$4.2 million. After working capital changes, total cash flows used in operating activities amounted to US$34,000.
For 12MFY2017, cash flows before changes in working capital resulted primarily from a loss before tax of US$15.4 million, gain on deconsolidation of Rinjani of US$19.0 million and interest income of US$3.7 million, unrealized exchange gains of US$1.6 million, offset by, impairment of investment in subsidiary amounting to US$11.3 million, allowance for doubtful account receivables of US$23.9 million, depreciation of PP&E of US$1.6 million and amortisation of mining properties of US$1.1 million. After working capital changes, cash flows decreased by US$0.4 million.
Cash flows from investing activities Net cash flows used in investing activities of US$1.1 million and US$0.2 million for 12MFY2017 and 4QFY2017 respectively were primarily due to the deconsolidation of Rinjani.
Cash flows from financing activities Net cash flows used in financing activities of US$0.5 million and US$0.1 million for 12MFY2017 and 4QFY2017 respectively were primarily due to the repayment of finance leases.
8.2.9 Currency translation reserve The currency translation reserve represents the balance of translation from the Company’s functional currency (in SGD) to the Group’s presentation currency (in US$) as at 31 December 2017.
8.2.10 Non-controlling interests
The negative balance for non-controlling interests decreased due to the deconsolidation of Rinjani for the reasons noted in item 8(b) above and the adjustment of the related non-controlling interests.
8.2.11 Trade and other payables (current and non-current)
Trade and other payables comprise amounts due to vendors, related parties, directors and shareholder as well as accruals.
Trade and other payables (current and non current) decreased by US$32.1 million to US$0.8 million as at 31 December 2017 from US$32.9 million as at 31 December 2016 mainly due to the deconsolidation of Rinjani’s
Page 25 of 27
trade and other payables for the reasons noted in item 8(b) above. 8.2.12 Post-employment benefits
Post-employment benefits decreased by US$1.2 million to nil as at 31 December 2017 from US$1.2 million as at 31 December 2016 due to the deconsolidation of Rinjani’s post-employment benefits for the reasons noted in item 8(b) above and full settlement of EIR’s post-employment benefits during 12MFY2017.
8.2.13 Finance lease liabilities (current and non-current)
Finance lease liabilities represent the outstanding obligation for the lease of light vehicles and motor vehicles by Rinjani and hire purchase of coal hauling trucks by EIR.
Finance lease liabilities (both current and non-current) decreased by US$0.7 million to US$0.1 million as at 31 December 2017 from US$0.8 million as at 31 December 2016 due to deconsolidation of Rinjani’s finance lease liabilities for the reasons noted in item 8(b) and lease payments during 12MFY2017 by EIR.
8.2.14 Provisions
Provisions include obligations for mine reclamation as well as rehabilitation and asset retirement (mine closure costs). Provisions decreased by US$1.5 million to nil as at 31 December 2017 from US$1.5 million as at 31 December 2016 due to the deconsolidation of Rinjani’s provisions for the reasons noted in item 8(b).
9. Where a forecast, or a prospect statement, has been previously disclosed to shareholders, any
variance between it and the actual results. No forecast or prospect statement has been previously disclosed to shareholders.
10. A commentary at the date of the announcement of the competitive conditions of the industry in which
the group operates and any known factors or events that may affect the group in the next reporting period and the next 12 months. Factors and events that are relevant to the Group in the next 12 months are highlighted in the Introduction under items A to G, Going Concern and Consolidated Financial Statements – Presentation and Preparation.
11. Dividend
(a) Current Financial Period Reported On Any dividend declared for the current financial period/year reported on?
No.
(b) Corresponding Period of the Immediately Preceding Financial Year No.
Any dividend declared for the corresponding period/year of the immediately preceding financial year? No.
(c) Date payable
Not applicable. (d) Books closure date
Not applicable. 12. If no dividend has been declared/recommended, a statement to that effect.
No dividend has been declared or recommended for 12MFY2017.
[This section is intentionally left blank]

Page 26 of 27
13. Interested Person Transactions
The Group does not have a general mandate from shareholders for interested person transactions pursuant to Rule 920(1)(a)(ii) of the Listing Manual Section B: Rules of Catalist of the SGX-ST (the “Catalist Rules”). There were no interested person transactions of S$100,000 or more entered into by the Group during 12MFY2017.
14. Use of Funds In accordance with the use of proceeds as stated in the Company’s offer document dated 30 September 2014 (“Offer Document”), the net proceeds (“Net Proceeds”) have been utilised as follows:
Purpose
Allocation of proceeds to each purpose as announced on 24 November 2014
(S$’000)
Proceeds utilised at the date of this
announcement (S$’000)
Balance (S$’000)
Carrying Out Civil Works 500 500 - Upgrading Coal Mining Facilities 900 862 38 Partial repayment of existing debt to CK 10,000 10,000 - General Working Capital 1,961 1,961 - Outstanding Expense (1) 2,658 2,658 - Underwriting and placement commission (1) 581 581 - Total 16,600 16,562 38
Note: (1) Excluding applicable goods and service tax (2) General Working Capital consists mainly operating expenses of the Group The utilisation of the Net Proceeds is consistent with the intended usage as stated in the Offer Document.
Additional Information Required for Mineral, Oil and Gas Companies 15. Rule 705(6)(a) of the Catalist Rules
1) Use of funds/cash for the fourth quarter ended 31 December 2017: Nil.
2) Projection on the use of funds/cash for the next immediate quarter, including principal assumptions: Nil.
16. Rule 705(6)(b) of the Catalist Rules
Refer to item 20 below.
17. Rule 705(7)(a) of the Catalist Rules Details of exploration (including geophysical surveys), mining development and/or production activities undertaken by the issuer and a summary of the expenditure incurred on those activities, including explanations for any material variances with previous projections, for the period under review. If there has been no exploration, development and/or production activity respectively, that fact must be stated. Not applicable due to the loss of control of Rinjani with effect from 24 August 2017 and deconsolidation of Rinjani, which holds all mining rights of the Group.
18. Rule 705(7)(b) of the Catalist Rules
An update on its reserves and resources, where applicable, in accordance with the requirements as set out in Practice Note 4C including a summary of reserves and resources as set out in Appendix 7D. Not applicable due to the loss of control of Rinjani with effect from 24 August 2017 and deconsolidation of Rinjani, which holds all mining rights of the Group.

Page 27 of 27
19. Confirmation by the Company pursuant to Rule 720(1) of the Catalist Rules
The Company confirms that it has procured all the required undertakings (in the format set out in Appendix 7H of the Catalist Rules) from all its Directors and Executive Officers pursuant to Rule 720(1) of the Catalist Rules.
20. Part II Additional Information Required for Full Year Announcement
Segmented revenue and results for business or geographical segments (of the group) in the form presented in the issuer’s most recently audited annual financial statements, with comparative information for the immediately preceding year The Group only has one reportable segment, which is the provision of coal hauling services and the majority of the Group’s sales/revenue and all of its assets are in Indonesia.
In the review of performance, the factors leading to any material changes in contributions to turnover and earnings by the business or geographical segments. Refer Introduction and item 8 above. A breakdown of sales as follows:
Details
Latest Financial
Year US$’000 Group
Previous Financial
Year US$’000 Group
%
Inc/ (dec)
Group (a) Sales reported in first half year(1) - - (b) Income after tax before deducting minority interest
reported for first half year
-
-
(c) Sales reported in second half year 275 - NM (d) Loss after tax before deducting minority interest
reported for second half year
(15,571)
(1,866)
>100% 1 No sales in the first half year as noted in item 8(a) above
A breakdown of the total annual dividend (in dollar value) for the issuer’s latest full year and its previous full year. Total annual Dividend – Ordinary shares:
Latest Financial Year 2017
US$’000
Previous Financial Year 2016
US$’000 Interim - - Total - -
21. Disclosure of person occupying a managerial position in the issuer or any of its principal subsidiaries
who is a relative of a director or chief executive officer or substantial shareholder of the issuer pursuant to Rule 704(10) in the format below. If there are no such persons, the issuer must make an appropriate negative statement
Not applicable 22. Confirmation by the Board of Directors pursuant to Rule 705(6)(b) of the Catalist Rules
The Board confirms that to the best of its knowledge, nothing has come to its attention which may render the above information provided to be false or misleading in any material aspect.
On behalf of the Board Agus Sugiono Executive Chairman and Chief Executive Officer 6 June 2018