resource recovery by osmotic bioelectrochemical systems ... · resource recovery by osmotic...
TRANSCRIPT
RESOURCE RECOVERY BY OSMOTIC BIOELECTROCHEMICAL SYSTEMS
TOWARDS SUSTAINABLE WASTEWATER TREATMENT
Mohan Qin
Dissertation Submitted to the faculty of the Virginia Polytechnic Institute and State University in
partial fulfillment of the requirements for the degree of
Doctor of Philosophy in Civil Engineering
Zhen He, Chair
Andrea M. Dietrich
Daniel M. Gallagher
Amanda J. Morris
Oct. 5th, 2017
Blacksburg, VA
Keywords: Osmotic bioelectrochemical systems, resource recovery, bioelectrochemical systems,
forward osmosis, wastewater.
Resource Recovery by Osmotic Bioelectrochemical Systems towards
Sustainable Wastewater Treatment
Mohan Qin
Abstract (academic)
Recovering valuable resources from wastewater will transform wastewater management from a
treatment focused to sustainability focused strategy, and creates the need for new technology
development. An innovative treatment concept - osmotic bioelectrochemical system (OsBES),
which is based on cooperation between bioelectrochemical systems (BES) and forward osmosis
(FO), has been introduced and studied in the past few years. An OsBES can accomplish
simultaneous treatment of wastewater and recovery of resources such as nutrient, energy, and water
(NEW). The cooperation can be accomplished in either an integrated (osmotic microbial fuel cells,
OsMFC) or coupled (microbial electrolysis cell-forward osmosis system, MEC-FO) configuration.
In OsMFC, higher current generation than regular microbial fuel cell (MFC) was observed,
resulting from the lower resistance of FO membrane. The electricity generation in OsMFC could
greatly inhibit the reverse salt flux. Besides, ammonium removal was successfully demonstrated
in OsMFC, making OsMFCs a promising technology for “NEW recovery” (NEW: nutrient, energy
and water). For the coupled OsBES, an MEC-FO system was developed. The MEC produced an
ammonium bicarbonate draw solute via recovering ammonia from synthetic organic solution,
which was then applied in the FO for extracting water from the MEC anode effluent. The system
has been advanced with treating landfill leachate. A mathematical model developed for ammonia
removal/recovery in BES quantitatively confirmed that the NH4+ ions serve as effective proton
shuttles across cation exchange membrane (CEM).

Resource Recovery by Osmotic Bioelectrochemical Systems towards
Sustainable Wastewater Treatment
Mohan Qin
Abstract (general audience)
Nowadays, wastewater is no longer considered as waste. Instead, it is a pool for different kinds of
resources, such as nutrient, energy, and water (NEW). Various technologies were developed to
achieve NEW recovery from wastewater. A novel concept, osmotic bioelectrochemical system
(OsBES) has been introduced and studied in the past few years. OsBES is based on two
technologies: bioelectrochemical systems (BES) and forward osmosis (FO); and the corporation
between these two technologies could accomplish simultaneous wastewater treatment and resource
recovery. We investigated two kinds of OsBES: one is osmotic microbial fuel cells (OsMFC), and
the other is microbial electrolysis cell-forward osmosis system (MEC-FO). For OsMFC, a
mathematical model was built to understand the internal resistance, which will affect the current
generation according to Om’s law (I=U/R). The salt transport across the cation exchange
membrane (CEM) is related to the current generation. The ion transport, especially
ammonium/ammonia transport, across CEM membrane in BES was modelled, which will help the
BES design and operation for ammonia recovery systems. The system performance for wastewater
treatment and resource recovery in MEC-FO was fully investigated with both synthetic wastewater
and landfill leachate. The results indicated that MEC-FO is a promising system for NEW recovery.

iv
Acknowledgements
First and foremost I thank my advisor, Dr. Zhen (Jason) He, for his guidance and mentorship these
past four years. He has been more than an adviser, and I have benefited from his mentoring, patience,
and encouragement. Thank you for offering me such a great opportunity of being an EBBLer and doing
interesting research in bioelectrochemical systems. I sincerely thank my committee members: Dr.
Andrea M. Dietrich, Dr. Daniel M. Gallagher, and Dr. Amanda J. Morris, for their insightful comments,
thought-provoking questions and their support for me.
I would like to thank all of the EBBL members for their support and assistance during my research
journey. Thanks to my collaborators, Dr. Ying Liu, Dr. Rui Qiao, Dr. William Maza, and Dr. Amanda
Morris, for their great work.
I would also like to thank the Qatar National Research Fund (6-289-2-125) and Institute for
Critical Technology and Applied Science (ICTAS) at Virginia Tech to financially support my
research. Many thanks to Peppers Ferry Regional Wastewater Treatment Plant for providing
inocula for my reactors.
Thanks to my family and friends. I wouldn’t be able to accomplish anything in my life without their
love and support. Finally to my husband, Haoran. You give me love and strength, and you are always
there for me.

v
Table of Contents
Chapter 1 Introduction .............................................................................................................................. 1
1.1 Water Scarcity and Wastewater Treatment .......................................................................................... 1
1.2 Introduction to Bioelectrochemical system .......................................................................................... 2
1.3 Introduction to Forward Osmosis ........................................................................................................ 6
1.4 Osmotic Bioelectrochemical Systems .................................................................................................. 7
1.5 Outline ................................................................................................................................................ 10
1.6 Attribution .......................................................................................................................................... 12
Chapter 2 Resource Recovery by Osmotic Bioelectrochemical Systems towards Sustainable
Wastewater Treatment ................................................................................................................................. 17
Abstract .................................................................................................................................................... 17
2.1 Introduction ........................................................................................................................................ 18
2.2 Technological Principles .................................................................................................................... 20
2.2.1 Bioelectrochemical System (BES) ........................................................................................... 20
2.2.2 Forward Osmosis (FO) ............................................................................................................. 21
2.3 Cooperation between BES and FO .................................................................................................... 22
2.3.1 Configurations .......................................................................................................................... 22
2.3.2 Mutual Benefits ........................................................................................................................ 24
2.4 NEW Recovery in OsBES ................................................................................................................. 26
2.4.1 Energy Recovery ...................................................................................................................... 26
2.4.2 Water Recovery ........................................................................................................................ 29
2.4.3 Nutrient Recovery .................................................................................................................... 32
2.5 Perspectives and Challenges .............................................................................................................. 33
2.5.1 Potential Applications .............................................................................................................. 33
2.5.2 Recovery of Other Resources .................................................................................................. 35
2.5.3 Membrane Fouling ................................................................................................................... 36
2.5.4 System scaling up ..................................................................................................................... 37
2.6 Conclusions ........................................................................................................................................ 38
Chapter 3 Understanding Electricity Generation in Osmotic Microbial Fuel Cells through Integrated
Experimental Investigation and Mathematical Modeling ............................................................................ 39
3.1 Introduction ........................................................................................................................................ 40
3.2 Materials and Methods ....................................................................................................................... 42
3.2.1 The OsMFC/ MFC Setup and Operation ................................................................................. 42
3.2.2 Measurement and Analysis ...................................................................................................... 43
3.2.3 OsMFC Model Development ................................................................................................... 44
3.3 Results and Discussion ....................................................................................................................... 49
3.3.1 Comparing OsMFC with MFC ................................................................................................ 49
3.3.2 Effects of membrane and solution resistance ........................................................................... 52
3.3.3 OsMFC model fitting and validation ....................................................................................... 55
3.3.4 OsMFC model prediction ......................................................................................................... 57
3.4 Conclusions ........................................................................................................................................ 60

vi
Chapter 4 Effects of Current Generation and Electrolyte pH on Reverse Salt Flux across Thin Film
Composite Membrane in Osmotic Microbial Fuel Cells ............................................................................. 61
4.1 Introduction ........................................................................................................................................ 62
4.2 Materials and Methods ....................................................................................................................... 65
4.2.1 OsMFC setup ........................................................................................................................... 65
4.2.2 OsMFC operation ..................................................................................................................... 66
4.2.3 Measurement and analysis ....................................................................................................... 68
4.3 Results and Discussion ....................................................................................................................... 71
4.3.1 Current generation decreases RSF ........................................................................................... 71
4.3.2 Effects of controlled catholyte pH ........................................................................................... 74
4.3.3 Uncontrolled catholyte pH ....................................................................................................... 77
4.3.4 Ion transport in the OsMFC ..................................................................................................... 80
4.3.5 Mechanism of reduced RSF in the OsMFC ............................................................................. 82
4.4 Conclusions ........................................................................................................................................ 85
Chapter 5 Ammonium removal from synthetic wastewater promoted by current generation and water
flux in an osmotic microbial fuel cell .......................................................................................................... 87
5.1 Introduction ........................................................................................................................................ 88
5.2 Materials and Methods ....................................................................................................................... 90
5.2.1 OsMFC setup ........................................................................................................................... 90
5.2.2 OsMFC operation ..................................................................................................................... 91
5.2.3 Measurement and analysis ....................................................................................................... 92
5.3 Results and Discussion ....................................................................................................................... 93
5.3.1 Feasibility of ammonium removal across FO membrane ........................................................ 93
5.3.2 Effects of anolyte flow rate ...................................................................................................... 94
5.3.3 Effects of current generation .................................................................................................... 96
5.3.4 Effects of water flux ................................................................................................................. 98
5.3.5 Mechanisms of ammonium movement .................................................................................. 100
5.3.6 Implications and perspectives ................................................................................................ 102
5.4 Conclusions ...................................................................................................................................... 103
Chapter 6 Understanding Ammonium Transport in Bioelectrochemical Systems towards its Recovery
104
6.1 Introduction ...................................................................................................................................... 105
6.2 Materials and Methods ..................................................................................................................... 108
6.2.1 MEC setup .............................................................................................................................. 108
6.2.2 Measurement and analysis ..................................................................................................... 109
6.2.3 Mathematical model of BES-based ammonia recovery ......................................................... 110
6.2.4 Modeling of electrochemical and chemical reactions in the MEC ........................................ 116
6.2.5 Governing equation for H+ ion concentration in the anolyte ................................................. 117
6.3 Results .............................................................................................................................................. 118
6.3.1 Model validation .................................................................................................................... 119
6.3.2 pH regulation .......................................................................................................................... 121
6.3.3 Ammonium and ammonia transport ...................................................................................... 124
6.3.4 Ion competition ...................................................................................................................... 127
6.4 Discussion ........................................................................................................................................ 131

vii
Chapter 7 Integrated Experimental and Modeling Evaluation of Energy Consumption for Ammonia
Recovery in Bioelectrochemical Systems ................................................................................................. 133
7.1 Introduction ...................................................................................................................................... 134
7.2 Materials and Methods ..................................................................................................................... 136
7.2.1 BES setup and operation ........................................................................................................ 136
7.2.2 Measurement and analysis ..................................................................................................... 138
7.2.3 Mathematical model of BES-based ammonia recovery ......................................................... 140
7.3 Results and Discussion ..................................................................................................................... 143
7.3.1 Effects of aeration rate on ammonia recovery ....................................................................... 143
7.3.2 Effects of current generation – external voltage .................................................................... 148
7.3.3 Effect of current generation - external resistance .................................................................. 151
7.3.4 Perspectives ............................................................................................................................ 156
7.4 Conclusions ...................................................................................................................................... 159
Chapter 8 Self-supplied ammonium bicarbonate draw solute for achieving wastewater treatment and
recovery in a microbial electrolysis cell-forward osmosis-coupled system .............................................. 160
8.1 Introduction ...................................................................................................................................... 161
8.2 Materials and Methods ..................................................................................................................... 163
8.2.1 The MEC-FO system ............................................................................................................. 163
8.2.2 MEC and FO setup and operation .......................................................................................... 164
8.2.3 Measurement and analysis ..................................................................................................... 166
8.3 Results and Discussion ..................................................................................................................... 166
Chapter 9 Recovery of Nitrogen and Water from Landfill Leachate by A Microbial Electrolysis Cell–
Forward Osmosis System .......................................................................................................................... 174
9.1 Introduction ...................................................................................................................................... 175
9.2 Materials and Methods ..................................................................................................................... 177
9.2.1 The MEC-FO system ............................................................................................................. 177
9.2.2 Landfill leachate ..................................................................................................................... 180
9.2.3 Measurement and analysis ..................................................................................................... 181
9.3 Results and Discussion ..................................................................................................................... 182
9.3.1 MEC performance .................................................................................................................. 182
9.3.2 FO performance ..................................................................................................................... 189
9.3.3 The MEC-FO system ............................................................................................................. 191
9.4 Conclusions ...................................................................................................................................... 194
Chapter 10 Nanoparticulate Ni (OH)2 films synthesized from macrocyclic nickel (II) Cyclam for
hydrogen production in microbial electrolysis cells .................................................................................. 195
10.1 Introduction .................................................................................................................................... 196
10.2 Materials and Methods ................................................................................................................... 198
10.3 Results and Discussion ................................................................................................................... 203
Chapter 11 Perspectives ......................................................................................................................... 215
Reference ................................................................................................................................................... 219
viii
Tables
Table 2.1 Summary of the OsBES studies for energy recovery. ................................................................. 27
Table 2.2 Summary of the OsBES studies for water recovery .................................................................... 32
Table 3.1 Parameters used in the OsMFC model ........................................................................................ 48
Table 3.2 The characterization of NaCl and glucose catholyte ................................................................... 54
Table 4.1 TFC membrane properties. .......................................................................................................... 68
Table 4.2 Diffusion coefficient in TFC membrane. .................................................................................... 71
Table 6.1 Equilibrium constants for acid-base reactions and aqueous-solution equilibrium .................... 111
Table 6.2 System configuration ................................................................................................................. 114
Table 6.3 Diffusion coefficients of all species .......................................................................................... 115
Table 6.4 Initial conditions in the anolyte and catholyte in numerical simulations .................................. 115
Table 7.1 Acid-base reactions and gas-solution equilibrium considered in our model. ............................ 142
Table 7.2 Comparison of different technologies for ammonia removal and recovery from wastewater .. 157
Table 8.1 Comparison between the MEC system, MFC-FO system and MFC ........................................ 172
Table 9.1 Chemical characteristics of the landfill leachate used in this study. ......................................... 181
Table 10.1 Hydrogen production and efficiencies of the MECs with modified carbon cloth with nickel
hydroxide or Pt and unmodified carbon cloth at an applied voltage of 0.8 V ........................................... 214

ix
Figures
Figure 1.1 Global physical and economic surface water scarcity (Source: World Water Development Report
4. World Water Assessment Programme) (de Fraiture et al. 2007). ............................................ 1
Figure 1.2 Exmaples of BES: A) MFC; B) MEC; and C) MDC. .................................................................. 3
Figure 1.3 Microbial fuel cell architecture (a) and the different types of microorganisms in an anodic biofilm
(b), including exoelectrogens that transfer electrons by direct contact (green), produce
nanowires (purple) and use endogenous (and therefore self-produced) mediators (blue). other
non-exoelectrogenic bacteria (brown) that live off the products produced by other bacteria or
possibly use mediators or nanowires produced by other microorganisms can also be present
(Logan 2009). .............................................................................................................................. 4
Figure 1.4 Schematic of forward osmosis (FO). ............................................................................................ 6
Figure 2.1 Number of published journal articles about OsBES since the first OsBES paper. .................... 18
Figure 2.2 Schematics of (A) bioelectrochemical system (BES) and (B) forward osmosis (FO). .............. 22
Figure 2.3 Configurations and examples of the cooperation between BES and FO: (A) integrated OsBES;
(B) an example of integrated OsBES: OsMFC; (C) another example of integrated OsBES:
OsMDC; (D) coupled OsBES; (E) an example of coupled OsBES: MEC-FO; and (F) another
example of coupled OsBES: MFC-OMBR. .............................................................................. 23
Figure 2.4 Mutual benefits between BES and FO in OsBES. ..................................................................... 24
Figure 2.5 Examples of energy recovery and consumption in the OsBES: (A) an OsMFC treating synthetic
municipal wastewater; (B) an MEC-FO system treating synthetic sidestream centrate. .......... 28
Figure 2.6 Water recovery in the OsBES: (A) an OsMFC generates higher current than a conventional MFC
at different concentrations of NaCl draw solution; and (B) fouled FO membrane greatly reduces
water flux compared to pristine membrane. .............................................................................. 31
Figure 3.1 The OsMFC and MFC operated in a batch mode (catholyte: 35 g L-1 NaCl): (A) open circuit
voltage and the individual potentials, (B) current density (j) and the anode and cathode potential
under a closed circuit condiction, and (C) water flux in open circuit (OC) and closed circuit
(CC). .......................................................................................................................................... 51
Figure 3.2 The OsMFC and the MFC operated with no water flux (catholyte: 2 g L-1 NaCl): (A) water flux,
(B) current density, and (C) individual potentials. .................................................................... 53
Figure 3.3 The OsMFC with different catholyte conductivity: (A) current density, and (B) water flux. S1-5
are explained in Table 2. ............................................................................................................ 54
Figure 3.4 Model fitting for the OsMFC when the catholyte was changed from 35 to 2 g L-1 NaCl: (A)
current generation, (B) COD concentration in anode effluent, (C) salt concentrations in the
anolyte and the catholyte, and (D) water flux. ........................................................................... 56
Figure 3.5 The OsMFC model validation when the catholyte was changed from 2 g L-1 NaCl to 10 g L-1
NaCl solution: (A) current generation, (B) salt concentrations of anolyte and catholyte, and (C)
water flux. .................................................................................................................................. 57
Figure 3.6 Model prediction for the OsMFC and the MFC with varied salt concentration in the catholyte:
(A) current generation in OsMFC and MFC, (B) internal resistance distribution in MFC, and
(C) internal resistance distribution in OsMFC. Rm: membrane resistance; RC: catholyte
resistance; RA: anolyte resistance; Re: electrode resistance. ...................................................... 59
Figure 4.1 Schematic of an osmotic microbial fuel cell. ............................................................................. 66
Figure 4.2 Photograph of OsMFC. A, anolyte reservoir; B, catholyte reservoir; C, OsMFC reactor; D, pump
for pH adjustment; E, 1M NaOH/HCl solution; F, recirculation pump; G, stir plate; H, mass
balance; I, pH meter; J, pump speed controller, and K, aeration pump (for catholyte). ............ 66

x
Figure 4.3 Integrity test for the FO membrane. (A) the extracted water volume during the 2-h operation for
the pristine FO membrane and membrane after-wash; (B) the water flux and RSF for the pristine
FO membrane and membrane after-wash. ................................................................................. 68
Figure 4.4 The OsMFC performance with different external resistance: (A) current generation; and (B)
water flux and reverse salt flux (RSF). ...................................................................................... 73
Figure 4.5 Polarization curve of the OsMFC. .............................................................................................. 73
Figure 4.6 Water flux in OsMFC with different external resistance (Coulomb production): (A) 1 Ω - 311
Coulomb (C) generation (B) 10 Ω - 226 C generation (C) 40 Ω - 148 C generation (D) 100 Ω -
90 C generation, and (E) open circuit. ....................................................................................... 74
Figure 4.7 pH variation in anolyte and catholyte with fixed catholyte pH. The external resistance was 40
Ω. ............................................................................................................................................... 75
Figure 4.8 The effects of the controlled catholyte pH and external resistance: (A) RSF; and (B) total
Coulomb production. Quasi-infinite resistance was in open circuit mode and didn’t have current
generation. ................................................................................................................................. 76
Figure 4.9 Performance of the OsMFC with 40 Ω resistor and uncontrolled catholyte pH: (A) water flux
and RSF and (B) current density. .............................................................................................. 78
Figure 4.10 The OsMFC performance with uncontrolled catholyte pH: (A) measured (actual) and calculated
pH value with different initial catholyte pH (external resistance of 40 Ω); and (B) water flux and
RSF with different external resistance (initial catholyte pH of 7). ............................................ 78
Figure 4.11 Water flux and RSF of the OsMFC with open circuit and uncontrolled catholyte pH. ........... 80
Figure 4.12 Transport of sodium (Na+) and chloride (Cl–) ions to the anode: (A) affected by Coulomb
production; and (B) affected by the catholyte pH. .................................................................... 81
Figure 4.13 Proposed mechanism of the ion transport (orange: Na+; green: Cl−) across the TFC membrane.
The arrows represent the flux of ions (orange: reverse flux of Na+; green: reverse flux of Cl−
dragged by Na+ transport; yellow: forward flux of Na+ driven by current; purple: reverse Na+
flux inhibited by current; red: increased reverse flux of Na+ by increased catholyte pH). ....... 82
Figure 4.14 Contribution of diffusion and EDM (electrically-driven migration) to ion transport: (A) affected
by Coulomb production; and (B) affected by the catholyte pH. ................................................ 84
Figure 5.1 Ammonium removal by the OsMFC affected by different catholyte NaCl concentrations: (A)
current generation; and (B) water flux and NH4+-N removal efficiency. .................................. 95
Figure 5.2 Ammonium removal by the OsMFC affected by different anolyte flow rates: (A) current
generation and NH4+-N removal efficiency; and (B) water flux. .............................................. 96
Figure 5.3 Ammonium removal by the OsMFC affected by the current generation: (A) current generation
in open and closed circuit conditions; (B) NH4+-N removal efficiency in closed and open circuit
conditions; (C) polarization curve; and (D) current generation and NH4+-N removal efficiency
with different external resistances. ............................................................................................ 97
Figure 5.4 Ammonium removal by the OsMFC affected by water flux: (A) similar current generation under
two different conditions, 2 g L-1 NaCl as catholyte / 10 Ω external resistance and 35 g L-1 NaCl
as catholyte / 88 Ω external resistance; and (B) NH4+-N removal efficiency and water flux under
those two conditions. ................................................................................................................. 99
Figure 5.5 The contribution of different mechanisms to ammonium removal: (A) comparison between open
and closed circuit conditions with or without water flux; (B) effects of current generation; and
(C) effects of water flux (orange: current generation; green: water flux; yellow: ion exchange;
and maroon: diffusion). ........................................................................................................... 101
Figure 6.1 A sketch of the MEC-based ammonia recovery system. ......................................................... 110
Figure 6.2 Comparison of experimental and model studies of ammonia recovery during three batch cycles
of MEC operation. The current density measured experimentally (a) is feed into the models to
predict the various observables of the anolyte and the catholyte: the pH (b), the acetate

xi
concentration (c), the amount of NH3 collected from catholyte by aeration (d), the total nitrogen
content (e), and the transport of Na+ and Cl- ions out of the anolyte (f). Symbols are the
experiment data and lines are model prediction. In (b-e), red lines are for anolyte and blue lines
are for catholyte. In (c), the acetate concentration in catholyte is below the detection limit of our
equipment and thus not shown. In (f), to highlight the relative importance of Na+/Cl- ion
transport in the overall charge transport in the system, their transport is quantified using the
cumulative transport number 𝒕𝒊 + (see text, 𝒕𝒊+= 𝟏. 𝟎 means that the charge carried by the
transport a species i is equal to the total charge passed through the membrane). A detailed
summary of operating conditions and parameters (e.g., initial species concentration in
anolyte/catholyte) is in provided in Table 6.2, Table 6.3, and Table 6.4. ............................... 114
Figure 6.3 Partition between NH4+ and NH3 as a function of pH assuming fast NH3+H+=NH4
+ reaction.
................................................................................................................................................. 117
Figure 6.4 Regulation of pH in MEC during ammonia recovery operation. The variation of the pH values
in the anolyte (a) and the catholyte (c) is governed by various Faradaic and chemical reactions
(b and d) identified in Equation 6.11-6.15. The generation/consumption of proton and hydroxide
by the chemical reactions involving various ion groups in the anolyte and catholyte are shown
in (b) and (d), respectively. These generation/consumption terms are normalized by the
production of proton (in anolyte, for panel b) and hydroxide (in catholyte, for panel d) generated
through Faradic reactions. [Operating conditions and parameters in this study are the same as in
Figure 6.2 except the followings: the current is I=1 A/m2; the catholyte initially contains 10mM
of Na+ ions and the accompanying carbonate group ions to produce a pH of ~6.8]. .............. 122
Figure 6.5 Mechanisms of NH4+/NH3 transport in MECs. (a) Relative strength of NH4
+ ion transport due to
diffusion and migration. (b) Evolution of the NH4+ ion concentration in the anolyte and catholyte.
(c) Distribution of pH across the CEM and at the CEM-anolyte/catholyte interfaces. (d) The
diffusion flux of NH3 toward the anolyte at the CEM-catholyte/anolyte interfaces. These
diffusion fluxes are normalized by the total NH4+ ion flux to highlight their impact on the
ammonia recovery in the catholyte. [ALL parameters in this study are the same as in Fig. 3.]
................................................................................................................................................. 126
Figure 6.6 Ionic competition between Na+ and NH4+ . (a) Transport number of Na+ and NH4
+ ions at the
CEM-anolyte interface. (b) The concentration profiles and transport of Na+ and NH4+ ions within
the cation exchange membrane. [ALL parameters in this study are the same as in Chapter 5.]
................................................................................................................................................. 129
Figure 6.7 Transport number of Na+ and NH4+ ions at the CEM-anolyte interface under different initial Na+
ion concentration in the anolyte. The solid (dashed) lines are for case in which the initial
concentration of Na+ ions in the anolyte is equal to (three times of) that of the NH4+ ions. ... 130
Figure 6.8 Evolution of the NH4+ ion concentration in anolyte during operations with different initial Na+
ion concentrations in the anolyte. S0.2, S1, and S3 corresponds to the case in which the initial
Na+ ion concentration in the anolyte is 0.2, 1.0 and 3.0 (for demonstration purpose) times of the
initial NH4+ ion concentration, respectively. The operating parameters (e.g., current density and
aeration rate) are otherwise identical in all cases. ................................................................... 131
Figure 7.1 Ammonia recovery by the BES affected by different catholyte aeration rates: (A) current
generation; (B) NH4+-N concentration in the anolyte and the catholyte; (C) the NH3 recovery
rate; and (D) simulated anolyte and catholyte NH4+-N concentration. The external resistance
was 1 Ω and the external voltage was 0.8 V. ........................................................................... 144
Figure 7.2 The total Coulomb generation per cycle for BES with different aeration rate. ....................... 145
Figure 7.3 The simulated amount of NH3 collected from catholyte by aeration with different catholyte
aeration rate ............................................................................................................................. 146
xii
Figure 7.4 Energy consumption by the BES affected by different aeration rate: (A) energy consumption for
ammonium removal; and (B) energy consumption for ammonia recovery (blue: aeration;
orange: power supply; yellow: catholyte recirculation; green: anolyte recirculation). ........... 148
Figure 7.5 Ammonia recovery by the BES affected by different external voltages: (A) current generation;
(B) NH4+-N concentration in the anolyte and the catholyte effluent; (C) the NH3 recovery rate;
and (D) the simulated anolyte and catholyte NH4+-N concentrations. The external resistance
was 1 Ω and the catholyte aeration rate was 100 mL min-1. .................................................... 149
Figure 7.6 The total Coulomb generation per cycle for BES with different external voltage. .................. 150
Figure 7.7 The simulated amount of ammonia recovery for BES with different current. ......................... 150
Figure 7.8 Energy consumption for ammonia recovery affected by different external voltages (Green:
anolyte recirculation; yellow: catholyte recirculation; orange: power supply; and cyan: aeration).
................................................................................................................................................. 151
Figure 7.9 The BES performance affected by different external resistances: (A) current generation; (B) the
NH3 recovery rate; and (C) simulated NH4+-N concentration in the anolyte and catholyte
effluents. The external voltage was 0.8 V and the catholyte aeration rate was 100 mL min-1 153
Figure 7.10 The total Coulomb generation per cycle for BES with different external resistance. ............ 154
Figure 7.11 The NH4+-N concentration for anolyte and catholyte effluent in BES with different external
resistances. ............................................................................................................................... 154
Figure 7.12 Energy consumption for ammonia recovery affected by different external resistances (Gray:
anolyte recirculation; yellow: catholyte recirculation; cyan: power supply; and magenta:
aeration). .................................................................................................................................. 155
Figure 7.13 The polarization curve for BES. ............................................................................................. 156
Figure 8.1 The schematic design of the MEC-FO coupled system ........................................................... 164
Figure 8.2 Ammonia recovery in the MEC: (A) current density, (B) COD concentration, (C) ammonium
nitrogen concentration in the MEC and the solution of absorption bottle, and (D) the pH in each
chamber. ................................................................................................................................... 167
Figure 8.3 The MEC-FO system: (A) water flux in the FO process, (B) reverse salt flux in FO, the (C)
current density from the mixture of returned feed solution and fresh anolyte in the MEC, and
(D) ammonium nitrogen concentration in the MEC and the FO ............................................. 169
Figure 9.1 Schematic of the MEC-FO system. .......................................................................................... 178
Figure 9.2 The MEC performance fed with and without aeration: (A) current generation; (B) average
effluent COD and Coulumbic recovery (CR); and (C) the MEC effluent conductivity. ......... 184
Figure 9.3 Ammonium recovery in the MEC: (A) ammonium concentration with aeration; (B) (A)
ammonium concentration without aeration; and (C) the current generation when aeration was
put back to the MEC. The insets in (A) and (B) show the NH4+-N removal efficiency. ......... 186
Figure 9.4 The concentrations of the major ions in the MEC with aeration and without aeration (A) in the
anolyte from the 3rd batch; (B) in the catholyte from the 3rd batch; (C) in the anolyte from the
5th batch; and (D) in the catholyte from the 5th batch. ............................................................. 188
Figure 9.5 The FO performance fed with the treated leachate: (A) water flux with 1 M NH4HCO3 as draw
solution; (B) reverse salt flux with different NH4HCO3 concentrations; and (C) EIS for new and
used FO membranes. The inset in (C) shows the water flux with 0.5 M NH4HCO3 as draw
solution for new and used FO membranes. ............................................................................. 190
Figure 9.6 The MEC-FO system performance: (A) current generation; and (B) NH4+-N distribution during
3 batch cycles. .......................................................................................................................... 192
Figure 10.1 Schematic of an MEC ............................................................................................................ 201
Figure 10.2 (a) Cyclic voltammograms of Ni(II)cyclam (solid black line) and Ni(II)Cl2•6H2O in an aqueous
0.1 M NaOH solution. The inset shows a closer view of the Ni(II)Cl2•6H2O CV. (b) Comparison
of the current densities corresponding to the electrodeposition of the Ni(II) catalyst from the

xiii
Ni(II)cyclam (black) and Ni(II)Cl2 solutions on the CFE as a function of the number of potential
sweep scans. ............................................................................................................................. 204
Figure 10.3 (a) Cyclic voltammograms of 6 mM (solid black line), 15 mM (solid red line), and 23 mM
(solid blue line) Ni(II)cyclam solutions in aqueous 0.1 M NaOH electrolyte. (b) Comparison of
the current densities corresponding to the electrodeposition of the Ni(II) catalyst from the 6
mmm (black circles), 15 mM (red circles), and 23 mM (blue circles) Ni(II)cyclam solutions on
the CFE as a function of the number of potential sweep scans. These are compared to each other
by dividing the current densities by the concentration of Ni(II) cyclam at the start of the
deposition. ................................................................................................................................ 205
Figure 10.4 Cyclic voltammograms of a Ni(OH)2 film deposited on CFE (black – left y-axis), carbon cloth
(black dash – left y-axis), and Ni(II)cyclam in solution (red – right y-axis, working electrode:
glassy carbon) in anaerobic 0.1 M TBAPF6-CH3CN solutions (scan rate 25 mV/s). ............. 206
Figure 10.5 X-ray photoelectron spectra of Ni 2p3/2 (top), N 1s (middle), and O 1s (bottom) signals for films
prepared from 6 mM, 15 mM, and 23 mM solutions of Ni(II)cyclam. ................................... 207
Figure 10.6 SEM images of carbon cloth (a and b) and Ni(OH)2-modified carbon cloth that results from
electrodeposition from a Ni(II)cyclam precursor solution at concentration of 23 mM (c and d),
15 mM (e) and 6 mM (f). ......................................................................................................... 209
Figure 10.7 a. Tafel slope for carbon cloth (green), Ni(OH)2 -6 mM precursor (navy), Ni(OH)2 -15 mM
precursor (red) and Ni(OH)2 -23 mM precursor (black) with a scan rate of 1 mV s-1 measured in
PBS buffer (1 M). b-d. CV in the region of 0.1-0.2 V vs. RHE plotted against scan rate and
linear regression for the Cdl estimation with 23mM, 15 mM and 6 mM Ni(II)cyclam. Scan rate:
130 mV/s (orange), 100 mV/s (blue), 80 mV/s (navy), 50 mV/s (green), 30 mV/s (black), and
10 mV/s (red). .......................................................................................................................... 210
Figure 10.8 EDS spectrums of (a) unmodified carbon cloth, (b) Ni(OH)2 modified carbon cloth. Pd and Au
peaks results from the metal pre-treatment of the samples prior to SEM collection. .............. 212
Figure 10.9 Current density of the MEC with modified carbon cloth with Ni(OH)2 (23 mM Ni(II)cyclam
(black), 15 mM (green), and 6 mM (pink)), Ni(OH)2 from Ni(II)Cl2·6H2O (orange) or Pt (red)
and unmodified carbon cloth (blue) at an applied voltage of 0.8 V. ....................................... 213
1
Chapter 1 Introduction
1.1 Water Scarcity and Wastewater Treatment
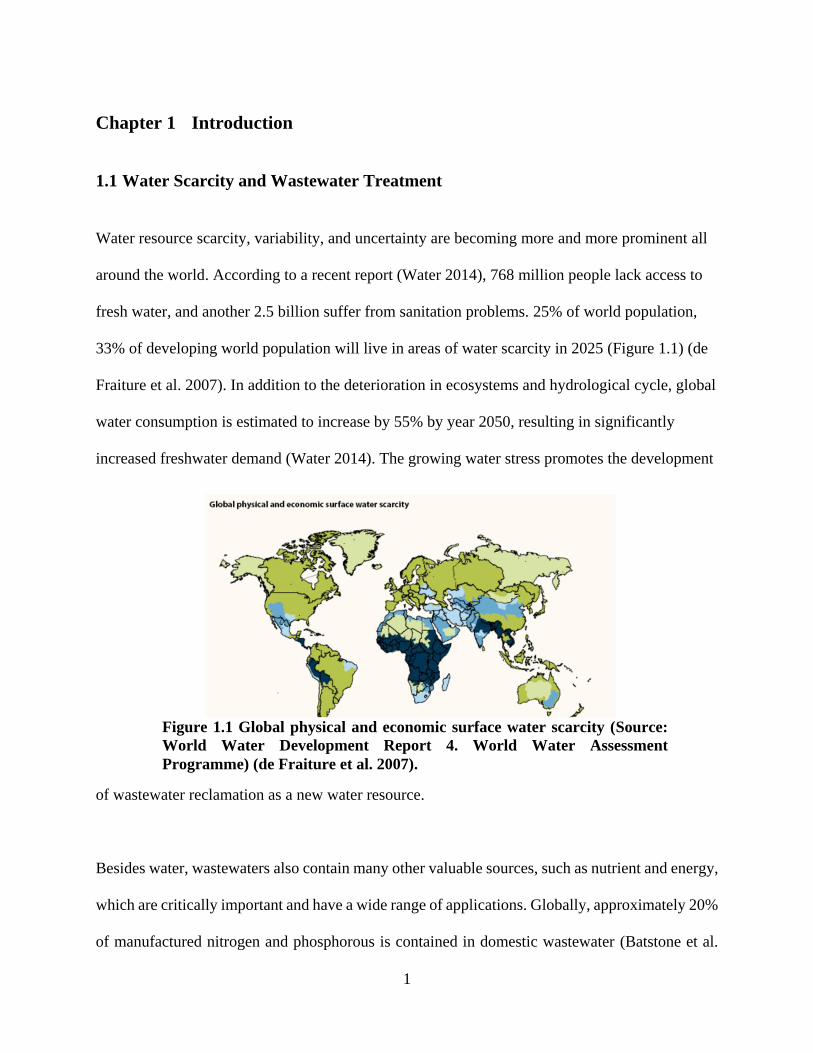
Water resource scarcity, variability, and uncertainty are becoming more and more prominent all
around the world. According to a recent report (Water 2014), 768 million people lack access to
fresh water, and another 2.5 billion suffer from sanitation problems. 25% of world population,
33% of developing world population will live in areas of water scarcity in 2025 (Figure 1.1) (de
Fraiture et al. 2007). In addition to the deterioration in ecosystems and hydrological cycle, global
water consumption is estimated to increase by 55% by year 2050, resulting in significantly
increased freshwater demand (Water 2014). The growing water stress promotes the development
of wastewater reclamation as a new water resource.
Besides water, wastewaters also contain many other valuable sources, such as nutrient and energy,
which are critically important and have a wide range of applications. Globally, approximately 20%
of manufactured nitrogen and phosphorous is contained in domestic wastewater (Batstone et al.
Figure 1.1 Global physical and economic surface water scarcity (Source:
World Water Development Report 4. World Water Assessment
Programme) (de Fraiture et al. 2007).

2
2015, Matassa et al. 2015a), of which the majority is potentially recoverable due to urban
concentration. The situation is more attenuated for energy. Wastewater contains 1.3 MJ/person/day
of chemical energy (Batstone et al. 2015). This represents 1% of the current world total energy
consumption, or 4% of the world total electricity production, and requires a process to convert it
from dilute chemical energy to a usable form (Puyol et al. 2016).
Nutrient, Energy, and Water (NEW) recovery from wastewater has been accomplished in separate
processes such as anaerobic digestion (energy), struvite recovery (nutrient) and membrane
treatment (water), but each of them has application challenges. For example, anaerobic digestion
is usually not applied to low-strength wastewater or small-volume wastewater, struvite recovery
is essentially a phosphorus recovery process and ammonia is not efficiently recovered, and
pressure-driven membrane treatment is an energy-intensive process. Therefore, there is a strong
need for innovative treatment technologies that can accomplish NEW recovery in a resource- and
energy-efficient way.
1.2 Introduction to Bioelectrochemical system
Bioelectrochemical system (BES) is a group of technologies that relies on the interaction between
microorganisms and electrode (Rabaey et al. 2009). In a BES anode, organic compounds in
wastewater are oxidized by the exoelectrogens growing on an anode electrode and the generated
electrons spontaneously flow from the anode electrode to the cathode electrode, where oxygen is
reduced to water (oxygen reduction reaction) (Rabaey and Verstraete 2005). Ion exchange
membranes such as cation exchange membrane (CEM) or anion exchange membrane (AEM) is
used as the separator between the anode and the cathode, and there have also been membrane-less

3
BES reactors that still need a separator between the electrodes (Li et al. 2011b). A representative
BES is a microbial fuel cell (MFC), which can generate electricity directly from wastewater (Li et
al. 2014b). MFCs can be modified to accomplish various functions such as hydrogen production,
desalination, and heavy metal removal (Figure 1.2A) (Logan and Rabaey 2012, Wang and Ren
2013). In a microbial electrolysis cell (MEC), hydrogen gas or other value-added chemicals can
be produced with a small amount of external power input (Figure 1.2B) (Cheng et al. 2009, Logan
et al. 2008a). A microbial desalination cell (MDC) can achieve desalination of saline water in a
similar way to that of electrodialysis but with much lower energy demand (Figure 1.2C) (Cao et
al. 2009). To produce higher-value products such as pure organic compounds, electrons are used
by microorganisms in the cathode to achieve microbial electrosysthesis (Rabaey and Rozendal
2010).
BES could accomplish direct biological conversion of organic energy into electricity. The process
of transferring electrons to electrode is achieved in anaerobic bacteria respiration by a wide
microbial diversity. The most frequently used model microorganisms
Figure 1.2 Exmaples of BES: A) MFC; B) MEC; and C) MDC.

4
are Shewanella and Geobacter genera (Yang et al. 2012). The microorganisms will, with their
capacity, attempt to maximize their energy gain by selecting the electron acceptor with the highest
potential available. Several mechanisms have been described for extracellular electron transfer
(EET) in the past years, they can be categorized as direct electron transfer and indirect electron
transfer (Figure 1.3) (Rabaey et al. 2009). Direct electron transfer involves membrane bound or
associated enzyme complexes, and may involve conductive pili or pilus-like structures (also called
nanowires). Indirect electron transfer uses organic or inorganic shuttles. The soluble compound is
reduced or oxidized at the cell and subsequently diffuses towards the insoluble electron
acceptor/donor.
Wastewater could be used as a source of fuel for BES, with the benefit of accomplishing
wastewater treatment (Liu et al. 2004). Recent years, BES has been researched on treating
Figure 1.3 Microbial fuel cell architecture (a) and the different types of
microorganisms in an anodic biofilm (b), including exoelectrogens that
transfer electrons by direct contact (green), produce nanowires (purple)
and use endogenous (and therefore self-produced) mediators (blue). other
non-exoelectrogenic bacteria (brown) that live off the products produced
by other bacteria or possibly use mediators or nanowires produced by other
microorganisms can also be present (Logan 2009).

5
wastewater and extracting the waste energy extensively, with the representing technology,
microbial fuel cell (MFC). For example, MFCs may produce up to 1.43 kWh m-3 from a primary
sludge or 1.8 kWh m-3 from a treated effluent (Ge et al., 2013). Theoretically, BES can convert
maximum 100% of chemical energy into electricity. However, there is always some energy lost
through 1) coulombic loss where organics are not converted to electrical current at 100%, and 2)
electrochemical potential or voltage loss. Nevertheless, the reported energy conversion efficiency
for MFC can reach 80% which is much higher than 33% for typical heat engine combustion of
methane gas (Rabaey et al. 2005).
In BES, nitrogen could be removed through bioelectrochemical denitrification or recovered via
ammonium migration driven by electricity generation (Clauwaert et al. 2007, Kuntke et al. 2012).
Nitrogen recovery in BES is considered as an efficient and economical method for nitrogen
removal from wastewater (Kelly and He 2014). When cation exchange membranes (CEMs) are
used (Cheng et al. 2013, Haddadi et al. 2013, Logan et al. 2008b, Rozendal et al. 2006a), the
current is carried by cations such as NH4+ ions moving from the anolyte into the catholyte through
the CEM. The NH4+ ions, once transported into the catholyte, are converted into NH3 molecules
because the catholyte is usually rendered basic by the production of OH−ions therein (Haddadi et
al. 2014, Kim et al. 2008, Kuntke et al. 2012). Some of these NH3 molecules can then be recovered
through gas aeration. This type of process has been demonstrated in various BES including
microbial fuel cells (MFCs) and microbial electrolysis cells (MECs). In MECs, a higher current
density would greatly enhance ammonia recovery (Haddadi et al. 2013), and thus MECs with
external power exhibit a better performance for ammonium recovery than MFCs (Zhang et al.
2014a). It was reported that ammonia can be recovered from ammonium-rich wastewater, such as

6
synthetic wastewater, urine, and swine wastewater (Kim et al. 2008, Kuntke et al. 2011, Kuntke et
al. 2012, Qin and He 2014).
1.3 Introduction to Forward Osmosis
Forward osmosis (FO) is based on the natural phenomenon of osmotic processes, and can extract
clean water from wastewater (Cath et al. 2006). In an FO process (Figure 1.4), water moves across
a semipermeable membrane from high water potential to low water potential, driven by an osmotic
pressure gradient (Zhang et al. 2011a). Draw solutes such as NH3/CO2 and magnetic nanoparticles
can avoid energy-intensive post-treatment processes like reverse osmosis (Ling et al. 2010,
McCutcheon et al. 2005). Fertilizers can also be applied as draw solutes to eliminate the need for
regeneration (Phuntsho et al. 2011). Because of small pore radius (0.25-0.37 nm), FO can achieve
effective rejection of a wide range of contaminants (Coday et al. 2014). The lack of external
pressure input also results in cost-saving and energy-efficient water extraction and low membrane
fouling (Lutchmiah et al. 2014b). Thus, FO is considered as a promising technology for extracting
reusable water from complex wastewater such as landfill leachate (Cath et al. 2005a, Cath et al.
2005b, Cornelissen et al. 2011, Holloway et al. 2007, Zhang et al. 2014d), and dewatering of waste
activated sludge (Chung et al. 2012a, Cornelissen et al. 2008, Zhu et al. 2012).
Figure 1.4 Schematic of forward osmosis (FO).

7
FO can also be applied to produce electric energy in a process called pressure retarded osmosis
(PRO), which takes advantage of increased hydraulic pressure due to water expansion of draw
solution and uses pressurized flow of water to drive a hydro turbine for power production (Achilli
and Childress 2010). The details of FO membrane, limitation, development and potential
applications can be found in various review papers (Cath et al. 2006, Chung et al. 2012b,
Lutchmiah et al. 2014b, Thompson and Nicoll 2011, Zhao et al. 2012). In FO, reversed salt flux
(RSF) is one of the most challenging drawbacks of FO (Chekli et al. 2012). RSF occurs due to a
concentration gradient across an FO membrane, resulting in backward migration of draw solutes
into the feed side. Such reverse migration reduces the driving force for water transport, increases
the operation cost due to loss of draw solutes, and contaminates the feed solution (Cath et al. 2006).
RSF can also result in salt accumulation within the fouling layer on the membrane surface, which
increases the cake-enhanced osmotic pressure and therefore, exhibits a negative impact on the
process efficiency (Boo et al. 2012). The reverse salt flux was influenced by various parameters:
draw solute, solution pH, etc. (Phillip et al. 2010, Yong et al. 2012). Recent studies demonstrated
that the ion transport across FO membrane varied significantly with changes in pH and occurred
fastest at alkaline pH (Arena et al. 2015).
1.4 Osmotic Bioelectrochemical Systems
The individual advantages of BES (e.g., energy recovery and nutrient recovery) and FO (water
recovery) intrigue their cooperation to accomplish NEW recovery, and such cooperation would
also address the disadvantages of each technology (Lu et al. 2014b). Osmotic bioelectrochemical
system (OsBES), an innovative treatment concept, is proposed. An OsBES can accomplish
simultaneous treatment of wastewater and recovery of resources such as nutrient, energy, and water.

8
The synergy between those two technologies lies in the complementing functions in energy
recovery and water/wastewater treatment. With the advantage of effective water extraction, an FO
process can improve water recovery from the treatment by BES. Pressure retard osmosis (PRO)
process may provide BES with sufficient and sustainable energy via water flux. In return, BES can
achieve degradation of contaminants in wastewater, provide source of treated wastewater for
recovery, and harvest valuable products to improve the sustainability of the whole system. A proper
combination of the two may also solve some key issues in each process, such as the supply of draw
solute, reverse solute leakage in the FO, and energy requirement for carrying out certain reactions
in the BES. The first study of BES-FO cooperation appeared in 2011 and proposed a new concept
of osmotic microbial fuel cells (OsMFCs) (Zhang et al. 2011a). Since then, there have been various
studies and efforts to explore the cooperation between BES and FO from different aspects and this
will be explicitly explained in Chapter 217.
The cooperation between BES and FO can be accomplished in two ways depending on the location
of FO membrane, integrated OsBES (internal cooperation) and coupled OsBES (external
cooperation). Integrated OsBES uses FO membrane to replace ion exchange membrane and installs
FO membrane within the BES as a separator between an anode and a cathode. The first OsBES
was created as an integrated system, in the form of OsMFCs (Zhang et al. 2011a). The anolyte
(wastewater) in an OsMFC also acts as the feed solution for the FO process, while a high-
concentration catholyte is used as the draw solution. The feasibility of this OsMFC was
demonstrated by successful water extraction and bioelectricity generation. The concept of OsMFC
was further developed to create osmotic microbial electrolysis cells (OsMECs) and microbial
desalination cells (OsMDCs) (Lee et al. 2015, Zhang and He 2012). In an OsMEC, external power
supply is applied to drive hydrogen evolution reaction in the cathode. In an OsMDC, AEM that

9
separates the anode and the middle compartment is replaced by FO membrane, while CEM is kept
between the cathode and the middle compartment. In this way, saline water in the middle
compartment would function as a draw solution to extract high quality water from the anolyte, and
salts can still be removed driven by electricity generation like that in a conventional MDC.
Coupled OsBES links BES and FO units externally through hydraulic connection. An example of
a coupled OsBES is to connect an MEC to an FO unit for recovering ammonium from a synthetic
wastewater and then applying the recovered ammonium as a draw in the subsequent FO process
(Qin and He 2014, Qin et al. 2016b). In an osmotic membrane bioreactor (OMBR) - MFC system,
the membrane fouling in the OMBR was alleviated by the MFC treatment, and the electricity
generation in the MFC was enhanced due to increased solution conductivity after the OMBR
treatment (Hou et al. 2016). FO-based processes have also been studied as pre-treatment before
BES. For example, an FO unit containing anaerobic acidification converted complex organic
contaminants into short-chain fatty acids and alcohols and also concentrated wastewater, which
was then treated in an MFC for electricity generation (Liu et al. 2017). In addition, MDC-FO
system can be applied for desalination, and the effluent salinity from MDC-FO system is lower
than the maximum contaminant levels of the National Secondary Drinking Water Regulations.
Compared to the integration of MDC and RO (ElMekawy et al. 2014), MDC-FO system might
have lower energy consumption and lower membrane fouling propensity.
10
1.5 Outline
This thesis is composed of eleven chapters. The overall goal is to develop the osmotic
bioelectrochemcial systems and achieve resource recovery from wastewater towards sustainable
wastewater treatment. More specifically, it has the following objectives:
The first objective is to better understand the OsMFCs, which was the first study of BES-FO
cooperation. First, the reason why OsMFC has higher current generation than MFC was investigated.
Experiments were conducted for comparing with a CEM-MFC and under different operating
conditions, and a mathematical model has been developed to predicate the contribution of different
factors of internal resistance to current generation with water flux. Second, effects of current
generation and electrolyte pH on reverse salt flux in OsMFC were addressed. As an FO based
technology, OsMFCs also encounter reverse salt flux (RSF) that is the backward transport of salt
ions across the FO membrane into the treated wastewater. This RSF can reduce water flux,
contaminate the treated wastewater, and increase the operational expense, and thus must be
properly addressed before any possible applications. In this study, we hypothesized that the unique
feature of OsMFCs, electricity generation, could inhibit the reverse salt flux. Third, the ammonium
removal in a laboratory OsMFC towards understanding of the effects of current generation and
water flux on ammonia removal was investigated. Past OsMFC studies focus on recovery of
resources such as electricity and water, but ammonia recovery in OsMFCs has not been
investigated. It will be of great interest to accomplish ammonia recovery in OsMFCs, making
OsMFCs a promising technology for “NEW recovery” (NEW: nutrient, energy and water).

11
The second objective is the development of a mathematical model for ammonia recovery in BES,
which could be helpful for further understanding and optimization of ammonia recovery in BES. While
a general picture of ammonia recovery using BES is emerging, some issues remain open. For
example, the transport of NH4+ ions and NH3 is not fully understood despite their essential role in
ammonia recovery. In addition, whether NH4+ ions move through the CEM via diffusion or
migration is not clear. Another major issue is how the pH in the anolyte and catholyte is regulated
in BES. Resolving the above issues using experimental study alone is difficult due to the challenge
in assessing details of all transport processes in the BES. Numerical modeling can address this
challenge, but most prior modeling of BES focused on power production and organic removal
(Peng et al. 2013, Picioreanu et al. 2007, Ping et al. 2014, Qin et al. 2015, Zeng et al. 2010). In the
only comprehensive model for BES-based ammonia recovery, the transport and chemical reactions
of major species in BES was studied at a steady state (Dykstra et al. 2014c). The predictions of
this model agree qualitatively with experimental observations and they led to critical insight into
the effects of current density and membrane properties on the ammonia recovery. However, the
model has not been validated by detailed comparison with experiments, and studies based on this
model did not cover the issues described above, e.g., the competition of inert ions (i.e., ions that
do not react with other species within the system, e.g., the Na+ ions) with the NH4+ ions for
transport across the CEM cannot be studied using steady state models. Here, we have studied the
ammonia recovery in a representative BES – microbial electrolysis cells, by integrating
experiments with simulations. With this mathematical model, the effects of catholyte aeration rate,
external voltage, and external resistance on both ammonia recovery and energy consumption were
also investigated.
12
The third objective was to develop an MEC-FO system with self-supplied ammonium bicarbonate
draw solute for achieving wastewater treatment and recovery. The MEC was to degrade organic
compounds (in its anode) and recover ammonia (in the cathode) for preparing draw solute for the
following FO treatment, which extracted clean water from the MEC anode effluent. The key
parameters including ammonia recovery and regeneration, organic degradation, electricity
generation, and water flux were investigated. Then the following study explored the potential of
resource recovery from landfill leachate with the MEC-FO system.
The fourth objective was to develop a cost effective alternatives to platinum catalysts in MEC
cathode for hydrogen production. In MEC cathode, the kinetic barriers toward proton reduction
necessitate the use of catalysts to drive hydrogen formation at appreciable rates and low applied
potentials. In this study, a nano-Ni(OH)2 modified cathode was developed by electrodeposition
from a nickel(II) cyclam (cyclam = 1, 4, 8, 11-tetraazacyclotetradecane) precursor and tested in a
bench-scale MEC.
1.6 Attribution
Each coauthor is duly credited for his or her contribution to this work, both in their sharing of
ideas and technical expertise.
Zhen He, Ph.D. Professor of Civil and Environmental Engineering
(Principal Investigator)
Department of Civil and Environmental Engineering, Virginia Polytechnic Institute and State
University. Blacksburg, VA 24061

13
Coauthor of chapters 2-10
Qingyun Ping, Ph.D.
Department of Civil and Environmental Engineering, Virginia Polytechnic Institute and State
University. Blacksburg, VA 24061
Coauthor of chapter 3
Yaobin Lu, Ph.D.
Department of Civil and Environmental Engineering, Virginia Polytechnic Institute and State
University. Blacksburg, VA 24061
Coauthor of chapter 3
Ibrahim M. Abu-Reesh, D.Sc. Professor of Chemical Engineering
Department of Chemical Engineering, College of Engineering, Qatar University, P.O. Box 2713,
Doha, Qatar
Coauthor of chapter 3, 4, 5
Erin A. Hynes
Department of Civil, Architectural, and Environmental Engineering, The University of Texas at
Austin, Austin, TX 78712, USA
Coauthor of chapter 5

14
Ying Liu, Ph.D.
Department of Mechanical Engineering, Virginia Polytechnic Institute and State University.
Blacksburg, VA 24061
Coauthor of chapter 6, 7
Shuai Luo
Department of Civil and Environmental Engineering, Virginia Polytechnic Institute and State
University. Blacksburg, VA 24061
Coauthor of chapter 6, 7
Rui Qiao, Ph.D., Associate Professor
Department of Mechanical Engineering, Virginia Polytechnic Institute and State University.
Blacksburg, VA 24061
Coauthor of chapter 6, 7
Hannah Molitor
Department of Civil and Environmental Engineering, University of Wisconsin-Platteville,
Platteville, WI 53818, United States
Coauthor of chapter 9
Brian Brazil

15
Waste Management, Gaithersburg, MD 20882, United States
Coauthor of chapter 9
John T. Novak
Department of Civil and Environmental Engineering, Virginia Polytechnic Institute and State
University. Blacksburg, VA 24061
Coauthor of chapter 9
William A. Maza, Ph.D.
Department of Chemistry, Virginia Polytechnic Institute and State University, Blacksburg,
Virginia 24061, USA
Coauthor of chapter 10
Bethany M. Stratakes
Department of Chemistry, Virginia Polytechnic Institute and State University, Blacksburg,
Virginia 24061, USA
Coauthor of chapter 10
Spencer R. Ahrenholtz
Department of Chemistry, Virginia Polytechnic Institute and State University, Blacksburg,
Virginia 24061, USA

16
Coauthor of chapter 10
Amanda J. Morris, Ph.D., Associate Professor
Department of Chemistry, Virginia Polytechnic Institute and State University, Blacksburg,
Virginia 24061, USA
Coauthor of chapter 10

17
Chapter 2 Resource Recovery by Osmotic Bioelectrochemical Systems
towards Sustainable Wastewater Treatment
(This section has been published as Qin, M. and He, Z.* (2017) Resource Recovery by Osmotic
Bioelectrochemical Systems towards Sustainable Wastewater Treatment. Environmental
Science: Water Research & Technology, 3, 583-592.)
Abstract
Recovering valuable resources from wastewater will transform wastewater management from a
treatment focused to sustainability focused strategy, and creates the need for new technology
development. An innovative treatment concept - osmotic bioelectrochemical system (OsBES),
which is based on cooperation between bioelectrochemical systems (BES) and forward osmosis
(FO), has been introduced and studied in the past few years. An OsBES can accomplish
simultaneous treatment of wastewater and recovery of resources such as nutrient, energy, and water
(NEW). The cooperation can be accomplished in either an internal (integrated OsBES) or external
(coupled OsBES) configuration, through a strong synergy between BES and FO. BES can provide
draw solute, perform pre-treatment, or reduce reverse salt flux to help with FO operation; while
FO can achieve water recovery, enhance current generation, and supply energy sources to BES
operation. Given much progress and interest in the OsBES, this paper has reviewed the past studies,
described the current status, presented qualitative and quantitative analyses, and discussed the
perspectives of the OsBES technology with a focus on NEW recovery from wastewater. The
challenges for further researching and developing OsBES have also been identified.

18
2.1 Introduction
Increasing global energy demands and the threat of fossil-fuel depletion, environmental pollution,
shortage of water and other resources are driving intensive efforts towards developing new
technologies for sustainable treatment and utilization of wastewater (Hoffert et al. 2002).
Wastewaters contain many valuable sources and among them, three key resources - Nutrient,
Energy and Water (“NEW”), are critically important and have a wide range of applications,
especially in the food production. NEW recovery has been accomplished in separate processes
such as anaerobic digestion (energy), struvite recovery (nutrient) and membrane treatment (water),
but each of them has application challenges. For example, anaerobic digestion is usually not
applied to low-strength wastewater or small-volume wastewater, struvite recovery is essentially a
phosphorus recovery process and ammonia is not efficiently recovered, and pressure-driven
membrane treatment is an energy-intensive process. Therefore, there is a strong need for
innovative treatment technologies that can accomplish NEW recovery in a resource- and energy-
efficient way.
Bioelectrochemical system (BES) and forward osmosis (FO) are two state-of-the-art
water/wastewater technologies that may play important roles in addressing the challenges of NEW
recovery. BES emerges as an attractive treatment concept for energy-efficient wastewater
Figure 2.1 Number of published journal articles about OsBES since the first OsBES paper.
19
treatment with direct electricity production from wastewater through microbial oxidation of
organic contaminants (Wang and Ren 2013). A typical BES contains anode and cathode electrodes,
and can be used to generate electricity, produce hydrogen, desalinate saline water, or accomplish
other functions. FO is an emerging membrane technology that can extract high-quality water from
various water sources (Lutchmiah et al. 2014b). FO allows water to move across a semipermeable
membrane from a high water potential zone to a low water potential zone (Shaffer et al. 2015).
The individual advantages of BES (e.g., energy recovery and nutrient recovery) and FO (water
recovery) intrigue their cooperation to accomplish NEW recovery, and such cooperation would
also address the disadvantages of each technology (Lu et al. 2014b). For example, FO is
concentrating wastewater instead of degrading contaminants, and thus the remaining concentrates
from the feed side of FO still require post-treatment (Achilli et al. 2009). Although integration of
pressure-drive membrane processes such as ultrafiltration and reverse osmosis membrane into BES
can help achieve water recovery (ElMekawy et al. 2014, Yuan and He 2015), it also increases the
energy demand by operating membrane processes.
The first study of BES-FO cooperation appeared in 2011 and proposed a new concept of osmotic
microbial fuel cells (OsMFCs) (Zhang et al. 2011a). Since then, there have been various studies
and efforts to explore the cooperation between BES and FO from different aspects (Figure 2.1).
Herein we use osmotic bioelectrochemical system (OsBES) to represent the BES-FO cooperation
system. The increasing interest in OsBES and the potentially important role of this technology in
NEW recovery create a need for overview of its research and development. This paper aims to
provide a timely review of OsBES and summary of the current status of research efforts with a
focus on NEW recovery. The basic principles of BES/FO, configurations of OsBES, and mutual
20
benefits are described. The challenges and perspectives of NEW recovery by using OsBES have
been identified and discussed.
2.2 Technological Principles
2.2.1 Bioelectrochemical System (BES)
BES relies on the interaction between microorganisms and solid electron acceptors (anode) or
donors (cathode) (Logan et al. 2006). In a BES anode, organic compounds in wastewater are
oxidized by the exoelectrogens growing on an anode electrode and the generated electrons
spontaneously flow from the anode electrode to the cathode electrode, where oxygen is reduced to
water (oxygen reduction reaction) (Figure 2.2A) (Rabaey and Verstraete 2005). Ion exchange
membranes such as cation exchange membrane (CEM) or anion exchange membrane (AEM) is
used as the separator between the anode and the cathode, and there have also been membrane-less
BES reactors that still need a separator between the electrodes (Li et al. 2011b). A representative
BES is a microbial fuel cell (MFC), which can generate electricity directly from wastewater (Li et
al. 2014b). MFCs can be modified to accomplish various functions such as hydrogen production,
desalination, and heavy metal removal (Logan and Rabaey 2012, Wang and Ren 2013). In a
microbial electrolysis cell (MEC), hydrogen gas or other value-added chemicals can be produced
with a small amount of external power input (Cheng et al. 2009, Logan et al. 2008a). A microbial
desalination cell (MDC) can achieve desalination of saline water in a similar way to that of
electrodialysis but with much lower energy demand (Cao et al. 2009). To produce higher-value
products such as pure organic compounds, electrons are used by microorganisms in the cathode to
achieve microbial electrosysthesis (Rabaey and Rozendal 2010). More details about BES,
including the substrates, materials, microbiology, and different system can be found in various

21
review papers (Hamelers et al. 2010, Li et al. 2014b, Logan et al. 2006, Rabaey and Verstraete
2005, Schröder et al. 2015, Wang and Ren 2013).
2.2.2 Forward Osmosis (FO)
FO is based on the natural phenomenon of osmotic processes, and can extract clean water from
wastewater or saline water (Cath et al. 2006, Lutchmiah et al. 2014b). In an FO process, only water
molecules can transport across the semi-permeable FO membrane, driven by an osmotic pressure
gradient (Figure 2.2B) (Shaffer et al. 2015). Water flux is determined by the osmotic pressure
gradient, and draw solutes will play a key role in creating the osmotic pressure difference. Draw
solutes such as NH3/CO2 and magnetic nanoparticles can avoid energy-intensive post-treatment
processes like reverse osmosis (Ling et al. 2010, McCutcheon et al. 2005). Fertilizers can also be
applied as draw solutes to eliminate the need for regeneration (Phuntsho et al. 2011). Because of
small pore radius (0.25-0.37 nm), FO can achieve effective rejection of a wide range of
contaminants (Coday et al. 2014). The lack of external pressure input also results in cost-saving
and energy-efficient water extraction and low membrane fouling (Lutchmiah et al. 2014b). FO has
been studied to extract reusable water from complex wastewater such as landfill leachate and
dewatering of waste activated sludge (Cath et al. 2006). FO can also be applied to produce electric
energy in a process called pressure retarded osmosis (PRO), which takes advantage of increased
hydraulic pressure due to water expansion of draw solution and uses pressurized flow of water to
drive a hydro turbine for power production (Achilli and Childress 2010). The details of FO
membrane, limitation, development and potential applications can be found in various review
papers (Cath et al. 2006, Chung et al. 2012b, Lutchmiah et al. 2014b, Thompson and Nicoll 2011,
Zhao et al. 2012).

22
In this study, we have investigated the relationship between the inter-membrane distance and HRT
in a bench-scale MDC with different initial salinities or inter-membrane distances. At the same
influent flow rate, six different inter-membrane distances ranging from 0.3 to 2.5 cm were tested,
resulting in different HRTs but the same water production rate (mL/min). We also analyzed the
contributions to conductivity reduction by electric current and water osmosis (water flux into the
middle chamber). We studied the effect of different HRTs at the same inter-membrane distances,
and the effects of different inter-membrane distances at the same HRTs.
2.3 Cooperation between BES and FO
2.3.1 Configurations
The cooperation between BES and FO can be accomplished in two ways depending on the location
of FO membrane, integrated OsBES (internal cooperation) and coupled OsBES (external
cooperation). Integrated OsBES uses FO membrane to replace ion exchange membrane and installs
FO membrane within the BES as a separator between an anode and a cathode (Figure 2.3A). The
first OsBES was created as an integrated system, in the form of OsMFCs (Zhang et al. 2011a). The
anolyte (wastewater) in an OsMFC also acts as the feed solution for the FO process, while a high-
concentration catholyte is used as the draw solution. The feasibility of this OsMFC was
demonstrated by successful water extraction and bioelectricity generation. The concept of OsMFC
Figure 2.2 Schematics of (A) bioelectrochemical system (BES) and (B) forward osmosis (FO).

23
was further developed to create osmotic microbial electrolysis cells (OsMECs) and microbial
desalination cells (OsMDCs) (Lee et al. 2015, Zhang and He 2012). In an OsMEC, external power
supply is applied to drive hydrogen evolution reaction in the cathode (Figure 2.3B). In an OsMDC,
AEM that separates the anode and the middle compartment is replaced by FO membrane, while
CEM is kept between the cathode and the middle compartment (Figure 2.3C). In this way, saline
water in the middle compartment would function as a draw solution to extract high quality water
from the anolyte, and salts can still be removed driven by electricity generation like that in a
conventional MDC.
Coupled OsBES links BES and FO units externally through hydraulic connection (Figure 2.3D).
An example of a coupled OsBES is to connect an MEC to an FO unit for recovering ammonium
from a synthetic wastewater and then applying the recovered ammonium as a draw in the
subsequent FO process (Figure 2.3E) (Qin and He 2014, Qin et al. 2016b). In an osmotic membrane
Figure 2.3 Configurations and examples of the cooperation between BES and FO: (A)
integrated OsBES; (B) an example of integrated OsBES: OsMFC; (C) another example of
integrated OsBES: OsMDC; (D) coupled OsBES; (E) an example of coupled OsBES: MEC-
FO; and (F) another example of coupled OsBES: MFC-OMBR.

24
bioreactor (OMBR) - MFC system, the membrane fouling in the OMBR was alleviated by the
MFC treatment, and the electricity generation in the MFC was enhanced due to increased solution
conductivity after the OMBR treatment (Figure 2.3F) (Hou et al. 2016). FO-based processes have
also been studied as pre-treatment before BES. For example, an FO unit containing anaerobic
acidification converted complex organic contaminants into short-chain fatty acids and alcohols
and also concentrated wastewater, which was then treated in an MFC for electricity generation
(Liu et al. 2017). In addition, MDC-FO system can be applied for desalination, and the effluent
salinity from MDC-FO system is lower than the maximum contaminant levels of the National
Secondary Drinking Water Regulations. Compared to the integration of MDC and RO (ElMekawy
et al. 2014), MDC-FO system might have lower energy consumption and lower membrane fouling
propensity.
2.3.2 Mutual Benefits
The cooperation between BES and FO, either integrated or coupled, can accomplish the recovery
of valuable resources such as energy, water, and nutrient (more details in the section 2.4). This
cooperation can also create mutual benefits that strengthen each of the unit in this system (Figure
2.4). As mentioned earlier, an OMBR and an MFC could benefit each other in terms of enhancing
electricity generation and reducing membrane fouling (Hou et al. 2016). Enhancing electricity
Figure 2.4 Mutual benefits between BES and FO in OsBES.

25
generation by FO has already been demonstrated in the first OsMFC study, which showed that the
OsMFC generated more electricity than a regular MFC containing CEM (Zhang et al. 2011a). The
reason for the higher current generation in the integrated OsBES was interpreted from two aspects:
ion transport and system resistance. Water flux, a unique feature of the OsBES (compared to the
regular BES), can promote ion transport from the anolyte to the catholyte, thereby reducing
electrolyte resistance (Zhang et al. 2011a, Zhu et al. 2015). The lower system resistance of the
OsBES also benefits from the concentrated anolyte (due to water flux) and lower FO membrane
resistance. A mathematical model has been developed to explain the low internal resistance of an
OsMFC, and the results revealed that a lower resistance of FO membrane than that of CEM played
an important role in decreasing overall internal resistance of the OsMFC, thereby resulting in more
electricity generation (Qin et al. 2015). A special FO reactor - pressure retarded osmosis (PRO),
which can generate electric energy from hydraulic pressure due to water flux, was employed to
provide external power to an MEC for hydrogen production (Yuan et al. 2015b). A mathematical
model predicated that at 0.9 V, the energy requirement by the MEC would reach the maximum
energy production by the PRO.
Several studies have found that BES can also benefit FO. A key issue with FO operation is reverse
solute flux (RSF), which causes the loss of draw solute and creates problems of reduced water flux
and post-disposal of the accumulated salts in the feed. It was reported that bioelectricity generation
in an OsMFC could significantly reduce RSF. When the total Coulomb production increased from
zero (open circuit) to 311 C, RSF was reduced from 16.3 ± 2.8 to 3.9 ± 0.7 gMH (Qin et al. 2016a).
Electrically-driven migration was identified to be a more important factor to RSF reduction than
diffusion-driven migration. BES can also provide draw solute to FO. In an MEC-FO system, the
26
MEC recovered ammonium from a high-strength synthetic wastewater and the recovered
ammonium was then applied as a draw solute (in the form of NH4HCO3) in the following FO unit
that extracted water from the MEC effluent (Qin and He 2014). This system has also been
investigated for recovering ammonium from landfill leachate and reducing the volume of the
treated leachate through FO using recovered ammonium (Qin et al. 2016b).
2.4 NEW Recovery in OsBES
2.4.1 Energy Recovery
Energy recovery in an OsBES is mainly from the BES-based unit, because BES can produce
electricity or hydrogen gas from organic wastes. Energy can be described by using normalized
energy recovery (NER), which is energy production per either the volume of the treated wastewater
or the removed organics (e.g., chemical oxygen demand - COD) (Ge et al. 2013a). Like BES
studies, many OsBES studies do not report energy data; only power density data are presented. To
better understand BES/OsBES performance and identify their application niches, energy data must
be included (He 2017). Table 2.1 summarizes the studies that either reported energy data or
provided sufficient information that we could use to estimate energy recovery. It should be noted
that we tend not to make comparison between different studies, because of the difference in reactor
configurations and operation. One can see that the NER of the OsBES varies from 0.001 to 0.1
kW h m-3 wastewater, and such variation is related to the different OsBES configurations,
operation conditions, and organic loading rates.

27
Table 2.1 Summary of the OsBES studies for energy recovery.
Although OsBES can generate energy, the data of energy recovery alone is not particularly useful
because the operation of an OsBES is also consuming energy at the same time. If the recovered
energy is smaller than the consumed energy, external energy input will still be needed to operate
an OsBES. Thus, establishing an energy balance for an OsBES is cortically important to
understand the energy benefit. Unfortunately, even fewer studies reported energy consumption of
their OsBES. Figure 2.5 shows the examples of energy recovery and consumption in an integrated
System Configuration Substrate CODr a Pmaxb Ec ET
d References
OsMFC Integrated Acetate 4.74 W m−3 0.001 0.016 (Zhang et al.
2011a)
OsMFC Integrated Acetate (Ge and He
2012)
OsMDC Integrated Acetate (Zhang and
He 2012)
OsMFC Integrated Acetate 82.5% 28.2 W m−3 0.677 (Ge et al.
2013b) Primary effluent 74.8% 4.5 W m−3 0.003-0.005 0.027-0.108
OsMFC Integrated Acetate 90.0% 43 W m−3 (Werner et
al. 2013)
OsMFC Integrated Acetate (Zhang and
He 2013a)
OsMFC Integrated Glucose 89.8% 27.38 W m−3
0.164 (Pardeshi
and
Mungray
2014)
OsMFC Integrated Domestic wastewater 85–90% 48.52 mW m−2
0.051 (Ismail and
Ibrahim
2015)
OsMEC Integrated Acetate (Lee et al.
2015)
OsMFC Integrated Acetate 0.018-0.093 (Qin et al.
2015)
MEC-FO Coupled Glucose 60.6% (Qin and He
2014)
MEC-PRO Coupled Acetate ~80% (Yuan et al.
2015b)
OsMFC Integrated Acetate (Yang et al.
2015b)
OsMFC Integrated Acetate ~0.6 W m−2 0.012 (Yang et al.
2015a)
OsMFC Integrated Acetate 12.57 W m−3 0.352 (Zhu et al.
2015)
OsMFC Integrated Acetate 61.5 mWm-2 (Yang et al.
2016a)
OsMFC Integrated Acetate 16 W m−3 0.06-0.1 1.6 (Zhu et al.
2016)
MFC-OMBR Coupled Acetate 11.5 W m−3 0.276 (Hou et al.
2016)
FO-MDC Coupled Acetate 70.6% (Yuan et al.
2016)
AAFO-MFC Coupled Acetate 4.38 W m−3 0.105 (Liu et al.
2017)
a COD removal efficiency; b Maximum power density; c Energy production (kWh m-3); d Theoretical energy production (kWh m-3) based on the maximum power density.

28
OsBES and a coupled OsBES. The OsMFC generated 0.093 kWh m-3 treated water as electricity
but consumed 0.81 kWh m-3 treated water; 97.4% of energy consumption was due to the catholyte
aeration (Figure 2.5A). Overall, the OsMFC had a negative energy balance of 0.717 kWh m-3.(Qin
et al. 2015) In the coupled OsBES (MEC-FO), energy was recovered as hydrogen gas, which could
be converted to a NER of 0.36 kWh m-3 treated water (Figure 2.5B) (Zou et al. 2017). The energy
consumption of this system was 1.26 kWh m-3 treated water, 94.4% by the MEC external power
supply, 4.8% due to the MEC electrolyte recirculation, and 0.8% by the FO process. The generated
hydrogen gas could supply up to 28.7 ± 1.5 % of total energy demand.
Despite negative energy balances in both of the above examples, those analyses have helped us to
better understand the energy picture of an OsBES towards its optimization. Some OsBES were not
operated under the condition of the maximum power output (which would lead to more energy
production). As shown in Table 1, the theoretical energy generation calculated from the maximum
current density can be much higher than that calculated from the actual current generation. Thus,
optimizing power output will be an effective approach to improve energy recovery. There are also
Figure 2.5 Examples of energy recovery and consumption in the OsBES: (A) an OsMFC
treating synthetic municipal wastewater; (B) an MEC-FO system treating synthetic
sidestream centrate.

29
methods to reduce energy consumption towards a neutral or even positive energy balance. For
example, aeration was identified as the dominant energy consumer in the OsMFC (Figure 2.5A),
and replacing active aeration with passive aeration (e.g., air cathode BES) or precisely controlled
aeration such as membrane aeration can reduce related energy consumption (Werner et al. 2013,
Yang et al. 2016c). Conventional air cathode will not be suitable for an OsBES, because a catholyte
is required to act as a draw solution; a flowing-over cathode may provide passive aeration to an
OsBES but this needs experimental investigation (Clauwaert et al. 2009). In the MEC-FO system
(Figure 2.5B), external power supply was the main energy consumer, and this consumption may
be reduced by decreasing the external voltage or using renewable source of energy. For example,
in the previously mentioned MEC-PRO system (a coupled OsBES), the external voltage for the
MEC was provided by the PRO (Yuan et al. 2015b).
2.4.2 Water Recovery
Extraction of high-quality water via forward osmosis is a distinct feature of an OsBES compared
with a conventional BES. The first OsBES study has provided a strong experimental evidence that
the OsMFC achieved water flux of 3.94 ± 0.22 LMH (liters per square meter FO membrane per
hour) with a 116-g NaCl L-1 catholyte, while there was no obvious water flux in a conventional
MFC (Figure 2.6A) (Zhang et al. 2011a). More than 50% of the treated wastewater could be
extracted as clean water from various types of wastewater (Ge et al. 2013b, Ismail and Ibrahim
2015). That is, by using the OsBES technology, half of the wastewater can be potentially reused,
instead of being discharged.
A key factor to water recovery in the OsBES is draw solute, and an ideal draw solute should
possess a certain ability of pH buffering (in response to pH increase due to cathodic reduction
30
reactions) and have a high conductivity (creating a high osmotic pressure) (Ge and He 2012). In
addition, low cost and non-fouling formation are also important features. Several representative
draw solutions have been examined in an OsMFC for water flux, and phosphate buffer saline
resulted in the best performance; although glucose could act as a draw solute, it led to little current
generation in the OsMFC because of no conductivity (Ge and He 2012). Table 2.2 summarizes the
studies with various draw solutes, and one can see that NaCl is the most commonly used draw
solute, which could provide both osmotic pressure gradient and catholyte conductivity. This
encourages the exploration of using seawater as a catholyte in the OsMFC, and the diluted seawater
(due to water recovery) can be further desalinated (Zhang and He 2013a). In the case of seawater
draw solute, there is no need to regenerate draw solute, greatly saving the operational cost. Other
non-regenerated draw solutes include fertilizers (Phuntsho et al. 2011, Phuntsho et al. 2012). In
many other cases, regeneration of draw solutes is necessary and then low-energy regeneration will
be critical to maintain a low energy demand. Examples of such draw solutes include ammonium
biocarbonate (which can be regenerated by low heat), hydrogels (regenerated under a range of
stimuli, such as temperature, light, pressure, and sound) and magnetic nanoparticles nanoparticles
(regenerated by magnetic field) (Akther et al. 2015, Li et al. 2011a, Ling et al. 2010, McCutcheon
et al. 2005, Shaffer et al. 2015).

31
Other factors that affect water recovery include membrane fouling and liquid recirculation rate.
Fouling is an inevitable phenomenon in a membrane-based process. As water permeates the
membrane, foulants accumulate on the membrane surface, forming a cake layer, which creates
hydraulic resistance and reduce the driving force for water recovery (Hoek and Elimelech 2003).
It has been shown that that fouled membrane could significantly reduce water flux compared to
the pristine membrane in an OsMFC (Figure 2.6B) (Zhu et al. 2016). Periodic cleaning of FO
membrane, regeneration of catholyte and replacement of anolyte could be effective for relieving
the membrane fouling and achieving continuing water recovery. Typical FO operations are
performed with a very high recirculation rate that creates a shear force to hinder foulants from
accumulating on the membrane surface and reduce the external concentration polarization (Boo et
al. 2013). The liquid recirculation rates in an OsBES are usually much lower than that of typical
FO (cross-flow velocity: 0.01-0.02 m s-1 in the OsBES vs. 10-30 m s-1 in the FO) (Lee et al. 2010,
Yuan et al. 2015b, Zhang et al. 2011a) and in the presence of electrodes and biofilm, a high
Figure 2.6 Water recovery in the OsBES: (A) an OsMFC generates higher current
than a conventional MFC at different concentrations of NaCl draw solution; and
(B) fouled FO membrane greatly reduces water flux compared to pristine
membrane.

32
a Draw solution concentration; b in the unit “LMH”; c [CH; polycation]
Theoretical energy production (kWh m-3) based on the maximum power density.
Summary of the OsBES studies for energy recovery.
Examples of energy recovery and consumption in the OsBES: (A) an OsMFC treating synthetic municipal wastewater; (B) an MEC-FO system treating synthetic sidestream
centrate. Data from refs 36, 41.
Table 2.2 Summary of the OsBES studies for water recovery
recirculation rate may not be possible or could wash biofilm off the electrodes. Therefore, it is
expected that water recovery in OsBES will be lower than that of traditional FO systems.
2.4.3 Nutrient Recovery
Both BES and FO have been studied for nutrient removal and recovery. In BES, ammonia nitrogen
can be removed and recovered driven by electricity generation (Kelly and He 2014), and
phosphorous is recovered through precipitation by taking advantage of high pH as a result of
cathodic reduction reactions (Zang et al. 2012). FO can concentrate the target compounds such as
phosphate in wastewater and thus increase the probability of recovery (Ansari et al. 2017). As an
inheritor of both BES and FO, the OsBES is expected to have a function of nutrient recovery.
System Configuration Membrane type Draw solute DS a Water flux b References
OsMFC Integrated CTA NaCl 20-116 g L-1 1.2-2.8 (Zhang et al. 2011a)
OsMFC Integrated CTA NaCl 1 M 1.82 (Ge and He 2012)
CaCl2 1 M 0.56
PBS buffer 1 M 2.42
Glucose 1 M 1.82
OsMDC Integrated CTA NaCl 5-20 g L-1 0.29-0.69 (Zhang and He 2012)
OsMFC Integrated CTA NaCl 2 M 1.11-1.49 (Ge et al. 2013b)
OsMFC Integrated CTA NaCl 35 g L-1 1.5-5.8 (Werner et al. 2013)
OsMFC Integrated CTA NaCl 10-50 g L-1 0.3-0.8 (Zhang and He
2013a)
OsMFC Integrated Chitosan c + PAAc NaCl 2 M 18.4-34.4 (Pardeshi and
Mungray 2014)
OsMFC Integrated CTA Oil produced water
1.8-4.1 (Ismail and Ibrahim
2015)
OsMEC Integrated CTA PBS 24 g L-1 (Lee et al. 2015)
OsMFC Integrated CTA NaCl 35 g L-1 2.3 (Qin et al. 2015)
MEC-FO Coupled CTA NH4HCO3 0.8 M 3.0 (Qin and He 2014)
MEC-PRO Coupled CTA NaCl 0.1-2.0 M 0.5-1 (Yuan et al. 2015b)
OsMFC Integrated CTA NaCl 35 g L-1 1.3-4.1 (Yang et al. 2015b)
OsMFC Integrated CTA NaCl 35 g L-1 (Yang et al. 2015a)
OsMFC Integrated TFC NaCl 1 M 1-6 (Zhu et al. 2015)
OsMFC Integrated CTA NaCl 35 g L-1 2.33 (Yang et al. 2016a)
OsMFC Integrated TFC NaCl 1 M 3.25±0.60 (Zhu et al. 2016)
MFC-OMBR Coupled TFC NaCl 0.5 M 2.0-12.0 (Hou et al. 2016)
FO-MDC Coupled CTA NaCl 35 g L-1 0.64-0.99 (Yuan et al. 2016)
AAFO-MFC Coupled TFC NaCl 5 M 2.33-5.62 (Liu et al. 2017)
33
Surprisingly the related studies are very limited. A recent study reported, for the first time, that an
OsMFC could effectively remove ammonium nitrogen, although the recovery was not investigated
(Qin et al. 2017). It was found that current generation and water flux were two key factors to drive
ammonium movement across FO membrane. Current generation could greatly enhance the
removal efficiency from 40.7 ± 2.4 % to 85.3 ± 3.5 % when the current density increased from 0
to 1.8 ± 0.1 A m-2. Water flux could facilitate the ammonium removal from wastewater. In a
coupled OsBES (MEC+FO), the recovered ammonia in the MEC was applied as a draw solute for
water recovery in the FO process (Qin and He 2014), and this system was further studied to include
phosphorus recovery as struvite (MgNH4PO4•6H2O) (Zou et al. 2017). In a closed-loop mode, this
coupled OsBES achieved the recovery of 54.2 ± 1.9 % of water, 99.7 ± 13.0 % of net ammonium
nitrogen, and 79.5 ± 0.5 % of phosphorus as struvite (Zou et al. 2017). Ammonium loss primarily
from RSF in the FO was fully compensated by the reclaimed ammonium under extended N2
stripping. In another coupled OsBES (MRC-OMBR), both nitrogen and phosphorus was recovered
by taking advantage of the electrical potential generated across the anode and the cathode in the
MRC and the charged ions such as NH4+, PO4
3- and salts were extracted from the OMBR bulk
solution. This system could effectively recover up to 65% PO43- and 45% NH4
+ from the synthetic
wastewater.
2.5 Perspectives and Challenges
2.5.1 Potential Applications
An OsBES may be applied to recover valuable resources with simultaneous treatment of various
wastewaters including both low strength (e.g., municipal wastewater) and high strength (e.g., side
stream, food/beverage wastewater, livestock wastewater, and landfill leachate). However, the
strategies and goal of the applications will differ, because of different characteristics of

34
wastewaters. The application to treat low strength wastewater will need to focus on energy-
efficient treatment and water recovery. Energy recovery from low strength wastewater is still
important, but its primary goal will be to help achieve energy-neutral treatment. Nutrient recovery
may not be feasible, due to very low concentrations of both nitrogen and phosphorus in low
strength wastewater. Treating low strength wastewater will require a large volume of the reactor
to obtain a low hydraulic retention time (HRT), thereby creating more challenge in system scaling
up. But an OsBES can achieve very good treatment efficiency with low strength wastewater. For
example, an OsMFC achieved COD removal efficiency of 82.5 ± 9.0 % and recovered up to 70%
of water (Ge et al. 2013b). An MFC-OMBR system exhibited excellent removal of organic (>95%)
and phosphorus (>99%) and could maintain an effluent COD concentration below 20 mg L-1 (Hou
et al. 2016).
High-strength wastewater contains high concentrations of organic matters and nutrients, and will
be suitable for simultaneous NEW recovery. A prior study has examined the NEW recovery from
a synthetic sidestream and achieved effective recovery of water, ammonium nitrogen, and
phosphorus (Zou et al. 2017). A challenge of treating high strength wastewater by using an OsBES
is the potential competition with anaerobic digestion, which is a mature and efficient technology
for biogas production. Some high strength wastewaters such as side stream contain a large amount
of solids that may not be suitable for treatment in a system containing electrodes like an OsBES.
Thus, synergistic linkage between anaerobic digestion and OsBES may benefit each other: in such
a linkage, anaerobic digestion treats high-solid wastewater and generates biogas, and the OsBES
further treats the effluent from digestion for nutrient recovery and reducing the volume of
wastewater discharge (via water recovery). The ammonia recovery in an OsBES could also

35
counteract the ammonia inhibition for anaerobic digestion process (Zhang and Angelidaki 2015a,
b).
The application of the coupled OsBES will need to address a key issue of system coordination
between its BES unit and FO unit. BES is a biological process and tends to be slow, while FO is a
physical process and usually fast. The difference in the treatment speed between the two creates
the issue of coordinating the treatment capacities. In a previous study of a coupled OsBES (MEC-
FO), the HRT of an MEC that was used for energy and ammonia recovery was 48 h while the FO
unit required only 5 h to complete water recovery (Qin and He 2014). As a result, the FO unit was
on standby most of the operation time and its treatment capacity would be wasted. Such
discrepancy may be solved by increasing the treatment speed of the BES unit (e.g., through
optimizing BES operation and materials), or by reducing the size of the FO unit so that a
continuous supply of BES effluent can be achieved.
2.5.2 Recovery of Other Resources
In addition to NEW, wastewaters also contain other types of resources or can be used to create
value-added resources. Some wastewaters such as metal industry wastewater and landfill leachate
have high concentrations of various metal ions, and recovering those metals will avoid
environmental pollution and reduce the raw material consumption for producing metals. BES
offers an attractive approach for both oxidation and reduction reaction oriented processes and
therefore, can be used for effective metal recovery (Wang and Ren 2014). Metals such as Au (III),
V (V), Cr (VI), Ag (I), Cu (II), Fe (III), Hg (II), Pb (II), Cd (II), and Zn (II), can be reduced on the
cathode of a BES and precipitate for further recovery. If metal recovery occurs outside a BES, a
low catholyte pH will be necessary to keep metal in the dissolved form and such pH can also

36
benefit the cathodic reduction reactions. Although there have not been any studies of using an
OsBES for metal recovery, there may be two benefits with the OsBES approach: first, water flux
can facilitate ion transport and thus promote metal ion movement from the anolyte into the
catholyte for separation and recovery; and second, the higher current generation in OsBES could
potentially enhance the metal reduction in the cathode for subsequent recovery. The value-added
biochemical products, such as methane, alcohols, acetate, and hydrogen peroxide, can be generated
in BES and thus may also be produced in OsBES (Kumar et al. 2017). Further separation of those
products from draw solutes will be a challenge to address.
2.5.3 Membrane Fouling
Although membrane fouling in an FO process is generally less severe than that in pressure-driven
membrane processes, it is still an inevitable phenomenon in an OsBES, and can lead to an
additional hydraulic resistance that reduces osmotic pressure and water recovery, thereby
increasing the capital and operational costs. When treating wastewater, the organic fouling due to
the presence of organic matters and microorganisms can become significant (Zhao et al. 2011),
and in this aspect, a coupled OsBES may be more advantageous over an integrated OsBES,
because the BES unit in the coupled OsBES acts as a pre-treatment step and reduces organic
contents in the liquid stream before it enters the FO unit. When fouling occurs, backwash is a
commonly used method to remove foulants and retrieve the FO performance. Membrane fouling
in FO can be almost fully reversible by backwash, due to the loose fouling layer on the membrane
surface in the absence of external pressure (Lee et al. 2010). More severe fouling would require
chemical cleaning, either in situ or ex situ. No matter which cleaning method, the microbial
community in the anode of an integrated OsBES would be adversely affected, for example by a
shock from a high salinity solution or chemical toxicity. To address this problem, membrane

37
fabrication and modification must be advanced to reduce membrane fouling and cleaning
requirement. A prior study has examined an FO membrane modified with silver nanoparticles
(nAg) in an OsMFC and observed a substantial reduction in biofouling as well as further
improvement in current generation (Yang et al. 2016a). Fouling alters the membrane properties
and in some cases, it may benefit energy recovery in an OsBES. It was found that the current
generation of an OsMFC was increased by 34% upon membrane fouling without water flux (Zhu
et al. 2016). This is because that the fouled FO membrane showed significantly higher flux of
protons and other ions than a pristine membrane, resulting in a lower internal resistance and higher
current generation.
2.5.4 System scaling up
Development of the OsBES technology must advance system scaling up, and this will be built on
the ongoing scaling up efforts for both BES and FO. Scaling up FO is relatively easy and
straightforward, because of its simple structure. There have been several pilot FO systems
developed for extracting water from domestic wastewater, fracking wastewater and mine-impaired
groundwater (Hancock et al. 2011b, McGinnis et al. 2013, Phuntsho et al. 2016). Thus, the key
challenge to scaling up an OsBES will lie in the BES part. There have been a number of reports of
BES scaling up, such as MFCs, MECs and MDCs (Cusick et al. 2011, Feng et al. 2014, Wu et al.
2016, Zhang and He 2015), and those will provide valuable experiences to scaling up OsBES. An
effective step to transform laboratory systems to pilot/full systems is to establish a transitional-
scale system, which has a significantly larger size than bench systems but smaller than pilot/full
systems. Such a transitional system possesses some features of both bench and pilot/full systems,
and can be a great platform for further research. For example, a 200-L MFC system was developed
as a transitional-scale system (much larger than bench MFCs that are usually no more than 1 L but
38
smaller than typical pilot systems of >3,000 L) for treating domestic wastewater (Ge et al. 2015).
Scaling up the integrated OsBES will largely benefit from BES scaling up efforts. Mathematical
modeling can be a powerful tool to help develop transitional-scale systems based on the results of
bench systems (Luo et al. 2016). A key objective for studying the transitional-scale systems is to
perform techno-economic analysis, which will reveal both technical and economical feasibility of
the OsBES technology. Involving both membranes and electrodes in an OsBES can result in a high
capital cost; however, if an appropriate application niche is identified, there could be the potential
need for this technology. In the previously mentioned study of 200-L MFC system, the initial
analysis of the capital cost indicated that this system could be more competitive in the market of
small-scale wastewater treatment (e.g., < 40 m3 day-1) (Ge et al. 2015). Rapid progress in material
science will lead to the reduction of the cost associated with membranes and electrodes.
2.6 Conclusions
The cooperation of BES and FO creates an innovative treatment system, which takes advantage of
both technologies and can accomplish the recovery of valuable resources such as energy, water,
and nutrient from various wastewaters. The cooperation, through either internal or external
connection, also generates a strong synergy between BES and FO and helps overcome some
inherent issues of each technology. The research of OsBES is still in an infancy stage, but great
promise in resource recovery and progress of both BES and FO as individual technology will
accelerate the development of the OsBES technology. More efforts must be invested to identify
application niches, understand energy issues, alleviate membrane fouling, and scale up OsBES to
a transitional stage.

39
Chapter 3 Understanding Electricity Generation in Osmotic Microbial Fuel
Cells through Integrated Experimental Investigation and Mathematical
Modeling
(This section has been published as Qin, M., Ping, Q., Lu, Y., Abu-Reesh, I. M., & He, Z.* (2015).
Understanding Electricity Generation in Osmotic Microbial Fuel Cells through Integrated
Experimental Investigation and Mathematical Modeling. Bioresource Technology, 195, 194-201.)
Abstract
Osmotic microbial fuel cells (OsMFCs) are a new type of MFCs with integrating forward osmosis
(FO). However, it is not well understood why electricity generation is improved in OsMFCs
compared to regular MFCs. Herein, an approach integrating experimental investigation and
mathematical model was adopted to address the question. Both an OsMFC and an MFC achieved
similar organic removal efficiency, but the OsMFC generated higher current than the MFC with
or without water flux, resulting from the lower resistance of FO membrane. Combining NaCl and
glucose as a catholyte demonstrated that the catholyte conductivity affected the electricity
generation in the OsMFC. A mathematical model of OsMFCs was developed and validated with
the experimental data. The model predicated the variation of internal resistance with increasing
water flux, and confirmed the importance of membrane resistance. Increasing water flux with
higher catholyte conductivity could decrease the membrane resistance.

40
3.1 Introduction
Wastewater is considered as a valuable source of energy and other resources. Sustainable
wastewater treatment aims to remove contaminants in a more energy-efficient way with resource
recovery (McCarty et al. 2011). Microbial fuel cells (MFCs) emerge as a promising technology
for sustainable wastewater treatment with direct electricity production from wastewater through
microbial oxidation of organic contaminants (Li et al. 2014a). Synergistic integration of forward
osmosis (FO) into MFCs create osmotic microbial fuel cells (OsMFCs) (Zhang et al. 2011a), which
possess a new function of recovering high-quality water and thus benefit water reclamation
towards reducing water footprint. In a FO process, water can move across a semipermeable
membrane from a high water potential zone to a low water potential zone (Shaffer et al. 2015).
The driving force is provided by a salt gradient that creates an osmotic pressure. Compared to other
membrane-based processes, FO is less energy intensive and low membrane fouling (Lutchmiah et
al. 2014a).
An OsMFC inherits the advantages of both MFCs and FO systems, generating electricity from the
organics by exoelectrogens and extracting clean water from wastewater by FO membrane (Zhang
et al. 2011a). This represents new synergy between bioelectrochemical systems and FO, and can
be extended to microbial electrolysis cells (MECs) and microbial desalination cells (MDCs) for
various purposes (Lu et al. 2014b). Coupling the MFC (or MDC, MEC) with FO could achieve
wastewater treatment, energy recovery, and resource recovery (such as clean water, nutrients) in
one system (Qin and He 2014, Yuan et al. 2015a, Zhang and He 2013a). This promising
combination encourages research to better understand the mechanism of the synergy. OsMFCs are
the precursor of such synergy, and thus understanding of OsMFCs will help to understand other

41
integrations towards further development. It has been demonstrated that OsMFC could produce
more electricity than an MFC containing cation exchange membrane (CEM) in both batch mode
and continuous mode (Ge et al. 2013b, Zhang et al. 2011a). Electricity can be generated by using
either sodium chloride or artificial seawater as both catholyte and draw solution (Zhang et al.
2011a), but sodium chloride resulted in the best performance of electricity generation and water
flux among several tested draw solutes such as potassium phosphate buffer, CaCl2 and glucose
(Ge and He 2012).
Although the use of FO membrane can lead to more electricity generation than that of CEM, it is
not clear what factors contribute to this improvement. In general, the performance of an MFC is
affected by its internal losses, including ohmic loss, activation loss, bacterial metabolic loss and
concentration loss (Logan et al. 2006). Especially, replacing CEM with FO membrane could affect
membrane resistance, variation of pH in catholyte and/or anolyte, and oxygen diffusion. It is also
of strong interest to understand how water flux, a unique phenomenon for OsMFCs, can influence
electricity generation. It was reported that an air-cathode OsMFC had a relatively lower internal
resistance than the ones containing CEM or AEM according to the polarization curve, which might
attribute to the acceleration of ion transport due to water flux (Werner et al. 2013). Proton
movement could also be promoted by water flux, resulting in less increase in the catholyte pH and
decrease in the anolyte pH (Zhang et al. 2011a). In an air-cathode OsMFC, the decreased anolyte
pH (0.86 pH unit) was 24% of the theoretical value, whilst the increased catholyte pH (4.06 pH
unit) was only 63% of the theoretical value and 73% of that in a CEM-equipped MFC (Werner et
al. 2013). Those findings indicate that the OsMFC may exert positive effect on pH stabilization

42
and thus effectively reduce overpotential. In addition, the use of the high-conductivity catholyte
can also help reduce the resistance of the catholyte, resulting in greater power production.
To better understand the OsMFC performance, experiments were conducted for comparing with a
CEM-MFC and under different operating conditions, and a mathematical model has been
developed. To our knowledge, this is the first mathematical model for OsMFCs. The objectives of
this study are: (1) investigating the improvement of current generation with FO membrane; (2)
validating the developed OsMFC model with experimental data; and (3) predicating the
contribution of different factors of internal resistance to current generation with water flux.
3.2 Materials and Methods
3.2.1 The OsMFC/ MFC Setup and Operation
The same reactor was used as either an OsMFC or an MFC, with FO membrane or CEM installed
between the anode compartment and the cathode compartment. Each compartment had a liquid
volume of 360 mL. Stainless steel mesh and carbon cloth were placed on both sides of the FO
membrane as support materials. Two pretreated carbon brushes (Gordon BrushMfg. Co. Inc.,
Commerce, CA, USA) were inserted into the anode compartment as the anode electrodes. The
cathode electrode was a piece of carbon cloth coated with Pt as the catalyst (0.3 mg cm-2). The
cathode compartment was aerated with air. The electrodes were connected by copper wires to an
external resistor of 10 Ω. Before use, the FO membrane (Hydration Technology Innovations, LLC,
Albany, OR, USA) was soaked in deionized (DI) water for 30 min according to the manufacturer's
instructions. The surface area of the FO membrane was about 98 cm2. The active layer of
membrane was facing the anode (feeding solution).
43
The OsMFC/MFC was operated at room temperature of ~21 °C. The anode was inoculated with
the anaerobic sludge from the Peppers Ferry Regional Wastewater Treatment Plant (Radford, VA,
USA). The anode was fed with an acetate solution containing (per L of DI water): sodium acetate,
1 g; NH4Cl, 0.15 g; NaCl, 0.5 g; MgSO4, 0.015 g; CaCl2, 0.02 g; NaHCO3, 0.1 g; KH2PO4, 0.53 g;
K2HPO4, 1.07 g; and trace element, 1 mL (Angenent and Sung 2001). Two operation modes were
applied in this study, batch mode and continuous mode. In the batch mode, a 500-mL glass bottle
was connected to the anode compartment as an anolyte reservoir, while a 750-mL glass bottle was
used as a catholyte reservoir. The cathode compartment of the OsMFC was filled with DI water to
allow FO membrane to rest for 2 h every 22 h during the batch operation. In the continuous mode,
the anolyte and the catholyte had the same feeding rate of 1.3 mL min−1, resulting in a hydraulic
retention time (HRT) of 4.5 h in each compartment, and were recirculated at 100 mL min−1.
3.2.2 Measurement and Analysis
The cell voltage was recorded every 5 min by a digital multimeter (2700, Keithley Instruments
Inc., Cleveland, OH, USA). The pH was measured using a benchtop pH meter (Oakton
Instruments, Vernon Hills, IL, USA). The conductivity was measured by a benchtop conductivity
meter (Mettler-Toledo, Columbus, OH, USA). The polarization curve was performed by a
potentiostat (Reference 600, Gamry Instruments, Warminster, PA, USA) at a scan rate of 0.2 mV
s-1. The volumetric densities of power and current were calculated based on the liquid volume of
the anode compartment, according to a previous study (Zhang et al. 2010). Two Ag/AgCl reference
electrodes (0.197 mV vs standard hydrogen electrode, SHE) were installed close to the anode
electrode and cathode electrode, respectively. The anode potential and cathode potential were
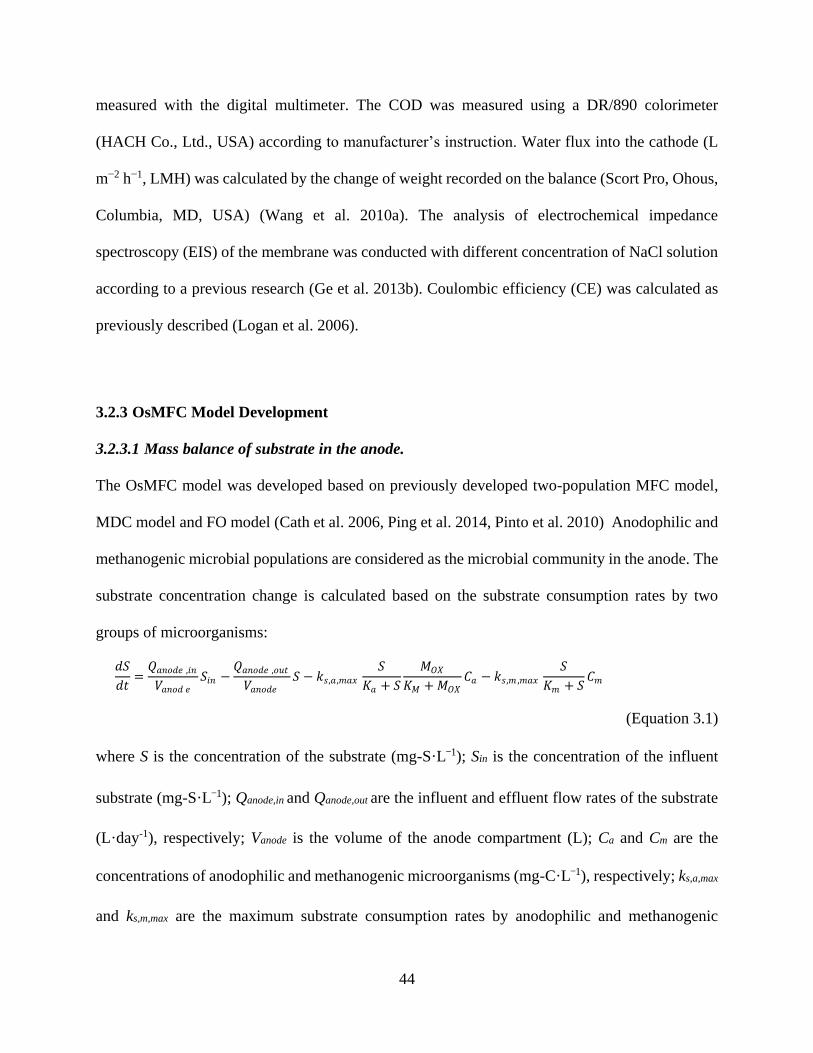
44
measured with the digital multimeter. The COD was measured using a DR/890 colorimeter
(HACH Co., Ltd., USA) according to manufacturer’s instruction. Water flux into the cathode (L
m−2 h−1, LMH) was calculated by the change of weight recorded on the balance (Scort Pro, Ohous,
Columbia, MD, USA) (Wang et al. 2010a). The analysis of electrochemical impedance
spectroscopy (EIS) of the membrane was conducted with different concentration of NaCl solution
according to a previous research (Ge et al. 2013b). Coulombic efficiency (CE) was calculated as
previously described (Logan et al. 2006).
3.2.3 OsMFC Model Development
3.2.3.1 Mass balance of substrate in the anode.
The OsMFC model was developed based on previously developed two-population MFC model,
MDC model and FO model (Cath et al. 2006, Ping et al. 2014, Pinto et al. 2010) Anodophilic and
methanogenic microbial populations are considered as the microbial community in the anode. The
substrate concentration change is calculated based on the substrate consumption rates by two
groups of microorganisms:
(Equation 3.1)
where S is the concentration of the substrate (mg-S·L−1); Sin is the concentration of the influent
substrate (mg-S·L−1); Qanode,in and Qanode,out are the influent and effluent flow rates of the substrate
(L·day-1), respectively; Vanode is the volume of the anode compartment (L); Ca and Cm are the
concentrations of anodophilic and methanogenic microorganisms (mg-C·L−1), respectively; ks,a,max
and ks,m,max are the maximum substrate consumption rates by anodophilic and methanogenic
𝑑𝑆
𝑑𝑡=
𝑄𝑎𝑛𝑜𝑑𝑒 ,𝑖𝑛
𝑉𝑎𝑛𝑜𝑑 𝑒𝑆𝑖𝑛 −
𝑄𝑎𝑛𝑜𝑑𝑒 ,𝑜𝑢𝑡
𝑉𝑎𝑛𝑜𝑑𝑒𝑆 − 𝑘𝑠,𝑎 ,𝑚𝑎𝑥
𝑆
𝐾𝑎 + 𝑆
𝑀𝑂𝑋
𝐾𝑀 + 𝑀𝑂𝑋𝐶𝑎 − 𝑘𝑠,𝑚 ,𝑚𝑎𝑥
𝑆
𝐾𝑚 + 𝑆𝐶𝑚 1

45
microorganisms (mg-S·mg-a−1·day−1 and mg-S·mg-m−1·day−1), respectively; MOX is the oxidized
mediator fraction per anodophillic microorganism (mg-M·mg-a-1); and, Ka, Km, and KM are the
half-saturation concentrations for the anodophillic microorganisms, methanogenic
microorganisms, and the redox mediator (mg-S·L-1, mg-S·L−1, and mg-M·mg-a−1), respectively.
The concentrations of two groups of microorganisms are represented in the following Monod
kinetic differential equations:
(Equation 3.2)
(Equation 3.3)
where kd,a and kd,m are the decay rates of the microorganisms (day−1); ka,max and km,max are the
maximum microorganism growth rates (day−1); kα,x and km,x are the steepness factors for
anodophillic microorganism (L·mg-a−1) and methanogenic microorganisms (L·mg-m−1) for the
biofilm retention; Cα,max and Cm,max are the maximum attainable concentrations for anodophillic
microorganism (mg-a·L−1) and methanogenic microorganisms (mg-m·L−1).
The current generation is calculated as:
(Equation 3.4)
where EOC is the open circuit voltage (V); OPconc is the concentration overpotential (V); Mred is the
reduced mediator fraction per microorganisms (mg-M·mg-a−1); ε is the constant (mg-M mg-x-1);
Rext is the external resistance (Ω); Rint is the internal resistance of the cell (Ω) that is given in
𝐼𝑀𝐹𝐶 =𝐸𝑂𝐶 − 𝑂𝑃𝑐𝑜𝑛𝑐
𝑅int + 𝑅ext
𝑀𝑟𝑒𝑑
𝜀 + 𝑀red 1

46
Equation 3 and made up of anode electrode resistance, cathode electrode resistance, electrolyte
resistance, and membrane resistance (Fan et al. 2008).
(Equation 3.5)
(Equation 3.6)
(Equation 3.7)
(Equation 3.8)
(Equation 3.9)
where Rmembrane is the membrane resistance (Ω), Relectrode is the anode and cathode electrode
resistance (Ω), and Ranolyte and Rcatholyte are the resistance for anolyte and catholyte (Ω), respectively.
For anolyte and catholyte, the resistance is inversely proportional to the conductivity of the
solution, which can be calculated by Equation 3.6 and 3.7 (Galama et al. 2014, Sleutels et al. 2009).
The Canolyte and Ccatholyte are the anolyte and catholyte solution conductivity (S m-1), l is the distance
between the electrode and membrane (m), and Ap is the projected area for electrode (m2).
According to EIS, membrane resistance for the CEM and FO are also inversely proportional to the
conductivity of the solution, which is consistent with the previous study (Sleutels et al. 2009). It
was showed that the presence of a salt concentration difference across the membrane dramatically
increased the membrane resistance compared to the value measured with EIS using the high-
concentration solution in both sides (Galama et al. 2014, Geise et al. 2013). The Rmembrane for CEM
and FO membrane are calculated by Equation 3.8 and 3.9 with different coefficient βCEM and βFO,
respectively.

47
3.2.3.2 Mass balance of the salt in the OsMFC
High concentration salt is used in OsMFC cathode side to extract clean water from wastewater.
Besides, the salt could diffuse to the anode side due to the reverse salt flux. Ordinary differential
equations shown below are developed to quantify the salt concentration:
(Equation 3.10)
(Equation 3.11)
(Equation 3.12)
(Equation 3.13)
where Csalt,a and Csalt,c are the salt concentrations in the anode and cathode compartments (mol-
salt·L−1), respectively; Csalt,a,in and Csalt,c,in are the salt concentrations in the anode influent and
cathode influent (mol-salt·L−1), respectively; the reverse salt flux JS (mol m-2 d-1) could be
calculated by Equation 3.15; the water flux Jw (LMH) could be calculated by Equation 3.14; Am is
the membrane area (0.0098 m2).
3.2.3.3 Water flux and reverse salt flux
The water flux is simulated based on the FO mode (Lutchmiah et al. 2014a):
(Equation 3.14)
where A is the permeability coefficient for FO membrane (1.20×10⁻⁷ m3 m-2 s-1 bar-1), i is the
number of dissolved species (2 for NaCl), R (8.3145 J mol-1 K-1) is the ideal gas constant, and T
(294 K) is the absolute temperature.
The reverse salt flux JScan be approximated as (Phillip et al. 2010):

48
(Equation 3.15)
where B is the salt permeability coefficient (1.39×10⁻⁷ m3 m-2 s-1).
This OsMFC model can also be applied to MFCs, when both Jw and Js are zero. The parameters
were estimated as previously described and listed in Table 3.1, the relative root-mean square error
was calculated to evaluate the discrepancy between the experimental data and the simulation
results, and the mass balances for microorganisms in the anode were according to a previous study
(Ping et al. 2014).
Table 3.1 Parameters used in the OsMFC model
Parameter Description Value Unit
Qanode,in Flow rate of substrate feed to anode 1.872 L·day-1
Qanode,out Flow rate feeding to cathode 1.872 L·day-1
ks,a,max Maximum substrate consumption rate by anodophilic
microorganisms 7.44
mg-S·mg-
a−1·day−1
ks,m,max Maximum substrate consumption rate by
methanogenic microorganisms 2.55
mg-S·mg-
m−1·day−1
MOX Oxidized mediator fraction per anodophillic
microorganism 0.005 mg-M·mg-a-1
Ka Half-saturation concentrations for the anodophillic
microorganisms 20 mg-S·L-1
Km Half-saturation concentrations for the methanogenic
microorganisms 80 mg-S·L−1
KM Half-saturation concentrations for the redox mediator 0.01 mg-M·mg-a−1
Mred Reduced mediator fraction per microorganisms 0.0428 mg-M·mg-a−1
ε Constant 0.0001 mg-M mg-x-1
Rmembrane Membrane resistance 7 Ω
Ap Projected area for electrode 0.0098 m2
A Permeability coefficient for FO membrane 1.20×10⁻⁷ m3 m-2 s-1 bar-1
B Salt permeability coefficient for FO membrane 1.39×10⁻⁷ m3 m-2 s-1
R Ideal gas constant 8.3145 J mol-1 K-1
T Temperature 294 K
𝐽𝑆 =𝐵𝐽𝑤
𝐴𝑖𝑅𝑇 1

49
3.3 Results and Discussion
3.3.1 Comparing OsMFC with MFC
Although the previous study has reported the comparison between OsMFCs and MFCs, that
comparison was preliminary and the results were limited by the low electricity generation due to
inefficient reactor configuration (Zhang et al. 2011a). In this study, a more detailed comparison
was conducted under both open and closed circuit conditions with measuring individual potentials.
Operated in a batch mode and with 35 g L-1 NaCl solution as the catholyte, the OCV of the OsMFC
was 0.76 V, comparable to that of the conventional MFC (Figure 3.1A). After 12-h operation, the
OCV of the OsMFC began to drop rapidly, while the OCV of the MFC did not start to decrease
until 19 h. The cathode potentials for both the OsMFC and the MFC were stable during the batch
operation. However, the anode potential varied over time and caused the different OCV for the
two MFCs. Since the pH of the anode effluent was not apparently decreased in both the OsMFC
and the MFC (7.15 ± 0.11), the drop of anode potential was not due to the pH. With water flux in
the OsMFC, the volume of the anolyte decreased from 750 mL to 287 ± 29 mL during the whole
batch, which could concentrate the substrate and background salts in the anolyte compared to that
of the MFC. When the batch ended, the catholyte pH for OsMFC was 8.56 ± 0.12 while the
catholyte pH for MFC was 10.18 ± 0.17. The difference in catholyte pH increase was probably
caused by water flux and faster transport of protons across the FO membrane (Werner et al. 2013,
Zhang et al. 2011a): the water extracted from the anolyte diluted the catholyte in terms of the
concentrations of both the salt and the accumulated OH-; water flux might have promoted the
transport of protons from the anolyte into the catholyte, thereby resulting in a lower pH of the
catholyte; finally, reverse salt flux, a unique feature of FO membrane, could cause the movement

50
of OH- from the catholyte into the anolyte, driven by the concentration gradient of OH-, leading to
the difference in catholyte pH increase between the OsMFC and the MFC.
To generate current, a 10-Ω resistor was connected the circuit. As shown in Figure 3.1B, the
current density of the OsMFC was much higher than that of the MFC. In the OsMFC, the COD
concentration decreased from 785 to 210 mg L-1; because the volume of the anolyte also decreased
from 750 to 251 mL due to water extraction (Figure 3.1C), the COD removal efficiency in the
OsMFC was about 91%. The COD concentration in the MFC anode effluent was 81 mg L-1,
representing a COD removal efficiency of 90%. The Coulombic efficiency (CE) of the OsMFC
(32%) was higher than that obtained in the MFC (18%), consistent with the previous findings
(Werner et al. 2013, Zhang et al. 2011a). The cathode potential in the MFC is slightly higher than
that in the OsMFC, probably related to the lower ionic strength of the OsMFC catholyte due to the
extracted water diluting the salt concentration during the operation. In general, the similar potential
of the anode/cathode electrodes between the OsMFC and the MFC did not explain the difference
in their current generation. One hypothesis is that solution and membrane resistance, is a key factor
to the improvement of current generation in the OsMFC.
After 13-h operation, difference between the cathode potential and the anode potential was
negative, indicating that voltage reversal might have happened. Previous studies indicate that this
voltage reversal was due to the substrate depletion in the anolyte, resulting in loss of bacterial
activity (An and Lee 2014, Oh and Logan 2007). However, in a single MFC, the anode potential
and cathode potential should converge together with no reversal voltage under the situation of fuel
starvation. The “voltage reversal” in this MFC/OsMFC, which could be a pseudo-phenomenon,

51
was likely related to deviation caused by the measurement of electrode potential. When the
substrate supply was sufficient, the solution resistance between the anode/cathode electrode and
reference electrode could be neglected compared to the large resistance of the digital multimeter.
However, when the substrate was depleted, the solution resistance increased to an extent that it
cannot be neglected; that led to the increase of the measured anode potential (from negative to
Figure 3.1 The OsMFC and MFC operated in a batch mode (catholyte: 35 g L-1 NaCl): (A) open
circuit voltage and the individual potentials, (B) current density (j) and the anode and cathode
potential under a closed circuit condiction, and (C) water flux in open circuit (OC) and closed circuit
(CC).

52
zero) and decrease in the cathode potential (from positive to zero) after 13-h operation as the
solution resistance increased. Therefore, it is likely that the actual voltage did not reverse.
3.3.2 Effects of membrane and solution resistance
The effects of membrane and solution resistance were investigated in two steps: first, the
conductivity of the anolyte and the catholyte was kept similar so that there was no water flux; and
second, the conductivity of the catholyte was adjusted by using combined NaCl and glucose while
keeping the similar osmotic pressure. In the first step, 2 g L-1 NaCl solution was used as a catholyte
to prevent water flux in both the OsMFC and the MFC (Figure 3.2A). As shown in Figure 2B, the
OsMFC generated a higher current density of 75.2 A m-3 than the MFC (42.8 A m-3), while both
achieved similar COD removal efficiency of ~85%. Consequently, the CE of the OsMFC was
30%, higher than 14% obtained in the MFC. With similar potential of the anode/cathode electrodes
(Figure 3.2C) and similar anolyte/catholyte conductivity, the increased current generation in the
OsMFC was likely related to the difference in membrane resistance, which was 9.7 Ω for FO
membrane in the OsMFC and 14.3 Ω for CEM in the MFC.
In the second step, different combinations of sodium chloride and glucose were used to supply
same driving force (osmotic pressure) for water flux but different electrical conductivity (Table
3.2). Glucose has a very low conductivity but could generate osmotic pressure as a draw solute in
FO processes (Xie et al. 2012). Figure 3.3A shows that the electrical conductivity of the catholyte
clearly affects the current generation. The catholyte containing no glucose (S-5) had a conductivity
of 55.6 mS cm-1, resulting in a current density of 118.5 ± 2.6 A m-3, significantly higher than 13.4
± 3.4 A m-3 obtained with the catholyte containing no NaCl (S-1) that had a conductivity of 0.084
mS cm-1.The total coulomb generated during one batch cycle was strongly correlated to the

53
catholyte conductivity, with a R2 of 0.9781 (inset, Figure 3.3A). The water flux was slightly
affected by the different combination of sodium chloride and glucose (Figure 3.3B).
Figure 3.2 The OsMFC and the MFC operated with no water flux (catholyte: 2 g L-1
NaCl): (A) water flux, (B) current density, and (C) individual potentials.
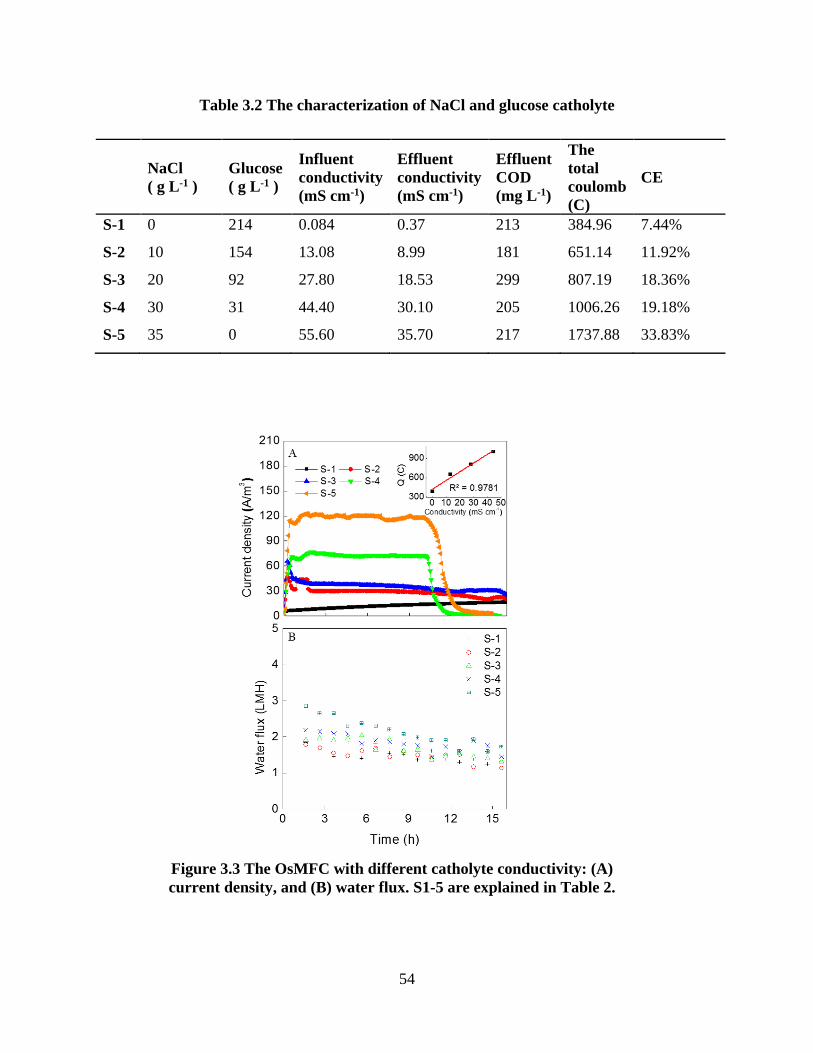
54
Table 3.2 The characterization of NaCl and glucose catholyte
NaCl
( g L-1 )
Glucose
( g L-1 )
Influent
conductivity
(mS cm-1)
Effluent
conductivity
(mS cm-1)
Effluent
COD
(mg L-1)
The
total
coulomb
(C)
CE
S-1 0 214 0.084 0.37 213 384.96 7.44%
S-2 10 154 13.08 8.99 181 651.14 11.92%
S-3 20 92 27.80 18.53 299 807.19 18.36%
S-4 30 31 44.40 30.10 205 1006.26 19.18%
S-5 35 0 55.60 35.70 217 1737.88 33.83%
Figure 3.3 The OsMFC with different catholyte conductivity: (A)
current density, and (B) water flux. S1-5 are explained in Table 2.

55
3.3.3 OsMFC model fitting and validation
Mathematical modeling can help understand the key factors in the proposed system and may
explain some parameters that can hardly studied with experiments. Herein, the first OsMFC model
has been developed based on the information obtained from a continuously operated OsMFC. The
established model was validated with two different catholyte concentrations (35 g L-1 and 2 g L-1
NaCl). In general, the model predication of current generation, salt concentration, and water flux
shows satisfactory agreement with the experimental measurement, in which the current decreased
from 27 to 17 mA and water flux dropped from 2.25 to nearly zero LMH when the catholyte
influent concentration was reduced from 35 to 2 g L-1 (Figure 3.4A, C and D). However, some
overestimation/underestimation can be seen from the modeled variation trend of the COD
concentration as shown in Figure 3.4B. The predicted effluent COD increased when the NaCl
concentration decreased to 2 g L-1. But the COD was not significantly influenced by the catholyte
change in the experiment. The overestimation of the COD removal was mainly due to the current
generation drop. In the model, it was assumed that anodophillic microorganism was the dominant
community, but in reality it might not happen ideally, thereby resulting in the over/underestimation
of the COD removal at lower current. Furthermore, this model could also fit the MFC when there
is no water flux and the FO membrane resistance replaced by the CEM membrane resistance (date
not shown).
The OsMFC model was validated through varying the concentration of NaCl in the catholyte from
2 to 10 g L-1 (Figure 3.5). In response to the change, the current increased from 18 to 23 mA, with
the water flux increased from 0 to 0.7 LMH. The relative RMSE for the current was 8.06%, while
the RMSE for the water flux was 31.95% due to the unstable water flux in the first few points. For
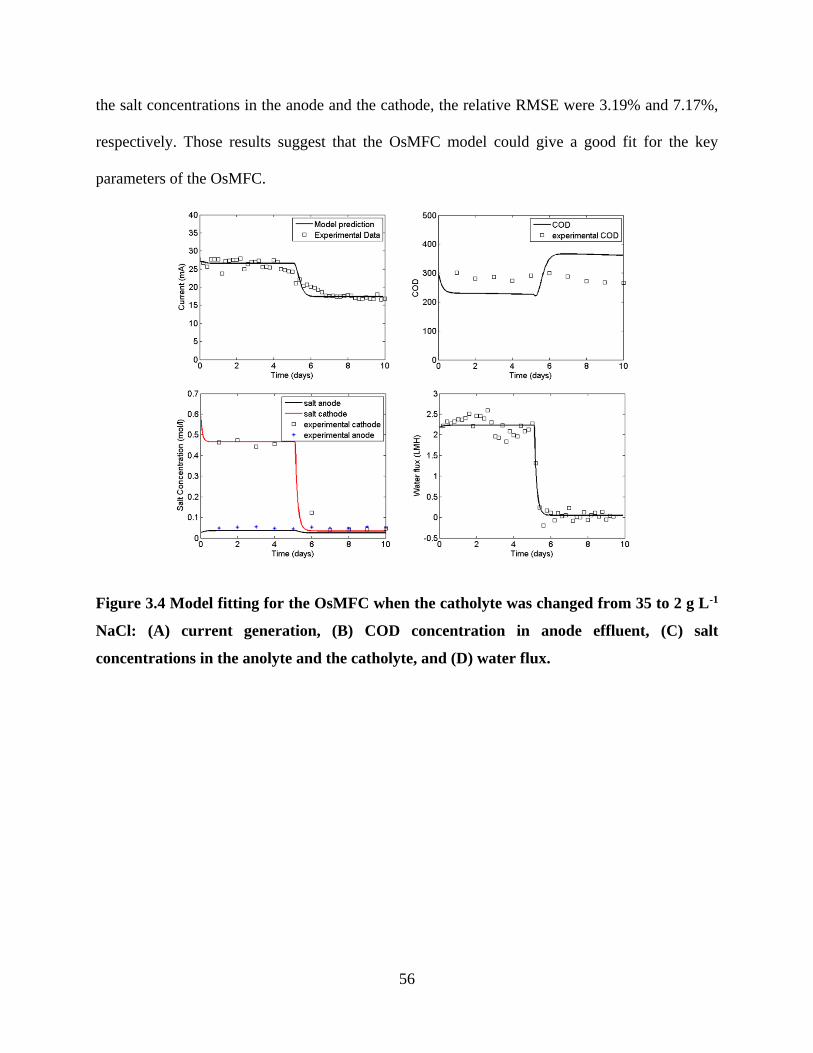
56
the salt concentrations in the anode and the cathode, the relative RMSE were 3.19% and 7.17%,
respectively. Those results suggest that the OsMFC model could give a good fit for the key
parameters of the OsMFC.
Figure 3.4 Model fitting for the OsMFC when the catholyte was changed from 35 to 2 g L-1
NaCl: (A) current generation, (B) COD concentration in anode effluent, (C) salt
concentrations in the anolyte and the catholyte, and (D) water flux.

57
3.3.4 OsMFC model prediction
The validated OsMFC model was used to predict the distribution of internal resistance (anode
electrode resistance, cathode electrode resistance, electrolyte resistance, and membrane resistance)
in the OsMFC. For comparison, the predication was also conducted for the MFC. In this model,
the electrode resistance is set as a constant (7 Ω) according to the polarization curve and negligible
Figure 3.5 The OsMFC model validation when the catholyte was changed from 2 g
L-1 NaCl to 10 g L-1 NaCl solution: (A) current generation, (B) salt concentrations of
anolyte and catholyte, and (C) water flux.

58
change in the anode and the cathode potentials. As shown in Equations 6-9, the electrolyte
(solution) resistance and membrane resistance are related to the solution conductivity. The salt
concentration in the cathode is varied to predict the variation of electrolyte resistance and
membrane resistance to explain why the OsMFC could generate more electricity than the MFC.
As shown in Figure 3.6A, the current generation increases as the cathode salt concentration
increased for both the OsMFC and the MFC. In the OsMFC, the current density increases from
38.3 to 73.9 A m-3 as the cathode NaCl concentration increases from 1 to 35 g L-1, while the current
of the MFC increases from 35.2 to 59.6 A m-3.
The distribution of the internal resistance of the OsMFC and the MFC varies as the cathode salt
concentration changes (Figure 3.6B and C). When the cathode NaCl concentration increases from
1 to 35 g L-1, the internal resistance decreases from 45.33 to 18.46 Ω in the OsMFC and 50.33 to
25.47 Ω in the MFC. The difference in the internal resistance is most likely resulted from the
difference in both electrolyte resistance and membrane resistance. In the MFC, the conductivity of
the anolyte remains the same with an anolyte resistance of 8.49 Ω. In the OsMFC, the conductivity
of anolyte increases as the cathode salt concentration increases due to concentrating effect with
the increased water flux permeates through the FO membrane. That results in the decrease in the
anolyte resistance from 8.53 to 5.74 Ω as the cathode NaCl concentration increases from 1 to 35 g
L-1. The catholyte resistance of the OsMFC decreases from 12.17 to 0.45 Ω; however, it is still
higher than that of the MFC at the same cathode salt concentration, because of the dilution with
the permeated water. Due to the high salt concentration in the catholyte, the difference in the
catholyte resistance between the two systems has minor contribution to the difference in electricity
generation.

59
The membrane properties such as membrane thickness, molar conductivity and mobility of the
charge carriers could influence the membrane resistance (Leong et al. 2013, Wang et al. 2010c).
The varied catholyte and anolyte conductivity with the water flux in the OsMFC can affect its
Figure 3.6 Model prediction for the OsMFC and the MFC with varied salt concentration in
the catholyte: (A) current generation in OsMFC and MFC, (B) internal resistance
distribution in MFC, and (C) internal resistance distribution in OsMFC. Rm: membrane
resistance; RC: catholyte resistance; RA: anolyte resistance; Re: electrode resistance.

60
membrane resistance. As the cathode NaCl concentration increases from 1 to 35 g L-1, the
membrane resistance of FO decreases from 17.62 to 5.27 Ω, while the CEM resistance decreases
from 22.60 to 9.63 Ω. In the OsMFC, the contribution of membrane resistance to the internal
resistance decreases with the increased catholyte salt concentration, while in the MFC the
membrane resistance has relatively stable contribution (>37%) to the overall resistance.
3.4 Conclusions
This study has confirmed that OsMFCs can generate more electricity than regular MFCs, and
provided initial explanation that the enhancement is mainly due to lower membrane resistance,
which is affected by both membrane materials and water flux. The developed mathematical model
for OsMFCs could well fit the experimental data, and effectively predict the variation in the
internal resistance with water flux. The integrated experimental investigation and mathematical
model have advanced the understanding of electricity generation in OsMFCs, and revealed the key
factors for further development of this technology towards simultaneous wastewater treatment,
bioenergy recovery, and water reclamation.

61
Chapter 4 Effects of Current Generation and Electrolyte pH on Reverse Salt
Flux across Thin Film Composite Membrane in Osmotic Microbial Fuel Cells
(This section has been published as Qin, M., Abu-Reesh, I. M., & He, Z.* (2016). Effects of
Current Generation and Electrolyte pH on Reverse Salt Flux across Thin Film Composite
Membrane in Osmotic Microbial Fuel Cells. Water research, 105, 583-590.)
Abstract
Osmotic microbial fuel cells (OsMFCs) take advantages of synergy between forward osmosis (FO)
and microbial fuel cells (MFCs) to accomplish wastewater treatment, current generation, and high-
quality water extraction. As an FO based technology, OsMFCs also encounter reverse salt flux
(RSF) that is the backward transport of salt ions across the FO membrane into the treated
wastewater. This RSF can reduce water flux, contaminate the treated wastewater, and increase the
operational expense, and thus must be properly addressed before any possible applications. In this
study, we aimed to understand the effects of current generation and electrolyte pH on RSF in an
OsMFC. It was found that electricity generation could greatly inhibit RSF, which decreased from
16.3 ± 2.8 to 3.9 ± 0.7 gMH when the total Coulomb production increased from 0 to 311 C. The
OsMFC exhibited 45.9 ± 28.4% lower RSF at the catholyte pH of 3 than that at pH 11 when 40 Ω
external resistance was connected. The amount of sodium ions transported across the FO
membrane was 18.3-40.7% more than that of chloride ions. Ion transport was accomplished via
diffusion and electrically-driven migration, and the theoretical analysis showed that the inhibited
electrically-driven migration should be responsible for the reduced RSF. These findings are
potentially important to control and reduce RSF in OsMFCs or other osmotic-driven processes.

62
4.1 Introduction
Osmotic microbial fuel cells (OsMFCs) are a new type of microbial fuel cells (MFCs) integrated
with forward osmosis (FO) (Zhang et al. 2011a). By inheriting the functions of both MFCs and
FO, an OsMFC can simultaneously generate electricity and extract water with the aid of a
semipermeable FO membrane that rejects solute ions (Cath et al. 2006, Lutchmiah et al. 2014b),
separates the anode and cathode, and extracts treated water from the anolyte (feed solution) into
the catholyte (draw solution) (Lu et al. 2014b, Werner et al. 2013, Yuan and He 2015). Like regular
MFCs, organic compounds in wastewater are oxidized at the anode of OsMFCs by exoelectrogenic
microorganisms and the electrons generated from the anode oxidation reaction are transferred to
the cathode through an external circuit where oxygen is reduced to water (oxygen reduction
reaction) (Zhang et al. 2011a). In the past few years, OsMFCs have been studied and developed in
the aspects such as substrates and operation optimization. OsMFCs can treat both synthetic
solution and actual wastewater, and it was reported that more than 50% of the treated wastewater
could be extracted from the anode (Ge et al. 2013b, Ismail and Ibrahim 2015). Operation
optimization focused on selecting the optimal draw solute, determining membrane orientation, and
simplifying the cathode. Draw solution (catholyte) plays a key role in the OsMFC operation, and
a draw solute that has both a high conductivity and strong buffer capacity will benefit electricity
generation and water flux (Ge and He 2012). The OsMFC having cellulose triacetate (CTA)
embedded support exhibited the higher electricity generation due to the less permeability of
oxygen than other membranes (Yang et al. 2015a, Yang et al. 2016b). Air cathodes have been
developed to replace liquid cathodes for improving electricity generation in OsMFCs (Werner et
al. 2013). In addition, fouling of FO membrane was found to benefit the current generation of an
OsMFC despite the reduction of water flux (Zhu et al. 2016). The concept of OsMFCs has also

63
been extended to create osmotic microbial electrolysis cells and osmotic microbial desalination
cells (Lee et al. 2015, Zhang and He 2012).
As a technology based on the principle of FO, the OsMFCs would inherit some intrinsic drawbacks
of FO, for example, reverse salt flux (RSF) can hardly be avoided and is one of the most
challenging issues (Phillip et al. 2010). RSF occurs due to a concentration gradient across an FO
membrane, resulting in backward transport of draw solutes into the feed side. Such reverse
transport reduces the driving force for water transport, increases the operation cost due to loss of
draw solutes, and contaminates the feed solution (Cath et al. 2006). RSF can also result in salt
accumulation within the fouling layer on the membrane surface, which increases the cake-
enhanced osmotic pressure and therefore, exhibits a negative impact on the process efficiency (Boo
et al. 2012). In an FO process, an ideal FO membrane should have high water permeability and
low solute permeability, to achieve high water flux and low RSF (Cath et al. 2006); however, high
water flux usually leads to high RSF (Lutchmiah et al. 2014b). For example, the commercial thin-
film composite (TFC) FO membrane, which is comprised of an ultra-thin polyamide active layer
and a porous polysulfone support layer, is typically more water permeable and has relatively higher
RSF compared to conventional asymmetric cellulose acetate (CA) membrane. In an OsMFC,
although RSF can decrease the solution resistance and thus benefit the anode activity, overly
accumulated salts will negatively influence the microbial activity and impair the quality of the
treated effluent, which has been demonstrated in osmotic membrane bioreactors that had decreased
organic removal efficiency with accumulated salts due to RSF (Alturki et al. 2012, Lu and He
2015). Therefore, it is vitally important to reduce RSF for sustainable implementation of FO-based
water and wastewater treatment technologies.

64
A unique feature of OsMFCs, which makes it different from other FO-based technologies, is
electricity generation. Compared to conventional MFCs, OsMFCs can generate more electricity
under both a batch mode and a continuous mode using either sodium chloride solution or artificial
seawater as the catholyte (Ge et al. 2013b, Zhang et al. 2011a). Such improved performance of
electricity generation was attributed to the lower internal resistance of the OsMFCs than that of
the MFCs (Werner et al. 2013). An OsMFC mathematical model was developed, and subsequently
predicted a reduction of internal resistance with increasing osmotic pressure gradient and water
flux, thereby confirming the importance of membrane resistance (Qin et al. 2015). The lower
membrane resistance in OsMFCs is related to both a lower pH gradient across the membrane due
to the improved proton flux promoted by water flux and higher anolyte conductivity in the
presence of reverse salt flux (Zhu et al. 2015). Movement of electrons as a result of
bioelectrochemical reactions can affect ion transport across ion exchange membranes (Chen et al.
2012, Chen et al. 2016, Ping et al. 2016). For example, it was reported that the current generation
in microbial desalination cells (MDCs) could inhibit back diffusion of ions from the anolyte into
the desalinated stream (Ping et al. 2016). In addition, the electric field has been employed to reduce
the membrane fouling in membrane bioreactors via the electrostatic repulsion between negative
charged foulants and the cathode (Bani-Melhem and Elektorowicz 2010, Chen et al. 2007, Liu et
al. 2013). Thus, we hypothesized that the current generated in OsMFCs could inhibit RSF. A key
factor that potentially correlates with both electricity generation and RSF is the electrolyte pH. It
has been reported that RSF can vary significantly as a function of solution pH and increase at
alkaline pH in the FO process (Arena et al. 2015). The carboxylic acid groups in TFC membrane
could gain or lose protons depending on the solution pH, leading to a varied cation transport across
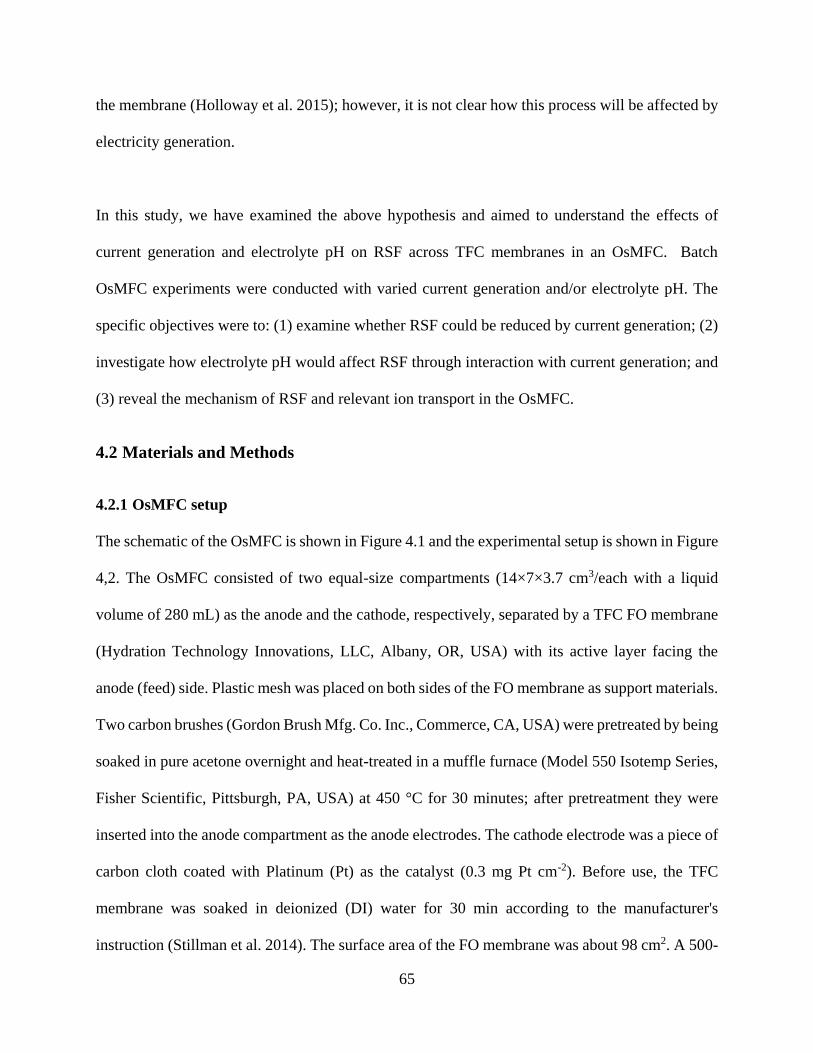
65
the membrane (Holloway et al. 2015); however, it is not clear how this process will be affected by
electricity generation.
In this study, we have examined the above hypothesis and aimed to understand the effects of
current generation and electrolyte pH on RSF across TFC membranes in an OsMFC. Batch
OsMFC experiments were conducted with varied current generation and/or electrolyte pH. The
specific objectives were to: (1) examine whether RSF could be reduced by current generation; (2)
investigate how electrolyte pH would affect RSF through interaction with current generation; and
(3) reveal the mechanism of RSF and relevant ion transport in the OsMFC.
4.2 Materials and Methods
4.2.1 OsMFC setup
The schematic of the OsMFC is shown in Figure 4.1 and the experimental setup is shown in Figure
4,2. The OsMFC consisted of two equal-size compartments (14×7×3.7 cm3/each with a liquid
volume of 280 mL) as the anode and the cathode, respectively, separated by a TFC FO membrane
(Hydration Technology Innovations, LLC, Albany, OR, USA) with its active layer facing the
anode (feed) side. Plastic mesh was placed on both sides of the FO membrane as support materials.
Two carbon brushes (Gordon Brush Mfg. Co. Inc., Commerce, CA, USA) were pretreated by being
soaked in pure acetone overnight and heat-treated in a muffle furnace (Model 550 Isotemp Series,
Fisher Scientific, Pittsburgh, PA, USA) at 450 °C for 30 minutes; after pretreatment they were
inserted into the anode compartment as the anode electrodes. The cathode electrode was a piece of
carbon cloth coated with Platinum (Pt) as the catalyst (0.3 mg Pt cm-2). Before use, the TFC
membrane was soaked in deionized (DI) water for 30 min according to the manufacturer's
instruction (Stillman et al. 2014). The surface area of the FO membrane was about 98 cm2. A 500-

66
mL bottle was connected to the anode compartment as a reservoir and placed on a digital balance
for monitoring water flux. A 300-mL glass bottle containing the catholyte was connected to the
cathode as a reservoir. The cathode compartment was aerated with the air to provide oxygen for
cathode reaction and create flow turbulence.
Figure 4.1 Schematic of an osmotic microbial fuel cell.
Figure 4.2 Photograph of OsMFC. A, anolyte reservoir; B, catholyte reservoir; C, OsMFC
reactor; D, pump for pH adjustment; E, 1M NaOH/HCl solution; F, recirculation pump; G,
stir plate; H, mass balance; I, pH meter; J, pump speed controller, and K, aeration pump
(for catholyte).
4.2.2 OsMFC operation
The OsMFC was operated at room temperature of ~21 °C. The anode compartment was inoculated
with the anaerobic sludge from the Peppers Ferry Regional Wastewater Treatment Plant (Radford,
VA, USA). The anode feeding solution contained (per L of DI water): sodium acetate, 0.5 g;

67
NH4Cl, 0.075 g; NaCl, 0.25 g; MgSO4, 0.0075 g; CaCl2, 0.01 g; NaHCO3, 0.05 g; KH2PO4, 0.27 g;
K2HPO4, 0.53 g; and trace element, 0.5 mL (Angenent and Sung 2001). The cathode was fed with
35 g L-1 NaCl solution. The OsMFC was operated with 500 mL anolyte and 300 mL catholyte in
a batch mode (6 hours). After 6-h operation, the data was collected and all the solutions (in both
compartments and reservoirs) were replaced. During night, the OsMFC was operated with 1-L
anolyte and 500-mL 5 g L-1 NaCl solution without data collection for 12 hours. The same OsMFC
reactor was used for all the tests, to avoid the difference in performance caused by reactor
manufacturing. To study the effects of current generation, the external resistance was manipulated
to five levels (1 Ω, 10 Ω, 40 Ω, 100 Ω and quasi-infinite (open circuit mode)), and the catholyte
pH was fixed at 7 with 1 M HCl solution. In the experiments of controlled catholyte pH, the pH of
the draw solution (catholyte) was maintained at 3, 7 or 11 with 1 M HCl or NaOH. In the study of
uncontrolled catholyte pH, two experiments were performed: First, the catholyte pH was initially
adjusted to 3, 7 and 11 with 1 M HCl or NaOH and 40 Ω external resistance was connected to the
OsMFC; second, the external resistance was manipulated to four levels (1 Ω, 10 Ω, 40 Ω and 100
Ω) for different current generation, and the catholyte pH was initially 7 without any further
adjustment during the 6-h experiment. The initial pH was adjusted and measured before each
experiment. Both the anolyte and catholyte were recirculated at 100 mL min-1. The FO membrane
was washed with DI water for removing foulants every 2 days to reduce the effect of membrane
fouling on the tests. The integrity tests for the FO membrane with Milli-Q water as the feed
solution and 1-M NaCl as the draw solution were performed after each wash. As shown in Figure
4.3, either the water flux or RSF was not significantly changed, suggesting that the FO membrane
was relatively stable during the experiment and membrane fouling was reversible. Water

68
permeability coefficients (A) and solute (NaCl) permeability coefficients (B) were determined
through the FO tests (Table 4.1).
Figure 4.3 Integrity test for the FO membrane. (A) the extracted water volume during the
2-h operation for the pristine FO membrane and membrane after-wash; (B) the water flux
and RSF for the pristine FO membrane and membrane after-wash.
Table 4.1 TFC membrane properties.
Unit TFC membrane
Pure water permeability (A) L/m2 -h-bar 0.26
Salt permeability (B) m/s 4.55×10⁻⁷
4.2.3 Measurement and analysis
The OsMFC voltage was recorded every 2 minutes by a digital multimeter (2700, Keithley
Instruments Inc., Cleveland, OH, USA). The polarization curve was performed by a potentiostat
(Reference 600, Gamry Instruments, Warminster, PA, USA) at a scan rate of 0.2 mV s-1. The pH
69
was measured using a benchtop pH meter (Oakton Instruments, Vernon Hills, IL, USA). The
conductivity was measured by a benchtop conductivity meter (Mettler-Toledo, Columbus, OH,
USA). The volumetric densities of power and current were calculated based on the liquid volume
of the anode compartment, according to a previous study (Zhang et al. 2010). The concentration
of chemical oxygen demand (COD) was measured using a DR/890 colorimeter (HACH Co., Ltd.,
USA) according to the manufacturer’s instruction. The catholyte weight in the reservoir was
recorded every 1 min on a balance (Scort Pro, Ohous, Columbia, MD, USA) (Wang et al. 2010b).
The concentrations of Na+ and Cl- were quantified by using ion chromatography (Dionex LC20
ion chromatograph, Sunnyvale, CA, U.S.A.) equipped with an ED40 eletrochemical detector.
The total Coulomb generated in OsMFC was calculated as:
(Equation 4.1)
where I is electric current and t is the time.
Water flux Jw across the FO membrane (L m-2 h-1, LMH) was calculated by the change of catholyte
solution weight over time (Wang et al. 2010b).
(Equation 4.2)
where Vc,t and Vc,0 are the volume (L) of the catholyte at the test time t (h) and 0, respectively. The
difference of Vc,t and Vc,0 equals to the weight increase of the draw solution in value (kg) during
this period; Am is the membrane area (m2).
RSF (Js, g m-2 h-1, gMH) from the cathode (draw) to the anode (feed) was calculated based on the
salt concentration change in the feed solution (Wang et al. 2010b).
(Equation 4.3)

70
where Ca,t and Ca,0 are the ion concentrations in the feed solution at time t (6 h) and 0, respectively;
Va,t and Va,0 are the volume (L) of the anolyte at time t (6 h) and 0, respectively.
The pure water permeability coefficient (A, L m-2-h-bar) and salt permeability coefficient (B, m s-
1) were calculated as:
(Equation 4.4)
where πD and πF are the osmotic pressure of the draw solution at the membrane interface and
osmotic pressure of the feed solution at the feed-membrane interface, respectively (Cath et al.
2013)
and
(Equation 4.5)
where n is the number of species that the draw solute dissociates into (e.g., n = 2 for NaCl), Rg is
the gas constant, and T is the absolute temperature.
The RSF includes diffusion and electrically-driven migration (EDM) according to the Nernst-
Planck equation:
(Equation 4.6)
where JD is the flux due to diffusion and JM is the flux due to EDM.
Diffusion (JD) can be calculated by (Phillip et al. 2010):
(Equation 4.7)
where Di is the diffusion coefficient of species i, tM is the thickness of TFC membrane (m), Cd,i
is the concentration of species i on the catholyte, and Cf,i is the concentration of species i in the
anolyte. The diffusion coefficient is calculated as in a previous study (Table 4.2) (Kim et al. 2007a).

71
Table 4.2 Diffusion coefficient in TFC membrane.
Ion Unit TFC membrane
Na+ m2/s 5.38×10⁻⁹
Cl- m2/s 5.26×10⁻⁹
The percentage of RSF contributed by Diffusion (JD) and EDM (JM were calculated by the
Equations 4.8 and 4.9, respectively.
(Equation 4.8)
(Equation 4.9)
4.3 Results and Discussion
4.3.1 Current generation decreases RSF
The influence of current generation on RSF was investigated by varying external resistance loading
at a fixed catholyte pH of 7. When the external resistance decreased from 100 Ω to 1 Ω, the
maximum current density of the OsMFC increased from 16 A m-3 to 94 A m-3 (Figure 4.4) while
the total Coulomb production increased from 90 C to 311 C. During the 6-h operation, the COD
concentration in the anode decreased from 411 ± 24 mg L-1 to 109 ± 39 mg L-1 (mean value ±
standard deviation), and the anolyte pH remained relatively stable (7.26 ± 0.17) due to the buffer
capacity of phosphate salts. In an open circuit mode, the effluent COD was 207 ± 6 mg L-1 while
the anolyte pH was 7.10 ± 0.06. The polarization test indicated that there was no obvious power
overshoot in the high current zone where low external resistance was applied (Figure 4.5); thus,
the current generation increased as the external resistance decreased. RSF clearly decreased with
increasing current generation (Figure 4.4B). In the open circuit mode where there was no current
generation and zero total Coulomb, RSF was 16.3 ± 2.8 gMH. Applying an external resistor of 100
72
Ω to the electrical circuit produced the total Coulomb of 90 C, and decreased RSF to 9.1 ± 2.1
gMH. Further decreasing the external resistance increased current generation and also reduced
RSF. The lowest external resistance of 1 Ω resulted in a total Coulomb production of 311 C in a
batch; meanwhile, RSF was 3.9 ± 0.7 gMH, a reduction of 76.1 ± 4.3% compared to that of the
open circuit condition.
Water flux was not changed significantly with current/Coulomb production (Figure 4.4B and
Figure 4.6), likely due to small change in osmotic pressure difference that resulted in little water
flux variation. Water flux is governed by the osmotic pressure difference (Δ π) between the anode
(feed) and the cathode (draw), and RSF can reduce Δ π by increasing the anolyte salinity and
reducing the catholyte salinity. Dilution of the catholyte due to water extraction would also
decrease Δ π. After 6-h operation, the osmotic pressure difference in the OsMFC with 3.9 ± 0.7
gMH RSF was 86.3 ± 0.8% of its initial Δ π, while it was 78.5 ± 0.8% of the initial Δ π in the open
circuit mode with 16.3 ± 2.8 gMH RSF. The difference in final Δ π between those two conditions
resulted from the different RSF, however, the final Δ π difference only contributed to 3.2 ± 0.7 mL

73
water extraction difference, which could be neglected during experimental measurement. Hence,
current/Coulomb production did not significantly affect the water flux in OsMFCs.
Figure 4.4 The OsMFC performance with different
external resistance: (A) current generation; and (B)
water flux and reverse salt flux (RSF).
Figure 4.5 Polarization curve of the OsMFC.
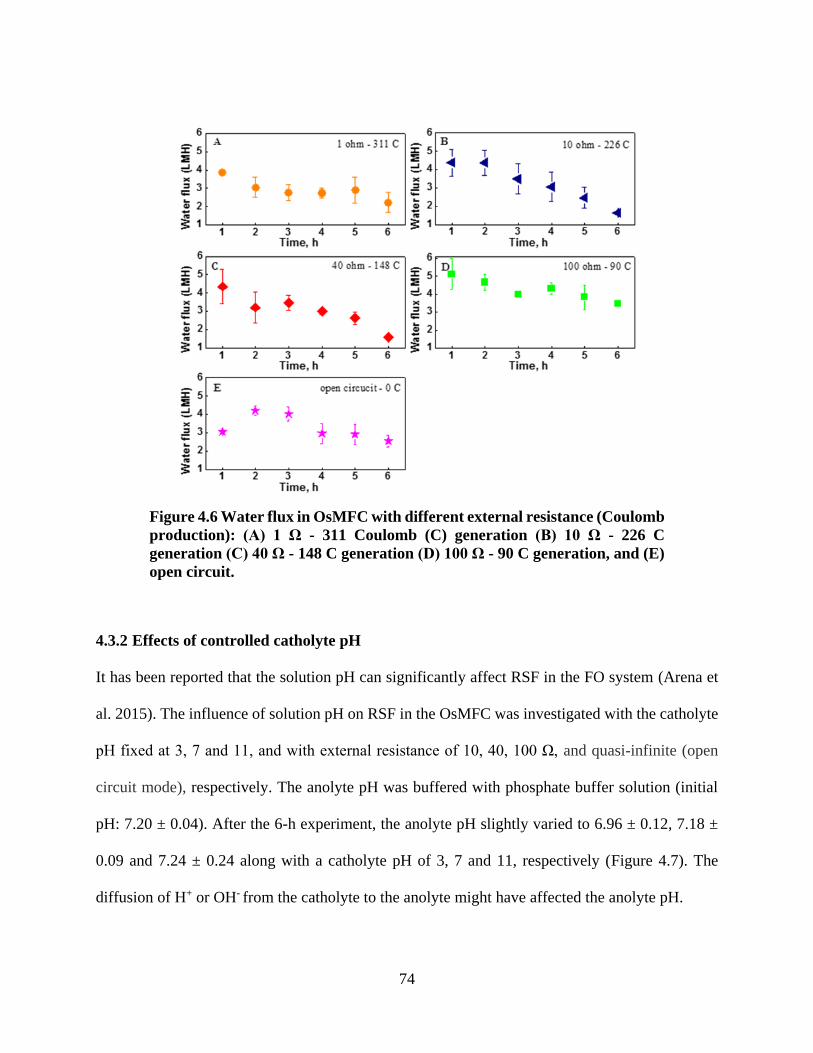
74
4.3.2 Effects of controlled catholyte pH
It has been reported that the solution pH can significantly affect RSF in the FO system (Arena et
al. 2015). The influence of solution pH on RSF in the OsMFC was investigated with the catholyte
pH fixed at 3, 7 and 11, and with external resistance of 10, 40, 100 Ω, and quasi-infinite (open
circuit mode), respectively. The anolyte pH was buffered with phosphate buffer solution (initial
pH: 7.20 ± 0.04). After the 6-h experiment, the anolyte pH slightly varied to 6.96 ± 0.12, 7.18 ±
0.09 and 7.24 ± 0.24 along with a catholyte pH of 3, 7 and 11, respectively (Figure 4.7). The
diffusion of H+ or OH- from the catholyte to the anolyte might have affected the anolyte pH.
Figure 4.6 Water flux in OsMFC with different external resistance (Coulomb
production): (A) 1 Ω - 311 Coulomb (C) generation (B) 10 Ω - 226 C
generation (C) 40 Ω - 148 C generation (D) 100 Ω - 90 C generation, and (E)
open circuit.

75
The catholyte pH exhibited strong effects on RSF through interaction with current generation.
With the same external resistance, a higher catholyte pH led to a higher RSF (Figure 4.8A). For
example, when the external resistance was 40 Ω, RSF was 6.6 ± 2.2 gMH, 8.4 ± 3.3 gMH, and
12.2 ± 1.2 gMH at the catholyte pH of 3, 7 and 11, respectively. This difference was related to
electricity generation under different pH conditions. The total Coulomb production with 40 Ω was
171 C, 153 C and 142 C at the catholyte pH of 3, 7 and 11, respectively (Figure 4.8B). When
operated in the open circuit mode (without current generation), the OsMFC showed the highest
RSF under every pH (Figure 4.8A). A higher catholyte pH would create more potential loss (0.059
V/pH), resulting in lower electricity generation (Zhao et al. 2006). The lower electricity generation
would have less inhibition of RSF. In addition, the high pH could affect the membrane surface
chemistry, resulting in a higher RSF in an FO process (Arena et al. 2015). The reduction on RSF
benefited from current generation was more significant at high catholyte pH. For example, at the
catholyte pH of 11, RSF decreased from 18.1 ± 0.7 gMH to 7.0 ± 2.0 gMH when the external
resistance decreased from 100 Ω to 10 Ω (the Coulomb production increased from 78 to 241 C,
Figure 4.8B). This represents 57.0 ± 3.1% reduction in RSF, much higher than 27.8 ± 4.3% (at pH
Figure 4.7 pH variation in anolyte and catholyte with fixed catholyte pH. The
external resistance was 40 Ω.

76
3) and 42.9 ± 2.5% (at pH 7). Therefore, high current generation could depress the effect of high
catholyte pH on RSF.
The effect of the anolyte pH on RSF was not investigated here but may occur. In the anode, the
oxidation of the substrates would decrease the anode pH due to the generation of proton and lack
of buffer capacity. When the anolyte was acidic, the amount of deprotonated carboxylic acid
groups would decrease, which may decrease the RSF. However, a lower anolyte pH could inhibit
the bioelectrocatalytic activity of anodic microorganisms, increase the internal resistance, and
decrease the system stability (Harnisch and Schröder 2009, Raghavulu et al. 2009). As a result,
Figure 4.8 The effects of the controlled catholyte pH and external resistance:
(A) RSF; and (B) total Coulomb production. Quasi-infinite resistance was in
open circuit mode and didn’t have current generation.
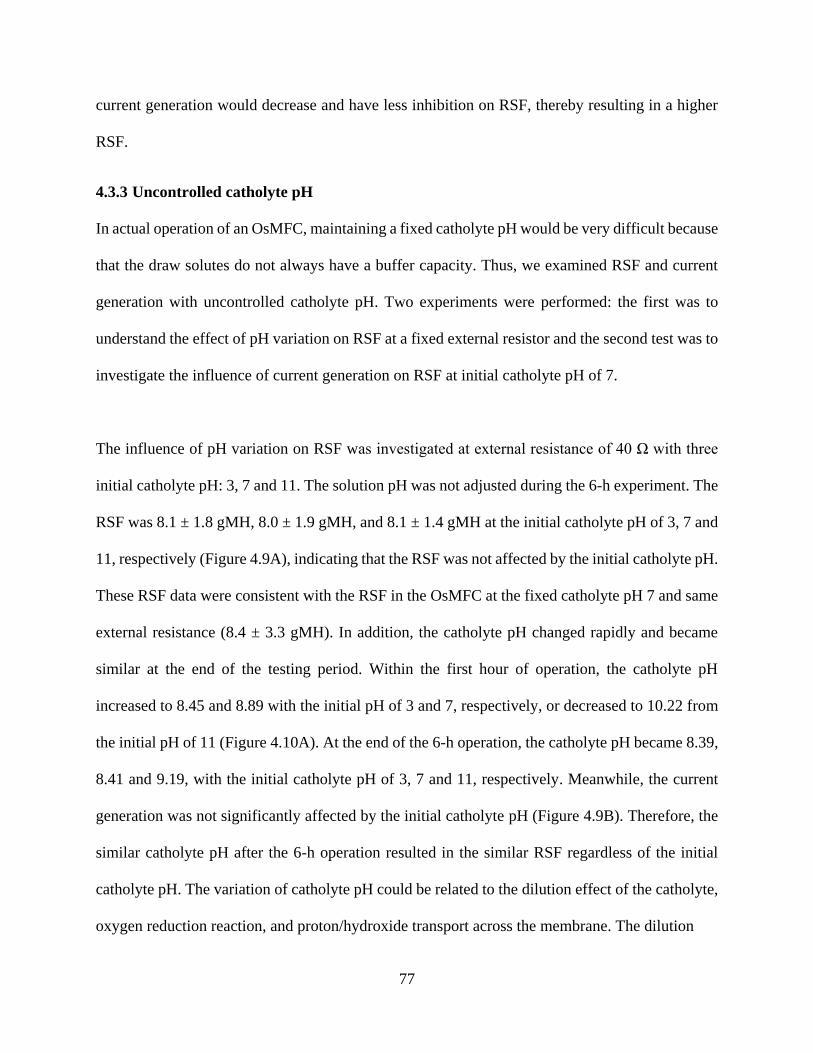
77
current generation would decrease and have less inhibition on RSF, thereby resulting in a higher
RSF.
4.3.3 Uncontrolled catholyte pH
In actual operation of an OsMFC, maintaining a fixed catholyte pH would be very difficult because
that the draw solutes do not always have a buffer capacity. Thus, we examined RSF and current
generation with uncontrolled catholyte pH. Two experiments were performed: the first was to
understand the effect of pH variation on RSF at a fixed external resistor and the second test was to
investigate the influence of current generation on RSF at initial catholyte pH of 7.
The influence of pH variation on RSF was investigated at external resistance of 40 Ω with three
initial catholyte pH: 3, 7 and 11. The solution pH was not adjusted during the 6-h experiment. The
RSF was 8.1 ± 1.8 gMH, 8.0 ± 1.9 gMH, and 8.1 ± 1.4 gMH at the initial catholyte pH of 3, 7 and
11, respectively (Figure 4.9A), indicating that the RSF was not affected by the initial catholyte pH.
These RSF data were consistent with the RSF in the OsMFC at the fixed catholyte pH 7 and same
external resistance (8.4 ± 3.3 gMH). In addition, the catholyte pH changed rapidly and became
similar at the end of the testing period. Within the first hour of operation, the catholyte pH
increased to 8.45 and 8.89 with the initial pH of 3 and 7, respectively, or decreased to 10.22 from
the initial pH of 11 (Figure 4.10A). At the end of the 6-h operation, the catholyte pH became 8.39,
8.41 and 9.19, with the initial catholyte pH of 3, 7 and 11, respectively. Meanwhile, the current
generation was not significantly affected by the initial catholyte pH (Figure 4.9B). Therefore, the
similar catholyte pH after the 6-h operation resulted in the similar RSF regardless of the initial
catholyte pH. The variation of catholyte pH could be related to the dilution effect of the catholyte,
oxygen reduction reaction, and proton/hydroxide transport across the membrane. The dilution

78
Figure 4.10 The OsMFC performance with uncontrolled catholyte pH: (A) measured (actual)
and calculated pH value with different initial catholyte pH (external resistance of 40 Ω); and
(B) water flux and RSF with different external resistance (initial catholyte pH of 7).
Figure 4.9 Performance of the OsMFC with 40 Ω resistor and uncontrolled
catholyte pH: (A) water flux and RSF and (B) current density.

79
effect on the catholyte pH due to water flux was very minor, contributing to about 0.2-unit pH
change in the catholyte. The final catholyte pH was lower than a theoretical catholyte pH calculated
based on the hydroxide ion production (oxygen reduction reaction) from the transferred charge
(Figure 4.10A) (Werner et al. 2013), indicating that the pH difference could be related to the
promoted proton transport. Proton flux could be improved with water flux from the anode to the
cathode, which was not considered in the theoretical calculation (Werner et al. 2013). Meanwhile,
RSF might stimulate the transport of OH- from the cathode into the anode for charge neutrality,
thereby influencing the catholyte pH.
When there was no current generation in the OsMFC (open circuit), the RSF was 18.7 ± 1.0, 18.2
± 1.0, and 19.3 ± 1.1 gMH with the initial catholyte pH 3, 7, and 11, respectively (Figure 4.11),
indicating that the RSF was not affected by the initial catholyte pH in an open circuit mode. The
open circuit operations excluded the effect of oxygen reduction reaction on RSF, and there was
relatively stable anolyte pH (~7) during the 6-h operation regardless of the initial catholyte pH. In
the open circuit mode, the final catholyte pH was 7.05 ± 0.12, 7.10 ± 0.07 and 8.23 ± 0.05 when
the initial catholyte pH of 3, 7, and 11, respectively, indicating that the catholyte pH significantly
changed during the operation, which could be related to the proton/hydroxide transport across the
membrane driven by concentration gradients.
RSF was also examined under different current generation and at an uncontrolled catholyte pH
(initially 7). When the external resistance decreased from 100 Ω to 1 Ω, the maximum current
density increased from 14 A m-3 to 89 A m-3 and the total Coulomb production increased from 78
C to 289 C (Figure 4.10B). Like the previous test with the controlled catholyte pH, water flux did

80
not change significantly with varied total Coulomb, but RSF significantly decreased from 21.7 ±
1.7 gMH to 8.6 ± 1.8 gMH.
4.3.4 Ion transport in the OsMFC
RSF is the reverse ion transport of draw solute, which includes both Na+ and Cl– in the present
OsMFC that used sodium chloride as a draw solute. The mechanism of RSF in the OsMFC was
investigated by studying the ion transport (Na+ and Cl–) affected by electricity generation and the
catholyte pH. The measured concentrations of Na+ and Cl– ions were consistent with RSF
calculated from conductivity change. As the total Coulomb production increased from 90 C to 226
C, the transport of Na+ decreased from 20.2 ± 0.1 mmol to 18.7 ± 0.7 mmol, and the transport of
Cl- decreased from 17.0 ± 0.5 mmol to 11.8 ± 1.6 mmol (Figure 4.12A). When the (controlled)
catholyte pH increased from 3 to 11, the transport of Na+ increased from 18.2 ± 0.2 mmol to 24.0
± 1.8 mmol and the transport of Cl- increased from 13.1 ± 0.8 mmol to 20.0 ± 2.2 mmol (Figure
4.12B).
Figure 4.11 Water flux and RSF of the OsMFC with open circuit and
uncontrolled catholyte pH.

81
One can observe that Na+ and Cl- ions were not transported at an equal amount, and more Na+
migrated across the FO membrane than Cl-. TFC membrane could behave similarly to a cation
exchange membrane when the carboxylic acid groups in the active layer become deprotonated (-
COOH becomes -COO-), which will favor the transport of Na+ and hinder the transport of Cl-
(Arena et al. 2015, Arena et al. 2014, Lu et al. 2014a, Tang et al. 2007). The mechanism of ion
transport in the present OsMFC was proposed in Figure 4.13. The difference between the
transported molar amount of Na+ and Cl- could be balanced by the forward transport of protons
from the anode to the cathode for charge neutrality. When the OsMFC was operated in open circuit,
Na+ moved across the TFC membrane from the cathode to the anode due to its high electrostatic
attraction to the negatively charged polyamide surface, and dragged the Cl- across the membrane
to maintain the electroneutrality in the anode (Lu et al. 2014a, Phillip et al. 2010). The transport
Figure 4.12 Transport of sodium (Na+) and chloride (Cl–) ions to
the anode: (A) affected by Coulomb production; and (B) affected
by the catholyte pH.

82
of Na+ was affected by the current generation in the OsMFC, because electrons moving from the
anode electrode to the cathode electrode facilitated the forward transport of Na+ (from the anode
to the cathode) and inhibited the reverse transport, resulting in a decreased net transport of Na+
from the cathode to the anode. As the total Coulomb production increased from 90 C to 226 C, the
percentage of the transported Na+ decreased from 10.1 ± 0.5% to 6.7 ± 0.3%. The decreased Na+
transport could repel the reversed Cl- transport and thus decrease RSF. As the catholyte pH
increased from 3 to 11, more carboxylic acid functional groups became deprotonated, improving
negative charge densities on membrane surface that would facilitate cation transport across the
membrane, which positively correlated with RSF.
4.3.5 Mechanism of reduced RSF in the OsMFC
We further studied the salt transport in two mechanisms, diffusion and EDM, according to Nernst-
Planck equation. Diffusion was driven by the concentration gradient, while EDM is generated by
current or charge difference and can transport certain charged ions (anion/cation) to balance the
Figure 4.13 Proposed mechanism of the ion transport (orange: Na+; green: Cl−) across
the TFC membrane. The arrows represent the flux of ions (orange: reverse flux of Na+;
green: reverse flux of Cl− dragged by Na+ transport; yellow: forward flux of Na+ driven
by current; purple: reverse Na+ flux inhibited by current; red: increased reverse flux
of Na+ by increased catholyte pH).

83
charge. The analysis shows that the percentage of diffusion and EDM was affected by the current
generation and catholyte pH (Fig. 6). In the OsMFC, the electricity generation inhibited the EDM
of ions from the cathode to the anode and led to a higher percentage of diffusion. As the total
Coulomb production increased from 90 C to 226 C, the percentage of EDM decreased from 59.0
± 3.6% to 26.4 ± 1.2% and the percentage of diffusion increased from 41.0 ± 3.6% to 73.6 ± 1.2%
(Figure 4.14A). RSF decreased along with the current generation was likely due to the reduced
EDM. As the current generation (total Coulomb production) increased, more electrons flew from
the anode to the cathode. The EDM of Na+ from the cathode to the anode was in the opposite
direction from the electron flow, which would be repulsed and reduced as the increase of electron
flow. The contribution of EDM to RSF increased as the catholyte pH increased (Figure 4.14B),
resulting in a lower RSF in the OsMFC. When the (controlled) catholyte pH increased from 3 to
11, the percentage of EDM increased from 42.1 ± 5.3% to 70.1 ± 1.1% and the percentage of
diffusion decreased from 57.9 ± 5.3% to 29.9 ± 1.1%. When the catholyte pH decreased, the
deprotonated carboxyl groups in the active layer also decreased, leading to a lower charge
difference across the membrane and thus a lower EDM.
In this study, the irreversible fouling of FO membrane was excluded, because of the short-term
test and frequent membrane cleaning. However, we should acknowledge that membrane fouling
could interact with current generation and pH, with consequent impact on RSF. Previous studies
have reported controversial conclusions about the influence of membrane fouling on current
generation: Werner et al. found that membrane fouling led to water flux decline but the power
generation was unaffected, while Ge et al. and Zhu et al. suggested that the membrane fouling
could benefit the current generation (Ge and He 2012, Werner et al. 2013, Zhu et al. 2016). The
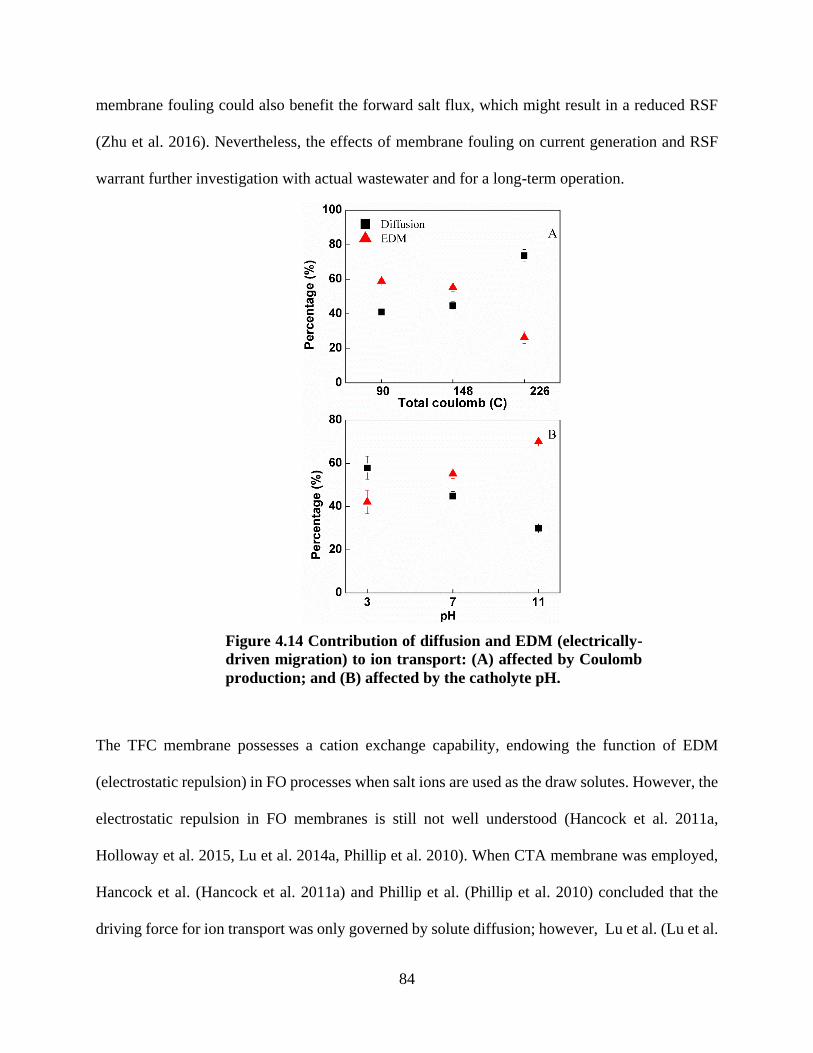
84
membrane fouling could also benefit the forward salt flux, which might result in a reduced RSF
(Zhu et al. 2016). Nevertheless, the effects of membrane fouling on current generation and RSF
warrant further investigation with actual wastewater and for a long-term operation.
The TFC membrane possesses a cation exchange capability, endowing the function of EDM
(electrostatic repulsion) in FO processes when salt ions are used as the draw solutes. However, the
electrostatic repulsion in FO membranes is still not well understood (Hancock et al. 2011a,
Holloway et al. 2015, Lu et al. 2014a, Phillip et al. 2010). When CTA membrane was employed,
Hancock et al. (Hancock et al. 2011a) and Phillip et al. (Phillip et al. 2010) concluded that the
driving force for ion transport was only governed by solute diffusion; however, Lu et al. (Lu et al.
Figure 4.14 Contribution of diffusion and EDM (electrically-
driven migration) to ion transport: (A) affected by Coulomb
production; and (B) affected by the catholyte pH.

85
2014a) and Holloway et al. (Holloway et al. 2015) alleged that the electrostatic repulsion is not
neglectable in CTA membrane. When TFC membrane was used, the electrostatic repulsion played
a more important role in ion transport due to the functional groups (Holloway et al. 2015, Lu et al.
2014a). In the OsMFC with TFC membrane, increased current generation and decreased catholyte
pH could suppress EDM (electrostatic repulsion) and thus decrease RSF. This is a new benefit of
the OsMFCs that has not been identified before and could have important implications to OsMFC
development and applications. For example, the new benefit of RSF reduction will raise the
question whether an OsMFC should be operated under high power output (for energy production)
or high current generation (for RSF reduction). This will require detailed analysis of potential
tradeoff between energy production and the benefit of RSF reduction. It also implies to the general
FO field that electricity may be used to control RSF, but the associated energy input must be clearly
understood.
4.4 Conclusions
We have successfully achieved reduced RSF in an OsMFC, and this finding can help with
developing an effective strategy for controlling RSF, which is one of the major challenges in FO-
based treatment. The main conclusions and results are summarized as:
Electricity generation could reduce RSF by more than 75%, compared to that of the open
circuit (no electricity generation).
The catholyte pH exhibited strong effects on RSF through interaction with current
generation, and a lower catholyte pH would have more RSF inhibition due to higher
electricity generation.

86
More Na+ migrated across the FO membrane than Cl-, because that TFC membrane
possessed a certain capacity for cation exchange.
Two mechanisms, diffusion and electrically-driven migration, were proposed to explain
the ion transport across the FO membrane. The electricity generation inhibited the EDM of
ions and led to a higher percentage of diffusion.

87
Chapter 5 Ammonium removal from synthetic wastewater promoted by
current generation and water flux in an osmotic microbial fuel cell
(This section has been published as Qin, M., Hynes, E. A., Abu-Reesh, I. M., & He, Z.* (2016).
Ammonium removal from synthetic wastewater promoted by current generation and water flux
in an osmotic microbial fuel cell. Journal of Cleaner Production, 149, 856-862.)
Abstract
Recovering useful resource from wastes represents a new approach of clean production with
significant environmental and economic benefits. Ammonium nitrogen, which is an important
inorganic contaminant and also a resource for fertilizer, can be removed and recovered from
wastewater. As the first step of recovery, ammonium removal was successfully demonstrated in
this study by using an innovative treatment system - osmotic microbial fuel cells (OsMFC). This
OsMFC achieved the removal efficiency of 80.1 ± 2.0 % with an anolyte flow rate of 0.4 mL min-
1. Current generation was a key driving force for ammonium ion movement and increasing current
generation from 0 to 1.8 ± 0.1 A m-2could greatly enhance the removal efficiency from 40.7 ± 2.4
% to 85.3 ± 3.5 %. When current generation was similar, water flux could contribute significantly
to facilitating ammonium removal, and as a result the OsMFC exhibited 55.2 ± 6.5 % higher
ammonium removal with water flux of 1.3 ± 0.2 LMH than that without water flux. In addition,
ion diffusion and ion exchange contributed to 17.3 ± 2.4 % and 2.8 ± 0.1 % of ammonium removal,
respectively, with 35 g L-1 NaCl as a catholyte. The key challenges such as the exact mechanism
of ammonium transport, disposal of ammonium residue after recovery, effects of draw solutes, and
system scaling up have been identified and discussed. The results of this study will help develop
an efficient approach for NEW recovery (NEW: nutrient, energy and water) from wastewater.

88
5.1 Introduction
Nitrogen removal from wastewater is of great importance to protect receiving water from
eutrophication (Matassa et al. 2015b). The primary form of nitrogen in wastewater is ammonia
(Sprynskyy et al. 2005), which can be biologically converted to nitrogen gas via nitrification and
denitrification, or anaerobic ammonium oxidation (anammox) (Ahn 2006b, Gupta et al. 2015).
Significant energy/chemical input is required by biological nitrogen removal. Meanwhile,
ammonia nitrogen is a key fertilizer component for agricultural production, and more than 90% of
the world ammonia is produced by using the Haber-Bosch synthesis process, which consumes 1-
2% of the world energy to synthesize ammonia from hydrogen gas and nitrogen gas under a high
pressure (Bicer et al. 2016). Therefore, both the need for ammonia removal from wastewater and
the high energy demand for synthesizing ammonia stimulate the interest in recovering ammonia
from wastewater, instead of removal, and such recovery will synergistically address the nexus of
food, energy, and water.
Ammonia can be recovered from wastewater by using an emerging technology - microbial fuel
cells (MFCs) (Arredondo et al. 2015, Kelly and He 2014). In MFCs, organic compounds in
wastewater are oxidized by the exoelectrogens growing on an anode electrode and the generated
electrons can spontaneously flow from the anode electrode to a cathode electrode for electricity
generation (Li et al. 2014a). Electron flow will drive transport of ions between the anode and the
cathode to keep electroneutrality, depending on the types of ion exchange membrane used in an
MFC. When cation exchange membrane (CEM) is used, cations such as protons, sodium ions and
ammonium ions will migrate from the anode into the cathode. As a result of cathode reduction
reaction, the pH of the catholyte could increase to above 11-12, which will facilitate conversion of

89
ammonium to ammonia for subsequent recovery by stripping. Ammonia recovery by MFCs has
been successfully demonstrated in laboratory studies (Kuntke et al. 2011), and higher current
generation would greatly enhance the ammonia recovery (Haddadi et al. 2013, Kuntke et al. 2014).
Ammonia can be recovered from various types of ammonium-rich wastewater, such as urine,
landfill leachate, and swine wastewater (Kim et al. 2008, Kuntke et al. 2011, Kuntke et al. 2012,
Qin et al. 2016b, Zhang et al. 2014a).
To enhance water recovery in MFCs, osmotic microbial fuel cells (OsMFCs) were developed
through integrating forward osmosis (FO) with MFCs (Lu et al. 2014b, Zhang et al. 2011a). In
OsMFCs, FO membrane instead of CEM is used to separate the anode and the cathode and this
semipermeable membrane only permeates water molecules from high water potential to low water
potential driven by an osmotic pressure gradient (Cath et al. 2006). Like conventional MFCs,
electricity is generated from the oxidation of organics by exoelectrogens in an anode and a terminal
electron acceptor such as oxygen is reduced on a cathode catalyzed by catalysts. The difference
from conventional MFCs is that OsMFCs can extract high quality water from the anolyte (e.g.,
wastewater) by using FO membrane. In addition, OsMFCs can generate more electricity under
both a batch mode and a continuous mode using either sodium chloride solution or artificial
seawater as the catholyte (Ge et al. 2013b, Zhang et al. 2011a). More than 50% of the treated
wastewater could be extracted from the anode of an OsMFC (Ge et al. 2013b, Ismail and Ibrahim
2015). To improve our understanding of enhanced electricity generation in OsMFCs, a
mathematical model has been developed and used to predict a reduction of internal resistance with
increasing osmotic pressure gradient and water flux, thereby confirming the enhanced current
generation (Qin et al. 2015). It was also reported that in an OsMFC, reverse salt flux (RSF), which

90
is backward transport of salt ions across the FO membrane into the treated wastewater, was
significantly inhibited by the current generation (Qin et al. 2016a).
Higher current generation in OsMFCs encourages the exploration of recovering ammonia, which
relies on ammonium transport driven by current generation. The past OsMFC studies focus on
recovery of resources such as electricity and water, but ammonia recovery in OsMFCs has not
been investigated. Unlike CEM, FO membrane cannot selectively transport ions. However, the
unique feature of OsMFCs, water flux, has been found to help improve current generation.
Therefore, it will be of great interest to accomplish ammonia recovery in OsMFCs, making
OsMFCs a promising technology for “NEW recovery” (NEW: nutrient, energy and water). In this
study, we have investigated ammonium removal in a laboratory OsMFC towards understanding of
the effects of current generation and water flux on ammonia removal. The recovery of ammonia
gas was beyond the scope of this work but it has been performed in various studies via highly
efficient absorption in acids (Kuntke et al. 2012, Liu et al. 2016, Wu and Modin 2013). The
specific objectives were to: (1) demonstrate the feasibility of ammonium removal in an OsMFC;
(2) investigate the effect of the current generation and water flux on ammonium removal; and (3)
explore the mechanism of ammonium removal in the OsMFC.
5.2 Materials and Methods
5.2.1 OsMFC setup
The OsMFC consisted of two equal-size compartments (14×7×3.7 cm3/each with a liquid volume
of 280 mL) as the anode and the cathode, respectively, separated by a TFC FO membrane
(Hydration Technology Innovations, LLC, Albany, OR, USA) with its active layer facing the

91
anode (feed) side. Plastic mesh was placed on both sides of the FO membrane as support materials.
Two carbon brushes (Gordon Brush Mfg. Co. Inc., Commerce, CA, USA) were pretreated by being
soaked in pure acetone overnight and heat-treated in a muffle furnace (Model 550 Isotemp Series,
Fisher Scientific, Pittsburgh, PA, USA) at 450 °C for 30 minutes; after pretreatment they were
inserted into the anode compartment as the anode electrodes. The cathode electrode was a piece of
carbon cloth coated with Platinum (Pt) as the catalyst for oxygen reduction reaction (0.3 mg Pt cm-
2). Before use, the TFC membrane was soaked in deionized (DI) water for 30 min according to the
manufacturer's instruction (Stillman et al. 2014). The surface area of the FO membrane was about
98 cm2.
5.2.2 OsMFC operation
The OsMFC was operated at room temperature of ~21 °C. The anode compartment was inoculated
with anaerobic sludge from the Peppers Ferry Regional Wastewater Treatment Plant (Radford,
VA, USA). To mimic the digestion effluent of livestock waste (Park et al. 2010), the anode influent
solution was prepared containing (per liter of deionized water): sodium acetate, 1.5 g; NH4Cl, 3.0
g; NaHCO3, 2.0 g; NaCl, 0.15 g; MgSO4, 0.005 g; CaCl2, 0.006 g; and trace elements solution, 1
mL (Angenent and Sung 2001). The initial concentration of COD in the anode influent was 1200
mg L-1 while the initial concentration of ammonium nitrogen (NH4+-N) was 780 mg L-1. Sodium
chloride was used as the draw solute for water extraction. To avoid the difference in performance
caused by reactor manufacturing, the same OsMFC reactor was used for all the tests. The OsMFC
was operated in a continuous mode. The 2-L bottles were connected to the anode and cathode
compartments as reservoirs and placed on digital balance for monitoring water flux. The cathode
compartment was aerated with the air to provide oxygen for cathode reaction and create flow
turbulence. To study the effects of current generation, the external resistance was adjusted to four
92
levels (10 Ω, 20 Ω, 40 Ω and quasi-infinite or open circuit mode), and the catholyte was 35 g L-1
NaCl. In the experiments of different water flux, the concentration of the draw solution (catholyte)
was varied at 2 g L-1, 10 g L-1 and 35 g L-1. The effect of the anoltye flow rate on ammonium
removal was investigated with 35 g L-1 NaCl as the catholyte at different flow rates: 0.2 mL min-
1, 0.3 mL min-1 and 0.4 mL min-1. The effect of water flux on ammonium removal was examined
in both closed-circuit condition and open-circuit condition with different catholyte NaCl
concentrations (2 g L-1and 35 g L-1). The ammonium removal with different water flux and same
current generation was studied with two operations: (1) 2 g L-1 NaCl catholyte and 10 Ω external
resistor; and (2) 35 g L-1 NaCl catholyte and 88 Ω resistor. The ammonium transported to the
cathode side could be recovered as ammonia gas, which has been demonstrated in our previous
studies (Liu et al. 2016, Qin and He 2014). The present study focused on the ammonium removal,
and the recovery was not performed.
5.2.3 Measurement and analysis
The OsMFC voltage was recorded every 2 minutes by a digital multimeter (2700, Keithley
Instruments Inc., Cleveland, OH, USA). The polarization curve was performed by using a
potentiostat (Reference 600, Gamry Instruments, Warminster, PA, USA) at a scan rate of 0.2 mV
s-1. The pH was measured by using a benchtop pH meter (Oakton Instruments, Vernon Hills, IL,
USA). The conductivity was measured by using a benchtop conductivity meter (Mettler-Toledo,
Columbus, OH, USA). The volumetric densities of power and current were calculated based on
the liquid volume of the anode compartment, according to a previous study (Zhang et al. 2010).
The concentrations of chemical oxygen demand (COD) and ammonium nitrogen (NH4+-N) were
measured using a DR/890 colorimeter (HACH Co., Ltd., USA) according to the manufacturer’s

93
instruction. The catholyte weight in the reservoir was recorded every 1 min on a digital balance
(Scort Pro, Ohous, Columbia, MD, USA) (Zou and He 2016). The concentrations of Na+ and Cl-
were quantified by using ion chromatography (Dionex LC20 ion chromatograph, Sunnyvale, CA,
U.S.A.) equipped with an ED40 electrochemical detector. The COD removal efficiency
(CODRemoval)was calculated as:
𝑪𝑶𝑫𝑹𝒆𝒎𝒐𝒗𝒂𝒍 = 𝟏 −𝑪𝒆𝒇𝒇𝒍𝒖𝒆𝒏𝒕×𝑸𝒆𝒇𝒇𝒍𝒖𝒆𝒏𝒕
𝑪𝒊𝒏𝒇𝒍𝒖𝒆𝒏𝒕× 𝑸𝒊𝒏𝒇𝒍𝒖𝒆𝒏𝒕 (Equation 5.1)
where Ceffluent and Cinfluent are the COD for effluent and influent (mol L-1), respectively. Qeffluent and
Qinfluent are the flow rate of anode effluent and anode influent (L min-1), respectively.
Water flux Jw across the FO membrane (L m-2 h-1, LMH) was calculated by the weight change of
catholyte solution over time (Wang et al. 2010b).
(Equation 5.2)
where Vc,t and Vc,0 are the volume (L) of the catholyte at the test time t (h) and 0, respectively. The
difference between Vc,t and Vc,0 equals to the weight increase of the draw solution in value (kg)
during this period; Am is the membrane area (m2).
5.3 Results and Discussion
5.3.1 Feasibility of ammonium removal across FO membrane
To examine the feasibility of ammonium removal, the OsMFC was operated with varied NaCl
concentrations in the catholyte. Current density increased from 1.1 ± 0.1 A m-2 to 2.6 ± 0.1 A m-2
(mean value ± standard deviation) when the NaCl concentration increased from 2 g L-1 to 35 g L-1
(Figure 5.1A). Both the membrane resistance and catholyte resistance are related to the reciprocal
of catholyte solution conductivity (Qin et al. 2015). A higher NaCl concentration could increase

94
the catholyte conductivity and decrease both the membrane resistance and catholyte resistance,
thereby increasing current generation. In addition, the OsMFC with 35 g L-1 NaCl had a higher
COD removal efficiency (80.7 ± 1.5 %) than that with 2 g L-1 NaCl (64.7 ± 1.9 %), benefited from
the higher current generation. The ammonium removal efficiency was 23.5 ± 3.5 %, 34.3 ± 5.3 %,
and 52.5 ± 4.7 %, with 2, 10, and 35 g L-1, respectively (Figure 5.1B). When the catholyte NaCl
concentration was 2 g L-1, there was no water flux (0 ± 0.1 LMH) (Figure 5.1B). As the increase
of catholyte NaCl concentration, the osmotic pressure difference (Δ π, calculated from the salt
concentration in two chambers) between the anode (feed) and the cathode (draw) increased and
therefore, the water flux from anode to the cathode increased to 0.7 ± 0.1 LMH and 1.3 ± 0.2 LMH
with a NaCl concentration of 10 g L-1 and 35 g L-1, respectively. Such an increase in water flux
would help with ammonium removal, which will be discussed in the following sections
5.3.2 Effects of anolyte flow rate
The anolyte flow rate is a key operating factor and could affect the loading rates of both organic
compounds and ammonium. When the anolyte flow rate was 0.2 mL min-1, 0.3 mL min-1 and 0.4

95
mL min-1, the ammonium loading rate was 0.5, 1.0, and 1.5 mmol h-1, respectively. During the
test, the catholyte NaCl concentration was maintained at 35 g L-1. Varying the anolyte flow rate
also changed organic input, resulting in increased current generation with a higher flow rate. For
example, current density increased from 1.8 ± 0.1 to 2.6 ± 0.1 A m-2, when the anolyte flow rate
was changed from 0.2 to 0.4 mL min-1 (Figure 5.2A). However, the COD removal efficiency
decreased as the anolyte flow rate increased: 91.3 ± 2.3 %, 85.2 ± 1.1 %, and 80.7 ± 1.5 % with
three flow rates. The ammonium removal efficiency was clearly affected by the anolyte flow rate.
Increasing the anolyte flow rate from 0.2 to 0.4 mL min-1 decreased the ammonium removal
efficiency from 85.3 ± 3.5 % to 52.5 ± 4.7 % (Figure 5.2A). Assuming one electron generated from
the oxidation of organic substrates in the anode moves one ammonium ion from the anode into the
cathode for charge balance, the transport of ammonium ions would contribute to 69.3 ± 1.9 %,
Figure 5.1 Ammonium removal by the OsMFC affected by different
catholyte NaCl concentrations: (A) current generation; and (B) water
flux and NH4+-N removal efficiency.
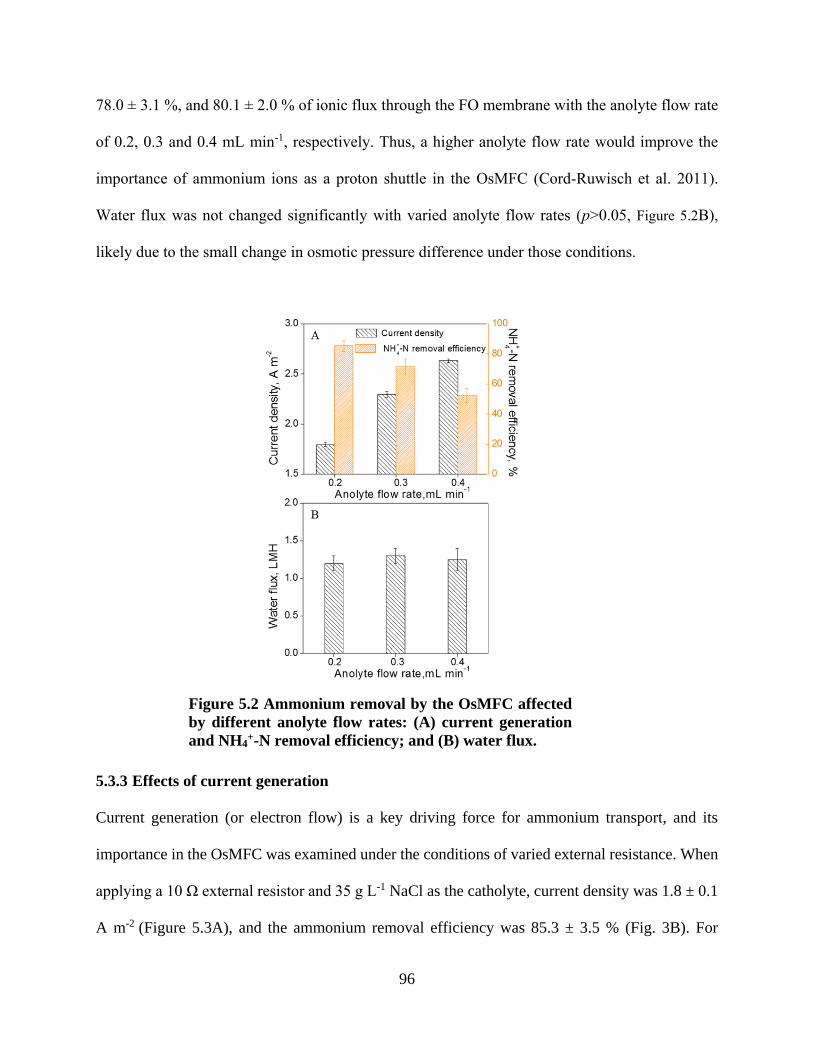
96
78.0 ± 3.1 %, and 80.1 ± 2.0 % of ionic flux through the FO membrane with the anolyte flow rate
of 0.2, 0.3 and 0.4 mL min-1, respectively. Thus, a higher anolyte flow rate would improve the
importance of ammonium ions as a proton shuttle in the OsMFC (Cord-Ruwisch et al. 2011).
Water flux was not changed significantly with varied anolyte flow rates (p>0.05, Figure 5.2B),
likely due to the small change in osmotic pressure difference under those conditions.
5.3.3 Effects of current generation
Current generation (or electron flow) is a key driving force for ammonium transport, and its
importance in the OsMFC was examined under the conditions of varied external resistance. When
applying a 10 Ω external resistor and 35 g L-1 NaCl as the catholyte, current density was 1.8 ± 0.1
A m-2 (Figure 5.3A), and the ammonium removal efficiency was 85.3 ± 3.5 % (Fig. 3B). For
Figure 5.2 Ammonium removal by the OsMFC affected
by different anolyte flow rates: (A) current generation
and NH4+-N removal efficiency; and (B) water flux.

97
comparison, the OsMFC under the open-circuit condition did not generate any current and
removed 40.7 ± 2.4 % of ammonium nitrogen (Figure 5.3B). Further comparison was conducted
with 2 g L-1 NaCl as the catholyte, which led to no water flux due to the lack of osmotic pressure
gradient. Likewise, current generation, although lower at 0.8 ± 0.1 A m-2 than that with 35 g L-1
catholyte, increased the ammonium removal efficiency from 21.4 ± 2.2 % (open circuit condition)
to 47.8 ± 2.2 % (Figure 5.3B). Those results have confirmed the critical role of current generation
in driving ammonium ions out of the anolyte and moving through the FO membrane. In addition
to current-driven movement, ammonium ions could also migrate due to the ammonium
concentration gradient and ion exchange, which resulted in ammonium removal under the open
circuit condition.
Figure 5.3 Ammonium removal by the OsMFC affected by the current
generation: (A) current generation in open and closed circuit conditions;
(B) NH4+-N removal efficiency in closed and open circuit conditions; (C)
polarization curve; and (D) current generation and NH4+-N removal
efficiency with different external resistances.

98
More external resistances were examined to reveal the relationship between ammonium removal
and current generation in the OsMFC. This was investigated at a fixed ammonium loading rate of
0.5 mmol h-1 and fixed catholyte NaCl concentration of 35 g L-1. As shown in the polarization
curve (Figure 5.3C), the open circuit voltage of the OsMFC was 0.78 V with an estimated internal
resistance of 19.2 Ω. Therefore, the external resistance was varied from 10 Ω to 40 Ω to represent
different current generation including the condition of the maximum power output. As expected,
current density increased from 1.0 ± 0.1 A m-2 to 1.8 ± 0.1 A m-2 when the external resistance
decreased from 40 Ω to 10 Ω (Figure 5.3D). Ammonium removal clearly increased from 60.5 ± 3.9
% (40 Ω) to 85.3 ± 3.5 % (10 Ω) with increasing current generation (Figure 5.3D). The highest
ammonium removal efficiency with 10 Ω doubles that under an open circuit condition. A linear
relationship between current generation and ammonium removal efficiency was observed (R2 of
0.969, inset, Figure 5.3D).
5.3.4 Effects of water flux
Water flux is playing an important role in the OsMFC because it can exert effects on water
extraction, current generation and ion transport (and thus ammonium removal). To examine the
effect of water flux, we investigated the ammonium removal in the presence or absence of water
flux. To obtain the same (or similar) current generation (so that we can exclude the effect of current
generation), two conditions were created: first, 2 g L-1 NaCl catholyte and 10 Ω external resistor;
and second, 35 g L-1 NaCl catholyte and 88 Ω resistor. The current densities of those two conditions
were very similar at 0.9 ± 0.1 A m-2 (Figure 5.4A). However, they exhibited very different water
flux, 0 ± 0.1 LMH in the first condition and 1.3 ± 0.2 LMH in the second condition, resulting in
different ammonium removal efficiency of 47.8 ± 2.2 % and 74.2 ± 4.3 %, respectively (Figure

99
5.4B). This demonstrates that water flux could promote ammonium transport from the anolyte
into the catholyte. Some evidence might also be obtained from the prior results under the open
circuit condition: the OsMFC with water flux (with 35 g L-1 NaCl as the catholyte) achieved 40.7
± 2.4 % of ammonium removal, much higher than 21.4 ± 2.2 % without water flux (with 2 g L-1
NaCl as the catholyte) (Figure 5.3B). A previous study has reported that the cation flux could be
increased when sodium was in the feed solution and ammonium was in the draw solution in FO
process, resulting from the ion exchange of cation ions (Lu et al. 2014a). But bioelectricity
generation in an OsMFC could greatly inhibit back flux of cations (e.g., sodium ions) from the
draw into the feed (Qin et al. 2016a) and facilitate forward movement of ammonium from the feed
into the draw. Our analysis showed that ion exchange was not a major contributor to ammonium
movement in the present OsMFC (more details in next section).
Figure 5.4 Ammonium removal by the OsMFC affected by water flux: (A) similar
current generation under two different conditions, 2 g L-1 NaCl as catholyte / 10 Ω
external resistance and 35 g L-1 NaCl as catholyte / 88 Ω external resistance; and (B)
NH4+-N removal efficiency and water flux under those two conditions.

100
5.3.5 Mechanisms of ammonium movement
Despite the important role of current generation and water flux in ammonium removal, there also
other mechanisms contributing to ammonium transport in the present OsMFC, such as ion
diffusion and ion exchange. Thus, in total we identified four mechanisms of ammonium transport:
(1) diffusion of ammonium ions due to a concentration gradient; (2) ammonium ion movement
from the anode to the cathode promoted by water flux; (3) ion exchange between anode ammonium
ion and cathode sodium ions; and (4) migration of ammonium ions driven by current generation
for charge balance. Those contributions were analyzed for improving our understanding (Figure
5.5), but it should be noted that precise quantification is very difficult at this time because of
simultaneous function of multiple mechanisms.
When the OsMFC was operated with 2 g L-1 NaCl catholyte in an open-circuit mode, there was
neither current generation nor water flux and therefore, the ammonium removal was mainly
attributed to the diffusion of ammonium ions and the ion exchange between sodium and
ammonium (Figure 5.5A). Based on the data of reverse fluxed sodium ions, the contribution of ion
exchange was estimated to be only 0.4 ± 0.1 %. Thus, the dominant transport mechanism in the
absence of both water flux and electricity generation would be diffusion, which caused 21.0 ± 2.2
% of ammonium removal from the anode. We assumed the same diffusion contribution in other
conditions due to the same ammonium gradient across the FO membrane, although some variation
would be expected and warrant further investigation. A higher catholyte salinity of 35 g L-1 in the
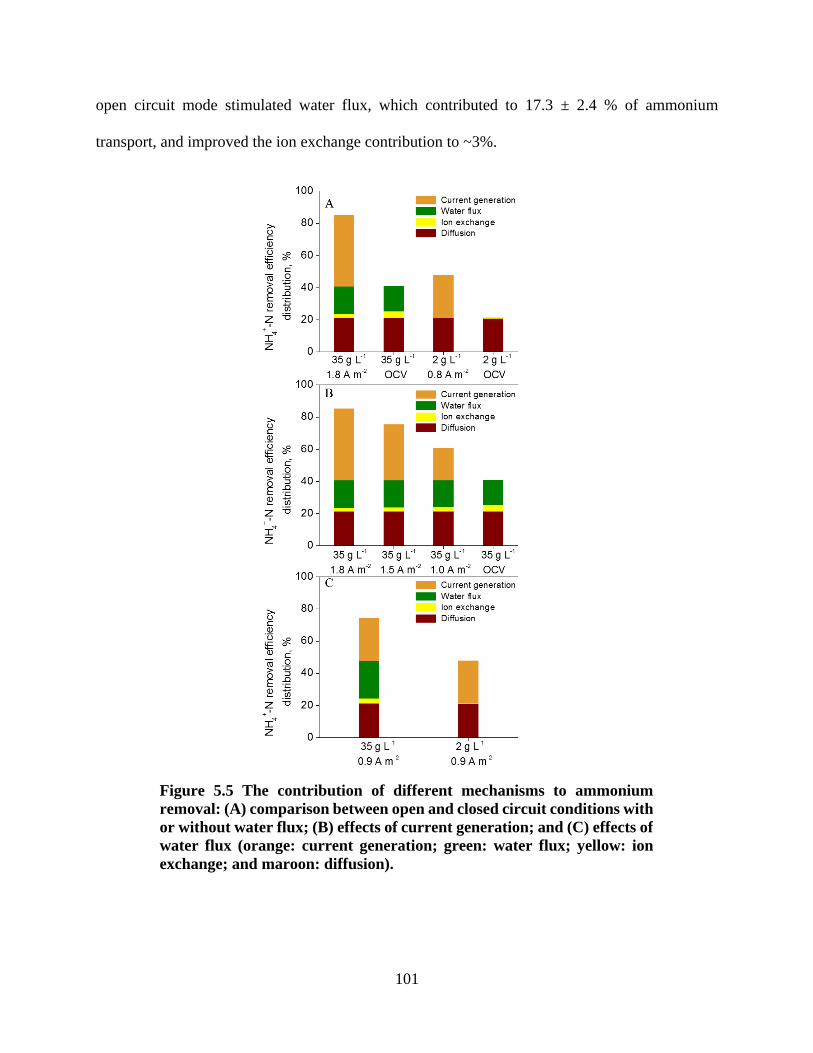
101
open circuit mode stimulated water flux, which contributed to 17.3 ± 2.4 % of ammonium
transport, and improved the ion exchange contribution to ~3%.
Figure 5.5 The contribution of different mechanisms to ammonium
removal: (A) comparison between open and closed circuit conditions with
or without water flux; (B) effects of current generation; and (C) effects of
water flux (orange: current generation; green: water flux; yellow: ion
exchange; and maroon: diffusion).

102
Current generation exhibited a significant contribution of 47.0 ± 3.2 % (35 g L-1) and 26.4 ± 2.2
% (2 g L-1). Increasing current density from 1.0 ± 0.1 to 1.8 ± 0.1 A m-2 also enhanced its
contribution from 19.8 ± 3.9 % to 47.0 ± 3.2 % (Figure 5.5B). It was observed that current
generation decreased the contribution of ion exchange from 3.9 ± 0.1 % (open circuit mode) to 2.3
± 0.1 % (1.8 ± 0.1 A m-2). The contribution of water flux to ammonium removal was distinguished
in the condition of similar current generation (Figure 5.5C). The contribution of current generation
for both operations was similar at ~26 %. The condition of 35 g L-1 NaCl catholyte and 88-Ω
external resistance had additional 26.4 ± 4.4 % of ammonium removal, including 23.4 ± 4.4 %
from water flux and 3.0 ± 0.2 % due to ion exchange. It was reported that proton flux could be
enhanced in an OsMFC, compared to that of an MFC with cation exchange membrane (Zhu et al.
2015); ammonium ions have been considered as a proton shuttle (Cord-Ruwisch et al. 2011) and
thus, water flux may also promote the transport of ammonium ions.
5.3.6 Implications and perspectives
The present study, for the first time, demonstrated the feasibility of ammonium removal in an
OsMFC that could be extended to nitrogen recovery from wastewater (Kelly and He 2014). This
new benefit - nitrogen removal/recovery of the OsMFC, in addition to energy production and water
recovery, will create more application niches and improve technological sustainability. For
example, wastewater containing a large amount of ammonium, such as digester effluent, animal
wastewater, urine, and landfill leachate, can be treated in the OsMFC for contaminant removal and
resource recovery. To further develop OsMFCs towards practical applications, several challenges
must be properly addressed. First, the exact mechanism of water flux promoted ammonium
transport should be better understood. This is important to integrate nitrogen recovery with water
recovery in an FO-based system. Second, although we did not perform ammonia recovery in the

103
present study, our prior work has shown that recovery (via ammonia stripping) would not be 100%
efficient and there will be remaining ammonium in the catholyte (as high as 100-200 mg L-1) (Qin
and He 2014). This ammonium residue can affect the quality of the produced water, and must be
removed, for instance, during draw solute regeneration. Third, it is not clear how ammonium
transport/removal will be affected by the type of draw solute in an OsMFC. Especially, when a
nitrogen-based draw solute such as ammonium bicarbonate (McCutcheon et al. 2006) or fertilizer
(Phuntsho et al. 2011) is used for the purpose of easy regeneration, a smaller concentration gradient
across the FO membrane could decrease ammonium transport from the anode into the cathode and
thus lower the removal. In addition, RSF of nitrogen-based draw solute may also reduce
ammonium removal efficiency. Last, system scaling up of the OsMFC and examination with actual
wastewater for a long-term performance (for investigating system stability and membrane fouling)
will be necessary and important.
5.4 Conclusions
Ammonium removal has been successfully achieved in an OsMFC. A higher anolyte flow rate
would improve the transport of ammonium ions because of more organic inputs and thus higher
current generation. The study confirmed that current generation was also a key factor to drive
ammonium movement across FO membrane. The unique feature of the OsMFC (compared to
conventional MFCs) - water flux was found to be able to promote ammonium transport from the
anolyte into the catholyte. In addition to current generation and water flux, ion diffusion and ion
exchange also contributed to ammonium movement. The findings of this study will help develop
OsMFCs as a sustainable technology for resource recovery from wastewater.
104
Chapter 6 Understanding Ammonium Transport in Bioelectrochemical
Systems towards its Recovery
(This section has been published as Liu, Y., Qin, M. (Co-first author), Luo, S., He, Z.,* &
Qiao, R.* (2016) Understanding Ammonium Transport in Bioelectrochemical Systems
towards its Recovery. Scientific Reports, 6, 22547-22557.)
Abstract
We report an integrated experimental and simulation study of ammonia recovery using microbial
electrolysis cells (MECs). The transport of various species during the batch-mode operation of a
MEC was examined experimentally and the results were used to validate the mathematical model
for such an operation. It was found that, while the generated electrical current through the system
tends to acidify (or basify) the anolyte (or catholyte), their effects are buffered by a cascade of
chemical groups such as the NH3/NH4+ group, leading to relatively stable pH values in both anolyte
and catholyte. The transport of NH4+ ions accounts for ~90% of the total current, thus
quantitatively confirming that the NH4+ ions serve as effective proton shuttles during MEC
operations. Analysis further indicated that, because of the Donnan equilibrium at cation exchange
membrane-anolyte/catholyte interfaces, the Na+ ion in the anolyte actually facilitates the transport
of NH4+ ions during the early stage of a batch cycle and they compete with the NH4
+ ions weakly
at later time. These insights, along with a new and simple method for predicting the strength of
ammonia diffusion from the catholyte toward the anolyte, will help effective design and operation
of BES-based ammonia recovery systems.

105
6.1 Introduction
Nitrogen removal from wastewater is of great importance to protect receiving water from
eutrophication (Matassa et al. 2015b). The primary form of nitrogen in wastewater is ammonia (or
as a product of decomposing organic nitrogen) (Sprynskyy et al. 2005), and thus removing
ammonia from municipal and industrial wastewater prior to discharge is obligatory. Ammonia can
be removed from wastewater using biological or physicochemical methods such as nitrification
and denitrification, ion exchange, air stripping, and anaerobic ammonium oxidation (anammox)
(Ahn 2006a, Gupta et al. 2015). Because ammonia nitrogen is a key fertilizer component for
agricultural applications, recovery instead of removal of ammonia from wastewater can greatly
impact on both sustainable wastewater management and economics. An emerging approach for
recovering ammonia is through bioelectrochemical systems (BES) (Arredondo et al. 2015, Kelly
and He 2014).
In BES-based ammonia recovery systems, organic compounds in wastewater are oxidized by the
exoelectrogens growing on an anode, producing a current through its external circuit (Wang and
Ren 2013). When cation exchange membranes (CEMs) are used (Cheng et al. 2013, Haddadi et al.
2013, Logan et al. 2008b, Rozendal et al. 2006a), the current is carried by cations such as NH4+
ions moving from the anolyte into the catholyte through the CEM. The NH4+ ions, once transported
into the catholyte, are converted into NH3 molecules because the catholyte is usually rendered
basic by the production of OH−ions therein (Haddadi et al. 2014, Kim et al. 2008, Kuntke et al.
2012). Some of these NH3 molecules can then be recovered through gas aeration. This type of
process has been demonstrated in various BES including microbial fuel cells (MFCs) and
microbial electrolysis cells (MECs). In MECs, a higher current density would greatly enhance
106
ammonia recovery (Haddadi et al. 2013), and thus MECs with external power exhibit a better
performance for ammonium recovery than MFCs (Zhang et al. 2014a). It was reported that
ammonia can be recovered from ammonium-rich wastewater, such as synthetic wastewater, urine,
and swine wastewater (Kim et al. 2008, Kuntke et al. 2011, Kuntke et al. 2012, Qin and He 2014).
While a general picture of ammonia recovery using BES is emerging, some issues remain open.
In particular, the transport of NH4+ ions and NH3 is not fully understood despite their essential role
in ammonia recovery. Some studies indicate that NH4+ transport dominates the current across the
CEM (i.e., for each electron passing through the external circuit, ~1 NH4+ ion moves from the
anolyte into the catholyte through the CEM) (Cord-Ruwisch et al. 2011), while other studies
suggest that NH4+ ions may carry only 40% of the total current (Arredondo et al. 2015, Desloover
et al. 2012, Kuntke et al. 2011, Kuntke et al. 2012). In addition, whether NH4+ ions move through
the CEM via diffusion or migration is not clear. A recent study suggests that the migration of NH4+
ions dominates over their diffusion through a comparison of the net NH4+ transport under the close
and open circuit conditions (Haddadi et al. 2013). However, this conclusion was based on the
assumption that the diffusion of NH4+ ions under these conditions is the same, whose
validity/generality is not yet clear. In a seminal simulation study in which key transport phenomena
and chemical reaction within the BES are modeled comprehensively, it was found that the
diffusion of NH3 from the catholyte to the anolyte can greatly reduce the efficiency of recovery
(Dykstra et al. 2014c). However, the condition under which such diffusion is important has not
been delineated yet. Finally, since many cations such as Na+ ions exist in the anolyte, for a given
current through the BES, they may compete with NH4+ ions for transport across the CEM (Kim et
107
al. 2007b, Kuntke et al. 2011, Rozendal et al. 2006a). How strong such competition is and how it
affects the ammonia recovery is not well understood.
Another open issue is how the pH in the anolyte and catholyte is regulated. Since the pH values in
the anolyte/catholyte affect how the total nitrogen content is partitioned between its two forms
(NH4+ ions and NH3), and the latter in turn affects the transport of NH4
+ ions through the CEM and
the recovery of NH3 through aeration, it is essential to regulate these pH effectively. Furthermore,
regulating the anolyte pH is also essential for ensuring microbial activity and hence the reliable
operation of BES (Cheng et al. 2013, He et al. 2008, Zhang et al. 2011b). Maintaining a basic
environment with pH >9 in the catholyte facilitates the conversion of NH4+ ions into NH3, which
is key for the effective recovery of ammonia by aeration. The effective control of the pH in the
anolyte and the catholyte requires a thorough understanding of what governs the pH in these
electrolytes (Jadhav and Ghangrekar 2009, Kim et al. 2007b, Rozendal et al. 2006a). While it is
known that the generation of proton in the anolyte and hydroxide ions in the catholyte plays an
important role in controlling the pH (Dykstra et al. 2014c, Jadhav and Ghangrekar 2009, Kim et
al. 2007b, Kuntke et al. 2014, Kuntke et al. 2012, Rozendal et al. 2006a), how and to what extent
the transport of all ions and their chemical reactions with each other affect the pH is little
understood.
Resolving the above issues using experimental study alone is difficult due to the challenge in
assessing details of all transport processes in the BES. Numerical modeling can address this
challenge, but most prior modeling of BES focused on power production and organic removal
(Peng et al. 2013, Picioreanu et al. 2007, Ping et al. 2014, Qin et al. 2015, Zeng et al. 2010). In the

108
only comprehensive model for BES-based ammonia recovery, the transport and chemical reactions
of major species in BES was studied at a steady state (Dykstra et al. 2014c). The predictions of
this model agree qualitatively with experimental observations and they led to critical insight into
the effects of current density and membrane properties on the ammonia recovery. However, the
model has not been validated by detailed comparison with experiments, and studies based on this
model did not cover the issues described above, e.g., the competition of inert ions (i.e., ions that
do not react with other species within the system, e.g., the Na+ ions) with the NH4+ ions for
transport across the CEM cannot be studied using steady state models. Here, we have studied the
ammonia recovery in a representative BES – microbial electrolysis cells, by integrating
experiments with simulations.
6.2 Materials and Methods
6.2.1 MEC setup
A bench-scale cubic shape MEC was used in this experiment. Both the anode and the cathode
chambers had the same dimension of 9 cm × 4.7 cm × 0.8 cm. The liquid volume of the anode
chamber was 200 mL, while that of the cathode chamber was 180 mL. A CEM (CMI-7000,
Membrane International Inc., Glen Rock, NJ, USA) with a sectional area of 42.3 cm2 was used to
separate anode and cathode chamber. The anode electrode was a carbon brush (Gordon Brush Mfg.
Co., Inc., CA, USA) and the cathode electrode was a piece of 32-cm2 carbon cloth (Zoltek
Companies, Inc., MO, USA) that was coated with 5 mg cm-2 of Pt/C (10% wt. Pt on Carbon
Vulcan, Fuel Cell Earth LLC, USA). The anode was inoculated with the anaerobic sludge from
the Peppers Ferry Regional Wastewater Treatment Plant (Radford, VA, USA). To mimic the
digestion effluent of livestock waste (Park et al. 2010), the anode influent solution was prepared
containing (per liter of deionized water): sodium acetate, 1.5 g; NH4Cl, 3.0 g; NaHCO3, 2.0 g;

109
NaCl, 0.15 g; MgSO4, 0.005 g; CaCl2, 0.006 g; and trace elements solution (Angenent and Sung
2001), 1 mL. The cathode chamber was initially filled with 180 mL of deionized water. An external
voltage of 0.8 V was applied to the circuit by a power supply (CSI3644A, Circuit Specialists, Inc.,
Mesa, AZ, USA) according to a previous study (Yossan et al. 2013). The MEC was operated in a
batch mode at room temperature (~20 °C). The anolyte was partially replaced (75%) every 48 h
while the catholyte was resupplied to initial volume (180 mL) when a new batch cycle started.
Both the anolyte and catholyte were recirculated at a flow rate of 20 mL min-1. The aeration rate
was 375 mL min-1. 2 mL sample were collected regularly from both chambers for measurement
and 1 M H2SO4 was used to absorb the stripped NH3 gas from cathode.
6.2.2 Measurement and analysis
The voltage across a 1-Ω resistor (R) in the MEC circuit was recorded every 2 min by a digital
multimeter (2700, Keithley Instruments Inc., Cleveland, OH, USA). The pH of liquid stream was
measured by two benchtop pH meters installed in the anode and the cathode, respectively (Oakton
Instruments, Vernon Hills, IL, USA and Accumet AB250, Fisher Scientific, Pittsburgh, PA, USA).
The concentrations of chemical oxygen demand (COD) and ammonium nitrogen (NH4+-N) were
measured using a DR/890 colorimeter (HACH Co., Ltd., USA) according to manufacturer’s
instruction. Ionic concentrations (e.g., Na+, Cl-) were quantified by using ion chromatography
(Dionex LC20 ion chromatograph, Sunnyvale, CA, U.S.A.) equipped with an ED40 eletrochemical
detector. The acetate concentration was measured in the anolyte and the catholyte samples that
were filtered through 0.22 um PVDF membrane filter and by high-performance liquid
chromatorgraphy (HPLC) (Shimadzu, Columbia, MD), equipped with an Aminex HPX-87H
column (Bio-Rad, Hercules, CA) and refractive index detector (RID, 10A, Shimadzu). The HPLC

110
column was kept at 65 ºC, and 0.5 mM sulfuric acid solution was used as a mobile phase at flow
rate of 0.6mL min-1.
6.2.3 Mathematical model of BES-based ammonia recovery
We extend the previous steady state theory (Dykstra et al. 2014c) to model the ammonia recovery
in BES operating in the batch mode. The model considers the transport of various species across
the CEM and the acid-base reactions within the entire system. Without loss of generality, the
following species are included: Na+, Cl-, HAc, Ac-, NH4+, NH3, H2CO3, HCO3
-, CO32-, H+ and OH-
. The system is divided into three parts: the anode chamber, the cathode chamber, and the CEM
(Figure 6.1). The anode and the cathode chambers are both (but separately) treated in a lumped
way, and the evolution of the average concentration of a species i inside each chamber follows
𝑉𝑗
𝜕𝐶𝑖𝑗
𝜕𝑡= 𝐴 ⋅ 𝐽𝑖,𝑗
′ − 𝑖,𝑗𝑎 + 𝑖,𝑗
𝑐 𝑉𝑗 (Equation 6.1)
where 𝑉𝑗 is the volume of chamber j (j=1: anode chamber; j=2 cathode chamber), 𝐶𝑖𝑗 is the
concentration of species i in chamber j, 𝐴 is the area of the CEM, and 𝐽𝑖,𝑗′ is the flux of species i
into chamber j. 𝑖,𝑗𝑎 is the removal of species i (e.g., CO2, NH3 etc., acetate removal due to the
aeration is neglected, since it’s concentration in the catholyte is always low, as shown in the study)
from chamber j due to aeration, which is determined by assuming fast equilibrium between species
Figure 6.1 A sketch of the MEC-based ammonia recovery system.

111
dissolved in the catholyte and existing in the aeration gas. Previous study had shown that this
assumption works well. (Dykstra et al. 2014c, Powers et al. 1987) For example, the removal of
NH3 from the cathode chamber, 𝑁𝐻3,2𝑎 , is given by 𝐶NH3
2 𝑄inert/𝑝tot𝐾H,NH, where 𝑄inert and 𝑝tot
are the volumetric flow rate and pressure of the inert aeration gas, respectively. 𝐾H,NH is the
Henry’s constant for NH3 in water. 𝑖,𝑗𝑐 is the generation/removal rate (per volume) of the species
i due to chemical/biological reactions, respectively. Briefly, we consider the consumption of Ac-
by the microbes, the acid-base equilibrium among different species (e.g.,NH4+ NH3 + H+ ,
HAc Ac−+H+ , …). A list of all reactions considered can be found in Table 6.1 in the
Supplementary Information. According to the previous work (Dykstra et al. 2014c), we assume
that the acid-base reactions are fast so that the chemical equilibrium between the species involved
in these reactions is always maintained.
Table 6.1 Equilibrium constants for acid-base reactions and aqueous-solution equilibrium
Constant Reaction Equilibrium equation Value* Ref.
Acid-
base
reaction
Ka,Ac HAc↔Ac-+H+ 𝐾a,Ac =𝐶Ac− ⋅ 𝐶H+
𝐶HAc 0.0174
(Dykstr
a et al.
2014b)
Ka,CA1 H2CO3↔H++HCO3- 𝐾a,CA1 =
𝐶H+ ⋅ 𝐶HCO3−
𝐶H2CO3
4.4668×10⁻⁴
(Dykstr
a et al.
2014b)
Ka,CA2 HCO3-↔H++CO3
2- 𝐾a,CA2 =𝐶H+ ⋅ 𝐶CO3
2−
𝐶HCO3−
4.6774×10⁻⁸
(Dykstr
a et al.
2014b)
Ka,NH NH4+↔NH3+H+ 𝐾a,NH =
𝐶H+ ⋅ 𝐶NH3
𝐶NH4+
5.6234×10⁻⁷
(Dykstr
a et al.
2014b)
Kw H2O↔H++OH- 𝐾w = 𝐶H+ ⋅ 𝐶OH− 1×10⁻⁸
(Dykstr
a et al.
2014b)
Henry’s
constant KH,CO2
𝐾H,CO2=
𝐶CO2,aq
𝑝CO2
33.46
(Dykstr
a et al.
2014b,
Persat
et al.
2009)

112
KH,NH3 𝐾H,NH3
=𝐶NH3,aq
𝑝NH3
56250
(Dykstr
a et al.
2014b)
*The values correspond to concentration unit of mol/m3 and pressure unit of atm;
The CEM is resolved spatially in its thickness direction (x=0 and L correspond to the CEM-anolyte
and CEM-catholyte interfaces, respectively). Each species i at x=0 and L is always in equilibrium
with that in the anode and cathode chambers, respectively (see below for more details). The
distribution of each species i across the CEM, 𝐶𝑖𝑚, is governed by
𝜕𝐶𝑖
𝑚
𝜕𝑡= 𝑖,𝑚
𝑐 + ∇ ⋅ 𝐽𝑖,𝑚 (Equation 6.2)
where 𝑖,𝑚𝑐 is the generation/consumption of species i by acid-base equilibriums and is determined
in the same way as in the electrode chambers. 𝐽𝑖,𝑚 is the flux of species i in the membrane given
by the Nernst-Planck equation (Dykstra et al. 2014c, Higa et al. 1998, Sata 2004):
𝐽𝑖,𝑚 = −𝐷𝑖𝑚 (
𝜕𝐶𝑖𝑚
𝜕𝑥+ 𝑧𝑖𝐶𝑖
𝑚 𝑒
𝑘𝐵𝑇
𝜕𝜙
𝜕𝑥) (Equation 6.3)
where 𝐷𝑖𝑚 and 𝑧𝑖 are the diffusion coefficient in the membrane and valence of species i,
respectively; 𝑒 and 𝑘𝐵𝑇 are the electron charge and thermal energy; 𝜙 is the electrical potential.
Because the concentration of various species inside the anode/cathode chambers evolves slowly at
a time scale of tens of hours but the relaxation of species concentration within the CEM is fast due
to CEM’s small thickness, the time dependence term in Equation 6.2 is unimportant and thus
dropped hereafter.
The concentration distribution of any species i across the anolyte/catholyte-CEM interfaces is
treated as follows. For electrically neutral species, their concentrations are continuous across these

113
interfaces. For a charged species i, we adopt the Donnan equilibrium condition (Dykstra et al.
2014c, Galama et al. 2013, Higa et al. 1998), i.e.,
𝐶𝑖m = exp (−𝑧𝑖𝑒Δ𝜙/𝑘𝐵𝑇)𝐶𝑖
𝑗 (Equation 6.4)
where Δ𝜙 is the electrical potential drop across the CEM-solution interface (usually termed the
Donnan potential). Note that the Donnan potential attract cations into (repel anions from) the CEM
so that the negative fixed charge inside the membrane is balanced by the free ions.
Finally, the electro-neutrality condition and the charge conservation law are enforced:
𝜔𝑋 + Σ𝑖𝑍𝑖𝐶𝑖 = 0 (Equation 6.5)
𝐼 = 𝐹Σ𝑖𝑧𝑖𝐽𝑖 (Equation 6.6)
where 𝜔 is the sign of the fixed space charge in any domain (𝜔 = 0 in the anode/cathode chamber
and zero charge membranes; 𝜔 = −1 and +1 in cation and anion exchange membranes,
respectively). 𝑋 is the fixed charge density of each domain. 𝐹 and 𝐼 are the Faraday constant and
the current density through the CEM.
Equations (Equation 6.1)-(Equation 6.6), along with the equations for various chemical reactions,
form a complete model of the ammonia recovery operation using BES. These nonlinear, time-
dependent equations were solved using MATLAB. In our simulations, all design and operation
parameters of the MEC, e.g., the volume of electrode chamber, aeration rate, and current density
(Figure 6.2a), are taken from that in the experiments unless otherwise mentioned. For the CEM
(CMI-7000) used in this system, 𝑋 was determined to be 5M using the method established in prior
studies (Aeshala et al. 2013, Dykstra et al. 2014c, Sarmidi 2009, Sata 2004). The diffusion
coefficient of various species in the CEM is usually smaller than that in bulk solutions (Chen and

114
Ruckenstein 2015, Dykstra et al. 2014c). The diffusion coefficients of all species are either taken
from prior experimental data or by fitting the current experimental results. In the latter case, care
was taken to ensure that the fitted data are within the range expected for ion diffusion in typical
CEMs (Dykstra et al. 2014c, Haddadi et al. 2013, Kim et al. 2007b, Stenina et al. 2004). A
summary of all parameters used in these simulations is provided in Table 6.2, Table 6.3, and Table
6.4.
Figure 6.2 Comparison of experimental and model studies of ammonia recovery during three batch
cycles of MEC operation. The current density measured experimentally (a) is feed into the models to
predict the various observables of the anolyte and the catholyte: the pH (b), the acetate concentration
(c), the amount of NH3 collected from catholyte by aeration (d), the total nitrogen content (e), and the
transport of Na+ and Cl- ions out of the anolyte (f). Symbols are the experiment data and lines are
model prediction. In (b-e), red lines are for anolyte and blue lines are for catholyte. In (c), the acetate
concentration in catholyte is below the detection limit of our equipment and thus not shown. In (f),
to highlight the relative importance of Na+/Cl- ion transport in the overall charge transport in the
system, their transport is quantified using the cumulative transport number 𝒊+ (see text, 𝒊
+ = 𝟏. 𝟎
means that the charge carried by the transport a species i is equal to the total charge passed through
the membrane). A detailed summary of operating conditions and parameters (e.g., initial species
concentration in anolyte/catholyte) is in provided in Table 6.2, Table 6.3, and Table 6.4.
Table 6.2 System configuration
Parameters Values Notes
A (m2) 42.3×10⁻⁴ Membrane area
V1 (m3) 0.2×10⁻³ Volume of anode chamber
V2(m3) 0.18×10⁻³ Volume of cathode chamber
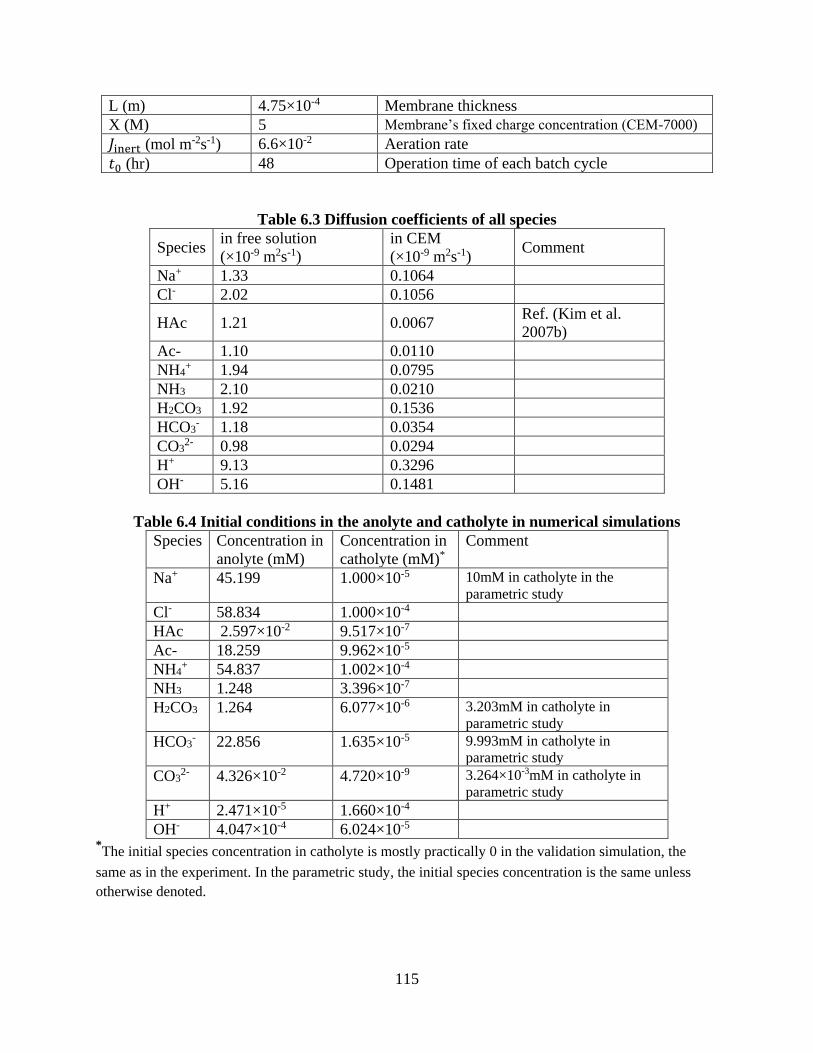
115
L (m) 4.75×10⁻⁴ Membrane thickness
X (M) 5 Membrane’s fixed charge concentration (CEM-7000)
𝐽inert (mol m-2s-1) 6.6×10⁻² Aeration rate
𝑡0 (hr) 48 Operation time of each batch cycle
Table 6.3 Diffusion coefficients of all species
Species in free solution
(×10-9 m2s-1)
in CEM
(×10-9 m2s-1) Comment
Na+ 1.33 0.1064
Cl- 2.02 0.1056
HAc 1.21 0.0067 Ref. (Kim et al.
2007b)
Ac- 1.10 0.0110
NH4+ 1.94 0.0795
NH3 2.10 0.0210
H2CO3 1.92 0.1536
HCO3- 1.18 0.0354
CO32- 0.98 0.0294
H+ 9.13 0.3296
OH- 5.16 0.1481
Table 6.4 Initial conditions in the anolyte and catholyte in numerical simulations
Species Concentration in
anolyte (mM)
Concentration in
catholyte (mM)*
Comment
Na+ 45.199 1.000×10⁻⁵ 10mM in catholyte in the
parametric study
Cl- 58.834 1.000×10⁻⁴
HAc 2.597×10⁻² 9.517×10⁻⁷
Ac- 18.259 9.962×10⁻⁵
NH4+ 54.837 1.002×10⁻⁴
NH3 1.248 3.396×10⁻⁷
H2CO3 1.264 6.077×10⁻⁶ 3.203mM in catholyte in
parametric study
HCO3- 22.856 1.635×10⁻⁵ 9.993mM in catholyte in
parametric study
CO32- 4.326×10⁻² 4.720×10⁻⁹ 3.264×10⁻³mM in catholyte in
parametric study
H+ 2.471×10⁻⁵ 1.660×10⁻⁴
OH- 4.047×10⁻⁴ 6.024×10⁻⁵ *The initial species concentration in catholyte is mostly practically 0 in the validation simulation, the
same as in the experiment. In the parametric study, the initial species concentration is the same unless
otherwise denoted.

116
6.2.4 Modeling of electrochemical and chemical reactions in the MEC
Because of bacteria activity, acetate (Ac-) is oxidized on the anode to release electron and proton:
Ac− + 4H2O → 2HCO3− + 9H+ + 8e−
(Equation 6.7)
Through the external circuit, the released electrons are transferred to the cathode and react with
the oxygen from the aeration:
4e− + O2 + 2H2O → 4OH− (Equation 6.8)
Since both equations are directly related to the electron transfer, the consumption/production of
related species within the system can be modeled as a function of current, and they are referred to
as Faradaic consumption/production in the main text.
The concentration of a species in the anolyte/catholyte/membrane can change due to its transport,
Faradaic reactions (if applicable) and acid-base type chemical reactions. The effects of the acid-
base type reactions are modeled as a sink/source term. Here, we illustrate the treatment of these
acid-base type reactions using the evolution of NH4+/NH3 concentration inside the anolyte as an
example. For this couple, their reaction NH3 + H+ NH4+ and their transport flux collectively
change their concentrations. In the anolyte, the evolution of their concentrations is governed by
𝑉1
𝜕𝐶NH4+
1
𝜕𝑡= 𝐴 ⋅ 𝐽NH4
+,1′ + 𝑉1NH3→NH4
+𝑐 (Equation 6.9)
𝑉1
𝜕𝐶NH3
1
𝜕𝑡= 𝐴 ⋅ 𝐽NH3,1
′ − 𝑉1𝐽NH3,1𝑐 (Equation 6.10)
where 𝐽NH4+,1
′ and 𝐽NH3,1′ are transport of NH4
+ and NH3 into the anolyte through the CEM,
respectively. 𝑉1NH3→NH4+ represents the amount of NH3 converted to NH4
+ due to the reaction
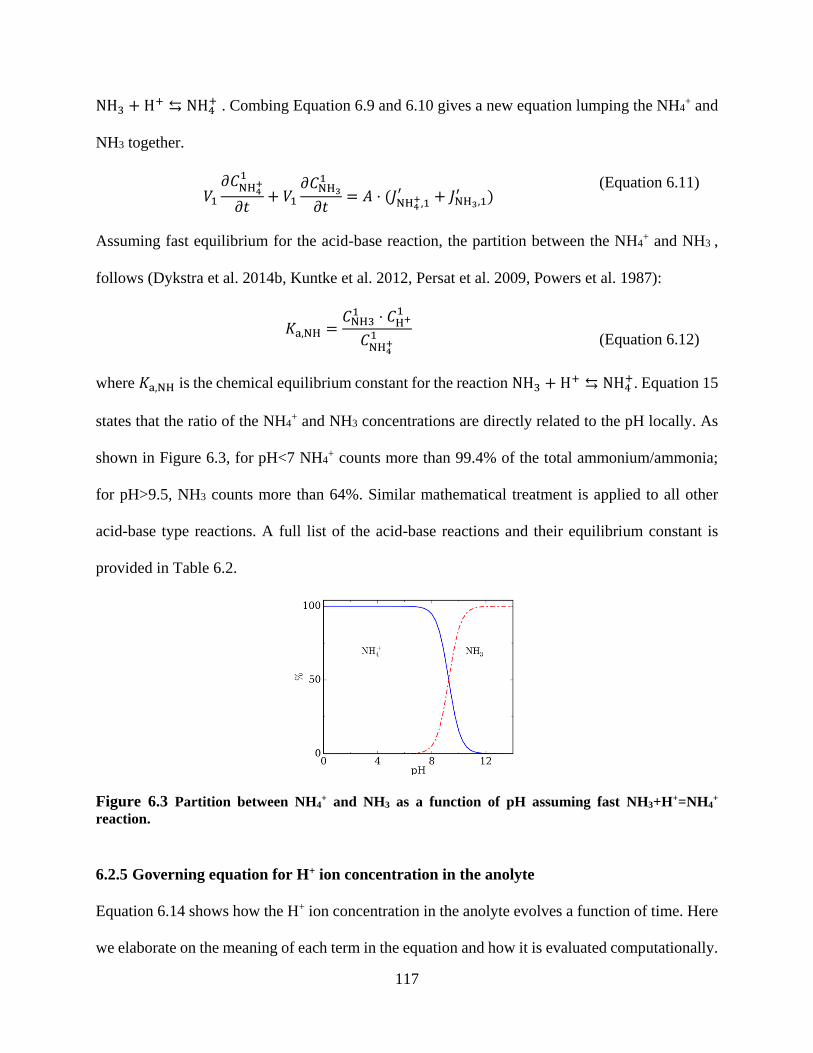
117
NH3 + H+ NH4+ . Combing Equation 6.9 and 6.10 gives a new equation lumping the NH4
+ and
NH3 together.
𝑉1
𝜕𝐶NH4+
1
𝜕𝑡+ 𝑉1
𝜕𝐶NH3
1
𝜕𝑡= 𝐴 ⋅ (𝐽NH4
+,1′ + 𝐽NH3,1
′ ) (Equation 6.11)
Assuming fast equilibrium for the acid-base reaction, the partition between the NH4+ and NH3 ,
follows (Dykstra et al. 2014b, Kuntke et al. 2012, Persat et al. 2009, Powers et al. 1987):
𝐾a,NH =𝐶NH3
1 ⋅ 𝐶H+1
𝐶NH4
+1
(Equation 6.12)
where 𝐾a,NH is the chemical equilibrium constant for the reaction NH3 + H+ NH4+. Equation 15
states that the ratio of the NH4+ and NH3 concentrations are directly related to the pH locally. As
shown in Figure 6.3, for pH<7 NH4+ counts more than 99.4% of the total ammonium/ammonia;
for pH>9.5, NH3 counts more than 64%. Similar mathematical treatment is applied to all other
acid-base type reactions. A full list of the acid-base reactions and their equilibrium constant is
provided in Table 6.2.
Figure 6.3 Partition between NH4+ and NH3 as a function of pH assuming fast NH3+H+=NH4
+
reaction.
6.2.5 Governing equation for H+ ion concentration in the anolyte
Equation 6.14 shows how the H+ ion concentration in the anolyte evolves a function of time. Here
we elaborate on the meaning of each term in the equation and how it is evaluated computationally.

118
We note that there are several possible ways to change the H+ ion concentration in anolyte: the
flux of proton into/out of the anode chamber, the Faradaic reaction due to the bacteria oxidation,
and the consumption/production due to reaction with other species, which include all the acid-base
reactions shown in Table 6.1. Using conservation law, Equation 6.14 is obtained as (reproduced
here for convenience)
𝑉1
𝜕𝐶H+1
𝜕𝑡= 𝐴 ⋅ 𝐽𝐻+,1
′ +9
8
𝐼𝐴
𝐹− 𝑉1NH3→NH4
+−𝑉1Ac−→HA𝑐 − 𝑉1OH−→H2O − 𝑉1HCO3−→H2CO3
+ 𝑉1HCO3−→CO3
2−
(Equation 6.13)
As explained in Equs. S3 and S4, 𝑉1NH3→NH4+ stands for the conversion of NH3 to NH4
+ by the
reaction NH3 + H+ → NH4+ , which equals to the consumption of proton. This term can be
calculated by manipulating Equation 6.10, giving 𝑉1NH3→NH4+ = −(𝑉1
𝜕𝐶NH31
𝜕𝑡− 𝐴 ⋅ 𝐽NH3,1
′ ); Using
the 𝐽NH3,1′ calculated in simulations, 𝑉1NH3→NH4
+ can be evaluated. Similar process could be
applied to all other source/sink terms in Equation 6.13 in the main text and the results are as
follows: 𝑉1Ac−→HAc = 𝑉1𝜕𝐶HAc
1
𝜕𝑡− 𝐴 ⋅ 𝐽HAc,1
′, 𝑉1HCO3
−→H2CO3= 𝑉1
𝜕𝐶H2CO31
𝜕𝑡− 𝐴 ⋅ 𝐽H2CO3,1
′,
𝑉1HCO3
−→CO32− = 𝑉1
𝜕𝐶CO3
2−1
𝜕𝑡− 𝐴 ⋅ 𝐽
CO32−,1
′, 𝑉1OH−→H2O = −(𝑉
1
𝜕𝐶OH−1
𝜕𝑡− 𝐴 ⋅ 𝐽OH−,1
′ ). All variables are
named under the same convention as in the main text, i.e., 𝐶𝑖1 stands for the concentration of
species i in the anolyte and 𝐽𝑖,𝑗′ is the flux of species i into chamber j (j=1: anode chamber; j=2
cathode chamber).
6.3 Results
A bench-scale cubic shape MEC was used for experimental data collection (see Figure 6.1). The
wastewater fed into the anode was synthetic digestion effluent of livestock waste while deionized
water was used as catholyte. The anolyte was partially replaced (150 mL) every 48 h while the

119
catholyte was unchanged during 3 batch cycles. The variation of organic matters, NH4+/NH3
concentration, pH and inert ions in both chambers were recorded for analysis and model validation.
To simulate the batch-mode operation of MECs for ammonia recovery, we extend the steady-state
models developed earlier (Dykstra et al. 2014c). The models consider the mass conservation for
all species (without loss of generality, the following species are included: Na+, Cl-, HAc, Ac-,
NH4+, NH3, H2CO3, HCO3
-, CO32-, H+ and OH-), the transport of each species (diffusion and
migration) across the membrane, the chemical reactions among different species, and gas-solution
equilibrium. For chemical reactions, we consider mostly acid-base reactions essential for ammonia
recovery (e.g., NH3 + H+ NH4+ , H2CO3H++HCO3
-, … and a full list of these reactions is
provided in the Supplementary Information). Using the operation parameters (e.g., the
anolyte/catholyte volume V1/V2, the membrane surface area A, etc.) and the measured current
density as input, the model can predict the time evolution of the concentration of each species in
the system (hereafter, the concentration of species i in anolyte/catholyte chamber is denoted as 𝑐𝑖𝑗,
with j=1 and 2 for anode and cathode chamber, respectively) and the recovery of ammonia by
aeration. Below we first validate the mathematical model, then investigate the above issues and
how they impact the ammonia recovery in the MEC.
6.3.1 Model validation
We first validate the mathematical model for ammonia recovery using MEC by comparing its
predictions against experimental data obtained under the same operation conditions. Ammonium
recovery was firstly studied experimentally. During one batch cycle, the COD concentration
decreased from 1089 ± 169 to 262 ± 83 mg L-1, resulting in a Coulombic efficiency (CE) of 34.7

120
± 5.9 %. The maximum current density was 1.89 A m-2 (Figure 6.2a). In the anolyte, the pH
decreased from 7.98 ± 0.08 to 4.52 ± 0.63; in the catholyte, the pH increased dramatically initially
and then stabilized at ~9.7 (Figure 6.2b). The acetate concentration in the anolyte decreased from
15.6 ± 2.4 to 5.4 ± 0.9 mM, and that in the catholyte was always below the detection limit of our
equipment (Figure 6.2c). The latter is consistent with the fact that the diffusion loss of acetate
through CMI-7000 is small (Kim et al. 2007b). Experimentally, the total input nitrogen as
ammonium in each batch cycle was 9.3 ± 0.4 mmol, among which 35.7 ± 7.4 % stayed in the anolyte,
0.9 ± 0.3 % remained in the catholyte and 66.2 ± 2.7 % was stripped out as ammonia and absorbed by
the sulfuric acid. In each batch cycle (2 days), 6.1 ± 0.1 mmol of NH3 gas was collected through
aeration, resulting in a recovery rate of 10.2 ± 0.1 gN m-2 d-1 (vs. membrane surface area) (Cord-
Ruwisch et al. 2011). Ammonia oxidation in the anode chamber might not occur because of we did
not detect any nitrite or nitrate in the anolyte. Numerically, the simulation predicted the total
ammonia concentration in anolyte and catholyte to be 5% and 18.4% within the corresponding
maximum measured values, respectively. Some Na+ and Cl- ions crossed into the catholyte through
the CEM in each cycle. To assess their role in the net charge transport through the CEM, we
computed the cumulative transport number 𝑡+ = 𝑉1𝑧𝑖𝐹(𝑐𝑖
1(0) − 𝑐𝑖1(𝑡))/ ∫ 𝐼𝐴𝑑𝑡
𝑡
0 for these ions
during each cycle. At the end of each cycle, 𝑡Na++ = 0.124 ± 0.044 and 𝑡Cl−
+ = −0.021 ± 0.004
(Figure 6.2f), indicating that overall the transport of these ions contributes to ~10% of the total
current. Since the transport of all other ions except NH4+ ions through the CEM is very small, we
thus conclude that the transport of NH4+ ions through the CEM accounts for ~90% of the total
current in our system, which is consistent with some earlier studies (Cord-Ruwisch et al. 2011).

121
The above ammonia recovery operation was also simulated using the mathematical model
developed. As shown in Figure 6.2b to Figure 6.2f, the model predictions agree quite well with the
experimental data. In particular, the model captures the evolution of pH, acetate concentration, and
total nitrogen content in the anolyte/catholyte. The recovery of NH3 gas was also accurately
captured. The model underestimates the transport of Na+ ions across the CEM (Figure 6.2f).
However, given that the transport of Na+ ions accounts for only a small fraction of the total current
through the CEM and these ions do not interact with other species in the system, these small
deviations are deemed acceptable.
Using the validated model, we next examine the mechanisms of MEC-based ammonia recovery
using simulations and address three issues outlined earlier, i.e., the pH regulation, NH4+ transport
and ion competition in MECs. The initial conditions in the anolyte are the same as those in the
above experiment. The catholyte initially features 10mM of Na+ ions and accompanying carbonate
group ions, which together produces a pH of ~6.8, as commonly found in experiments. Without a
loss of generality, the system operates at a fixed current density of I =1A m-2 for 48 hours.
6.3.2 pH regulation
To understand how the pH is regulated, we note that, by considering the mass conservation of
proton, its concentration evolution in the anolyte follows:
𝑉1
𝜕𝐶H+1
𝜕𝑡= 𝐴 ⋅ 𝐽𝐻+,1
′ +9
8
𝐼𝐴
𝐹− 𝑉1NH3→NH4
+−𝑉1Ac−→HA𝑐 − 𝑉1OH−→H2O − 𝑉1HCO3−→H2CO3
+ 𝑉1HCO3−→CO3
2−
(Equation 6.14)
This equation shows that the proton concentration in the anolyte is affected by several factors: the
transport of proton into or out of the anolyte through the CEM (the first term on the right side), the
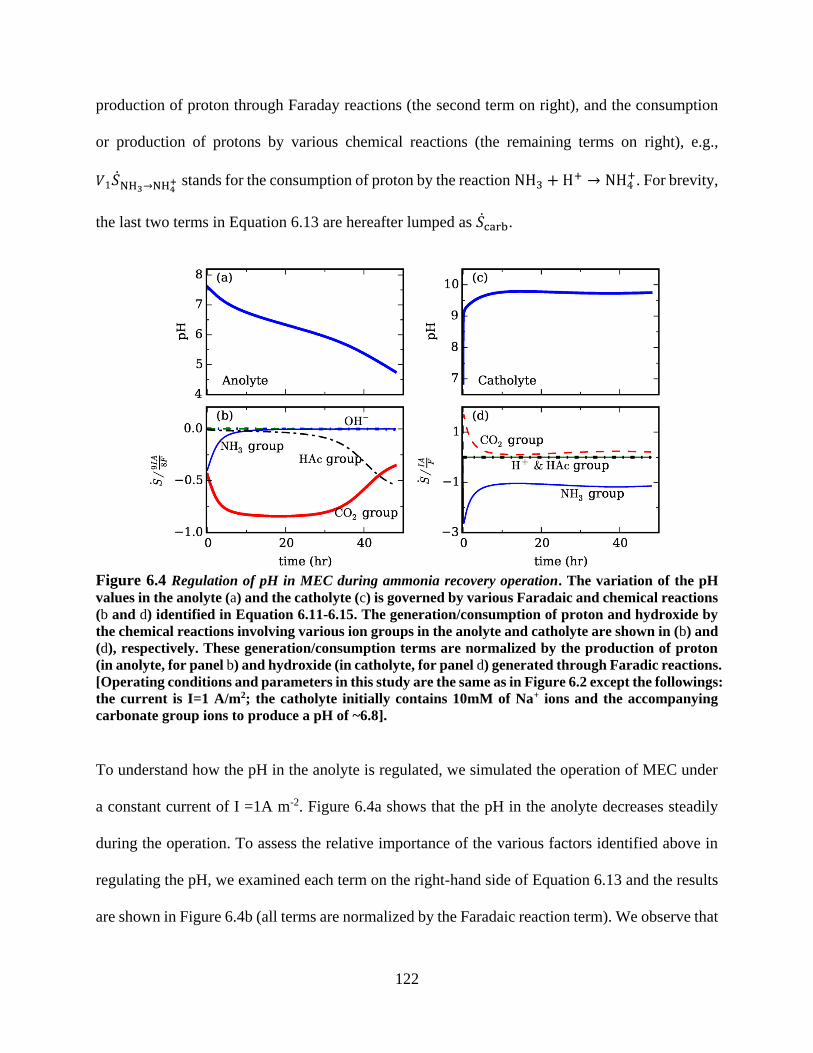
122
production of proton through Faraday reactions (the second term on right), and the consumption
or production of protons by various chemical reactions (the remaining terms on right), e.g.,
𝑉1NH3→NH4+ stands for the consumption of proton by the reaction NH3 + H+ → NH4
+. For brevity,
the last two terms in Equation 6.13 are hereafter lumped as carb.
Figure 6.4 Regulation of pH in MEC during ammonia recovery operation. The variation of the pH
values in the anolyte (a) and the catholyte (c) is governed by various Faradaic and chemical reactions
(b and d) identified in Equation 6.11-6.15. The generation/consumption of proton and hydroxide by
the chemical reactions involving various ion groups in the anolyte and catholyte are shown in (b) and
(d), respectively. These generation/consumption terms are normalized by the production of proton
(in anolyte, for panel b) and hydroxide (in catholyte, for panel d) generated through Faradic reactions.
[Operating conditions and parameters in this study are the same as in Figure 6.2 except the followings:
the current is I=1 A/m2; the catholyte initially contains 10mM of Na+ ions and the accompanying
carbonate group ions to produce a pH of ~6.8].
To understand how the pH in the anolyte is regulated, we simulated the operation of MEC under
a constant current of I =1A m-2. Figure 6.4a shows that the pH in the anolyte decreases steadily
during the operation. To assess the relative importance of the various factors identified above in
regulating the pH, we examined each term on the right-hand side of Equation 6.13 and the results
are shown in Figure 6.4b (all terms are normalized by the Faradaic reaction term). We observe that

123
most of the protons generated by the Faradaic reaction were neutralized by their reactions with
NH3, the Ac− ions, and the carbonate ions. Hence, these chemical groups essentially serve as the
“buffer” to keep the pH from changing dramatically. The relative contribution of these chemical
groups in regulating the pH evolves during the operation of MEC: NH3 lost its buffer capability
soon after the pH is below 7, while the carbonate ions remain effective in buffering the anolyte till
~40 hrs.
A similar equation for the evolution of the hydroxide concentration in the catholyte was derived
to understand the regulation of pH therein:
𝑉2
𝜕𝐶OH−2
𝜕𝑡= 𝐴𝐽OH−,2
′ +𝐼𝐴
𝐹− 𝑉1HAc→Ac− − 𝑉1NH4
+→NH3− 𝑉1H+→H2O − 𝑉1H2CO3→HCO3
− − 𝑉1HCO3−→CO3
2−
(Equation 6.15)
This equation shows that the hydroxide concentration in the catholyte is affected by the transport
of hydroxide into/out of the catholyte (the first term on the right side), the production of hydroxide
by Faradaic reactions (the second term on right), and various chemical reactions consuming or
producing hydroxide (the remaining terms on right). The last two terms are hereafter lumped as
carb. Figure 6.4c-d show the pH variation and the relative magnitude of each reaction term on the
right-hand side of Equation 6.15. We observe that, in the catholyte, the pH was predominately
controlled by the Faradaic production of hydroxide and the consumption of hydroxide by their
reaction with the NH4+
ions. Since there are few NH4+
ions inside the catholyte at the very
beginning, the pH value rises rapidly during the earliest stage of operation. Unlike the NH4+
ions,
the carbonate ions tend to increase the pH value because their chemical reactions inside the
catholyte consume proton. Overall, the effect of carbonate ions on the pH in catholyte is limited,
and this is related to their low concentration inside the catholyte. The latter is due to the limited

124
carbonate ions inside the anolyte and their slow diffusion through the CEM. Since the pH
regulation inside the catholyte depends strongly on the availability of NH4+
ions, and the latter in
turn depends on the transport of NH4+
ions and NH3 across the CEM, it is clear that the pH
regulation is intimately coupled with the transport of these species.
6.3.3 Ammonium and ammonia transport
Such transport is analyzed from the perspective of how these species are removed from the anolyte.
There are three ways to remove NH3/NH4+ ion from the anolyte: diffusion and migration of NH4
+
ion through the CEM and the diffusion of NH3 through CEM. Figure 6.5a shows that, under the
moderate electrical current considered here (I =1A m-2), the diffusion of NH4+ is actually stronger
than its electrical migration. This somewhat surprising result is caused largely by the different pH
value inside the anolyte and catholyte. As shown in Figure 6.2, the anolyte (catholyte) is strongly
acidic (basic) during operation. Hence, nitrogen element exists mostly as NH4+ in the anolyte and
as NH3 in the catholyte (Figure 6.3). Consequently, the NH4+ concentration in the anolyte is always
much higher than that in the catholyte (Figure 6.5b), which leads to a strong diffusion flux of the
NH4+ ions. Since the acidic (basic) pH in the anolyte (catholyte) is ultimately induced by the
electrical current through the system, we see that the imposed current serves two roles: it helps
drive the migration of NH4+
ions from the anolyte toward catholyte, and it helps set up the pH
environment that favors the diffusion of NH4+ ion from anolyte chamber toward the catholyte
chamber. The second role has not been widely recognized. However, the fact that the diffusion of
NH4+
ions dominates over their migration suggests that this second role is at least as important as
the first role. We note that, while diffusion dominates the transport of NH4+ under low/moderate
current densities (e.g., the I = 1 A m-2 considered here), electrical migration can become the
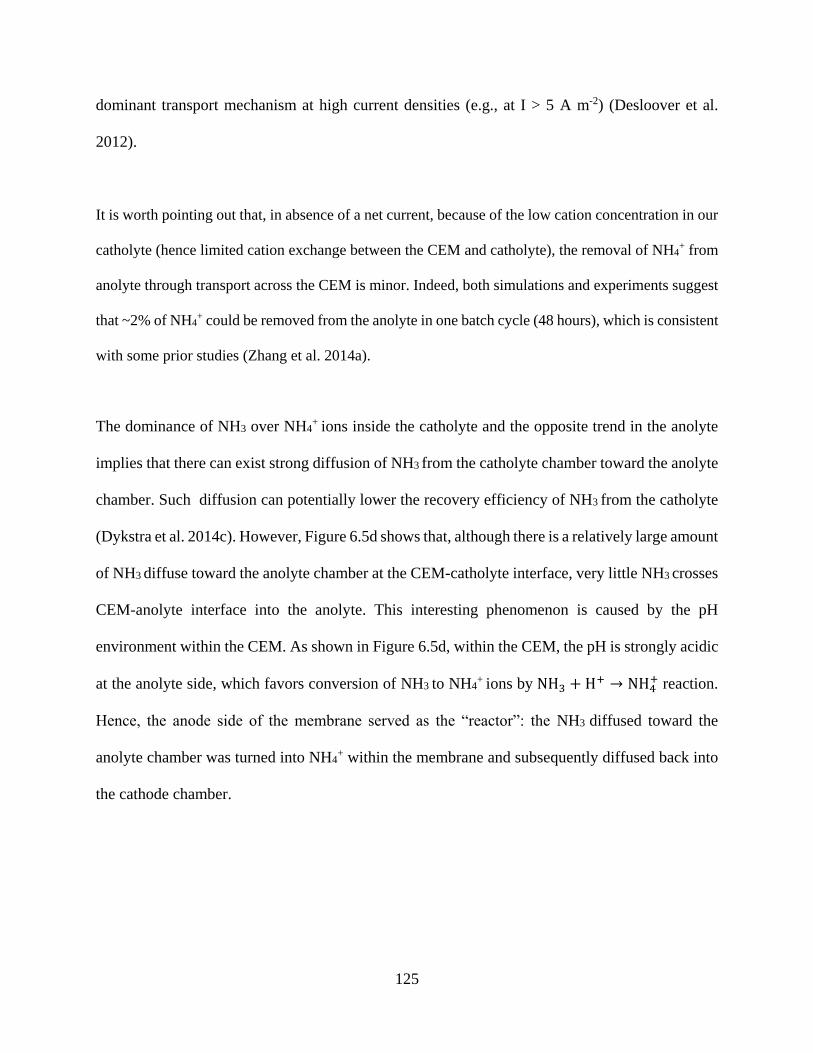
125
dominant transport mechanism at high current densities (e.g., at I > 5 A m-2) (Desloover et al.
2012).
It is worth pointing out that, in absence of a net current, because of the low cation concentration in our
catholyte (hence limited cation exchange between the CEM and catholyte), the removal of NH4+ from
anolyte through transport across the CEM is minor. Indeed, both simulations and experiments suggest
that ~2% of NH4+ could be removed from the anolyte in one batch cycle (48 hours), which is consistent
with some prior studies (Zhang et al. 2014a).
The dominance of NH3 over NH4+
ions inside the catholyte and the opposite trend in the anolyte
implies that there can exist strong diffusion of NH3 from the catholyte chamber toward the anolyte
chamber. Such diffusion can potentially lower the recovery efficiency of NH3 from the catholyte
(Dykstra et al. 2014c). However, Figure 6.5d shows that, although there is a relatively large amount
of NH3 diffuse toward the anolyte chamber at the CEM-catholyte interface, very little NH3 crosses
CEM-anolyte interface into the anolyte. This interesting phenomenon is caused by the pH
environment within the CEM. As shown in Figure 6.5d, within the CEM, the pH is strongly acidic
at the anolyte side, which favors conversion of NH3 to NH4+
ions by NH3 + H+ → NH4+ reaction.
Hence, the anode side of the membrane served as the “reactor”: the NH3 diffused toward the
anolyte chamber was turned into NH4+ within the membrane and subsequently diffused back into
the cathode chamber.

126
Figure 6.5 Mechanisms of NH4+/NH3 transport in MECs. (a) Relative strength of NH4
+ ion transport
due to diffusion and migration. (b) Evolution of the NH4+ ion concentration in the anolyte and
catholyte. (c) Distribution of pH across the CEM and at the CEM-anolyte/catholyte interfaces. (d)
The diffusion flux of NH3 toward the anolyte at the CEM-catholyte/anolyte interfaces. These diffusion
fluxes are normalized by the total NH4+ ion flux to highlight their impact on the ammonia recovery
in the catholyte. [ALL parameters in this study are the same as in Fig. 3.]
More generally, the relevance of NH3 diffusion from catholyte to anolyte to its recovery can be
estimated. The diffusion of NH3 is 𝐽NH3~𝐷NH3
𝑚 𝐶NH3
2 /𝐿 (𝐷NH3
𝑚 : diffusion coefficient of NH3 in the
membrane; 𝐶NH3
2 : NH3 concentration in the catholyte; 𝐿: membrane thickness). The evaporating
flux of NH3 in the catholyte is 𝐽NH3
evap= 𝐶NH3
2 𝑄inert/𝐴𝑝𝑡𝑜𝑡𝐾H,NH (Dykstra et al. 2014c, Powers et
al. 1987). Hence, we define a dimensionless number
𝜫 =𝑫𝑵𝑯𝟑
𝒎 𝒑𝒕𝒐𝒕𝑲𝑯,𝑵𝑯𝑨
𝑳 𝑸𝒊𝒏𝒆𝒓𝒕
(Equation 6.16)
When Π ≪ 1, the effect of diffusion on ammonia recovery is negligible. For the system studied
here, we have 𝐷NH3
m = 2.1 × 10⁻¹¹ m2/s, 𝑝tot = 1bar, 𝐾H,NH = 56250 mM/bar, L= 475μm (Aeshala
et al. 2013), and aeration rate 𝑄inert/𝐴 = 0.066mol/(m2s). Hence, Π =0.0376, i.e., the diffusion is
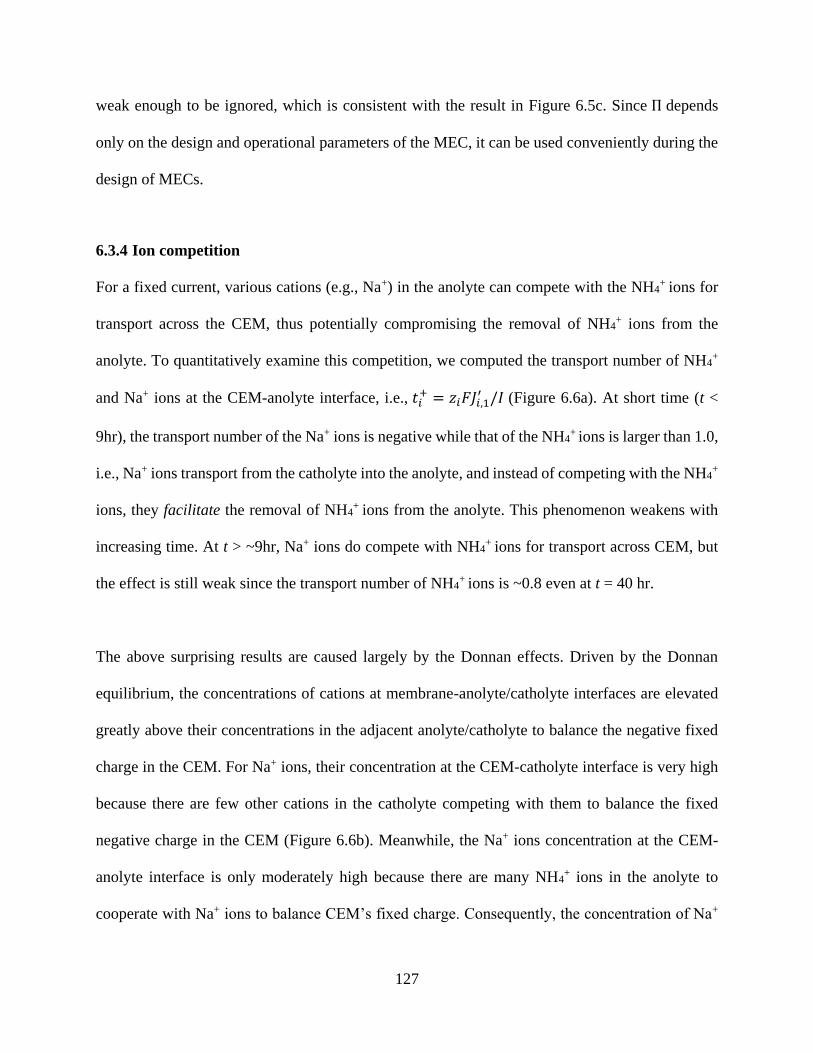
127
weak enough to be ignored, which is consistent with the result in Figure 6.5c. Since Π depends
only on the design and operational parameters of the MEC, it can be used conveniently during the
design of MECs.
6.3.4 Ion competition
For a fixed current, various cations (e.g., Na+) in the anolyte can compete with the NH4+ ions for
transport across the CEM, thus potentially compromising the removal of NH4+ ions from the
anolyte. To quantitatively examine this competition, we computed the transport number of NH4+
and Na+ ions at the CEM-anolyte interface, i.e., 𝑡𝑖+ = 𝑧𝑖𝐹𝐽𝑖,1
′ /𝐼 (Figure 6.6a). At short time (t <
9hr), the transport number of the Na+ ions is negative while that of the NH4+ ions is larger than 1.0,
i.e., Na+ ions transport from the catholyte into the anolyte, and instead of competing with the NH4+
ions, they facilitate the removal of NH4+ ions from the anolyte. This phenomenon weakens with
increasing time. At t > ~9hr, Na+ ions do compete with NH4+ ions for transport across CEM, but
the effect is still weak since the transport number of NH4+ ions is ~0.8 even at t = 40 hr.
The above surprising results are caused largely by the Donnan effects. Driven by the Donnan
equilibrium, the concentrations of cations at membrane-anolyte/catholyte interfaces are elevated
greatly above their concentrations in the adjacent anolyte/catholyte to balance the negative fixed
charge in the CEM. For Na+ ions, their concentration at the CEM-catholyte interface is very high
because there are few other cations in the catholyte competing with them to balance the fixed
negative charge in the CEM (Figure 6.6b). Meanwhile, the Na+ ions concentration at the CEM-
anolyte interface is only moderately high because there are many NH4+ ions in the anolyte to
cooperate with Na+ ions to balance CEM’s fixed charge. Consequently, the concentration of Na+
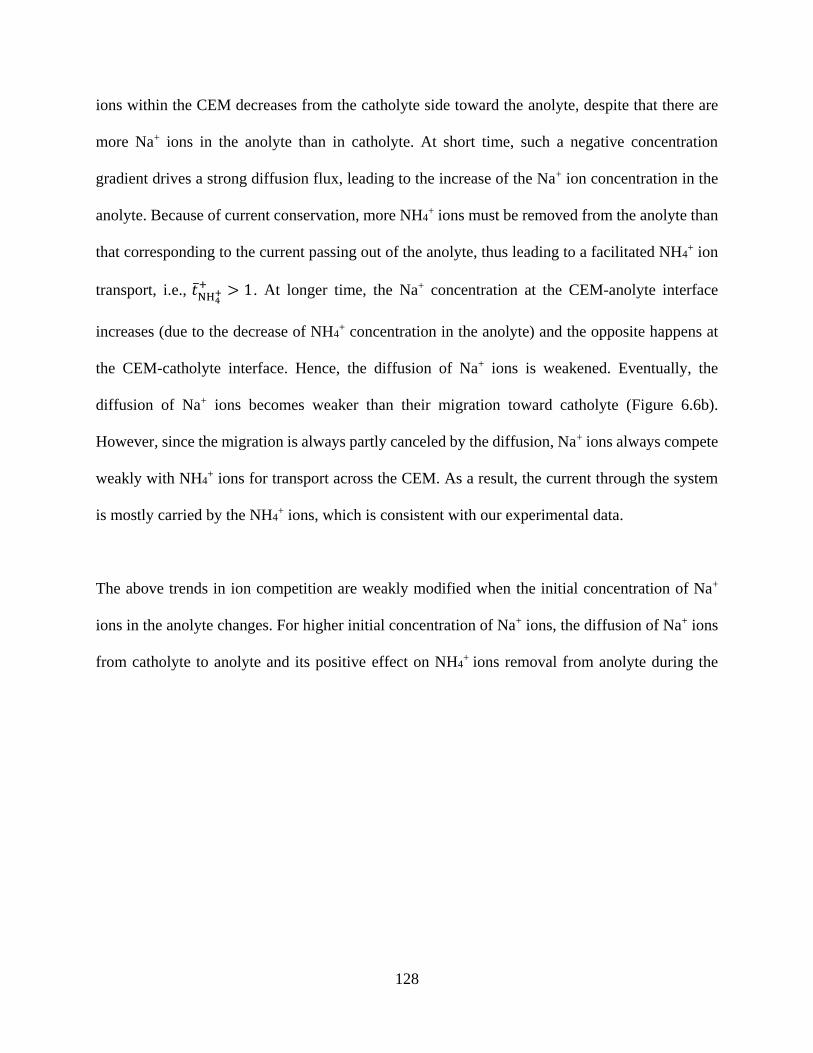
128
ions within the CEM decreases from the catholyte side toward the anolyte, despite that there are
more Na+ ions in the anolyte than in catholyte. At short time, such a negative concentration
gradient drives a strong diffusion flux, leading to the increase of the Na+ ion concentration in the
anolyte. Because of current conservation, more NH4+ ions must be removed from the anolyte than
that corresponding to the current passing out of the anolyte, thus leading to a facilitated NH4+ ion
transport, i.e., 𝑡NH4+
+ > 1. At longer time, the Na+ concentration at the CEM-anolyte interface
increases (due to the decrease of NH4+ concentration in the anolyte) and the opposite happens at
the CEM-catholyte interface. Hence, the diffusion of Na+ ions is weakened. Eventually, the
diffusion of Na+ ions becomes weaker than their migration toward catholyte (Figure 6.6b).
However, since the migration is always partly canceled by the diffusion, Na+ ions always compete
weakly with NH4+ ions for transport across the CEM. As a result, the current through the system
is mostly carried by the NH4+ ions, which is consistent with our experimental data.
The above trends in ion competition are weakly modified when the initial concentration of Na+
ions in the anolyte changes. For higher initial concentration of Na+ ions, the diffusion of Na+ ions
from catholyte to anolyte and its positive effect on NH4+ ions removal from anolyte during the
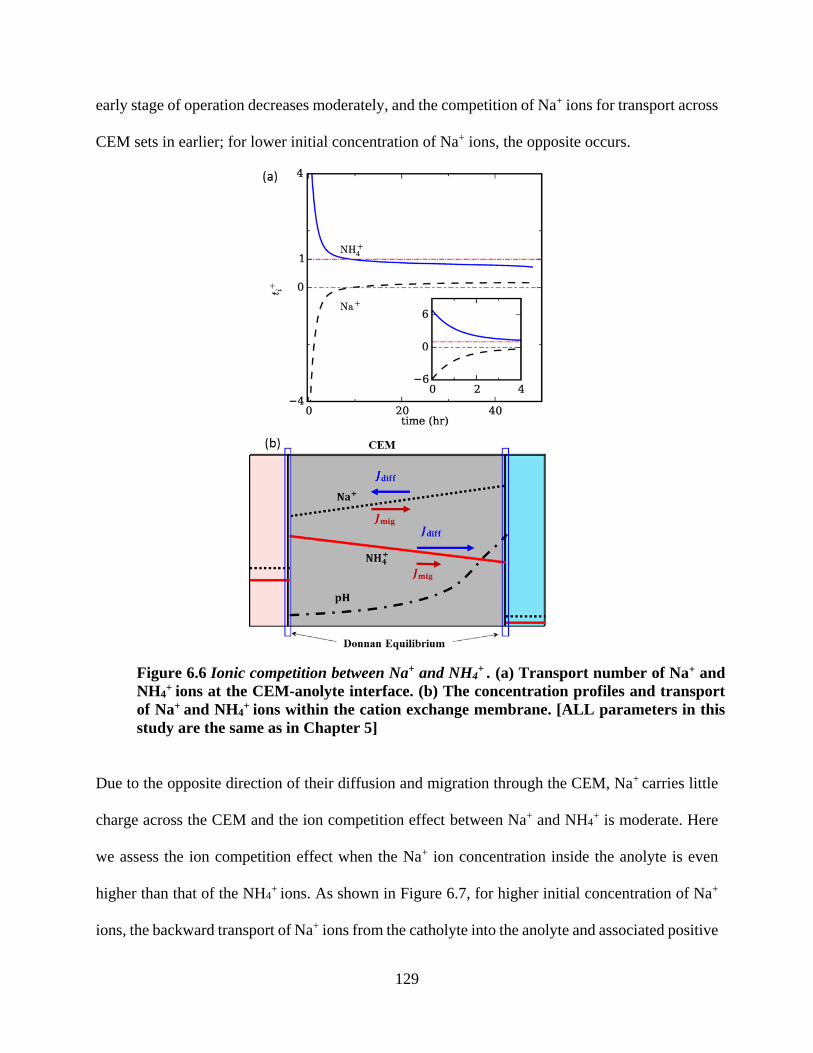
129
early stage of operation decreases moderately, and the competition of Na+ ions for transport across
CEM sets in earlier; for lower initial concentration of Na+ ions, the opposite occurs.
Due to the opposite direction of their diffusion and migration through the CEM, Na+ carries little
charge across the CEM and the ion competition effect between Na+ and NH4+ is moderate. Here
we assess the ion competition effect when the Na+ ion concentration inside the anolyte is even
higher than that of the NH4+ ions. As shown in Figure 6.7, for higher initial concentration of Na+
ions, the backward transport of Na+ ions from the catholyte into the anolyte and associated positive
Figure 6.6 Ionic competition between Na+ and NH4+ . (a) Transport number of Na+ and
NH4+ ions at the CEM-anolyte interface. (b) The concentration profiles and transport
of Na+ and NH4+ ions within the cation exchange membrane. [ALL parameters in this
study are the same as in Chapter 5]

130
effect on NH4+ ions removal from the anolyte during the early stage of operation decreases
moderately. The competition of Na+ ions for transport across CEM sets in earlier than that under
lower Na+ ion concentration in the anolyte. For lower initial concentration of Na+ ions, the opposite
occurs.
Figure 6.7 Transport number of Na+ and NH4+ ions at the CEM-anolyte interface under
different initial Na+ ion concentration in the anolyte. The solid (dashed) lines are for case in
which the initial concentration of Na+ ions in the anolyte is equal to (three times of) that of
the NH4+ ions.
To further assess the ion competition effect, we examined the NH4+ concentration in anolyte during
MEC operation with different initial Na+ concentration in the anolyte while keeping all other
operating conditions the same. Figure 6.8 shows that, as the initial Na+ concentration in the anolyte
increases (decreases), less (more) NH4+ ions are transported out of the anolyte due to stronger ion
competition. Most of difference occurs during the early stage of operation, and the difference in
the later stage is small. Overall, the transport of NH4+ ions out of the anolyte is affected only

131
moderately by the initial Na+ ion concentration in the anolyte, suggesting that the ion competition
effect is moderate in the system studied here.
Figure 6.8 Evolution of the NH4+ ion concentration in anolyte during operations with different initial
Na+ ion concentrations in the anolyte. S0.2, S1, and S3 corresponds to the case in which the initial
Na+ ion concentration in the anolyte is 0.2, 1.0 and 3.0 (for demonstration purpose) times of the initial
NH4+ ion concentration, respectively. The operating parameters (e.g., current density and aeration
rate) are otherwise identical in all cases.
6.4 Discussion
Using integrated experimental and simulation studies, we examined the NH4+/NH3 transport in
MECs and their coupling with the current generation, the acid-base reactions, and the transport of
inert cations in the system. During MEC operation, a cascade of chemical groups regulates the pH
in system to lead to an acidic (basic) environment in the anolyte (catholyte). The NH4+/NH3 couple
is found to play a dual role in the operation: it serves as an effective proton shuttle for the charge
transport across the CEM and also as buffer agent in the anolyte and catholyte. Inert cations, even
in abundance, compete rather moderately with NH4+ ion for transport across the CEM. The strength

132
of the diffusion of NH3 from catholyte to anolyte is governed by the MEC’s operating conditions
and can be estimated using a dimensionless number.
The findings of this study will potentially impact the ammonia recovery using BES in several
aspects. First, a clear understanding of ion transport and interaction will help interpret NH4+ ion
recovery efficiency that may be affected by the composition of wastewater. Second, delineating
the role of different chemical groups in pH regulation will help guide the BES operation for optimal
pH. Third, the dimensionless number of diffusion of NH3 will help select suitable membranes. In
this work, ammonium removal and recovery was examined under a high-current condition, because
high current generation was expected to benefit the transport of ammonium ions. Reducing current
generation via lowering applied voltage and/or increasing external resistance would decrease
ammonium removal/recovery.
There are still challenges to address in the future to improve the agreement between the model and
the experiment data. For example, there is a slight volume loss of the catholyte due to the aeration,
and this effect was not considered in our model but it is likely to affect the concentration prediction
in the catholyte to some extent. The bacteria activity will need to be considered in the future work.
The bacteria activity in the anode could affect the balance of most of the species within the system,
especially NH4+ and Na+, both of which are important to ion competition.
Future studies will focus on systematic investigation of the role of current in ion transport and
ammonia recovery, the interaction between electric potential and ammonium recovery, improving
the numerical model by integrating current generation models into the existing model, and
extension of the unsteady model to other BES systems.

133
Chapter 7 Integrated Experimental and Modeling Evaluation of Energy
Consumption for Ammonia Recovery in Bioelectrochemical Systems
(This section has been published as Qin, M., Liu, Y. (Co-first author), Luo, S., Qiao, R.,* &
He, Z.* (2017). Integrated Experimental and Modeling Evaluation of Energy Consumption for
Ammonia Recovery in Bioelectrochemical Systems. Chemical Engineering Journal, 327,
924-931.)
Abstract
Bioelectrochemical systems (BES) can recover ammonia from wastewater driven by electricity
generation. However, energy consumption of such an approach has not been well evaluated. In
this study, the effects of several key operating factors including catholyte aeration rate, external
voltage, and external resistance on both ammonia recovery and energy consumption were
systematically investigated. A mathematical model developed for ammonia removal/recovery in
BES was applied to help interpret the experimental results. It was found that a high aeration rate
in the catholyte could facilitate ammonia recovery. An aeration rate of 100 mL min-1 resulted in
the lowest energy consumption of 4.9 kWh kg-1 N recovery among the tested aeration rates. A low
external resistance facilitated the ammonia recovery via higher current generation, while a
moderate external voltage (e.g., 0.5 V) helped to achieve low energy consumption. The highest
ammonia recovery rate of 7.1 g N m-2 d-1 was obtained with energy consumption of 5.7 kWh kg-1
N recovery. Therefore, there is a trade-off between energy consumption and ammonia recovery.
134
7.1 Introduction
Nitrogen is a key inorganic contaminant, and excessive discharge of nitrogen, for example via
incomplete wastewater treatment, can amplify the nitrogen transfer to aquatic ecosystems and
result in eutrophication that deteriorates ecosystem and decreases the supply of drinking water
source (Howarth et al. 1996). The annual cost due to eutrophication in the United States is about
$2200 million (Dodds et al. 2008). Thus, removal of nitrogen from wastewater is necessary to limit
nitrogen discharge. In wastewater, the primary form of nitrogen is ammonium (Matassa et al.
2015b), which can be removed by either biological or physicochemical methods (Ahn 2006b,
Sprynskyy et al. 2005). In biological ammonium removal processes such as nitrification,
denitrification and anaerobic ammonium oxidation (anammox), ammonium is converted to
nitrogen gas microbiologically. The physicochemical ammonium removal processes like ion
exchange, air stripping and high gravity separate ammonia from liquid at the expense of chemical
or energy consumption (Gupta et al. 2015, Jiao et al. 2016, Wang et al. 2017).
Sustainable wastewater management aims to recover valuable resources from wastewater, such as
energy, nutrients and water. The concentration of ammonium in some wastewaters such as digester
centrate and landfill leachate can be over 500 mg L-1 (Renou et al. 2008). Thus, ammonia recovery,
instead of removal, will be of strong interest. Ammonia nitrogen is a key fertilizer component for
agricultural applications, and more than 90% of the world ammonia production is currently based
on the Haber-Bosch synthesis process, which consumes 1-2% of world energy (Capodaglio et al.
2015). The demand for fertilizer is increasing at 3-4% per year along with the steadily growing
global demand for food to feed additional 2.3 billion people by 2050 (Bicer et al. 2016, Cordell et
al. 2009). About 30% of ammonia in fertilizers ends up in wastewater as ammonium ions

135
(Ledezma et al. 2015). Therefore, recovering ammonia from wastewater may provide a promising
approach for supplying ammonia to sustain fertilizer and food production, and avoid energy-
intensive synthesizing processes (Verstraete et al. 2009).
An emerging technology for ammonia recovery from wastewater is bioelectrochemical system
(BES) (Arredondo et al. 2015, Grant et al. 2012). In a BES, organic compounds in wastewater are
oxidized by the exoelectrogens growing on an anode electrode and the generated electrons
spontaneously flow from the anode electrode to a cathode electrode (Kelly and He 2014). During
electricity generation, ammonium ions are driven to transport from the anode to the cathode to
maintain charge neutrality (Wang and Ren 2013). The high pH of the catholyte due to reduction
reactions converts ammonium ions to ammonia, which can be driven off the catholyte with
mechanical mixing or aeration for recovery. Various BES including microbial fuel cells (MFCs)
and microbial electrolysis cells (MECs) have been studied to achieve ammonia recovery (Cord-
Ruwisch et al. 2011, Wu et al. 2017). Because higher current generation would greatly enhance
ammonium transport towards recovery (Kelly and He 2014), MECs with external power exhibit a
better performance for ammonia recovery than MFCs (Haddadi et al. 2013). Ammonium nitrogen
has been successfully recovered as ammonia from ammonium-rich wastewater, such as synthetic
wastewater, urine, landfill leachate, and swine wastewater (Kim et al. 2008, Kuntke et al. 2011,
Kuntke et al. 2012, Qin and He 2014, Qin et al. 2016b, Zhang et al. 2014a). Mathematical models
have also been developed to improve our understanding of ion transport mechanism during
ammonia recovery and the BES operation (Dykstra et al. 2014c, Liu et al. 2016, Recio-Garrido et
al. 2016).

136
Despite the great progress in ammonia recovery by using BES, energy consumption of such a
process has not been fully investigated before. This information is critically important to evaluate
whether ammonia recovery by using BES will be energy efficient (and cost effective). An energy-
efficient treatment and recovery system will benefit our environment with contaminant removal,
reduced demand for energy (and thus lower carbon footprint), and reduced demand for raw
materials through resource recovery. The major energy consumers in a BES include power supply,
recirculation pumps, and catholyte aeration (Dong et al. 2015). Energy consumption by power
supply can be affected by both voltage and external resistance via current generation, which then
influences ammonium ion transport. Electrolyte recirculation helps with substrate distribution that
will affect current generation and electrolyte resistance. Catholyte aeration is to provide electron
acceptors for cathode reactions, and to strip ammonia off the liquid for subsequent recovery. To
improve our understanding of energy consumption of ammonia recovery by using BES, in this
study, we have systematically investigated the effects of catholyte aeration rate, external voltage,
and external resistance on both ammonia recovery and energy consumption. A mathematical
model was applied to verify and further explain the effects of the operation parameters on the BES
performance and energy consumption. The energy consumption by the BES was normalized to per
kg N removal or recovery.
7.2 Materials and Methods
7.2.1 BES setup and operation
A bench-scale cubic shape BES was used in this study. Both the anode and the cathode chambers
had the same dimension of 9 cm × 4.7 cm × 1 cm. A piece of cation exchange membrane (CEM,
CMI-7000, Membrane International Inc., Glen Rock, NJ, USA) with a sectional area of 42.3 cm2

137
was used to separate the anode and cathode chambers. The anode electrode was a carbon brush
(Gordon Brush Mfg. Co., Inc., CA, USA), which was pretreated by being soaked in pure acetone
overnight and heat-treated in a muffle furnace (Model 550 Isotemp Series, Fisher Scientific,
Pittsburgh, PA, USA) at 450 °C for 30 min. The cathode electrode was a piece of 32-cm2 carbon
cloth (Zoltek Companies, Inc., MO, USA) that was coated with 5 mg cm-2 of Pt/C (10% wt. Pt on
Carbon Vulcan, Fuel Cell Earth LLC, USA). The BES was operated at room temperature of
∼21 °C.
The anode was inoculated with the anaerobic sludge from a local wastewater treatment plant
(Peppers Ferry, Radford, VA, USA). To mimic the digestion effluent of livestock waste (Park et
al. 2010) , the anode influent solution was prepared containing (per liter of deionized water – DI
water): sodium acetate, 1.5 g; NH4Cl, 3.0 g; NaHCO3, 2.0 g; NaCl, 0.15 g; MgSO4, 0.005 g; CaCl2,
0.006 g; and trace elements solution, 1 mL (Angenent and Sung 2001). The anolyte volume was
100 mL, while the cathode chamber was initially filled with 180 mL of DI water. An external
voltage of 0.8 V was applied to the circuit by a power supply (CSI3644A, Circuit Specialists, Inc.,
Mesa, AZ, USA) according to a previous study (Angenent and Sung 2001). The BES was operated
in a batch mode at room temperature (~20 °C). When current generation dropped to lower than 0.2
A m2, one batch cycle ended and the anolyte was partially replaced (75% of the anode volume)
while the catholyte was completely replaced with 180 mL of DI water. Both the anolyte and
catholyte were recirculated at a flow rate of 20 mL min-1, respectively. Samples (1 mL) were
collected every 4 hours from both chambers for measurement. The stripped NH3 gas from the
cathode was absorbed by 1 M H2SO4. To study the effect of aeration rate, the catholyte aeration
rates were adjusted to 300, 100, 50 and 30 mL min-1 (1.7, 0.6, 0.3 and 0.2 vvm; vvm: gas volume
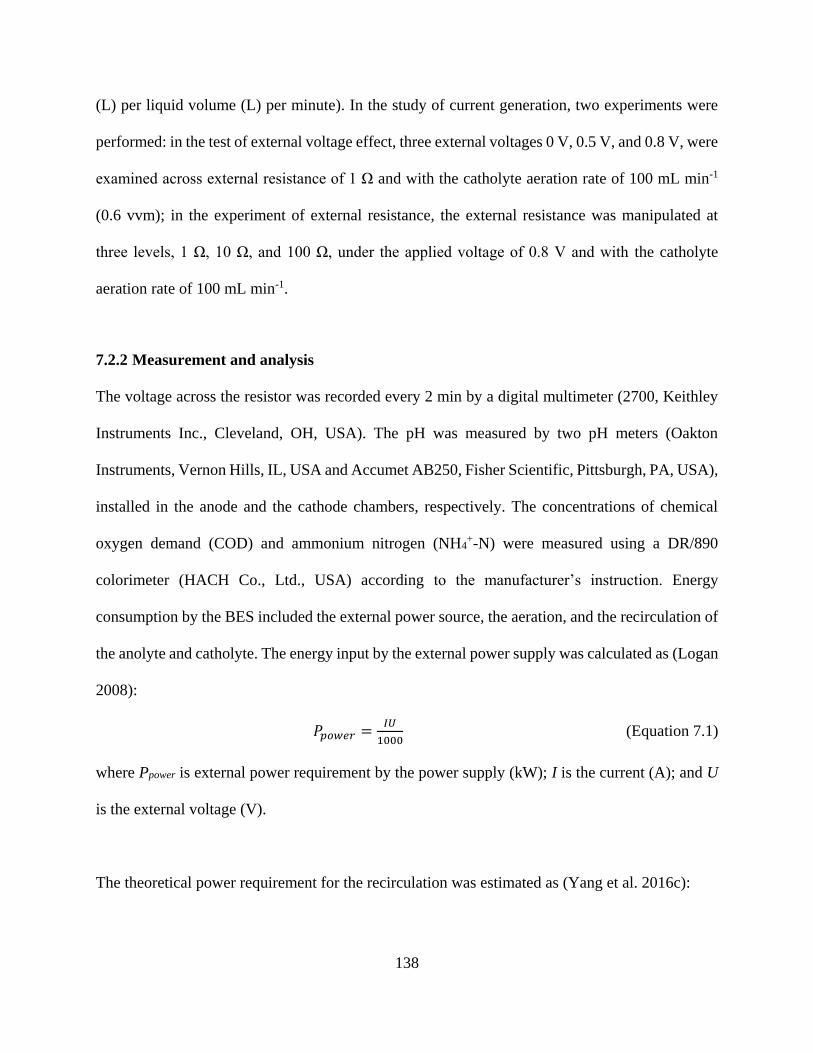
138
(L) per liquid volume (L) per minute). In the study of current generation, two experiments were
performed: in the test of external voltage effect, three external voltages 0 V, 0.5 V, and 0.8 V, were
examined across external resistance of 1 Ω and with the catholyte aeration rate of 100 mL min-1
(0.6 vvm); in the experiment of external resistance, the external resistance was manipulated at
three levels, 1 Ω, 10 Ω, and 100 Ω, under the applied voltage of 0.8 V and with the catholyte
aeration rate of 100 mL min-1.
7.2.2 Measurement and analysis
The voltage across the resistor was recorded every 2 min by a digital multimeter (2700, Keithley
Instruments Inc., Cleveland, OH, USA). The pH was measured by two pH meters (Oakton
Instruments, Vernon Hills, IL, USA and Accumet AB250, Fisher Scientific, Pittsburgh, PA, USA),
installed in the anode and the cathode chambers, respectively. The concentrations of chemical
oxygen demand (COD) and ammonium nitrogen (NH4+-N) were measured using a DR/890
colorimeter (HACH Co., Ltd., USA) according to the manufacturer’s instruction. Energy
consumption by the BES included the external power source, the aeration, and the recirculation of
the anolyte and catholyte. The energy input by the external power supply was calculated as (Logan
2008):
𝑃𝑝𝑜𝑤𝑒𝑟 =𝐼𝑈
1000 (Equation 7.1)
where Ppower is external power requirement by the power supply (kW); I is the current (A); and U
is the external voltage (V).
The theoretical power requirement for the recirculation was estimated as (Yang et al. 2016c):
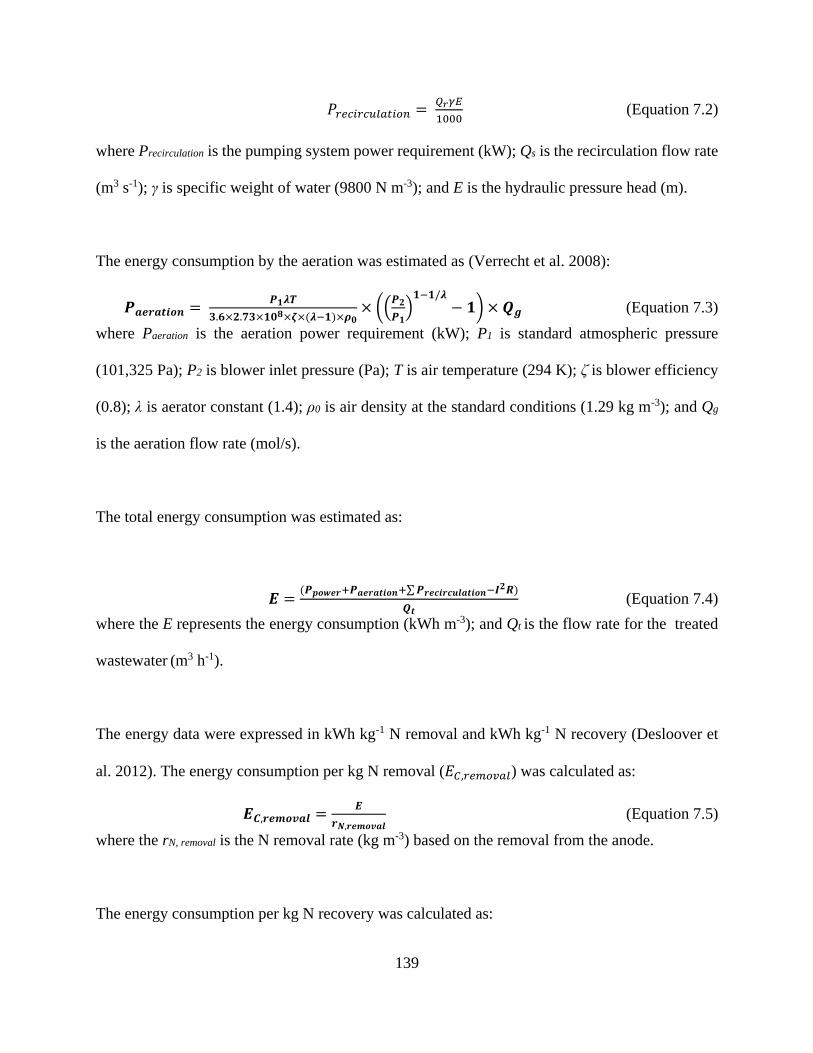
139
𝑃𝑟𝑒𝑐𝑖𝑟𝑐𝑢𝑙𝑎𝑡𝑖𝑜𝑛 = 𝑄𝑟𝛾𝐸
1000 (Equation 7.2)
where Precirculation is the pumping system power requirement (kW); Qs is the recirculation flow rate
(m3 s-1); γ is specific weight of water (9800 N m-3); and E is the hydraulic pressure head (m).
The energy consumption by the aeration was estimated as (Verrecht et al. 2008):
𝑷𝒂𝒆𝒓𝒂𝒕𝒊𝒐𝒏 = 𝑷𝟏𝝀𝑻
𝟑.𝟔×𝟐.𝟕𝟑×𝟏𝟎𝟖×𝜻×(𝝀−𝟏)×𝝆𝟎× ((
𝑷𝟐
𝑷𝟏)
𝟏−𝟏/𝝀− 𝟏) × 𝑸𝒈 (Equation 7.3)
where Paeration is the aeration power requirement (kW); P1 is standard atmospheric pressure
(101,325 Pa); P2 is blower inlet pressure (Pa); T is air temperature (294 K); ζ is blower efficiency
(0.8); λ is aerator constant (1.4); ρ0 is air density at the standard conditions (1.29 kg m-3); and Qg
is the aeration flow rate (mol/s).
The total energy consumption was estimated as:
𝑬 =(𝑷𝒑𝒐𝒘𝒆𝒓+𝑷𝒂𝒆𝒓𝒂𝒕𝒊𝒐𝒏+∑ 𝑷𝒓𝒆𝒄𝒊𝒓𝒄𝒖𝒍𝒂𝒕𝒊𝒐𝒏−𝑰𝟐𝑹)
𝑸𝒕 (Equation 7.4)
where the E represents the energy consumption (kWh m-3); and Qt is the flow rate for the treated
wastewater (m3 h-1).
The energy data were expressed in kWh kg-1 N removal and kWh kg-1 N recovery (Desloover et
al. 2012). The energy consumption per kg N removal (𝐸𝐶,𝑟𝑒𝑚𝑜𝑣𝑎𝑙) was calculated as:
𝑬𝑪,𝒓𝒆𝒎𝒐𝒗𝒂𝒍 =𝑬
𝒓𝑵,𝒓𝒆𝒎𝒐𝒗𝒂𝒍 (Equation 7.5)
where the rN, removal is the N removal rate (kg m-3) based on the removal from the anode.
The energy consumption per kg N recovery was calculated as:

140
𝑬𝑪,𝒓𝒆𝒄𝒐𝒗𝒆𝒓𝒚 =𝑬
𝒓𝑵,𝒓𝒆𝒄𝒐𝒗𝒆𝒓𝒚 (Equation 7.6)
where the rN, recovery is the N recovery rate (kg m-3) based on the recovery from the whole BES.
7.2.3 Mathematical model of BES-based ammonia recovery
To facilitate the understanding of the effects of operating factors on the BES operation and
ammonia recovery, numerical simulations were also performed using models that were developed
and validated previously (Liu et al. 2016). The BES was modeled as three components, an anode
chamber, a cathode chamber, and a CEM. In each component, transport and reaction of all major
species in the experimental BES, i.e., Na+, Cl-, HAc, Ac-, NH4+, NH3, H2CO3, HCO3-, CO3
2-, H+
and OH-, are considered. In the anolyte/catholyte chamber, evolution of the concentration of each
species was modeled by considering mass conservation, its transport toward/from the CEM, the
acid-base reactions involved, and the electrochemical reactions associated with the Faraday current.
In the CEM, in addition to the acid-base reactions, the transport of each species by diffusion and
migration was modeled using the Poisson-Nernst-Planck equations. Donnan equilibrium was
enforced at the CEM-anolyte/catholyte interface. To model the recovery of ammonia from the
catholyte due to aeration, the Henry’s law was used to describe the equilibrium between the NH3
in the catholyte and the aeration gas. Finally, electro-neutrality and charge conservation were
enforced throughout the system.
The concentration evolution of the following species is considered: Na+, Cl-, HAc, Ac-, NH4+, NH3,
H2CO3, HCO3-, CO3
2-, H+ and OH-. The system is divided into three parts: the anode chamber, the
cathode chamber, and the membrane (CEM in this case). The average concentration of species i
inside each chamber follows

141
𝑉𝑗
𝜕𝐶𝑖𝑗
𝜕𝑡= 𝐴 ⋅ 𝐽𝑖,𝑗
′ − 𝑖,𝑗𝑎 + 𝑖,𝑗
𝑐 𝑉𝑗 (Equation 7.7)
where 𝑉𝑗 is the volume of chamber j (j=1: anode chamber; j=2 cathode chamber), 𝐶𝑖𝑗 is the
concentration of species i in chamber j, 𝐴 is the area of the CEM, and 𝐽𝑖,𝑗′ is the flux of species i
into chamber j. 𝑖,𝑗𝑎 is the removal of species i from chamber j due to aeration, which is determined
by assuming fast equilibrium between species dissolved in the catholyte and existing in the
aeration gas (Henry’s Law). 𝑖,𝑗𝑐 is the generation/removal rate (per volume) of the species i due to
chemical/biological reactions, respectively. For example, for the NH3, NH4+ and H+ concentration,
relevant generation/removal needs to be included because of the acid-base equilibrium
NH4+↔NH3 + H+. A list of all acid-base equilibrium is provided in Table 7.1.
The CEM is resolved spatially in its thickness direction. Each species i at x=0 (anode/CEM
interface) and L (CEM/cathode interface) is always in equilibrium with that in the anode and
cathode chambers, respectively. The distribution of each species i across the CEM, 𝐶𝑖𝑚 , is
governed by
𝜕𝐶𝑖
𝑚
𝜕𝑡= 𝑖,𝑚
𝑐 + ∇ ⋅ 𝐽𝑖,𝑚 (Equation 7.8)
where 𝑖,𝑚𝑐 is the generation/consumption of species i by acid-base equilibrium. 𝐽𝑖,𝑚 is the flux of
species i in the membrane given by the Nernst-Planck equation:
𝐽𝑖,𝑚 = −𝐷𝑖𝑚 (
𝜕𝐶𝑖𝑚
𝜕𝑥+ 𝑧𝑖𝐶𝑖
𝑚 𝑒
𝑘𝐵𝑇
𝜕𝜙
𝜕𝑥)
(Equation 7.9)
where 𝐷𝑖𝑚 and 𝑧𝑖 are the diffusion coefficient in the membrane and valence of species i,
respectively; 𝑒 and 𝑘𝐵𝑇 are the electron charge and thermal energy; 𝜙 is the electrical potential.
Because the concentration of various species inside the anode/cathode chambers evolves slowly at

142
a time scale of tens of hours but the relaxation of species concentration within the CEM is fast due
to CEM’s small thickness, the time dependence term in Eq. (Equation 6.2) is unimportant and thus
neglected.
The concentration distribution of any species i across the anolyte/catholyte-CEM interfaces is
treated as follows. For electrically neutral species, their concentrations are continuous across these
interfaces. For a charged species i, the Donnan equilibrium condition is used, i.e.,
𝐶𝑖m = exp (−𝑧𝑖𝑒Δ𝜙/𝑘𝐵𝑇)𝐶𝑖
𝑗
(Equation 7.10)
where Δ𝜙 is the electrical potential drop across the CEM-solution interface (usually termed the
Donnan potential). Note that the Donnan potential attracts cations into (repels anions from) the
CEM so that the negative fixed charge inside the membrane is balanced by the free ions.
Finally, the electro-neutrality condition and the charge conservation law are enforced:
𝜔𝑋 + Σ𝑖𝑍𝑖𝐶𝑖 = 0 (Equation 7.11)
𝐼 = 𝐹Σ𝑖𝑧𝑖𝐽𝑖 (Equation 7.12)
where 𝜔 is the sign of the fixed space charge in any domain (𝜔 = 0 in the anode/cathode chamber
and zero charge membranes; 𝜔 = −1 and +1 in cation and anion exchange membranes,
respectively). 𝑋 is the fixed charge density of each domain. 𝐹 and 𝐼 are the Faraday constant and
the current density through the CEM, respectively.
Table 7.1 Acid-base reactions and gas-solution equilibrium considered in our model.
Constant Reaction Equilibrium equation Value* Notes
Acid-base
reaction
Ka,Ac HAc↔Ac-+H+ 𝐾a,Ac =𝐶Ac− ⋅ 𝐶H+
𝐶HAc 0.0174 Taken
from
Ref.
(Dykstr
a et al.
2014a)
Ka,CA1 H2CO3↔H++HCO
3- 𝐾a,CA1 =
𝐶H+ ⋅ 𝐶HCO3−
𝐶H2CO3
4.4668×10⁻⁴
Ka,CA2 HCO3-↔H++CO3
2- 𝐾a,CA2 =𝐶H+ ⋅ 𝐶CO3
2−
𝐶HCO3−
4.6774×10⁻⁸
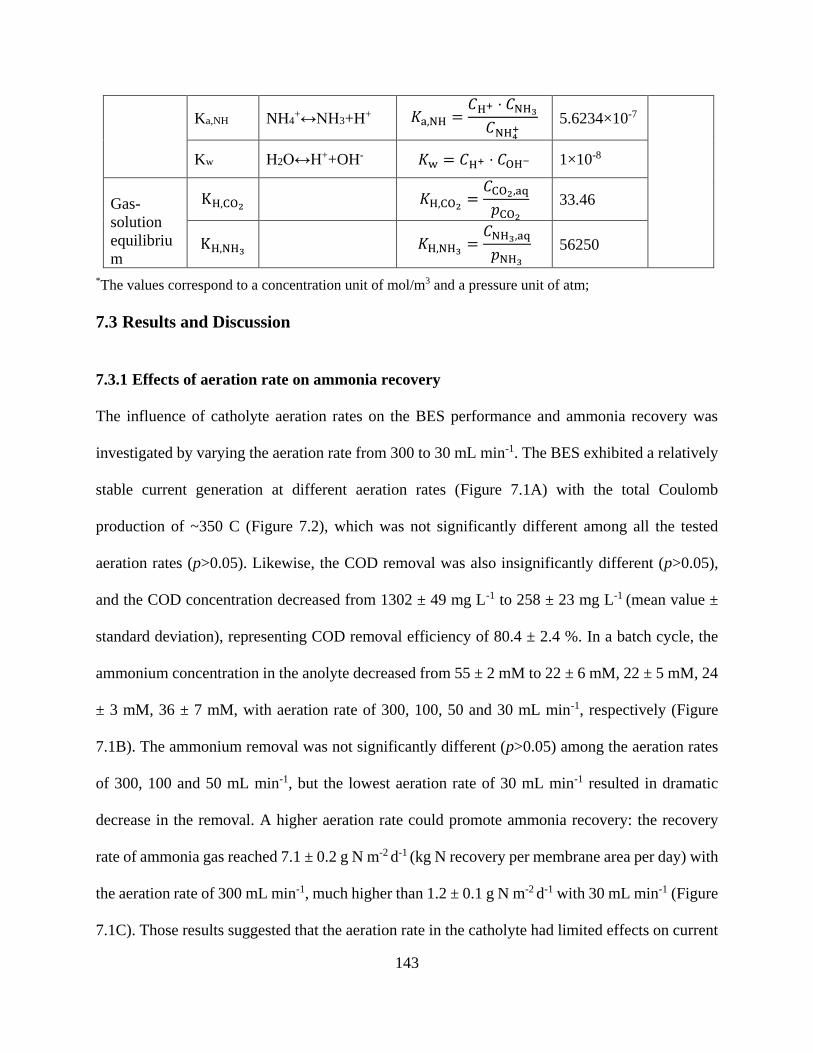
143
Ka,NH NH4+↔NH3+H+ 𝐾a,NH =
𝐶H+ ⋅ 𝐶NH3
𝐶NH4+
5.6234×10⁻⁷
Kw H2O↔H++OH- 𝐾w = 𝐶H+ ⋅ 𝐶OH− 1×10⁻⁸
Gas-
solution
equilibriu
m
KH,CO2 𝐾H,CO2
=𝐶CO2,aq
𝑝CO2
33.46
KH,NH3 𝐾H,NH3
=𝐶NH3,aq
𝑝NH3
56250
*The values correspond to a concentration unit of mol/m3 and a pressure unit of atm;
7.3 Results and Discussion
7.3.1 Effects of aeration rate on ammonia recovery
The influence of catholyte aeration rates on the BES performance and ammonia recovery was
investigated by varying the aeration rate from 300 to 30 mL min-1. The BES exhibited a relatively
stable current generation at different aeration rates (Figure 7.1A) with the total Coulomb
production of ~350 C (Figure 7.2), which was not significantly different among all the tested
aeration rates (p>0.05). Likewise, the COD removal was also insignificantly different (p>0.05),
and the COD concentration decreased from 1302 ± 49 mg L-1 to 258 ± 23 mg L-1 (mean value ±
standard deviation), representing COD removal efficiency of 80.4 ± 2.4 %. In a batch cycle, the
ammonium concentration in the anolyte decreased from 55 ± 2 mM to 22 ± 6 mM, 22 ± 5 mM, 24
± 3 mM, 36 ± 7 mM, with aeration rate of 300, 100, 50 and 30 mL min-1, respectively (Figure
7.1B). The ammonium removal was not significantly different (p>0.05) among the aeration rates
of 300, 100 and 50 mL min-1, but the lowest aeration rate of 30 mL min-1 resulted in dramatic
decrease in the removal. A higher aeration rate could promote ammonia recovery: the recovery
rate of ammonia gas reached 7.1 ± 0.2 g N m-2 d-1 (kg N recovery per membrane area per day) with
the aeration rate of 300 mL min-1, much higher than 1.2 ± 0.1 g N m-2 d-1 with 30 mL min-1 (Figure
7.1C). Those results suggested that the aeration rate in the catholyte had limited effects on current

144
generation and COD removal, but could strongly affect the ammonium removal and ammonia
recovery. As shown in Figure 7.1C, there is no significant difference for ammonia recovery rate at
the aeration rates of 100 and 300 ml min-1, likely because that the high aeration rate provided a
sufficient stripping force to remove ammonia gas from the catholyte and was no longer a limiting
factor for ammonium recovery in the BES.
To further understand the mechanism of the effects, mathematical simulation was performed under the
similar conditions, i.e., fixed current density of 1 A m-2 for 24 hours with different aeration rates. A similar
trend to that of experimental results was observed: a higher aeration rate led to a higher ammonium removal
from the wastewater (anolyte) to the catholyte and a lower ammonium concentration in the catholyte (Figure
Figure 7.1 Ammonia recovery by the BES affected by different catholyte
aeration rates: (A) current generation; (B) NH4+-N concentration in the
anolyte and the catholyte; (C) the NH3 recovery rate; and (D) simulated
anolyte and catholyte NH4+-N concentration. The external resistance was 1 Ω
and the external voltage was 0.8 V.

145
7.1D), which resulted in higher ammonia recovery. The ammonium concentration in the anolyte effluent
decreased from 25.7 ± 1.9 mM to 19.6 ± 4.2 mM when the aeration rate increased from 30 to 300 mL min-
1, while the ammonium concentration in the catholyte at the end of each operating cycle decreased from
61.5 ± 4.4 mM to 10.1 ± 0.1 mM. The simulation results also showed that the recovery of ammonia directly
depended on both the aeration rate and the related catholyte ammonium concentration (Henry’s law)
(Dasgupta and Dong 1986). A high aeration rate was effective in driving more ammonia out of the catholyte
(Figure 7.3), leading to a lower ammonium concentration in the catholyte, which in turn facilitated the
ammonium removal from the anolyte through both migration and diffusion of NH4+ ions from the anolyte
to the catholyte (Figure 7.1D). As a result, the ammonia recovery from each batch cycle increased from 1.5
± 0.1 mmol to 3.2 ± 0.1 mmol when the aeration rate increased from 30 to 300 mL min-1.
0
100
200
300
400
Q,
C
Flow rate, mL/min300 100 50 30
Figure 7.2 The total Coulomb generation per cycle for BES with different aeration rate.

146
Figure 7.3 The simulated amount of NH3 collected from catholyte by aeration with different
catholyte aeration rate
Energy consumption was analyzed for ammonium removal from the anode chamber and ammonia
recovery from the whole BES, respectively (Figure 7.4). The removal required 5.1 ± 0.4, 4.3 ± 0.2,
4.1 ± 0.1, and 6.9 ± 0.7 kWh kg-1 N when the aeration rate was 300, 100, 50 and 30 mL min-1,
respectively, in which over 90% was consumed by the external power supply and catholyte
aeration (Figure 7.4A). For example, with the aeration rate of 300 mL min-1, 50.0% of energy
consumption for ammonium removal was due to the aeration, 43.5% was consumed by the external
power supply, and 6.5% was due to the anolyte and catholyte recirculation. As increasing the
aeration rate from 30 to 100 mL min-1, the energy consumption was decreased due to the improved
ammonium removal efficiency. When the aeration rate increased from 100 to 300 mL min-1, the
ammonium removal was not significantly different, and therefore the increased energy
consumption due to more aeration resulted in high total energy consumption. Ammonia recovery
required 5.7 ± 0.5, 4.9 ± 0.3, 6.1 ± 0.4, and 26.2 ± 1.1 kWh kg-1 N when the aeration rate was 300,

147
100, 50 and 30 mL min-1, respectively, which was higher than the energy consumption for removal
at the same aeration rate, especially when the aeration rate was 30 mL min-1 (Figure 7.4B). With
the same aeration rate, the energy consumption for recovery was higher than that for removal,
because some of the removed ammonium was not successfully recovered and thus still stayed in
the catholyte. The ammonia recovery rate was 7.1 ± 0.2, 7.1 ± 0.1, 5.1 ± 0.1, and 1.2 ± 0.1 kg N
m-2 d-1, when the aeration rate was 300, 100, 50 and 30 mL min-1, respectively. The low ammonia
recovery rate at 30 mL min-1 aeration rate led to the significantly high energy consumption of 26.
2 ± 1.1 kWh kg-1 N. Increasing the aeration rate from 30 to 100 mL min-1 improved the ammonia
recovery, thereby decreasing the energy consumption for recovery by both external power supply
(from 16.4 ± 0.7 to 2.5 ± 0.3 kWh kg-1 N recovery) and aeration (from 7.7 ± 0.4 to 2.0 ± 0.2 kWh
kg-1 N recovery). The aeration rate of 300 mL min-1 gave higher energy consumption per recovery
than that of 100 mL min-1, because of similar ammonia recovery but higher aeration energy
demand. Other parameters, such as recirculation rate, solution pH, etc., might also affect the energy
consumption for ammonia recovery in BES but their contribution could be limited compared to
those studied here.

148
Figure 7.4 Energy consumption by the BES affected by different aeration rate: (A) energy
consumption for ammonium removal; and (B) energy consumption for ammonia recovery
(blue: aeration; orange: power supply; yellow: catholyte recirculation; green: anolyte
recirculation).
7.3.2 Effects of current generation – external voltage
The effect of current generation was firstly examined by varying the external voltage from 0 to 0.8 V across
1 Ω and with 100 mL min-1 catholyte aeration. Both current generation and total Coulomb production were
strongly affected by the external voltage and showed significant differences (p<0.05). The maximum
current density of the BES was 0.3 ± 0.1, 1.1 ± 0.1, and 1.6 ± 0.2 A m-2 (Figure 7.5A) while the total
Coulomb production was 126 ± 11, 245 ± 20, and 329 ± 33 C (Figure 7.6) with external voltage of 0, 0.5
and 0.8 V, respectively. The COD concentration in the anolyte decreased from 1302 ± 49 mg L-1 to 277 ±
51 mg L-1, representing COD removal efficiency of 78.8 ± 3.5 %. The ammonium concentration in the

149
anolyte decreased from 55 ± 2 mM to 24 ± 1 mM, 21 ± 1 mM, 20 ± 2 mM, with external voltage of 0, 0.5
and 0.8 V, respectively, with no significant difference (p>0.05), while the ammonium concentration in the
catholyte gradually increased to 16 mM under three tested conditions (Figure 7.5B). The recovery of
ammonia gas increased from 2.9 ± 0.1 (0 V) to 7.1 ± 0.1 g N m-2 d-1 (0.8 V) benefited from higher current
generation under a higher external voltage (Figure 7.5C). Mathematical simulation was conducted with the
ammonia recovery model containing two inputs: C1) I = 0.5 A m-2 and t = 48 h, and C2) I = 0.25 A m-2 and
t = 48 h. The simulated results showed that the anolyte ammonium concentration in C1 (15 ± 1 mM) was
much lower than in C2 (31 ± 1 mM) due to the higher current generation in C1, which facilitated the
ammonium removal from the anolyte (Figure 7.5D). Due to the efficient aeration in the catholyte, the
catholyte ammonium concentration was the same at the end of each operating cycle, resulting in higher
ammonia recovery in C1 than C2 (Figure 7.7).
Figure 7.5 Ammonia recovery by the BES affected by different external voltages: (A) current
generation; (B) NH4+-N concentration in the anolyte and the catholyte effluent; (C) the
NH3 recovery rate; and (D) the simulated anolyte and catholyte NH4+-N concentrations. The
external resistance was 1 Ω and the catholyte aeration rate was 100 mL min-1.

150
0
100
200
300
400
Q,
C
0 0.5 0.8 External voltage
Figure 7.6 The total Coulomb generation per cycle for BES with different external voltage.
1 2 3 4 5 6 7 80
1
2
3
4
I=0.5 A m-2
, 48 h
I=0.25 A m-2
, 48 h
NH
4
+-N
rec
ov
ered
, m
mol
Cycle
Figure 7.7 The simulated amount of ammonia recovery for BES with different current.
The energy consumption with different external voltages is shown in Figure 7.8. As the external
voltage increased from 0 V to 0.8 V, the energy consumption by power supply increased from 0
to 3.3 ± 0.3 kWh kg-1 N recovery; applying the same aeration rate of 100 mL min-1 demanded the
same absolute amount of aeration energy, but the normalized energy consumption for recovery by

151
aeration decreased from 4.5 ± 0.4 to 2.6 ± 0.3, because of improved ammonia recovery at a higher
external voltage (Figure 7.8). The total energy consumption for recovery decreased from 5.7 ± 0.5
to 4.5 ± 0.6 kWh kg-1 N recovery when the external voltage increased from 0 to 0.5 V, and the
total energy consumption then increased to 6.4 ± 0.8 kWh kg-1 N recovery with the external voltage
of 0.8 V, suggesting that a moderate external voltage could create a balance between increasing
ammonia recovery and increased energy consumption by power supply, resulting in a relatively
low energy consumption overall.
Figure 7.8 Energy consumption for ammonia recovery affected by different external voltages
(Green: anolyte recirculation; yellow: catholyte recirculation; orange: power supply; and
cyan: aeration).
7.3.3 Effect of current generation - external resistance
The effect of current generation was further studied by varying external resistance of 1 Ω, 10 Ω and 100 Ω
under a fixed external voltage of 0.8 V. The maximum current density of the BES increased from 0.8 ± 0.1
to 1.6 ± 0.2 A m-2 (Figure 7.9A) when the external resistance decreased from 100 to 1 Ω; however, the total
152
Coulomb production per cycle did not show significant difference: 352 ± 22 (1 Ω), 350 ± 14 (10 Ω), and
346 ± 33 C (100 Ω) (Figure 7.10) (p<0.05), because of different lengths of batch operation with different
external resistance (that is, despite a lower current generation with 100 Ω, the BES batch last for a longer
period of time, which allowed more Coulombs to be harvested). The ammonium concentration in the
anolyte effluent was stable (22.7 ± 0.8 mM) regardless of the external resistance (Figure 7.11), related to
the fact of the similar Coulomb production. The ammonium concentration in the catholyte effluent
increased from 5.2 ± 0.5 mM to 17.3 ± 0.5 mM from cycle 1 to cycle 4 because of ammonium transport
from the anolyte into the catholyte and residue ammonium after stripping; this trend was not significantly
different among three tested resistors (p>0.05). The recovery rate of ammonia gas increased from 3.2 ± 0.1
to 7.1 ± 0.1 g N m-2 d-1 as the external resistance decreased from 100 Ω to 1 Ω, indicating that lower external
resistance could accelerate the ammonia recovery within the same time period (Figure 7.9B). The
simulation was performed with two inputs: C1) I = 0.5 A m-2 and t = 48 h, and C3) I = 1 A m-2 and t = 24
h. These two simulations (C1 and C3) represented the current regulation with the same total Coulomb
production under different length of the operating period. The simulation showed similar anolyte
ammonium concentration at the end of each cycle between C1 and C3, confirming that similar Coulomb
production resulted in similar amount of removed ammonium from the anolyte (Figure 7.9C).

153
Figure 7.9 The BES performance affected by different external resistances: (A) current
generation; (B) the NH3 recovery rate; and (C) simulated NH4+-N concentration in the
anolyte and catholyte effluents. The external voltage was 0.8 V and the catholyte aeration
rate was 100 mL min-1

154
0
150
300
450
Q, C
External resistance, ohm100 10 1
Figure 7.10 The total Coulomb generation per cycle for BES with different external
resistance.
10
20
30
40
1 2 3 4
0
10
20
CN
H+ 4-N
, an
oly
te,
mM
1 ohm
10 ohm
100 ohm
CN
H+ 4-N
, ca
tho
lyte,
mM
cycle
Figure 7.11 The NH4+-N concentration for anolyte and catholyte effluent in BES with
different external resistances.
Energy consumption was 7.2 ± 0.7, 6.6 ± 0.7, and 5.7 ± 0.5 kWh kg-1 N when the external
resistance was 100 Ω, 10 Ω and 1 Ω, respectively (Figure 7.12). As the external resistance

155
decreased from 100 Ω to 1 Ω, the energy consumption by the catholyte aeration decreased from
4.4 ± 0.4 to 2.3 ± 0.3 kWh kg-1 N recovery, resulting in the decrease of total energy consumption
per kg N recovery. The energy consumption by power supply did not show significant difference
regardless of the external resistances (2.9 ± 0.3 kWh kg-1 N recovery), resulting from the similar
total Coulomb generation. As the external resistance increased from 1 Ω to 100 Ω, the power
generation in BES increased from 0.02 to 0.9 ± 0.1 kWh kg-1 N recovery. The internal resistance
for the BES was estimated to be 315 Ω according to the polarization curve shown in Figure 7.13
and thus external resistance such as 100 Ω that was close to the internal resistance of the BES
would result in more energy production.
Figure 7.12 Energy consumption for ammonia recovery affected by different external
resistances (Gray: anolyte recirculation; yellow: catholyte recirculation; cyan: power
supply; and magenta: aeration).

156
Figure 7.13 The polarization curve for BES.
7.3.4 Perspectives
The present BES achieved the lowest energy consumption of 4.5 ± 0.6 kWh kg-1 N for ammonia
recovery with a recovery rate of 5.6 g N m-2 d-1, under the condition of 100 mL min-1 catholyte
aeration, 0.5 V external voltage and 1 Ω resistance. This energy consumption is much lower than
that of the Haber-Bosch process for ammonia synthesis (8-14 kWh per kg N) (Erisman et al. 2008,
Maurer et al. 2003b), and is also low when comparing to the existing nitrogen removal/recovery
technologies (Table 1). The air stripping process requires 11-14 kWh kg-1 N for nitrogen removal
and potential recovery, including energy consumption for chemical production, aeration pumping
and excess heat. Biological nitrogen removal processes such as combined nitrification and
denitrification, and anammox convert ammonia to nitrogen gas. Combined nitrification and
denitrification requires 11-14 kWh kg-1 N while anammox needs 1-5 kWh kg-1 N for ammonia
removal. Although anammox has a low energy demand, it removes ammonia from wastewater

157
instead of recovery. Therefore, BES, which enables ammonia recovery and has relatively low
energy consumption, will be of strong interest to sustainable nitrogen management in wastewater
treatment. However, the recovery rate of ammonia in BES (0.40 kg N m-3 d-1, kg N per treated
water volume per day) is not high, particularly comparing to that of anammox (0.27-2.33 kg N m-
3 d-1) (Table 7.2). The ammonia removal/recovery rate was represented with unit kg N m-3 d-1,
because the existing technologies are not membrane based. The recovery rate of ammonia in BES
is comparable with that in air stripping (0.10-0.76 kg N m-3 d-1) and combined nitrification and
denitrification (0.14-0.58 kg N m-3 d-1), while the energy consumption is much lower in BES. The
ammonia recovery in BES is affected by ammonia input, current generation (which is related to
organic compounds, microbial activities, and operating temperature), and aeration, which should
be optimized to enhance the recovery rate.
Table 7.2 Comparison of different technologies for ammonia removal and recovery from
wastewater
Technology Purpose Rate Efficiency Energy demand References
kgN m−3 d−1 (kWh per kg N)
Air stripping Recovery 0.10-0.76 91% 11-14 (Maurer et al.
2003b)
Nitrification &
denitrification Removal 0.14-0.58 90-98% 11-14 (Won et al. 2015)
Anammox Removal 0.27-2.33 88-99% 1-5 (Lackner et al.
2014)
BES Recovery 0.40 83% 4.5 This study
BES Removal 0.48 87% 2.2 This study
158
Understanding energy consumption will help to establish an energy balance, which can show us
how far we are from an energy-neutral (or energy-positive) ammonia recovery process by using
BES. Because high current generation could facilitate ammonium transport and subsequent
ammonia recovery, an external resistor at extremely low value of 1 Ω was used in the condition
that had the lowest energy consumption for recovery. With such low external resistance, power
output can be neglected and thus there would be little energy production. A previous study of
ammonia recovery in an MFC achieved a surplus energy of 1.0 kWh kg-1 N, in which more energy
was produced than needed for the ammonia recovery, resulting from a small catholyte volume for
aeration (aeration rate: 0.5 vvm; catholyte volume: 20 mL) and no external power supply (Kuntke
et al. 2012). However, the ammonia recovery rate in that study was relatively low at 3.3 g N m-2
d-1, less than half of the highest ammonia recovery rate of 7.1 g N m-2 d-1 obtained in this study
(with an aeration rate of 1.7 vvm and external supply of 0.8 V). Therefore, there is a trade-off
between the increased ammonia recovery rate and increased energy consumption and the benefits
of more ammonia recovery at a price of higher energy consumption will require further analysis.
Reducing energy consumption and considering energy production by BES warrant further
investigation through optimized configuration design and operation. Decreasing the catholyte
volume could be one of the possible approaches to reduce energy consumption. With a smaller
catholyte volume, the energy consumed by aeration could be reduced with a more efficient
ammonia recovery from the catholyte. To produce energy, the BES can be operated in either an
MFC mode (for electricity generation) or an MEC mode (for hydrogen production). The MEC
mode may be preferred because of higher current generation under an external voltage and thus a
higher ammonia recovery rate. With an external voltage >0.2 V and in the absence of aeration,
159
hydrogen gas can be produced in the cathode (Ki et al. 2016, Liu et al. 2005). Although an external
voltage was also applied to the BES in this study, the use of oxygen as a terminal electron acceptor
prevented hydrogen production. Thus, future studies may consider a cathode without air aeration.
However, our study has demonstrated the importance of aeration to ammonia stripping and thus
recovery. To actively drive ammonia out of the catholyte in the absence of air aeration,
recirculation of the produced hydrogen gas could be considered.
7.4 Conclusions
This study has quantified the energy consumption for ammonia recovery affected by catholyte aeration
rates and current generation in a BES through integrated experiments and mathematical modeling. The
aeration rate in the catholyte could strongly impact the ammonia recovery and energy consumption: a high
aeration rate resulted in a high ammonia recovery while a moderate aeration rate (100 mL min-1) led to the
lowest energy consumption, indicating that there is a trade-off between the increased ammonia recovery
rate and increased energy consumption. The high current generation, which was achieved with either high
external voltage (0.8 V) or low external resistance (1 Ω), could improve the ammonia recovery. However,
a trade-off existed between energy consumption and ammonia recovery. Compared to other ammonia
removal/recovery technologies such as combined nitrification and denitrification, anammox, and air
stripping, BES accomplishes ammonia recovery, in addition to ammonia removal, and has relatively low
energy consumption. These advantages make BES a promising technology for energy-efficient resource
recovery from wastewater.
160
Chapter 8 Self-supplied ammonium bicarbonate draw solute for achieving
wastewater treatment and recovery in a microbial electrolysis cell-forward
osmosis-coupled system
(This section has been published as Qin, M., & He, Z.* (2014). Self-supplied ammonium
bicarbonate draw solute for achieving wastewater treatment and recovery in a microbial
electrolysis cell-forward osmosis-coupled system. Environmental Science & Technology
Letters, 1(10), 437-441.)
Abstract
This study has presented a proof of concept system for self-sustained supply of ammonium-based
draw solute for wastewater treatment, through coupling a microbial electrolysis cell (MEC) and a
forward osmosis (FO). The MEC produced an ammonium bicarbonate draw solute via recovering
ammonia from synthetic organic solution, which was then applied in the FO for extracting water
from the MEC anode effluent. The recovered ammonium could reach a concentration of 0.86 mol
L-1, and with this draw solution, the FO extracted 50.1 ± 1.7 % of the MEC anode effluent. The
lost ammonium during heat regeneration could be supplemented with additional recovered
ammonium in the MEC. The MEC achieved continuing treatment of both organic and ammonium
in the returned feed solution mixed with fresh anolyte, though at lower efficiency compared to that
with completely fresh anolyte. These results encourage further investigation to optimize the
coordination between MEC and FO with improved performance.

161
8.1 Introduction
Wastewater reuse is critical to sustainable wastewater treatment and requires effective
technologies to extract high-quality water from wastewater (Sharma and Sanghi 2013).
Membrane-based processes have been studied and/or employed to produce high-quality water
from wastewater (Logan and Elimelech 2012). Among them, forward osmosis (FO) process is of
particular interest because of its low energy consumption and reduced membrane fouling
(Lutchmiah et al. 2014a). In an FO process, water moves across a semipermeable membrane from
high water potential to low water potential, driven by an osmotic pressure gradient (Zhang et al.
2011a).
Draw solute plays a key role in creating an osmotic gradient for water extraction in FO (Lutchmiah
et al. 2014a). Because permeated water can dilute draw solution and some draw solutes may be
lost due to reverse salt flux, draw solute needs to be recovered by additional processes or
supplemented with fresh draw solute, thereby increasing energy requirement and operating cost of
the FO (Achilli et al. 2010). Various types of draw solutes have been proposed (Klaysom et al.
2013), and among them, thermolytic ammonium salts, such as ammonium bicarbonate, have been
demonstrated as an efficient and recyclable draw solute because of their high solubility, osmotic
efficiency, and circulation capacity (McCutcheon et al. 2005). More importantly, ammonium
bicarbonate can be recovered using moderate heat, which has significant energy advantages
compared with regeneration of other draw solutes (McGinnis et al. 2007, Trypuć and Kiełkowska
1998). However, the application of ammonium bicarbonate as a draw solute has been limited
because of high reverse salt flux that causes the loss to the feed solution, which will not only

162
require additional supply of fresh draw solute, but also deteriorate the quality of the remaining
feed solution (Chekli et al. 2012).
The concentration of ammonium in some wastewaters such as digester centrate and landfill
leachate can be over 500 mg L-1 (Renou et al. 2008). Thus, recovering ammonia from wastewater
may provide a sustainable approach for supplying draw solute to FO treatment, which is then used
to treat the same wastewater. An innovative method for ammonium recovery from wastewater is
using bioelectrochemical systems (BES) (Kelly and He 2014). During electricity generation,
ammonium migrates from the anode (wastewater) into the cathode through a cation exchange
membrane. It was found that high current generation could promote ammonium movement and
high pH of the catholyte facilitates the conversion of ammonium into ammonia gas, which can be
stripped out of the catholyte and then recovered. To make a draw solute, carbon dioxide will be
needed. The anode reaction releases carbon dioxide; additional carbon dioxide may be supplied by
combustion processes, for example, a power plant that provides both carbon dioxide and low heat
for recovering ammonium bicarbonate (Cusick et al. 2012).
Herein, we investigated the feasibility of the above concept with a coupled system consisting of a
microbial electrolysis cell (MEC) and an FO: the MEC was to degrade organic compounds (in its
anode) and recover ammonia (in the cathode) for preparing draw solute for the following FO
treatment, which extracted clean water from the MEC anode effluent. The key parameters
including ammonia recovery and regeneration, organic degradation, electricity generation, and
water flux were investigated.

163
8.2 Materials and Methods
8.2.1 The MEC-FO system
A bench-scale MEC-FO system consisted of two units, an MEC unit and an FO unit, which were
linked through two liquid streams (Figure 8.1). The synthetic organic solution was fed into the
anode chamber of the MEC, and its effluent then flowed into the feed side of the FO. The gas
streams from the anode and the cathode of the MEC were channeled through two 100-mL glass
bottles. The first bottle was an absorption bottle, filled with deionized water to collect gaseous
ammonia (NH3) and CO2 to generate ammonium bicarbonate. Additional carbon dioxide was
introduced into this bottle at a flow rate of 1.26 mL min-1 by a CO2 cylinder. The second bottle
was filled with 1 M sulphuric acid (H2SO4) to absorb the excessive NH3 that could not be captured
by the first bottle, named “recovery bottle”. Once the concentration of ammonium ions in the
absorption bottle reached 0.80 M, the solution was transferred to the FO as the draw solution for
water extraction from the treated organic solution (from the MEC anode). When the water flux in
the FO dropped below 1.0 L m-2 h-1 (LMH), the diluted draw solution was sent to a heat recovery
unit, in which the temperature was set at 80°C. The NH3 and CO2 were separated from the draw
solution and flowed into an adsorption flask containing deionized water to regenerate the draw
solution. The concentrated feed solution from the FO was adjusted to pH 7.0 with 80 µL of 0.1 M
NaOH solution and returned to the MEC for further treatment.

164
Figure 8.1 The schematic design of the MEC-FO coupled system
8.2.2 MEC and FO setup and operation
A tubular MEC was constructed with more details in the Supporting Information (SI). A 1-m long
carbon brush was folded to fit into the anode compartment as the anode electrode. The cathode
electrode was a piece of carbon cloth (160 cm2) coated with platinum/carbon as a catalyst (0.3 mg
Pt cm-2) (Zhang et al. 2010). The cathode compartment was aerated to provide oxygen for reaction
and to strip ammonia from the catholyte (Liao et al. 1995). The synthetic organic solution that
mimicked piggery wastewater or its anaerobic digestion effluent(Lei et al. 2007, Sánchez et al.
1995) contained (per liter of deionized water): glucose, 3.0 g; NH4Cl, 3.0 g; NaHCO3, 5.0 g; NaCl,
0.5 g; MgSO4, 0.015 g; CaCl2, 0.02 g; and trace elements, 1 mL (Angenent and Sung 2001). An
external voltage of 0.8 V was applied to the circuit by a power supply (CSI3644A, Circuit
Specialists, Inc., Mesa, AZ, USA) according to a previous study (Yossan et al. 2013).

165
The MEC had a tubular configuration, which used a CEM tube (Membrane International Inc.,
Ringwood, NJ, USA) to separate the anode and the cathode. The membrane tube was installed in
a glass tube, thereby creating two compartments, the cathode (inside the membrane tube) and the
anode (between the membrane and the glass tube). The liquid volume of the anode compartment
was 500 mL, and the cathode contained 500 mL deionized water. The anode was inoculated with
the anaerobic sludge from the Peppers Ferry Regional Wastewater Treatment Plant (Radford, VA,
USA).
The MEC was operated in a batch mode at room temperature (~20 °C). The anolyte was partially
replaced (50%) every 48 h while the catholyte was not changed during the entire experiment. When
the MEC was linked to the FO through supplying/receiving the feeding solution, 250 mL of the
fresh anolyte was added to the MEC in each cycle (while the other 250 mL anolyte was the
concentrated feed solution from the FO).
A SEPA CF Cell (Sterlitech Corporation, Kent, WA, USA) was used as a FO cell. The FO
membrane was cellulose triacetate (Hydration Technologies Inc., Albany, OR, USA), and installed
with its active layer facing the feed solution. During the operation, both the feed solution and the
draw solution were recirculated at 96 mL min-1. The water flux (LMH) is calculated by the change
of weight of the feed or draw solution (Wang et al. 2010a). The reverse salt flux (g m-2 h-1, gMH)
from the draw side to the feed side was calculated by measuring the salt concentration change in
feed solution (Wang et al. 2010a).

166
8.2.3 Measurement and analysis
The voltage across the external resistance in the MEC circuit was recorded every 5 min by a digital
multimeter (Keithley Instruments Inc., Cleveland, OH, USA). The pH of liquid stream was
measured by a benchtop pH meter (Oakton Instruments, Vernon Hills, IL, USA). Conductivity
was measured with a benchtop conductivity meter (Mettler-Toledo, Columbus, OH, USA). The
concentration of chemical oxygen demand (COD) was measured using a colorimeter (Hach
DR/890, Hach Company, Loveland, CO, USA). The concentration of ammonia was measured
using an ISE meter (Fisher Scientific, Pittsburgh, PA, USA). The CO2 was analyzed using a
Shimadzu GC-14A gas chromatograph equipped with a thermal conductivity detector (TCD).
Water flux in the FO was calculated by the change of weight recorded on a balance (Scort Pro,
Ohous, Columbia, MD, USA).
8.3 Results and Discussion
Preparing draw solution and generating feed solution was examined in the MEC via investigating
the ammonia recovery and the treatment of synthetic organic solution. Under an applied voltage
of 0.8 V, the MEC produced 1.8 ± 0.1 A m-2 (Figure 8.2A), and decreased the COD concentration
from 3.23 ± 0.16 to 1.27 ± 0.08 g L-1, representing a COD removal efficiency of 60.6 ± 2.2 % (0.98
± 0.07 kg m-3 d-1) (Figure 8.2B).
The ammonium concentration in the anolyte decreased from 0.92 ± 0.08 to 0.17 ± 0.05 g NH4+-N
L-1, representing removal of 81.5 ± 4.4 % (0.49 ± 0.04 kg m-3 d-1) (Figure 8.2C). The catholyte
had an NH4+-N concentration of 0.47 ± 0.12 g L-1. Assuming one electron moves one ammonium

167
ion from the anode chamber into the cathode chamber, migration of ammonium ions could
contribute to 48.9% of ionic flux through the CEM, indicating that ammonium ions acted as a
proton shuttle in the MEC system (Cord-Ruwisch et al. 2011). The catholyte pH increased from
6.89 to 9.33 (Figure 8.2D). The aeration in the cathode compartment promoted the stripping of
ammonia out of the catholyte (Kim et al. 2008). Although the catholyte pH of the present MEC
was lower than that of an MEC without aeration (up to 13 (Zhang et al. 2014b)), the lower catholyte
pH could decrease the cell overpotential and improve system stability (Zhuang et al. 2010). The
stripped ammonia was collected in the absorption bottle, in which the ammonium concentration
increased gradually to 11.4 g L-1: 45.3% of input ammonium was recovered by deionized water in
the absorption bottle, while 26.1% was collected by sulfuric acid in the recovery bottle. The gas
analysis shows that 87.3 ± 3.4 % of gas generated from the anode was CO2. The volume of
generated CO2 in one batch was about 47 mL, which was not enough for generating ammonium
Figure 8.2 Ammonia recovery in the MEC: (A) current density, (B) COD
concentration, (C) ammonium nitrogen concentration in the MEC and the
solution of absorption bottle, and (D) the pH in each chamber.

168
bicarbonate (considering the ratio between ammonium and carbon dioxide). Thus, additional CO2
was added into the adsorption bottle. After 10 batches, the NH4+-N concentration reached 11.4 g
L-1 (Figure 8.2 Ammonia recovery in the MEC: (A) current density, (B) COD concentration, (C)
ammonium nitrogen concentration in the MEC and the solution of absorption bottle, and (D) the
pH in each chamber.C), representing 0.86 mol L-1 ammonium bicarbonate.
The generated ammonium bicarbonate solution was transferred to the FO as a draw solution for
water recovery from the MEC anode effluent. The results demonstrated the effectiveness of this
draw solution. The FO achieved a maximum water flux of 2.9 ± 0.1 LMH, within the range of the
FO processes using ammonium bicarbonate as a draw solution in other studies (Chanukya et al.
2013, McCutcheon et al. 2005). The water flux decreased to 0.8 ± 0.1 LMH after 5-h operation
(Figure 8.3A), and 50.1 ± 1.7 % of the MEC anode effluent was extracted into the draw side. After
the FO treatment, the ammonium concentration in the feed solution increased from 0.24 ± 0.03 to
1.66 ± 0.15 g L-1, likely because of the concentrating effect due to reduced liquid volume and
ammonium intrusion from the draw side via reverse salt flux. It was determined that the reverse
salt flux was 2.6 ± 0.4 gMH (Figure 8.3B), with a salt rejection of 87.9 ± 1.8 %. During
regeneration of the draw solution in the heat recovery unit, 83.1% of ammonium was recovered at
80 °C, and the lost part was supplied by the additionally recovered ammonia in the MEC. The
lower recovery temperature at 60 °C achieved only 51.1% of ammonium recovery. After heat
regeneration, the extracted water contained less than 1 mg L-1 of ammonium and undetected COD.

169
Figure 8.3 The MEC-FO system: (A) water flux in the FO process, (B) reverse salt flux in
FO, the (C) current density from the mixture of returned feed solution and fresh anolyte in
the MEC, and (D) ammonium nitrogen concentration in the MEC and the FO
The concentrated feed solution from the FO was mixed with fresh anolyte (~1:1) and then the
mixture was fed into the MEC anode compartment in the following cycle. The COD concentration
in the mixture was 3.07 ± 0.28 g L-1 and the NH4+-N concentration was 1.08 ± 0.06 g L-1. The
MEC fed with the mixed influent generated 1.5 ± 0.1 A m-2 (Figure 8.3C), lower than that with
fresh feeding solution (1.8 ± 0.1 A m-2), possibly because of lower COD input and accumulation
of soluble microbial products (SMP) (Barker and Stuckey 1999, Rittmann and McCarty 2012).
The lower current resulted in relatively lower COD removal efficiency of 47.1 ± 3.5 % (0.73 ±
0.12 kg m-3 d-1) but had minor influence on the ammonium recovery (79.7 ± 2.0 %, 0.56 ± 0.04 kg

170
m-3 d-1). After 6 cycles the conductivity of the MEC anolyte slightly increased from 6.09 to 7.65
mS cm-1, because of the concentrated salts during the FO process. Increased conductivity in the
anolyte could decrease water flux in the FO, due to decreased salt gradient. It is expected that salts
will built up over time to a level that will significantly affect water flux; at that time (which needs
to be further verified), the anolyte may be disposed and the MEC will receive 100% fresh organic
solution to start a new cycle.
The total input nitrogen in ammonium in one cycle is 0.014 mol, among which 18.6% stayed in
the anolyte, 11.2% stayed in the catholyte as ammonium and 71.4% was stripped out as ammonia.
In each batch, 0.011 mol N was removed from the anolyte and among them 0.006 mol was
recovered to generate ammonium bicarbonate (in the absorption bottle; the rest 0.004 mol was
recovered in the Recovery Bottle). The ammonia recovery in the absorption bottle could be
improved by decreasing the pH of the absorption solution (e.g., using acidic solution instead of DI
water). During the FO process, 12.1% of the draw solute (ammonium) was lost every cycle due to
the reverse salt flux and 14.9% was lost in the heat regeneration process. The loss due to reverse
salt flux can hardly be avoided because of FO membrane properties; however, the loss during heat
regeneration can be reduced with improved regeneration efficiency (the literature reports up to
100% regeneration). Assuming 100% regeneration, the lost ammonium in each cycle (because of
reverse salt flux) will be about 0.009 mol, which may be resupplied by ammonium recovery in one
batch of the MEC at current recovery efficiency.
The total amount of input C is 0.04 mol (0.025 mol from glucose and 0.015 mol from sodium
bicarbonate). At the end of a batch, 60.6 % of the glucose was oxidized and inorganic carbon was

171
generated. The total amount of inorganic carbon was 0.032 mol. Among them, 0.002 mol was CO2
gas (47 mL), demonstrating that only 6.3% of the inorganic carbon was in gaseous phrase and the
majority of them existed in the solution. This was due to the low electrolyte pH (around 5) in the
anode chamber. As a result, CO2 was largely present as carbonate acid in the solution (Wojtowicz
2001). Similar to ammonium, the lost CO2 (0.009 mol) will need multiple batches to be resupplied.
As one can see, there is enough CO2 in the anode but most in the water due to low pH. By elevating
the anolyte pH, more CO2 may be released. For practical operation of the proposed system, we
think additional CO2 supply from an external source will still be required. This external source
already exists in wastewater treatment: anaerobic digesters will provide both CO2 (combustion of
CH4) and heat energy (the part of the energy that is usually not recovered or used).
Energy consumption in the MEC-FO system included the external power source in MEC, the
aeration in MEC, the recirculation of the solution both in MEC and FO. The data can be expressed
in kWh m-3 treated water, kWh kg-1 COD (removed) and kWh kg-1 N (removed). In the MEC, the
energy input by the external power supply was calculated as (Logan 2008):
𝑷𝒑𝒐𝒘𝒆𝒓 = ∫ 𝑰𝑬𝒅𝒕 𝒕
𝒕=𝟎(Equation 8.1)
where I is the current (A), R is the external resistance (1 Ω) and dt is the time increment
(s). Power requirement by the aeration was calculated as described in a previous publication
(Zhang and He 2013b). Power requirement by the recirculation pump was calculated as previous
study (Kim et al. 2010). Since the heat used to regenerate ammonium bicarbonate could be
provided by the power plant, the heat was not included in the energy input calculation.
In MEC, the energy input was 3.9 kWh m-3 treated water (2.0 kWh kg-1 COD, 5.1 kWh
kg-1 N). Among them, 53.8% was consumed by the external power supply, 16.8% was due to the

172
aeration in the cathode, and 29.4% was consumed by the anolyte recirculation. In FO process, the
energy input was 0.1 kWh m-3 treated water, which was much lower than that for MEC. As shown
in Table 8.1, if the MEC-FO was replaced with MFC-FO, the energy input will be negative, which
means more energy will be produced than needed for the ammonium recovery.
Table 8.1 Comparison between the MEC system, MFC-FO system and MFC
MEC MFC Conventional
NH3 stripping
Energy input (kWh kg-1 N)a 5.1
3.03(Kuntke et
al. 2012)
7.31(Maurer et
al. 2003a)
Net energy yield (kWh kg-1 N) -5.1
2.92(Kuntke et
al. 2012)
-9.03(Maurer et
al. 2003a)
Nitrogen recovery (kgN d-1 m-2)b 7.59 3.29(Kuntke et
al. 2012) -
a The energy input includes aeration, recirculation and external power.
b The production of clean water is vs. FO membrane surface
We have analyzed the mass distribution for both carbon and ammonium, and found that the system
would need multiple batches to resupply the lost ammonium and carbon dioxide due to reverse
salt flux and during regeneration. Improving regeneration efficiency will make it possible to
resupply ammonium via one-batch operation, but CO2 is still insufficient because of low anolyte
pH that retains most CO2 as carbonate acid. External supply of CO2 will be necessary and there is
readily available source during wastewater treatment, e.g., combustion of methane gas produced
in anaerobic digester that can also provide heat for regeneration of draw solute. Because of the
need for supplementing the lost draw solutes, low-strength wastewater may not be a suitable target
for the present system because of its low concentrations of both organics and ammonium. The
organic solution used here mimicked some types of animal wastewater, and the wastewaters such

173
as digestion effluent of other wastes and leachate containing higher concentrations of organics
and/or ammonium will also be of interest for this system.
In the MEC, the energy input was 3.9 kWh m-3 treated water (2.0 kWh kg-1 COD, or 5.1 kWh kg-
1 N), among which 53.8% was consumed by the external power supply, 16.8% was due to the
aeration in the cathode, and 29.4% was consumed by the anolyte recirculation. In the FO, the
energy input was 0.1 kWh m-3. To eliminate the major energy requirement by the external power
supply, microbial fuel cells (MFCs) may replace MECs for ammonia recovery. We will investigate
the use of MFCs and evaluate the relationship between reduced energy consumption and decreased
treatment efficiency.
Those results have successfully demonstrated the feasibility of coupling an ammonia-recovering
MEC with FO for treating organic solution and recovering valuable resources (e.g., ammonia and
water). Such cooperation provides a sustainable source of ammonium-based draw solute for FO.
Establishing a loop operation of wastewater between the MEC anode and the FO feed side could
alleviate the effect of reverse ammonium flux on the effluent quality with further
treatment/recovery in the MEC. The hydraulic retention time in each unit of the system needs to
be better coordinated because of uneven treatment speed between the two. Nevertheless, this proof-
of-concept system encourages further studies of system optimization with examination of actual
wastewaters.
174
Chapter 9 Recovery of Nitrogen and Water from Landfill Leachate by A
Microbial Electrolysis Cell–Forward Osmosis System
(This section has been published as Qin, M., Molitor, H., Brazil, B., Novak, J. T., & He, Z.*
(2016). Recovery of nitrogen and water from landfill leachate by a microbial electrolysis cell–
forward osmosis system. Bioresource technology, 200, 485-492.)
Abstract
A microbial electrolysis cell (MEC) - forward osmosis (FO) system was previously reported for
recovering ammonium and water from synthetic solutions, and here it has been advanced with
treating landfill leachate. In the MEC, 65.7 ± 9.1 % of ammonium could be recovered in the
presence of cathode aeration. Without aeration, the MEC could remove 54.1 ± 10.9 % of
ammonium from the leachate, but little ammonia was recovered. With 2 M NH4HCO3 as the draw
solution, the FO process achieved 51% water recovery from the MEC anode effluent in 3.5-h
operation, higher than that from the raw leachate. The recovered ammonia was used as a draw
solute in the FO for successful water recovery from the treated leachate. Despite the challenges
with treating returning solution from the FO, this MEC-FO system has demonstrated the potential
for resource recovery from wastes, and provide a new solution for sustainable leachate
management.

175
9.1 Introduction
The amount of solid waste is increasing globally because of increased population and living
standards, and thus proper treatment of solid waste is critically important to societal development
(Hoornweg and Bhada-Tata 2012). Among waste management options, landfilling is considered
as a simple and cost-effective treatment method and often acts as the last destination for the wastes
after appropriate treatment (Renou et al. 2008). Landfill leachate, the liquid waste that drains from
the landfill, is produced through decomposition of landfill materials and drainage of precipitation
that permeates and percolates through the landfill. Landfill leachate is one of the most complex
waste streams to manage because it contains a wide range of organic and inorganic compounds
including nutrients, chlorinated organics, inorganic salts and heavy metals (Foo and Hameed
2009). Leachate characteristics depend on many factors such as waste composition, landfill age,
precipitation, seasonal weather (Kulikowska and Klimiuk 2008, Puig et al. 2011). The presence of
toxic compounds in leachate generates problems in both direct disposal to natural water bodies
and infiltration into groundwater. Therefore, there is a demand for environmentally sustainable
solutions for landfill leachate treatment.
Leachate treatment technologies such as advanced oxidation, membrane separation, chemical
treatment, and biological processes have been practiced (Greenman et al. 2009). Especially,
biological treatment is widely and effectively employed to remove organic matter and nitrogen
from leachate (Gotvajn et al. 2009, Kurniawan et al. 2006). However, leachate usually has a low
carbon/nitrogen ratio, which makes the conventional nitrification and denitrification difficult (Puig
et al. 2011). Anaerobic ammonium oxidation (anammox) could provide a more sustainable
solution for ammonium removal with a high ammonium concentration (Liang and Liu 2008).

176
Young landfill leachate contains relatively large amounts of biodegradable organic matter which
could be aerobically oxidized, involving both energy consumption and the production of sludge.
Removal of organic matter could avoid the negative effects on the anammox process (Ruscalleda
et al. 2008). To achieve improved quality of the final effluent, membrane processes, such as
microfiltration (MF), ultrafiltration (UF), reverse osmosis (RO), and forward osmosis (FO), are
also applied in landfill leachate treatment (Cath et al. 2006, Renou et al. 2008). The major
drawback of the implementation of membrane process is membrane fouling, especially for RO and
FO. Thus, pretreatment of landfill leachate to remove organic matter, and to reduce solution
conductivity, is required for the membrane process treatment.
Bioelectrochemical systems (BESs) are also studied for simultaneous landfill leachate treatment
and energy generation (Damiano et al. 2014, Gálvez et al. 2009, Pant et al. 2010). In BES, such as
microbial fuel cells (MFCs) and microbial electrolysis cells (MECs), the organics are oxidized by
microorganisms in the anode, and the generated electrons may be used to produce electricity or
other valuable chemicals (Wang and Ren 2013). Because of the high conductivity, high buffering
capacity, and high ammonium concentration, landfill leachate is considered as a potential substrate
for BES (Mahmoud et al. 2014), especially for MECs, which can remove/recover ammonium
during electricity generation. In MECs, a higher current density would greatly enhance ammonia
recovery, and thus MECs with an external power exhibit a better performance for ammonium
recovery than MFCs (Zhang et al. 2014b). Previous studies of leachate treatment by BES focused
on the reduction of chemical oxygen demand (COD) in leachate by various types of MFCs (Ganesh
and Jambeck 2013, Greenman et al. 2009). It was demonstrated that MFCs could generate
electricity from leachate, but the excessive organic residues may decrease Coulombic efficiency

177
(CE), especially in membraneless MFC systems (Wu et al. 2015). It was reported that increasing
proportions of butyrate and propionate could decrease power density and CE from 1.9 to 1.0 W m-
3 and from 34 to 20 %, respectively (Teng et al. 2010). Although BES could effective remove
organic contaminants in leachate with electricity generation, the study of nutrient removal is very
limited. Previous studies showed that 50–70% of the total nitrogen could be removed from landfill
leachate with a dual-cathode MFC (Zhang and He 2013b). There have not been any studies that
attempted to recover ammonium from leachate in BES.
To explore the potential of resource recovery from landfill leachate, a previously developed MEC-
Forward Osmosis (FO) system was adopted here for treating leachate samples. This MEC-FO
system was developed to use MECs to recover ammonium from wastewater and use the recovered
ammonium as a draw solute in FO for water recovery (Qin and He 2014). This study moved beyond
the previous one with examining the waste (leachate) and the effects of aeration. The specific
objectives of this study were to: (1) investigate the ammonium recovery from landfill leachate in
an MEC; (2) examine the influence of aeration in the MEC cathode on leachate treatment; and (3)
explore the synergistic effect of MEC and FO on resource recovery from leachate.
9.2 Materials and Methods
9.2.1 The MEC-FO system
The MEC-FO system consisted of two units, an MEC and an FO, as shown in Figure 9.1. The
operating procedure: the landfill leachate is fed into the anode chamber of the MEC, and its effluent
then flows into the feed side of the FO; the collected ammonia gas from the MEC cathode is used
to prepare an ammonium bicarbonate solution with external CO2, which is then used as the draw

178
solution in the FO; and after water extraction in the FO, the concentrated feed solution is returned
to the MEC for further treatment.
Figure 9.1 Schematic of the MEC-FO system.
9.2.1.1 MEC setup and operation
The MEC had a tubular configuration, with a cation exchange membrane (CEM) tube (Membrane
International Inc., Ringwood, NJ, USA) to separate the anode and the cathode. The membrane tube
was installed in a glass tube, thereby creating two compartments: the cathode (inside the membrane
tube) and the anode (between the membrane and the glass tube). The liquid volume of the anode
compartment was 500 mL and the cathode compartment contained 500 mL deionized water. A 1-
m long carbon brush was folded to fit into the anode compartment as the anode electrode. The
cathode electrode was a piece of carbon cloth (160 cm2) coated with platinum/carbon as a catalyst
(0.3 mg Pt cm-2) (Zhang et al. 2010). The anode compartment was inoculated with anaerobic sludge
collected from the Peppers Ferry Regional Wastewater Treatment Plant (Radford, VA, USA). An

179
external voltage of 0.8 V was applied to the circuit by a power supply (CSI3644A, Circuit
Specialists, Inc., Mesa, AZ, USA) according to a previous study (Yossan et al. 2013). The external
resistance was fixed at 1 Ω for high current generation. The MEC was operated in a batch mode at
room temperature of ~20 °C. Half of the MEC anolyte (landfill leachate) was replaced every 144
h or 168 h depending on the hydraulic retention time (HRT) while the catholyte (DI water)
remained unchanged. The MEC cathode was operated with either aeration (oxygen reduction) or
no aeration (hydrogen evolution). The HRT was 6 days in MEC with aeration and 7 days in MEC
without aeration. The difference in HRT in these two modes was due to the different cathode
reactions. The HRT was set based on maximum COD removal and current generation. At the
beginning of each operation mode, the anolyte and the catholyte were disposed and the MEC
received fresh leachate as the anolyte and DI water as the catholyte to start new batch cycles. When
aeration was supplied, the air was pumped into the cathode compartment at a rate of 95 mL min-1
and the waste air was channeled through two 200-mL glass bottles. The first bottle was an
absorption bottle, filled with DI water to collect gaseous ammonia (NH3) and carbon dioxide (CO2)
to generate ammonium bicarbonate draw solute. Additional carbon dioxide was introduced into
this bottle at a flow rate of 1.02 mL min-1 by a CO2 cylinder. The second bottle was filled with 1
M sulfuric acid (H2SO4) to absorb excess NH3 that was not captured by the first bottle, named
“recovery bottle”. For the MEC without aeration, a gas bag was used to collect the ammonia gas
from the cathode compartment.
9.2.1.2 FO setup and operation
A SEPA CF Cell (Sterlitech Corporation, Kent, WA, USA) was used as an FO cell. The FO
membrane was cellulose triacetate (Hydration Technologies Inc., Albany, OR) and was installed

180
in the FO cell with its active layer toward the feed solution. During operation, both the feed
solution (treated landfill leachate) and the draw solution (ammonium bicarbonate) were
recirculated at 125 mL min-1. The water flux (L m-2 h-1, LMH) was calculated by the change of
weight of the feed or draw solution (Wang et al. 2010a). The reverse salt flux (g m-2 h-1, gMH)
from the draw side to the feed side was calculated by measuring the salt concentration change in
the feed solution (Wang et al. 2010a).
9.2.2 Landfill leachate
Landfill leachate was collected from a landfill site (Waverly, VA, USA) and kept at 4 °C prior to
use. The leachate was used as collected for all experiments without pH adjustments, addition of
nutrients/trace metals, or dilution. The characterization of the landfill leachate is summarized in
Table 9.1. The landfill leachate contained a high COD concentration of 9,175 mg L-1. The average
NH4+-N concentration was 4,540 mg L-1 while the concentrations of nitrite and nitrate in landfill
leachate were below the detection limit of IC (0.125 mg L-1). The pH of the leachate sample was
7.94, which corresponded to an alkaline environment at the methanogenic phase of decomposition
(Greenman et al. 2009). The conductivity was high at 28.1 mS cm-1 due to the high levels of
inorganic ions in the samples (Na+, Cl-, Mg2+ etc.). A variety of heavy metals (Cu, Zn, Ni, Sr, Mo,
Co, etc.) were also detected though at low concentrations. The leachate showed a dark brown-
reddish color, which may be attributed to the presence of dissolved organic matter (e.g., humic
acid and fulvic acid) (Baun and Christensen 2004, Shouliang et al. 2008).

181
Table 9.1 Chemical characteristics of the landfill leachate used in this study.
Parameters Values Unit
pH 7.94
Conductivity 28.1 mS cm-1
COD 9,175 mg L-1
NH4+-N 4,540 mg L-1
Na 3,342 mg L-1
K 1,299 mg L-1
Cl 5,184 mg L-1
Mg 130.8 mg L-1
Si 60.9 mg L-1
P 16.4 mg L-1
Ca 72.5 mg L-1
Fe 23.8 mg L-1
Cu 0.8 mg L-1
Ni 0.2 mg L-1
Zn 0.7 mg L-1
9.2.3 Measurement and analysis
The voltage across the external resistance in the MEC was recorded every 2 min by a digital
multimeter (2700, Keithley Instruments Inc., Cleveland, OH, USA). The pH of the liquid stream
was measured by a benchtop pH meter (Oakton Instruments, Vernon Hills, IL, USA). Conductivity
was measured with a benchtop conductivity meter (Mettler-Toledo, Columbus, OH, USA). The
COD concentration was measured using a colorimeter (Hach DR/890, Hach Company, Loveland,
CO, USA). The concentration of ammonium was measured using an ISE meter (Accumet AB250,
Fisher Scientific, Pittsburgh, PA, USA). Ion concentrations were quantified by using ion
chromatography (Dionex LC20 ion chromatograph, Sunnyvale, CA, U.S.A.) equipped with an
ED40 eletrochemical detector and inductively coupled plasma - mass spectrometry (Thermo
Electron X-Series ICPMS, Waltham, MA, U.S.A.). The concentration of CO2 in the MEC outlet
gas was quantified by a Shimadzu GC-14A gas chromatograph equipped with a thermal
conductivity meter (TCD). The analysis of electrochemical impedance spectroscopy (EIS) of the
FO membrane was conducted with a potentiostat (Reference 600, Gamry Instruments, Warminster,

182
PA, USA) according to a previous study (Ge et al. 2013b). The efficiency of organic-to-electricity
was expressed by Coulombic recovery (CR) and Coulombic efficiency (CE), calculated as (Ge et
al. 2013b):
𝐶𝑅 =𝑄𝑜𝑢𝑡𝑝𝑢𝑡
𝑄𝑖𝑛𝑝𝑢𝑡−𝑡=
∑ 𝐼(𝐴)𝑡(𝑠)
96485(𝐶
𝑚𝑜𝑙 𝑒−) × 𝐶𝑂𝐷𝑡𝑜𝑡𝑎𝑙(𝑚𝑜𝑙) × 4(𝑚𝑜𝑙 𝑒−
𝑚𝑜𝑙 𝑂2)
𝐶𝐸 =𝑄𝑜𝑢𝑡𝑝𝑢𝑡
𝑄𝑖𝑛𝑝𝑢𝑡=
∑ 𝐼(𝐴)𝑡(𝑠)
96485(𝐶
𝑚𝑜𝑙 𝑒−) × 𝐶𝑂𝐷𝑟𝑒𝑚𝑜𝑣𝑒𝑑(𝑚𝑜𝑙) × 4(𝑚𝑜𝑙 𝑒−
𝑚𝑜𝑙 𝑂2)
where Qoutput is the produced charge, Qinput-t is the total charge available in the added organic
compounds, Qinput is the total charge available in the removed organic compounds, I is electric
current and t is the time. CODtotal is the total COD in the anolyte in the period of time t, and
calculated based on the input COD concentration and the remaining COD from last cycle.
CODremoved is the removed COD within time t.
9.3 Results and Discussion
9.3.1 MEC performance
The MEC performance was evaluated with the leachate sample under two modes, aeration in the
cathode (oxygen reduction) and no aeration (hydrogen evolution). In the presence of aeration,
oxygen would act as an electron acceptor and the air flow in the cathode compartment could also
promote the stripping of ammonia out of the catholyte. In the absence of aeration, protons could
be reduced to hydrogen gas. Both reactions can accumulate hydroxyl ions and thus elevate the pH,
which would facilitate the conversion of ammonium ion to ammonia gas.
183
Electricity generation in the MEC exhibited similar performance regardless of aeration (Figure
9.2A). The maximum current density with aeration was 0.72 ± 0.06 A m-2, similar to 0.70 ± 0.12
A m-2 in the absence of aeration (p>0.05). The MEC with aeration generated the total coulomb of
4,274 ± 500 C in each batch cycle, which is not significantly different from 3791 ± 583 C in the
absence of aeration (p>0.05). The current generation was relatively stable under both modes but
the COD concentration in the MEC effluent increased and thus the COD removal efficiency
decreased with time. With aeration, the effluent COD was 4,440 mg L-1 from the first batch and
gradually increased to 5,910 mg L-1 after 6 batches. Likewise, the effluent COD increased from
4,440 to 8,610 mg L-1 after 5 batches without aeration. This suggests that microbial ability of
organic degradation was possibly impaired during operation, likely related to the accumulation of
salt ions that will be discussed in the following section. Although the Coulombic efficiency
increased from 29.87 % to 46.89 % (aeration) or from 37.61 % to 110.40 % (no aeration), mostly
because of the amount of the removed COD decreased , the Coulombic recovery of the MEC was
fairly stable at 15.45 ± 1.80 % (aeration) or 13.70 ± 2.11 % (no aeration) (Figure 9.2B).
The pH of the MEC anode effluent was around 7, indicating that the landfill leachate had high
buffering capacity. The catholyte pH remained stable around 10 in both operation modes. The
conductivity of both the anolyte and the catholyte increased with operation (Figure 9.2C), because
of different reasons: the anolyte conductivity increased probably due to the accumulation of ions,
while the catholyte conductivity increased because of the ion transportation from the anolyte across
the CEM.

184
Figure 9.2 The MEC performance fed with and without aeration: (A) current generation;
(B) average effluent COD and Coulumbic recovery (CR); and (C) the MEC effluent
conductivity.
The MEC effectively decreased the concentration of ammonium in the leachate. When aeration
was applied, the anode effluent contained ammonium nitrogen of 1,012 ± 109 mg L-1 (Figure 9.3A)
representing a removal efficiency of 65.7 ± 9.1 %. Meanwhile, the catholyte had an ammonium
concentration of 611 ± 66 mg L-1, resulting from ammonium migration from the anolyte. The

185
stripped ammonia was collected in the absorption bottle, in which the ammonium concentration
increased gradually to 0.77 mol L-1 after 6 batch cycles. When there was no aeration (the solutions
in both anode and cathode compartments were refilled with new solutions before the test), it was
observed that the ammonium concentration in both compartments increased with operation
batches: the ammonium concentration in the anode effluent increased from 889 mg L-1 (1st batch
) to 1,548 mg L-1 (5th batch) (Figure 9.3B), corresponding to a decrease in ammonium removal
efficiency from 68.1 to 47.2%; the ammonium concentration in the catholyte increased from 840
mg L-1 (1st batch) to 8,202 mg L-1 (5th batch). The inserts in Figure 9.3A and Figure 9.3B indicated
that the MEC with aeration achieved higher ammonium removal efficiency and more stable
performance than that without aeration. In the absence of aeration, 88.9% of the input ammonium
stayed in the solution (anode effluent and the catholyte) after 5 batch cycles. The anolyte pH was
around 7, which allowed ammonium nitrogen existing as NH4+. In the catholyte, the pH was around
10, and thus 85% of the ammonium nitrogen was present as ammonia (NH3) (Koelliker and Kissel
1988). The ammonia gas was dissolved in the catholyte due to its high solubility in aqueous
solution. The membrane uptake for ammonium ion could be neglected because membrane sites
were mostly occupied by Na+ in the CEM. Although 11.1% of the ammonium nitrogen might have
been converted to ammonia gas, the collection of ammonia gas was not successful in the absence
of aeration, likely related to the low stripping effect. Even when the catholyte pH was adjusted to
12 or 12.6 at the beginning of the 4th or the 5th batch, the ammonium concentration in the catholyte
was not obviously affected and the catholyte pH decreased to around 10 rapidly. After the 5th batch,
the aeration was put back in the cathode chamber without replacement of either the anolyte or the
catholyte: the current generation increased dramatically to 0.89 A m-2 and then decreased gradually
to 0.31 A m-2 in 2 days (Figure 9.3C). With aeration, the cathode reaction changed from hydrogen

186
evolution (-0.41 V vs. SHE) to oxygen reduction (0.82 V vs. SHE), and the higher reaction potential
for the reduction of oxygen increased the cell voltage, as well as the current generation. The
aeration helped strip out the ammonia gas from the catholyte and thus facilitated further removal
of ammonium from the anode.
In addition to ammonium, the compounds such as metal ions and organics could also migrate from
the anolyte into the catholyte across the CEM. The concentrations of several major inorganic ions
were monitored in the effluents from the 3rd and the 5th batches (Figure 9.4). Sodium and potassium
Figure 9.3 Ammonium recovery in the MEC: (A) ammonium concentration
with aeration; (B) (A) ammonium concentration without aeration; and (C)
the current generation when aeration was put back to the MEC. The insets
in (A) and (B) show the NH4+-N removal efficiency.

187
ions were the dominant cations in both electrolytes while chloride ions were the major anions. The
other ions exhibited concentrations lower than 100 mg L-1. In the MEC with aeration, the removal
efficiency for K+, Na+ and Cl- was 16.1%, 44.7%, and 49.1% in the 3rd batch, and 9.4%, 25.2%,
and 40.4% in the 5th batch, respectively. The lower removal efficiency in 5th batch was likely
resulted from the ion accumulation in the catholyte, for example the Na+ concentration rose from
449 mg L-1 in the 3rd batch to 950 mg L-1 in the 5th batch, which created a concentration gradient
against further migration. The removal efficiency of ions is determined by its concentration and
mobility (Ping et al. 2015). The high concentration and high mobility of K+, Na+ and Cl- led to
stronger ion migration or diffusion across the membrane, resulting in a higher salinity in the
catholyte, which could decrease the catholyte resistance and benefit the current generation. It was
observed that more K+ and Na+ ions were transported across the CEM when there was no aeration,
and this was probably related to the lower ammonium transportation under the same condition. Ion
transport from the anolyte into the catholyte indicates that MECs may also remove other
compounds than ammonium; however, because of nonvolatile feature of those ions, their
accumulation in the cathode requires further treatment or periodic replacement of the concentrated
solution.

188
Figure 9.4 The concentrations of the major ions in the MEC with aeration and without
aeration (A) in the anolyte from the 3rd batch; (B) in the catholyte from the 3rd batch; (C) in
the anolyte from the 5th batch; and (D) in the catholyte from the 5th batch.
After 6 batch cycles, the catholyte exhibited a dark yellow color but continued to be clear. The
iron concentration in the catholyte was lower than 0.5 mg L-1 under both operation modes, which
was insufficient to cause the observed color. It was found about 22% of the total organic carbon
(TOC) was humic acid, which seems to be a plausible cause of the yellow color (Shouliang et al.
2008). However, after all the humic acid was precipitated out, the yellow color still existed.
Therefore, the cause of the yellow color could also be related to other dissolved organic matter
such as fulvic acid, and further investigation will be needed to understand the transportation of
dissolved organic matter (DOM) across the CEM.

189
9.3.2 FO performance
Water recovery in the FO was examined with either the raw leachate or the MEC treated leachate,
and the prepared ammonium bicarbonate was used as a draw solute. With 1 M ammonium
bicarbonate solution as the draw solution, the FO achieved a maximum water flux of 3.3 ± 0.2
LMH with the treated leachate (Figure 9.5A), which decreased to 0.6 ± 0.1 LMH after 3.5-h
operation, and as a result, 26.2 ± 1.3 % of the treated leachate was extracted into the draw side.
The water flux from the raw leachate was much lower, and the maximum water flux was 1.4 LMH
(Fig. 5A), resulting in only 12.3% of the leachate volume extracted into the draw chamber. The
greater water flux from the treated leachate benefitted from a lower salt content than the raw (17.4
vs. 28.1 mS cm-1), and thus a greater osmotic gradient was created. This indicated that the MEC
treatment could improve the FO performance. The FO treatment extracted water and also
concentrated the ions in the feed solution (leachate). For example, the ammonium concentration
in the feed solution increased from 1,030 ± 140 to 7,600 ± 300 mg L-1. Reverse flux of ammonium
from the draw side into the feed side could also increase the ammonium concentration. When the
different concentrations of ammonium bicarbonate were used for draw solution (1 M, 2 M and 4
M), the reverse salt flux was 11.4 ± 1.4, 20.4 ± 1.4, 33.3 ± 2.5 gMH, respectively (Figure 9.5B).
The reverse fluxed ammonium could be a concern for further treatment of the treated leachate, and
it has been demonstrated that anammox may be used to remove the reverse-fluxed ammonium and
thus alleviate the decline of water flux (Li et al. 2015). When 2 M NH4HCO3 was used as draw
solution, 51% water recovery from the MEC effluent was achieved in 3.5-h operation. A higher
NH4HCO3 concentration of 4 M reduced the operating time to 2 h for achieving 50% water
recovery, and a longer operating time of 3.5 h could extract 74% of the water in the leachate
sample.

190
Figure 9.5 The FO performance fed with the treated leachate: (A) water flux with 1 M
NH4HCO3 as draw solution; (B) reverse salt flux with different NH4HCO3 concentrations;
and (C) EIS for new and used FO membranes. The inset in (C) shows the water flux with 0.5
M NH4HCO3 as draw solution for new and used FO membranes.
After 4-month experiment, the FO membrane was examined by measuring the water flux with DI
water as the feed solution and 0.5 M NH4HCO3 as the draw solution. For comparison, a new FO
membrane was tested, too. As shown in the insert of Fig. 5C, the maximum water flux of the new

191
FO membrane was 6.0 LMH, about 2.7 times higher than that of the used FO membrane (2.2
LMH), indicating that the membrane fouling decreased the water flux. To further understand the
change in the FO membrane, the membrane resistance was measured by using EIS with 30 g L-1
NaCl solution as electrolyte. Figure 9.5C showed the impedance spectra for new and used FO
membranes The measured EIS can be fit by an equivalent circuit according to a previous study
(Gao et al. 2013). The first intersection of the Nyquist plot and the x-axis represents the solution
+ membrane resistance. The new FO membrane had the solution + membrane resistance of 14.79
Ω, slightly lower than 16.30 Ω from the used FO membrane. Because the bulk solution (without
FO membrane) had a solution resistance of 13.50 Ω, the membrane resistance could be estimated
as 1.29 Ω for the new FO membrane or 2.80 Ω for the used FO membrane, and the increase in
membrane resistance of the used FO membrane was due to fouling. The charge transfer resistance
was 1.75 Ω for new FO membrane and 1.18 Ω for used FO membrane, indicating that ion (e.g.,
Na+) flux could increase when FO membrane is subjected to fouling (She et al. 2012).
9.3.3 The MEC-FO system
When the MEC was linked to the FO unit, the MEC anode effluent (treated leachate) was fed to
the FO feed side and the concentrated feed solution was returned to the MEC anode mixed with
raw leachate (~1:1). This mixture had a COD of 11,200 ± 1,400 mg L-1. As shown in Figure 9.6A,
the maximum current density decreased from 0.76 A m-2 to 0.41 A m-2 after 3 batch cycles. In
addition, the COD removal efficiency decreased from 40.3% to 32.9%, probably related to the salt
accumulation in the anolyte: after 3 batches, the Na, Cl and K concentrations in the MEC anolyte
reached 5,080 mg L-1, 3,067 mg L-1, and 1,846 mg L-1, respectively. The high salt concentration

192
(higher than 100 mM) could adversely affect the physiology of anaerobic microbial consortia
(Lefebvre et al. 2012, Rousseau et al. 2013).
Figure 9.6 The MEC-FO system performance: (A) current generation; and (B) NH4+-N
distribution during 3 batch cycles.
The MEC removed 63.7 ± 6.6 % of ammonium in the mixture, and an ammonium mass balance
suggested that 36.2 ± 6.6 % of ammonium stayed in the anolyte, 9.9 ± 2.0 % was present in the
catholyte and 53.8 ± 5.5 % was stripped out as ammonia gas (Figure 9.6B). The ammonium
concentration in anolyte effluent increased from 1,400 mg L-1 to 2,900 mg L-1 during 3 batch
cycles, which was due to high ammonium input from the FO returning solution. During the FO
process, a large amount of ammonium moved across the FO membrane from the draw side into
193
the feed side due to reverse salt flux. The ammonium concentration in the concentrated feed
solution was 7,800 ± 1,600 mg L-1, in which 57.8 ± 2.3 % was attributed to the reverse salt flux.
After the mix with raw leachate, the ammonium concentration decreased to 6,100 ± 800 mg L-1.
The concentration of Na+, K+ and Cl- in the diluted draw solution was 101, 49 and 93 mg L-1,
respectively, representing salt rejection of 95.8%, 94.6% and 97.8%. No COD was detected in the
FO draw effluent.
In the MEC with aeration, the energy input was 5.0 kWh m-3 treated water (1.3 kWh kg-1 COD, or
8.5 kWh kg-1 N), among which 64.4% was consumed by the external power supply, 13.0% was
due to the aeration in the cathode, and 22.6% was consumed by the anolyte recirculation. In the
MEC without aeration, the energy input was 5.3 kWh m-3 treated water (1.8 kWh kg-1 COD, or 9.7
kWh kg-1 N). The hydrogen gas was not successfully collected in the MEC without aeration, so
the energy consumption was high. In FO process, the energy input was 0.1 kWh m-3 treated water,
which was much lower than that for MEC. In the future study, the performance of MFC-FO system
will be explored.
The MEC-FO system can be effective for organic removal, nutrient recovery and clean water
recovery from leachate. However, there are challenges when the concentrated solution from the
FO is returned to the MEC anode. This returned solution increases the concentration of both ions
and recalcitrant organic compounds, which make it difficult in the successive treatment. A
potential solution for addressing this issue is to introduce pretreatment before the MEC treatment.
A proper pretreatment method can improve biodegradability of leachate and thus current
generation in the MEC. Higher current output will promote ammonium transport and increase

194
ammonium recovery. More ions will also be moved into the cathode of the MEC, thereby
alleviating the adverse effects of ion concentrating in the FO and its returning solution. It should
be noted that, because ions other than ammonium will be only concentrating in the solution (either
the anolyte or the catholyte), periodical replacement of the concentrating solution will be
necessary, and the frequency of such replacement will need to be determined experimentally.
9.4 Conclusions
This study has furthered the development of an MEC-FO system through examining its
performance with actual landfill leachate. The system could effectively generate electricity and
recover ammonia. The recovered ammonia was successfully used as a draw solute in the following
FO process for water recovery. Aeration in the MEC cathode was found to be necessary for
ammonia collection. More water could be covered from the MEC treated leachate than from the
raw leachate, because of the reduced salinity. This system has a potential for resource recovery
from wastes, and will be investigated for further improvement through pretreatment.

195
Chapter 10 Nanoparticulate Ni (OH)2 films synthesized from macrocyclic
nickel (II) Cyclam for hydrogen production in microbial electrolysis cells
(This section has been published as Qin, M., Maza, W. A. (co-first author), Stratakes, B. M.,
Ahrenholtz, S. R., Morris, A. J., & He, Z. (2016). Nanoparticulate Ni (OH)2 films synthesized
from macrocyclic nickel (II) Cyclam for hydrogen production in microbial electrolysis
cells. Journal of the Electrochemical Society, 163(5), F437-F442.)
Abstract
Hydrogen production in microbial electrolysis cells (MECs) is a promising approach for energy
harvesting from wastewater. The kinetic barriers toward proton reduction necessitate the use of
catalysts to drive hydrogen formation at appreciable rates and low applied potentials. Towards this
end, cost effective alternatives to platinum catalysts are of paramount interest. In this study,
Ni(OH)2 films were synthesized by electrophoretic deposition from a Ni(II)cyclam precursor
solution at varying concentrations (6 mM, 15 mM, and 23 mM). The films were characterized by
scanning electron microscopy and X-ray photo-electron spectroscopy to confirm the deposition of
Ni(OH)2. The Ni(OH)2-modified electrodes were then examined by both traditional
electrochemical measurements and in an MEC for hydrogen production. Tafel analysis indicates
an exchange current density of ~0.36 mA cm-2 with a Tafel slope of ~120 mV decade-1 consistent
with a rate determining proton adsoprtion step. The hydrogen production rates increased with
increasing Ni(II)cyclam concentration in the precursor solution, with the 23 mM-derived film
exhibiting a rate comparable to that of a Pt-based catalyst in MEC tests.
196
10.1 Introduction
Hydrogen is considered to be one of the most promising energy carriers as an alternative fuel
because of its high energy density and availability from renewable sources. Over 90% of hydrogen
gas is produced by steam reforming and coal gasification, both of which are highly energy-
consuming processes (Manish and Banerjee 2008). Among the newly developed technologies for
hydrogen production, microbial electrolysis cells (MECs) are of special interest as a new approach
for hydrogen production from organic matter in wastewater and other organic waste (Logan et al.
2008a, Rozendal et al. 2006b). In an MEC, organic compounds are degraded by exoelectrogens
(electrochemically-active microorganisms), and as a result, electrons are passed to an anode
electrode. Hydrogen gas can be formed at the cathode (-0.414 V vs. SHE, standard hydrogen
electrode) by reducing protons. This process must be aided by an additional voltage (0.114 V in
theory) as a result of the insufficiency of the anode potential (e.g., -0.300 V vs. SHE when acetate
is used as an anode substrate) to drive proton reduction. In reality, an external voltage of more than
0.2 V is required to overcome the additional kinetic barriers imposed by the hydrogen formation
reaction (Kundu et al. 2013). This additional voltage is substantially lower than that needed for
electrochemical water splitting (theoretically 1.23 V vs. SHE (Liu et al. 2005)) making hydrogen
production energetically more cost efficient. In addition, recovery of valuable energy content from
wastewater/waste also results in environmental benefits.
Catalysts are indispensable in accomplishing the hydrogen evolution reaction (HER). Most MEC
studies have used platinum-based catalysts for HER catalysis. Platinum is a highly efficient
catalyst for HER, but its high cost obstructs its application in MECs, especially for large scale
systems that are designed for wastewater treatment (Kundu et al. 2013, Tartakovsky et al. 2009).

197
Thus, alternative catalysts have been explored such as Pd- (Huang et al. 2011), Fe- (Xiao et al.
2012), Mo-(Yuan et al. 2014), and Ni-based materials (Manuel et al. 2010). Among them, Ni-
containing nanoparticles are of special interest because of nickel’s low cost, abundance, low
overpotentials toward proton reduction, and high stability in solutions, which are usually alkaline
in the MEC cathode (Kundu et al. 2013, Selembo et al. 2009). For example, a cathode catalyst was
developed by electrodepositing NiMo onto a three-dimensional carbon-fiber-weaved cloth
material, and at an applied voltage of 0.6 V, the MECs achieved a hydrogen production rate of
0.09 m3 m−2 d−1 (m3 H2 per m2 cathode surface area per day) at a sustained current density of 12 A
m−2 (A per m2 cathode surface area) (Hu et al. 2009). The rate of hydrogen production by the NiMo-
modified carbon cloth was comparable to that of a Pt-modified carbon cloth (0.10 m3 m-2 d-1).
Commercially available nickel was also used as a catalyst coated on carbon cloth for MEC
cathodes (Selembo et al. 2010). Nickel oxide catalysts have also shown great promise as catalysts
for hydrogen evolution in MECs (Jeremiasse et al. 2010). Electrodeposition of nickel oxide onto
stainless steel and nickel alloy surfaces have been shown to improve the MEC hydrogen
production from 0.0002 m3 m-2 d-1 (no Ni oxide) to 0.019 m3 m-2 d-1 at a current density of 3.25 A
m−2 when a 0.9 V external voltage bias was applied (Selembo et al. 2009).
In this study, a nano-Ni(OH)2 modified cathode was developed by electrodeposition from a
nickel(II) cyclam (cyclam = 1, 4, 8, 11-tetraazacyclotetradecane) precursor. The synthetic method
was based on a procedure of the deposition of Ni(OH)2 using [Ni(en = ethylene diamine)3]Cl2 ,
resulting in homogeneous, well adhered Ni(OH)2 thin film (Selembo et al. 2010, Singh et al. 2013).
The [Ni(en)3]Cl2-derived Ni(OH)2 films were shown to exhibit significantly higher catalytic
activity towards water oxidation than films derived from [Ni(OH2)6]2+ solutions under similar

198
conditions (Singh et al. 2013). The morphology and composition of the films generated here were
investigated via scanning electron microscope (SEM) and X-ray photoelectron spectroscopy
(XPS). The catalytic activity toward hydrogen production was examined through electrochemical
techniques and in an MEC.
10.2 Materials and Methods
Materials — Reagents or analytical grade chemicals were sourced from commercial suppliers and
used as received unless stated otherwise. Deionized water was used throughout the study.
Synthesis procedure— Ni(II)cyclam was prepared by refluxing equimolar Nickel(II) chloride
hexahydrate (99.3 %, Alfa Aesar) and 1,4,8,11-tetraazacyclotetradecane (> 95 %, Ark Pharm Inc)
in DMF (99.8 % spectrophotochemical grade, Spectrum) at 90 C for 12 hours. The purple
precipitate was filtered and washed with a copious amount of DMF to remove any excess Ni(II)Cl2
6H2O and then allowed to dry. This method differs slightly from typical synthetic approaches in
which equimolar amounts of Ni(II)Cl2 and the tetraazacyclotetradecane are dissolved in methanol
or ethanol and the product separated by addition of ether (Bosnich et al. 1965, Voelcker et al.
2008). Our approach affords a precipitated product in nearly quantitative yields.
The Ni(OH)x films were electrodeposited onto carbon cloth (PANEX 30PW03, Zoltek
Corporation, St. Louis, MO, USA) with an area of 4 cm2 (2cm × 2cm) by dissolving the
Ni(II)cylcam precursor in a solution of 0.1 M NaOH. The potential was then cycled between 0 V
and 1.3 V (vs Ag/AgCl) for 150 cycles. A three electrode arrangement was employed using the
carbon cloth as the working electrode, a platinum mesh counter electrode, and Ag/AgCl (sat. KCl)

199
as the reference electrode. The electrodeposition was carried out in a one-compartment
electrochemical cell under aerobic conditions at room temperature. The procedure employed was
similar to that used by Singh, et. al. for the deposition of Ni(OH)x films onto glassy carbon
electrodes and fluorine doped tin oxide electrodes from Ni(NH3)6, Ni(OH2)6, Ni(en)3 (en = 1,2-
diaminoethane), and other Ni(II) amine molecular precursors (Singh et al. 2013). The
nomenclature of nano-scaled Ni(OH)2 represents the nickel hydroxide prepared with X mM Ni(II)
cyclam as the precursor where X could be 6, 15, and 23.
Characterization — LEO (Zeiss) 1550 field emission scanning electron microscope (FESEM)
operating at an acceleration voltage of 300 KV was employed to study the morphology and
structural properties of the nanoparticulate films. FEI Quanta 600 FEG environmental scanning
electron microscope (ESEM) with Bruker energy-dispersive X-ray spectroscopy (EDS) was used
to analyze the elemental composition of the catalyst. XPS was conducted using a PHI 5300
spectrometer with a Perkin-Elmer Dual Anode X-ray source operating with monochromatic Mg
Kα radiation (hν 1253.6 eV) at 13 kV and 250 W and a pass energy of 17.9 eV. A step size of 0.1
eV was used and 256 sweeps were averaged for all measurements. The photoelectrons emitted
were detected by a hemispherical analyzer. Operating pressure in the sampling chamber was below
1 x 10⁻⁷ Torr. The spectral range for Ni 2p was 894-844 eV, N 1s was 410-390 eV, and O 1s 545-
525 eV. The spectra were calibrated according to the C 1s peak at 284.6 eV.
Electrochemical analysis — The synthesized catalysts were coated onto a piece of rectangular
carbon cloth (PANEX 30PW03, Zoltek Corporation, St.Louis, MO, USA) with an area of 4 cm2
(2cm × 2cm), which was used as a cathode electrode. A cathode coated with 0.5 mg cm-2 Pt/C
200
(10% wt. Platinum on Carbon Vulcan, Fuel Cell Earth LLC, Wakefield, Ma, USA) was prepared
and served as a control.
Tafel plots (scan rate 1 mV s-1) were prepared with chronoamperametric data obtained on a
potentiostat (Reference600, Gamry Instruments, Warminster, PA, USA). Electrochemical
experiments were conducted using a three-electrode arrangement in a PBS (1M, 120 mL)
electrolyte solution. The modified cathode electrodes served as a working electrode, a platinum
wire served as the counter electrode, and an Ag/AgCl electrode (CH Instruments, Inc., Austin, TX,
USA) was used as a reference electrode. The electrochemical cell was sparged with nitrogen gas
for 15 min prior to each test.
MEC setup and operation — A two-chamber MEC (Figure 10.1) was built by connecting two
glass bottles with a cation exchange membrane (CEM) as separator (UltexCMI7000, Membranes
International, Inc., GlenRock, NJ, USA), according to a previous study (Yuan et al. 2014). The
liquid volume of the anodic chamber and the cathodic chamber was 130 and 140 mL, respectively.
The anode electrode was a carbon brush (Gordon Brush Mfg.Co., Inc., Commerce, CA, USA)
which had been cultivated under a microbial fuel cell mode for three months. The anolyte
contained (per liter of DI water): sodium acetate (1 g), NaCl (1 g), MgSO4 (0.015 g), CaCl2 (0.02
g), KH2PO4 (0.53 g), K2HPO4 (1.07 g), NaHCO3 (1 g), and trace element (1 mL) (Angenent and
Sung 2001). PBS (1 M, KH2PO4 (53 g/L), K2HPO4 (107 g/L)) solution was used as a catholyte.
An external voltage of 0.8 V was applied to the circuit by a power supply (CSI3644A, Circuit
Specialists, Inc., Mesa, AZ, USA) according to a previous study (Yossan et al. 2013). The MEC

201
was operated under a batch mode with an HRT of 30 h. In each cycle, part of the anolyte (60 mL)
and the whole catholyte (140 mL) were replaced.
The voltage across resistor was recorded with a digital multimeter (2700, Keithley Instruments,
Inc., Cleveland, OH, USA) with a time interval of 5 min. Current was calculated by Ohm’s law.
Hydrogen production in the MEC was collected by water displacement and measured with a
syringe. Chemical oxygen demand (COD) was measured with a DR/890 colorimeter (HACH Co.,
Ltd., USA) according to the manufacturer’s instructions. The content of H2 was analyzed using a
Shimadzu GC-14A gas chromatograph equipped with a thermal conductivity detector (TCD).
Calculation — Coulombic efficiency, cathodic hydrogen recovery, overall hydrogen recovery and
hydrogen production rates were used to evaluate reactor performance (Logan et al. 2008a, Xiao et
al. 2012).
Figure 10.1 Schematic of an MEC
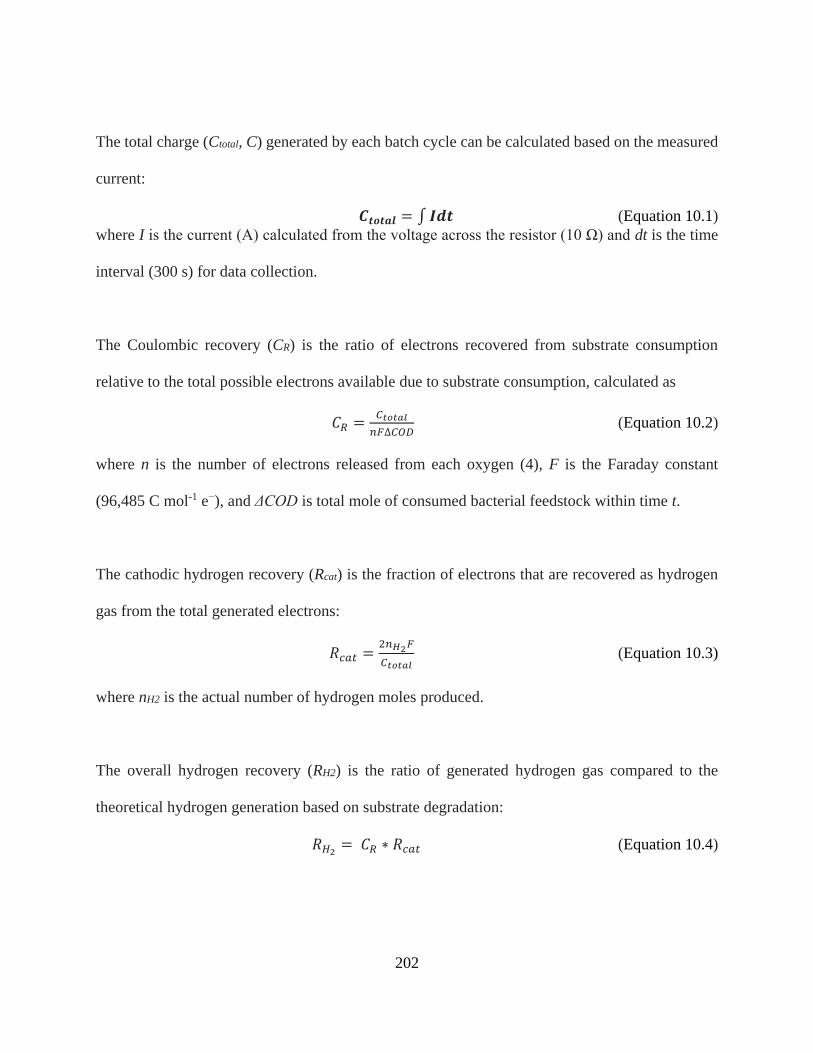
202
The total charge (Ctotal, C) generated by each batch cycle can be calculated based on the measured
current:
𝑪𝒕𝒐𝒕𝒂𝒍 = ∫ 𝑰𝒅𝒕 (Equation 10.1)
where I is the current (A) calculated from the voltage across the resistor (10 Ω) and dt is the time
interval (300 s) for data collection.
The Coulombic recovery (CR) is the ratio of electrons recovered from substrate consumption
relative to the total possible electrons available due to substrate consumption, calculated as
𝐶𝑅 =𝐶𝑡𝑜𝑡𝑎𝑙
𝑛𝐹∆𝐶𝑂𝐷 (Equation 10.2)
where n is the number of electrons released from each oxygen (4), F is the Faraday constant
(96,485 C mol-1 e−), and ΔCOD is total mole of consumed bacterial feedstock within time t.
The cathodic hydrogen recovery (Rcat) is the fraction of electrons that are recovered as hydrogen
gas from the total generated electrons:
𝑅𝑐𝑎𝑡 =2𝑛𝐻2𝐹
𝐶𝑡𝑜𝑡𝑎𝑙 (Equation 10.3)
where nH2 is the actual number of hydrogen moles produced.
The overall hydrogen recovery (RH2) is the ratio of generated hydrogen gas compared to the
theoretical hydrogen generation based on substrate degradation:
𝑅𝐻2= 𝐶𝑅 ∗ 𝑅𝑐𝑎𝑡 (Equation 10.4)

203
The hydrogen production rate (QH2, m3 H2 m-2 d-1) is calculated based on the generated hydrogen
gas (m3) per m2 cathode electrode per day.
10.3 Results and Discussion
Ni(II) catalyst electrodeposition and electrode preparation. — Cyclic voltammograms (CVs) of a
carbon felt electrode (CFE) in the presence of 23 mM Ni(II)cyclam in a solution of 0.1 M NaOH
are shown in Figure 10.2a. The CVs display an anodic peak at 410 mV (vs. Ag/AgCl) whose
current density increases with increasing potential sweeps. The increase in current density is
accompanied by a shift in the anodic peak to more negative potential up to 285 mV. The observed
current increase with respect to sweep number is attributed to the deposition of nanoparticulate
Ni(OH)2 species. This is consistent with literature reports of Ni(OH)2 deposition from soluble
molecular Ni(II) coordination complexes as pre-catalysts on glassy carbon (GCE) as well as
fluorine-doped tin oxide (FTO) electrodes in basic borate buffers and NaOH solutions (Singh et
al. 2013). The Ni(OH)2 has been proposed to form by a Ni―N de-ligation mechanism in the
presence of strongly coordinating basic groups (Singh et al. 2013).
A plot of the anodic peak current as a function of the sweep number displays a monotonic increase
in the concentration current density with a plateau at approximately 420 mA cm-2 M-1. Varying the
starting solution concentration of Ni(II)cyclam had little effect on the behavior of the
concentration-normalized current densities and value of the observed plateau, between 400 mA
cm-2 M-1 and 470 mA cm-2 M-1 (Figure 10.3). The steepness of the inflections differ significantly
B

204
in going from 6 mM Ni(II)cyclam to higher concentrations of Ni(II)cyclam, possibly suggesting a
concentration dependent mechanism of film formation.
For comparison, the electrodeposition of Ni(OH)2 films onto CFE from a Ni(II)Cl2·6H2O solution
was also carried out (Figure 10.2). The CV of Ni(II)Cl2·6H2O in 0.1 M NaOH displays cathodic
and anodic peaks at 520 mV and 440 mV, respectively. Upon continued sweeps the anodic peak
potential was observed to shift to slightly more positive potentials reaching a value of 460 mV
after 30 sweeps. Much like the electrodeposition from Ni(II)cyclam, nickel oxide formation from
Ni(II)Cl2 on the surface of the CFE (as evidenced by increasing the anodic peak current density)
Figure 10.2 (a) Cyclic voltammograms of Ni(II)cyclam (solid black line) and Ni(II)Cl2•6H2O
in an aqueous 0.1 M NaOH solution. The inset shows a closer view of the Ni(II)Cl2•6H2O
CV. (b) Comparison of the current densities corresponding to the electrodeposition of the
Ni(II) catalyst from the Ni(II)cyclam (black) and Ni(II)Cl2 solutions on the CFE as a
function of the number of potential sweep scans.

205
is monotonic as a function of increasing number of potential sweeps. Due to the poor solubility of
Ni(II)Cl2·6H2O in 0.1 M NaOH the effect of Ni(II)Cl2·6H2O concentration on Ni(OH)2 formation
and deposition could not be probed.
Cyclic voltammetry was performed on the Ni(OH)2 films on CFE and compared to Ni(II)cyclam
in anaerobic 0.1 M TBAPF6 solutions in CH3CN. At a scan rate of 25 mV s-1 the CV of the Ni(OH)2
film displays cathodic features at -0.785 V and -1.03 V with a anodic feature at -0.555 V (Figure
10.4). Similar cathodic features at -0.95 V and -1.22 V with an cathodic feature at -0.68 V were
Figure 10.3 (a) Cyclic voltammograms of 6 mM (solid black line), 15 mM (solid red line), and
23 mM (solid blue line) Ni(II)cyclam solutions in aqueous 0.1 M NaOH electrolyte. (b)
Comparison of the current densities corresponding to the electrodeposition of the Ni(II) catalyst
from the 6 mmm (black circles), 15 mM (red circles), and 23 mM (blue circles) Ni(II)cyclam
solutions on the CFE as a function of the number of potential sweep scans. These are compared
to each other by dividing the current densities by the concentration of Ni(II) cyclam at the start
of the deposition.

206
observed in the CV of Ni(II)cyclam at 25 mV s-1. The origin of these features are, as of yet,
uncertain. They are, however, consistent with results observed for Ni(OH)2 films deposited from
other Ni(II)-amine coordination complexes (Singh et al. 2013). Their presence in the Ni(OH)2
films lead us to believe that they may be related to redox activity of Ni(OH)2 adsorbed on the
electrode surface that may have formed during polarization (Ding et al. 1997). It is important to
note that the reversible redox features observed with Ni(II)cyclam with E1/2 = 0.398 V and -1.61
V (vs Ag/AgCl) corresponding to the Ni3+/2+ and Ni2+/+ redox couples, respectively, are not
observed in the Ni(OH)2 film (Beley et al. 1986, Jarzebińska et al. 1999, Zhalko-Titarenko et al.
1990, Zhang et al. 2014c).
Characterization of the nickel oxide films. — X-ray photoelectron spectroscopy was performed
for the films deposited on CFE from 6 mM, 15 mM, and 23 mM Ni(II)cyclam solutions in an
attempt to elucidate the nature of the films. The spectra corresponding to the Ni 2p3/2, N 1s, and O
1s electron binding energies are shown in Figure 10.5. The Ni 2p3/2 and O 1s spectra were
decomposed by non-linear least squares fitting using Gaussians where the peak positions and
1.5 1.0 0.5 0.0 -0.5 -1.0 -1.5 -2.0
-1
0
1
Potential (V)
Cu
rre
nt
De
ns
ity
(m
A c
m-1)
-50
0
50
100 Cu
rren
t De
ns
ity (
A c
m-1)
Figure 10.4 Cyclic voltammograms of a Ni(OH)2 film deposited on CFE (black – left y-
axis), carbon cloth (black dash – left y-axis), and Ni(II)cyclam in solution (red – right y-
axis, working electrode: glassy carbon) in anaerobic 0.1 M TBAPF6-CH3CN solutions
(scan rate 25 mV/s).

207
FWHM were allowed to vary. The Ni 2p3/2 and satellite signals for the 23 mM sample film were
adequately fit to a single Gaussian each centered at 858.5 eV and 864.3 eV, respectively, whereas
the observed O 1s signal was found to be comprised of two underlying Gaussians centered at 532.8
eV and 534.4 eV. The 6 mM and 15 mM samples display similar results with Ni 2p3/2 (satellite)
signals at 858.0 eV (863.9 eV) and 856.2 eV (862.2 eV), as well as O 1s signals at 532.9 eV (with
second component at 534.4 eV) and 531.4 eV, respectively.
Figure 10.5 X-ray photoelectron spectra of Ni 2p3/2 (top), N 1s (middle), and O 1s (bottom)
signals for films prepared from 6 mM, 15 mM, and 23 mM solutions of Ni(II)cyclam.
208
Based on the data above it is proposed that the films are Ni(OH)2 in nature (Singh et al. 2013).
XPS signals for Ni(OH)2 are typically 855 eV - 858 eV for the Ni 2p3/2 and 531 eV for the O 1s
binding energies, which are in agreement with the results found here (vide supra) (Dube et al.
1995, Grosvenor et al. 2006, Mcintyre and Cook 1975). The cause of the O 1s shift to near 533
eV is uncertain, but may be due to interactions between the Ni(OH)2 nanoparticles and oxygen
functional groups on the CFE that may form during the oxidative electrodeposition process under
basic conditions. These oxygen functional groups (i.e. carbonyls) on the surface of the CFE may
also explain the presence of the second band at 534 eV in the 6 mM and 23 mM preparations.
SEM (with EDS) was also employed to characterize the structure of Ni(OH)2 on carbon cloth.
Figure 10.6 shows the FESEM images of Ni(OH)2-coated carbon cloth substrates (Figure 10.6c-
f). For comparison, FESEM images of the unmodified cloth are also shown (Figure 10.6 a and b).
The carbon cloth is composed of large interweaved bunches of microfibers with a diameter of ~15
μm. The figure shows that the surface of unmodified carbon cloth is relatively rough over the size
of samples (not all shown here). The SEM images (Figure 10.6 D, e, and f) indicate the morphology
of the Ni(OH)2 nanostructures is comprised of a network of intergrown plates. The irregularity of
the orientations of the nano-plates suggest that the films may have large surface areas for reactivity.
This could open up new opportunities and applications for catalytic Ni(OH)2-based materials. The
Ni(OH)2 film prepared with 23 mM Ni(II)cyclam appeared denser when compared to the films
prepared with lower amounts of the precursor material, suggesting the potential of an increased
number of catalytic sites when making films with higher amounts of Ni(II)cyclam. Figure 10.8
presents the ESEM images and EDS spectrums of the unmodified carbon cloth and Ni(OH)2
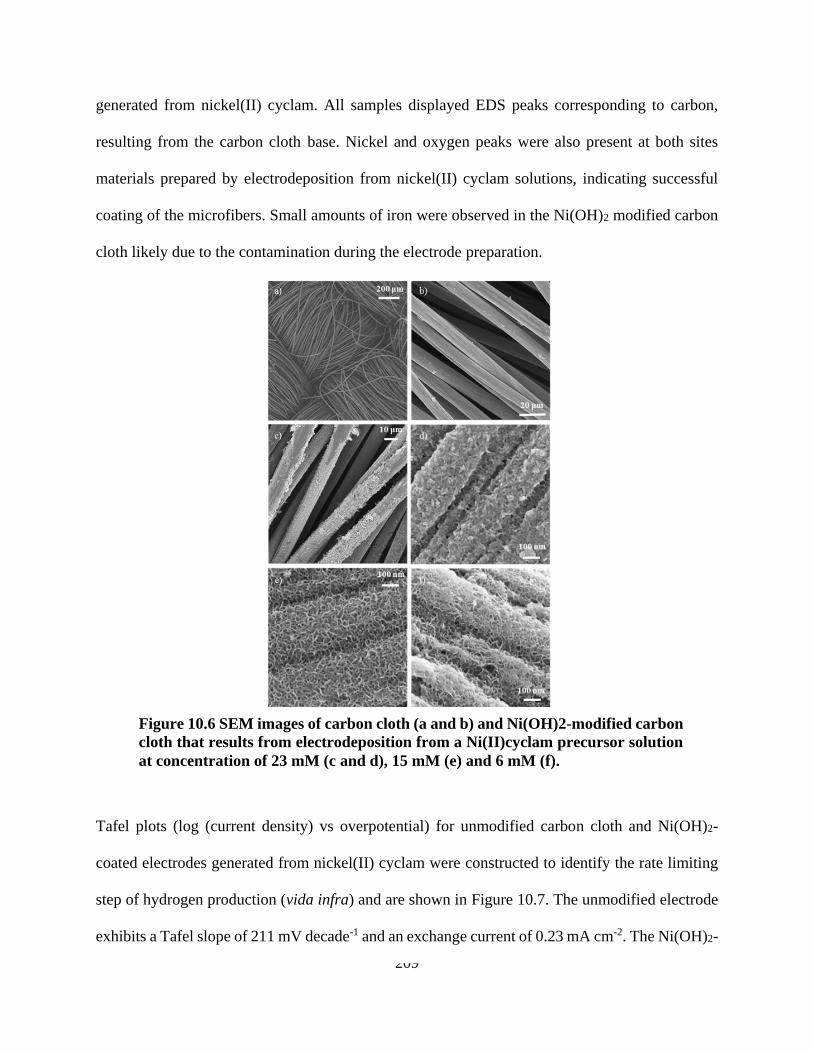
209
generated from nickel(II) cyclam. All samples displayed EDS peaks corresponding to carbon,
resulting from the carbon cloth base. Nickel and oxygen peaks were also present at both sites
materials prepared by electrodeposition from nickel(II) cyclam solutions, indicating successful
coating of the microfibers. Small amounts of iron were observed in the Ni(OH)2 modified carbon
cloth likely due to the contamination during the electrode preparation.
Tafel plots (log (current density) vs overpotential) for unmodified carbon cloth and Ni(OH)2-
coated electrodes generated from nickel(II) cyclam were constructed to identify the rate limiting
step of hydrogen production (vida infra) and are shown in Figure 10.7. The unmodified electrode
exhibits a Tafel slope of 211 mV decade-1 and an exchange current of 0.23 mA cm-2. The Ni(OH)2-
Figure 10.6 SEM images of carbon cloth (a and b) and Ni(OH)2-modified carbon
cloth that results from electrodeposition from a Ni(II)cyclam precursor solution
at concentration of 23 mM (c and d), 15 mM (e) and 6 mM (f).

210
coated electrodes generated from Ni(II)Cl2·6H2O showed a Tafel slope of 201 mV decade-1.
Comparatively, the Tafel analysis of Ni(OH)2-modified electrodes generated from nickel(II)
cyclam precursor solutions exhibited Tafel slopes of 105, 123, 129 mV decade-1 when the
nickel(II) cyclam concentration in the deposition solution were 23, 15, and 6 mM, respectively.
The exchange current was 0.34, 0.36, and 0.36 mA cm-2, respectively.
Figure 10.7 a. Tafel slope for carbon cloth (green), Ni(OH)2 -6 mM precursor (navy), Ni(OH)2
-15 mM precursor (red) and Ni(OH)2 -23 mM precursor (black) with a scan rate of 1 mV s-1
measured in PBS buffer (1 M). b-d. CV in the region of 0.1-0.2 V vs. RHE plotted against
scan rate and linear regression for the Cdl estimation with 23mM, 15 mM and 6 mM
Ni(II)cyclam. Scan rate: 130 mV/s (orange), 100 mV/s (blue), 80 mV/s (navy), 50 mV/s
(green), 30 mV/s (black), and 10 mV/s (red).
The hydrogen evolution reaction (HER) involves three steps: the Volmer (1), Heyrovsky (2), and
Tafel (3) reactions, which involve adsorption of a reduced proton on a surface and chemical
recombination to produce H2 as outlined in equations 1 to 3.

211
𝐻3𝑂+ + 𝑒− → 𝐻𝑎𝑑𝑠 + 𝐻2𝑂 (1)
𝐻𝑎𝑑𝑠 + 𝐻3𝑂+ + 𝑒− → 𝐻2 + 𝐻2𝑂 (2)
2𝐻𝑎𝑑𝑠 → 𝐻2 (3)
The expected Tafel slopes for a Volmer, Hyrovsky, or Tafel rate-determining reaction are 120 mV
dec-1, 40 mV dec-1, and 30 mV dec-1 respectively. Considering the observed Tafel slope of 120
mV decade-1, the rate-determining HER step for the Ni(OH)2 films prepared here is most likely
the adsorption related reaction (Volmer).
The active catalytic area was estimated through determination of the electrochemical surface area
(ECSA) (Figure 10.7 b-d). The double layer capacitance (Cdl), which is expected to be linearly
proportional to the effective active surface area, can be determined through investigation of the
current response of the Ni(OH)2-modified electrodes in a potential region where no Faradaic
processes occur. For the Ni(OH)2-modified electrodes, the region of 0.1-0.2 V vs. RHE was used.
By plotting the non-Faradaic (charging) current vs. scan rate the Cdl was quantified. The Cdls for
the Ni(OH)2-modified electrodes were determined to be 2.77 ± 0.32 mF cm-2, 2.45 ± 0.25 mF cm-
2 and 1.70 ± 0.14 mF cm-2 for electrodes prepared in 23 mM, 15 mM and 6 mM Ni(II)cyclam
precursor solutions, respectively. The ECSA increased as the starting concentration of
Ni(II)cyclam in the electrodeposition reaction is increased. Assuming that the Cdl is directly
proportional to the active surface area, these results strongly suggest that a higher concentration of

212
Ni(II)cyclam precursor results in an increased density of catalytically active sites for hydrogen
evolution.
Figure 10.8 EDS spectrums of (a) unmodified carbon cloth, (b) Ni(OH)2 modified carbon
cloth. Pd and Au peaks results from the metal pre-treatment of the samples prior to SEM
collection.
Hydrogen production in an MEC — Hydrogen generation catalyzed by the developed nano-scale
Ni(OH)2 films was investigated in an MEC applying a 0.8 V external voltage. The typical batch-
profile current density is shown in Figure 10.9. In general, the decrease in current density observed
with operation time is related to substrate consumption. The results are summarized in Table 10.1.
Some salient points arise from the analysis of the MEC experiments. First, it is not surprising that
the total charge and Coulombic recovery observed for both the Ni(OH)2 film electrodes (regardless
of the method of preparation) and the Pt electrode are within statistical error of each other
considering these are dependent on the degree of feedstock consumption by the bacterial anodes.
It is noteworthy, then, that the hydrogen recovery efficiencies, Rcat, and overall hydrogen recovery
rates, QH2, for Pt (78.3 ± 1.9 % and 0.013 ± 0.001 m3 H2 m-2 d-1, respectively) and the Ni(OH)2
film prepared at a higher concentration of Ni(II)cyclam precursor (84.3 ± 3.3 % and 0.014 ± 0.002

213
m3 H2 m-2 d-1, respectively) are within statistical error. In addition, there is a noticeable difference
in the Rcat and QH2 between the Ni(OH)2 films prepared using NiCl2 (at saturating concentrations,
Rcat = 48.4 % and QH2 = 0.008 m3 H2 m-2 d-1) and Ni(II)cyclam at higher, though well below
saturating, concentrations (Rcat = 84.3 % and QH2 = 0.014 m3 H2 m-2 d-1). The later results are
consistent with a previous study (Selembo et al. 2009). Finally, there appears to be a linear
relationship between the Ni(II)cyclam precursor concentration and the Rcat and QH2, which is likely
related to an increase in the number of catalytic sites available with films prepared at higher
precursor concentration, as supported by the determination of the ESCA.
In summary, a method of preparing Ni(OH)2 films has been demonstrated here by electrophoretic
deposition from Ni(II)cyclam precursor solutions. The films prepared in this manner displayed
excellent performance for catalyzing HER for hydrogen production in MECs comparable to Pt. In
addition, the MECs employing the Ni(OH)2 catalyst exhibited stable hydrogen production for one
month, therefore, making these Ni-based materials stable electrodes in MECs.
Figure 10.9 Current density of the MEC with modified carbon cloth with Ni(OH)2 (23 mM
Ni(II)cyclam (black), 15 mM (green), and 6 mM (pink)), Ni(OH)2 from Ni(II)Cl2·6H2O
(orange) or Pt (red) and unmodified carbon cloth (blue) at an applied voltage of 0.8 V.
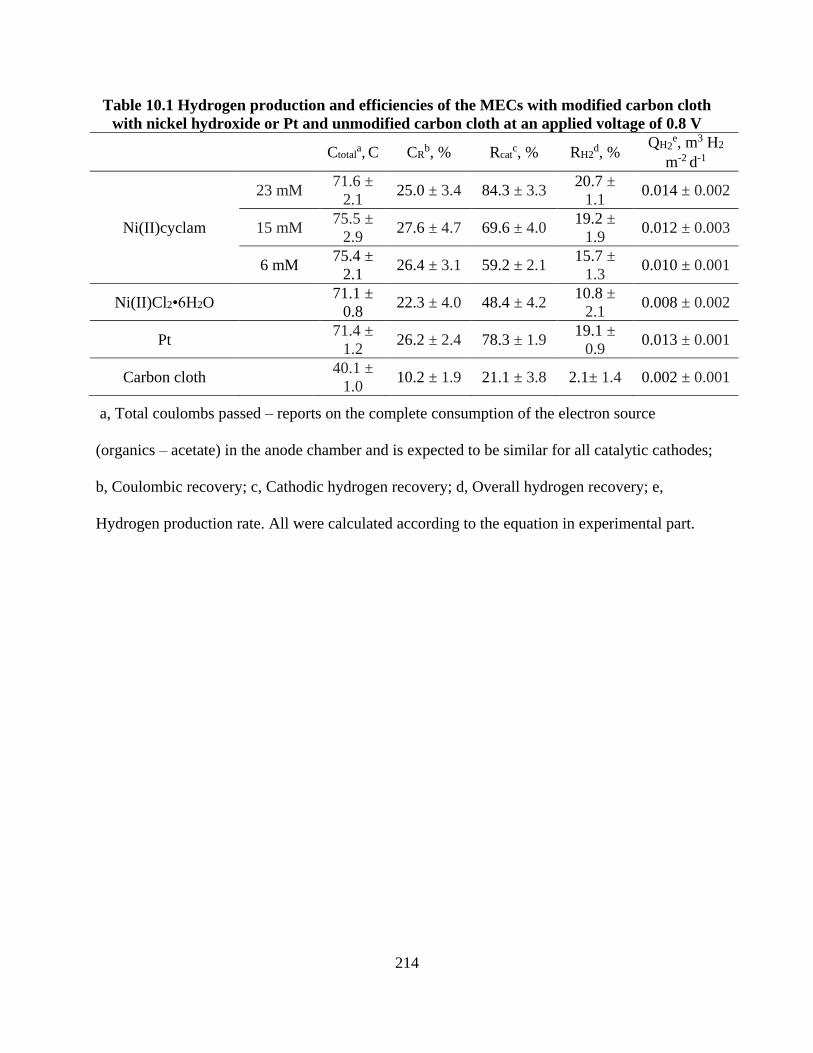
214
Table 10.1 Hydrogen production and efficiencies of the MECs with modified carbon cloth
with nickel hydroxide or Pt and unmodified carbon cloth at an applied voltage of 0.8 V
Ctotala, C CR
b, % Rcatc, % RH2
d, % QH2
e, m3 H2
m-2 d-1
Ni(II)cyclam
23 mM 71.6 ±
2.1 25.0 ± 3.4 84.3 ± 3.3
20.7 ±
1.1 0.014 ± 0.002
15 mM 75.5 ±
2.9 27.6 ± 4.7 69.6 ± 4.0
19.2 ±
1.9 0.012 ± 0.003
6 mM 75.4 ±
2.1 26.4 ± 3.1 59.2 ± 2.1
15.7 ±
1.3 0.010 ± 0.001
Ni(II)Cl2•6H2O 71.1 ±
0.8 22.3 ± 4.0 48.4 ± 4.2
10.8 ±
2.1 0.008 ± 0.002
Pt 71.4 ±
1.2 26.2 ± 2.4 78.3 ± 1.9
19.1 ±
0.9 0.013 ± 0.001
Carbon cloth 40.1 ±
1.0 10.2 ± 1.9 21.1 ± 3.8 2.1± 1.4 0.002 ± 0.001
a, Total coulombs passed – reports on the complete consumption of the electron source
(organics – acetate) in the anode chamber and is expected to be similar for all catalytic cathodes;
b, Coulombic recovery; c, Cathodic hydrogen recovery; d, Overall hydrogen recovery; e,
Hydrogen production rate. All were calculated according to the equation in experimental part.

215
Chapter 11 Perspectives
The cooperation of BES and FO creates an innovative treatment system, which takes advantage of
both technologies and can accomplish the recovery of valuable resources such as energy, water,
and nutrient from various wastewaters. The cooperation, through either internal or external
connection, also generates a strong synergy between BES and FO and helps overcome some
inherent issues of each technology. The research of OsBES is still in an infancy stage, but great
promise in resource recovery and progress of both BES and FO as individual technology will
accelerate the development of the OsBES technology. More efforts must be invested to identify
application niches, understand energy issues, alleviate membrane fouling, and scale up OsBES to
a transitional stage.
Energy balance
Integrated system needs to take energy consumption and balance into consideration since more
units are included in the system. Besides, the energy performance has not been widely presented
in the BES studies. A new parameter, normalized energy recovery (NER), has been proposed to
present energy consumption and production. NER is expressed in either kWh m-3 or kWh
kgCOD-1. Like BES studies, many OsBES studies do not report energy data; only power density
data are presented. To better understand BES/OsBES performance and identify their application
niches, energy data must be included (He 2017)
Potential applications
An OsBES may be applied to recover valuable resources with simultaneous treatment of various
wastewaters including both low strength (e.g., municipal wastewater) and high strength (e.g., side
stream, food/beverage wastewater, livestock wastewater, and landfill leachate). However, the

216
strategies and goal of the applications will differ, because of different characteristics of
wastewaters. The application to treat low strength wastewater will need to focus on energy-
efficient treatment and water recovery. Energy recovery from low strength wastewater is still
important, but its primary goal will be to help achieve energy-neutral treatment. Nutrient recovery
may not be feasible, due to very low concentrations of both nitrogen and phosphorus in low
strength wastewater. High-strength wastewater contains high concentrations of organic matters
and nutrients, and will be suitable for simultaneous NEW recovery.
Coordination between MEC and FO
The application of the MEC-FO system will need to address a key issue of system coordination
between the MEC unit and FO unit. MEC is a biological process and tends to be slow, while FO
is a physical process and usually fast. The difference in the treatment speed between the two creates
the issue of coordinating the treatment capacities. In MEC-FO system, the HRT of an MEC that
was used for energy and ammonia recovery was 48 h while the FO unit required only 5 h to
complete water recovery. As a result, the FO unit was on standby most of the operation time and
its treatment capacity would be wasted. Such discrepancy may be solved by increasing the
treatment speed of the MEC unit (e.g., through optimizing MEC operation and materials), or by
reducing the size of the FO unit so that a continuous supply of MEC effluent can be achieved.
Membrane fouling
Although membrane fouling in an FO process is generally less severe than that in pressure-driven
membrane processes, it is still an inevitable phenomenon in an OsBES, and can lead to an
additional hydraulic resistance that reduces osmotic pressure and water recovery, thereby
increasing the capital and operational costs. When treating wastewater, the organic fouling due to
the presence of organic matters and microorganisms can become significant (Zhao et al. 2011),

217
and in this aspect, a coupled OsBES may be more advantageous over an integrated OsBES,
because the BES unit in the coupled OsBES acts as a pre-treatment step and reduces organic
contents in the liquid stream before it enters the FO unit. When fouling occurs, backwash is a
commonly used method to remove foulants and retrieve the FO performance. Membrane fouling
in FO can be almost fully reversible by backwash, due to the loose fouling layer on the membrane
surface in the absence of external pressure (Lee et al. 2010). More severe fouling would require
chemical cleaning, either in situ or ex situ. No matter which cleaning method, the microbial
community in the anode of an integrated OsBES would be adversely affected, for example by a
shock from a high salinity solution or chemical toxicity. To address this problem, membrane
fabrication and modification must be advanced to reduce membrane fouling and cleaning
requirement. Fouling alters the membrane properties and in some cases, it may benefit energy
recovery in an OsBES. It was found that the current generation of an OsMFC was increased by
34% upon membrane fouling without water flux (Zhu et al. 2016). This is because that the fouled
FO membrane showed significantly higher flux of protons and other ions than a pristine membrane,
resulting in a lower internal resistance and higher current generation.
System scaling up
Development of the OsBES technology must advance system scaling up, and this will be built on
the ongoing scaling up efforts for both BES and FO. Scaling up FO is relatively easy and
straightforward, because of its simple structure. There have been several pilot FO systems
developed for extracting water from domestic wastewater, fracking wastewater and mine-impaired
groundwater (Hancock et al. 2011b, McGinnis et al. 2013, Phuntsho et al. 2016). Thus, the key
challenge to scaling up an OsBES will lie in the BES part. There have been a number of reports of
BES scaling up, such as MFCs, MECs and MDCs (Cusick et al. 2011, Feng et al. 2014, Wu et al.

218
2016, Zhang and He 2015), and those will provide valuable experiences to scaling up OsBES. An
effective step to transform laboratory systems to pilot/full systems is to establish a transitional-
scale system, which has a significantly larger size than bench systems but smaller than pilot/full
systems. Such a transitional system possesses some features of both bench and pilot/full systems,
and can be a great platform for further research. For example, a 200-L MFC system was developed
as a transitional-scale system (much larger than bench MFCs that are usually no more than 1 L but
smaller than typical pilot systems of >3,000 L) for treating domestic wastewater (Ge et al. 2015).
Scaling up the integrated OsBES will largely benefit from BES scaling up efforts. Mathematical
modeling can be a powerful tool to help develop transitional-scale systems based on the results of
bench systems (Luo et al. 2016). A key objective for studying the transitional-scale systems is to
perform techno-economic analysis, which will reveal both technical and economical feasibility of
the OsBES technology. Involving both membranes and electrodes in an OsBES can result in a high
capital cost; however, if an appropriate application niche is identified, there could be the potential
need for this technology. In the previously mentioned study of 200-L MFC system, the initial
analysis of the capital cost indicated that this system could be more competitive in the market of
small-scale wastewater treatment (e.g., < 40 m3 day-1) (Ge et al. 2015). Rapid progress in material
science will lead to the reduction of the cost associated with membranes and electrodes.

219
Reference
Achilli, A., Cath, T.Y. and Childress, A.E. (2010) Selection of inorganic-based draw solutions for
forward osmosis applications. Journal of Membrane Science 364(1), 233-241.
Achilli, A., Cath, T.Y., Marchand, E.A. and Childress, A.E. (2009) The forward osmosis
membrane bioreactor: a low fouling alternative to MBR processes. Desalination 239(1),
10-21.
Achilli, A. and Childress, A.E. (2010) Pressure retarded osmosis: From the vision of Sidney Loeb
to the first prototype installation-Review. Desalination 261(3), 205-211.
Aeshala, L., Uppaluri, R. and Verma, A. (2013) Effect of cationic and anionic solid polymer
electrolyte on direct electrochemical reduction of gaseous CO2 to fuel. J. CO2 Util. 3, 49-
55.
Ahn, Y.-H. (2006a) Sustainable nitrogen elimination biotechnologies: a review. Process Biochem.
41(8), 1709-1721.
Ahn, Y.H. (2006b) Sustainable nitrogen elimination biotechnologies: a review. Process Biochem.
41(8), 1709-1721.
Akther, N., Sodiq, A., Giwa, A., Daer, S., Arafat, H. and Hasan, S. (2015) Recent advancements
in forward osmosis desalination: a review. Chem. Eng. J. 281, 502-522.
Alturki, A., McDonald, J., Khan, S.J., Hai, F.I., Price, W.E. and Nghiem, L.D. (2012) Performance
of a novel osmotic membrane bioreactor (OMBR) system: flux stability and removal of
trace organics. Bioresour. Technol. 113, 201-206.
An, J. and Lee, H.S. (2014) Occurrence and Implications of Voltage Reversal in Stacked Microbial
Fuel Cells. ChemSusChem 7(6), 1689-1695.
Angenent, L.T. and Sung, S. (2001) Development of anaerobic migrating blanket reactor (AMBR),
a novel anaerobic treatment system. Water Res. 35(7), 1739-1747.
Ansari, A.J., Hai, F.I., Price, W.E., Drewes, J.E. and Nghiem, L.D. (2017) Forward osmosis as a
platform for resource recovery from municipal wastewater-A critical assessment of the
literature. J. Membr. Sci. 529, 195-206.
Arena, J.T., Chwatko, M., Robillard, H.A. and McCutcheon, J.R. (2015) pH sensitivity of ion
exchange through a thin film composite membrane in forward osmosis. Environ. Sci.
Technol. Lett. 2(7), 177-182.
Arena, J.T., Manickam, S.S., Reimund, K.K., Freeman, B.D. and McCutcheon, J.R. (2014) Solute
and water transport in forward osmosis using polydopamine modified thin film composite
membranes. Desalination 343, 8-16.
Arredondo, M.R., Kuntke, P., Jeremiasse, A., Sleutels, T., Buisman, C. and ter Heijne, A. (2015)
Bioelectrochemical systems for nitrogen removal and recovery from wastewater. Environ.
Sci.: Water Res. Technol. 1(1), 22-33.

220
Bani-Melhem, K. and Elektorowicz, M. (2010) Development of a novel submerged membrane
electro-bioreactor (SMEBR): performance for fouling reduction. Environ. Sci. Technol.
44(9), 3298-3304.
Barker, D.J. and Stuckey, D.C. (1999) A review of soluble microbial products (SMP) in
wastewater treatment systems. Water research 33(14), 3063-3082.
Batstone, D., Hülsen, T., Mehta, C. and Keller, J. (2015) Platforms for energy and nutrient
recovery from domestic wastewater: A review. Chemosphere 140, 2-11.
Baun, D.L. and Christensen, T.H. (2004) Speciation of heavy metals in landfill leachate: a review.
Waste management & research 22(1), 3-23.
Beley, M., Collin, J.P., Ruppert, R. and Sauvage, J.P. (1986) Electrocatalytic reduction of carbon
dioxide by nickel cyclam2+ in water: study of the factors affecting the efficiency and the
selectivity of the process. J. Am. Chem. Soc. 108(24), 7461-7467.
Bicer, Y., Dincer, I., Zamfirescu, C., Vezina, G. and Raso, F. (2016) Comparative Life Cycle
Assessment of Various Ammonia Production Methods. J Clean Prod. 135, 1379-1395.
Boo, C., Elimelech, M. and Hong, S. (2013) Fouling control in a forward osmosis process
integrating seawater desalination and wastewater reclamation. J. Membr. Sci. 444, 148-
156.
Boo, C., Lee, S., Elimelech, M., Meng, Z. and Hong, S. (2012) Colloidal fouling in forward
osmosis: role of reverse salt diffusion. J. Membr. Sci. 390, 277-284.
Bosnich, B., Tobe, M.L. and Webb, G.A. (1965) Complexes of Nickel(II)with a Cyclic
Tetradentate Secondary Amine. Inorg Chem 4(8), 1109-1112.
Cao, X., Huang, X., Liang, P., Xiao, K., Zhou, Y., Zhang, X. and Logan, B.E. (2009) A new
method for water desalination using microbial desalination cells. Environ. Sci. Technol.
43(18), 7148-7152.
Capodaglio, A.G., Hlavínek, P. and Raboni, M. (2015) Physico-chemical technologies for nitrogen
removal from wastewaters: a review. Revista Ambiente & Agua 10(3), 481-498.
Cath, T.Y., Adams, D. and Childress, A.E. (2005a) Membrane contactor processes for wastewater
reclamation in space: II. Combined direct osmosis, osmotic distillation, and membrane
distillation for treatment of metabolic wastewater. J. Membr. Sci. 257(1), 111-119.
Cath, T.Y., Childress, A.E. and Elimelech, M. (2006) Forward osmosis: principles, applications,
and recent developments. Journal of membrane science 281(1), 70-87.
Cath, T.Y., Elimelech, M., McCutcheon, J.R., McGinnis, R.L., Achilli, A., Anastasio, D., Brady,
A.R., Childress, A.E., Farr, I.V. and Hancock, N.T. (2013) Standard methodology for
evaluating membrane performance in osmotically driven membrane processes.
Desalination 312, 31-38.
Cath, T.Y., Gormly, S., Beaudry, E.G., Flynn, M.T., Adams, V.D. and Childress, A.E. (2005b)
Membrane contactor processes for wastewater reclamation in space: Part I. Direct osmotic
concentration as pretreatment for reverse osmosis. J. Membr. Sci. 257(1), 85-98.

221
Chanukya, B., Patil, S. and Rastogi, N.K. (2013) Influence of concentration polarization on flux
behavior in forward osmosis during desalination using ammonium bicarbonate.
Desalination 312, 39-44.
Chekli, L., Phuntsho, S., Shon, H.K., Vigneswaran, S., Kandasamy, J. and Chanan, A. (2012) A
review of draw solutes in forward osmosis process and their use in modern applications.
Desalin. Water. Treat. 43(1-3), 167-184.
Chen, H. and Ruckenstein, E. (2015) Hydrated Ions: From Individual Ions to Ion Pairs to Ion
Clusters. J. Phys. Chem. B 119(39), 12671-12676.
Chen, J., Yang, C., Zhou, J. and Wang, X. (2007) Study of the influence of the electric field on
membrane flux of a new type of membrane bioreactor. Chem. Eng. J. 128(2), 177-180.
Chen, S., Liu, G., Zhang, R., Qin, B. and Luo, Y. (2012) Development of the microbial electrolysis
desalination and chemical-production cell for desalination as well as acid and alkali
productions. Environ. Sci. Technol. 46(4), 2467-2472.
Chen, X., Liang, P., Zhang, X. and Huang, X. (2016) Bioelectrochemical systems-driven
directional ion transport enables low-energy water desalination, pollutant removal, and
resource recovery. Bioresour. Technol. 215, 274-284.
Cheng, K.Y., Kaksonen, A.H. and Cord-Ruwisch, R. (2013) Ammonia recycling enables
sustainable operation of bioelectrochemical systems. Bioresour. Technol. 143, 25-31.
Cheng, S., Xing, D., Call, D.F. and Logan, B.E. (2009) Direct biological conversion of electrical
current into methane by electromethanogenesis. Environ. Sci. Technol. 43(10), 3953-3958.
Chung, T.-S., Zhang, S., Wang, K.Y., Su, J. and Ling, M.M. (2012a) Forward osmosis processes:
Yesterday, today and tomorrow. Desalination 287, 78-81.
Chung, T.S., Zhang, S., Wang, K.Y., Su, J. and Ling, M.M. (2012b) Forward osmosis processes:
yesterday, today and tomorrow. Desalination 287, 78-81.
Clauwaert, P., Mulenga, S., Aelterman, P. and Verstraete, W. (2009) Litre-scale microbial fuel
cells operated in a complete loop. Appl. Microbiol. Biotechnol. 83(2), 241.
Clauwaert, P., Rabaey, K., Aelterman, P., De Schamphelaire, L., Pham, T.H., Boeckx, P., Boon,
N. and Verstraete, W. (2007) Biological denitrification in microbial fuel cells. Environ.
Sci. Technol. 41(9), 3354-3360.
Coday, B.D., Xu, P., Beaudry, E.G., Herron, J., Lampi, K., Hancock, N.T. and Cath, T.Y. (2014)
The sweet spot of forward osmosis: Treatment of produced water, drilling wastewater, and
other complex and difficult liquid streams. Desalination 333(1), 23-35.
Cord-Ruwisch, R., Law, Y. and Cheng, K.Y. (2011) Ammonium as a sustainable proton shuttle in
bioelectrochemical systems. Bioresource technology 102(20), 9691-9696.
Cordell, D., Drangert, J.O. and White, S. (2009) The story of phosphorus: global food security and
food for thought. Global Environ. Change 19(2), 292-305.
Cornelissen, E., Harmsen, D., Dekorte, K., Ruiken, C., Qin, J., Oo, H. and Wessels, L. (2008)
Membrane fouling and process performance of forward osmosis membranes on activated
sludge. J. Membr. Sci. 319(1-2), 158-168.
222
Cornelissen, E.R., Harmsen, D., Beerendonk, E.F., Qin, J.J., Oo, H., de Korte, K.F. and Kappelhof,
J.W. (2011) The innovative osmotic membrane bioreactor (OMBR) for reuse of
wastewater. Water Sci. Technol. 63(8), 1557-1565.
Cusick, R.D., Bryan, B., Parker, D.S., Merrill, M.D., Mehanna, M., Kiely, P.D., Liu, G. and Logan,
B.E. (2011) Performance of a pilot-scale continuous flow microbial electrolysis cell fed
winery wastewater. Appl. Microbiol. Biotechnol. 89(6), 2053-2063.
Cusick, R.D., Kim, Y. and Logan, B.E. (2012) Energy capture from thermolytic solutions in
microbial reverse-electrodialysis cells. Science 335(6075), 1474-1477.
Damiano, L., Jambeck, J.R. and Ringelberg, D.B. (2014) Municipal solid waste landfill leachate
treatment and electricity production using microbial fuel cells. Appl. Biochem. Biotechnol.
173(2), 472-485.
Dasgupta, P.K. and Dong, S. (1986) Solubility of ammonia in liquid water and generation of trace
levels of standard gaseous ammonia. Atmos. Environ. 20(3), 565-570.
de Fraiture, C., Wichelns, D., Rockstrom, J., Kemp-Benedict, E., Eriyagama, N., Gordon, L.J.,
Hanjra, M.A., Hoogeveen, J., Huber-Lee, A. and Karlberg, L. (2007) Looking ahead to
2050: scenarios of alternative investment approaches, International Water Management
Institute.
Desloover, J., Abate Woldeyohannis, A., Verstraete, W., Boon, N. and Rabaey, K. (2012)
Electrochemical resource recovery from digestate to prevent ammonia toxicity during
anaerobic digestion. Environ. Sci. Technol. 46(21), 12209-12216.
Ding, Y.C., Yuan, J.L. and Chang, Z.R. (1997) Cyclic voltammetry response of coprecipitated
Ni(OH)(2) electrode in 5 M KOH solution. J. Power Sources 69(1-2), 47-54.
Dodds, W.K., Bouska, W.W., Eitzmann, J.L., Pilger, T.J., Pitts, K.L., Riley, A.J., Schloesser, J.T.
and Thornbrugh, D.J. (2008) Eutrophication of US freshwaters: analysis of potential
economic damages, ACS Publications.
Dong, Y., Feng, Y., Qu, Y., Du, Y., Zhou, X. and Liu, J. (2015) A combined system of microbial
fuel cell and intermittently aerated biological filter for energy self-sufficient wastewater
treatment. Sci. Rep. 5.
Dube, C.E., Workie, B., Kounaves, S.P., Robbat, A., Aksu, M.L. and Davies, G. (1995)
Electrodeposition of Metal Alloy and Mixed-Oxide Films Using a Single-Precursor
Tetranuclear Copper-Nickel Complex. J. Electrochem. Soc. 142(10), 3357-3365.
Dykstra, J., Biesheuvel, P., Bruning, H. and Ter Heijne, A. (2014a) Theory of ion transport with
fast acid-base equilibrations in bioelectrochemical systems. Phys. Rev. E 90(1), 013302.
Dykstra, J.E., Biesheuvel, P.M., Bruning, H. and Ter Heijne, A. (2014b) Theory of ion transport
with fast acid-base equilibrations in bioelectrochemical systems. Physical Review E 90(1).
Dykstra, J.E., Biesheuvel, P.M., Bruning, H. and Ter Heijne, A. (2014c) Theory of ion transport
with fast acid-base equilibrations in bioelectrochemical systems. Phys. Rev. E 90(1),
013302.
ElMekawy, A., Hegab, H.M. and Pant, D. (2014) The near-future integration of microbial
desalination cells with reverse osmosis technology. Energ. Environ. Sci. 7(12), 3921-3933.

223
Erisman, J.W., Sutton, M.A., Galloway, J., Klimont, Z. and Winiwarter, W. (2008) How a century
of ammonia synthesis changed the world. Nat. Geosci. 1(10), 636-639.
Fan, Y., Sharbrough, E. and Liu, H. (2008) Quantification of the internal resistance distribution of
microbial fuel cells. Environ. Sci. Technol. 42(21), 8101-8107.
Feng, Y., He, W., Liu, J., Wang, X., Qu, Y. and Ren, N. (2014) A horizontal plug flow and
stackable pilot microbial fuel cell for municipal wastewater treatment. Bioresour. Technol.
156, 132-138.
Foo, K. and Hameed, B. (2009) An overview of landfill leachate treatment via activated carbon
adsorption process. J. Hazard. Mater. 171(1), 54-60.
Galama, A., Post, J., Stuart, M.C. and Biesheuvel, P. (2013) Validity of the Boltzmann equation
to describe Donnan equilibrium at the membrane–solution interface. J. Membr. Sci. 442,
131-139.
Galama, A., Vermaas, D., Veerman, J., Saakes, M., Rijnaarts, H., Post, J. and Nijmeijer, K. (2014)
Membrane resistance: The effect of salinity gradients over a cation exchange membrane.
J. Membr. Sci. 467, 279-291.
Gálvez, A., Greenman, J. and Ieropoulos, I. (2009) Landfill leachate treatment with microbial fuel
cells; scale-up through plurality. Bioresour. Technol. 100(21), 5085-5091.
Ganesh, K. and Jambeck, J.R. (2013) Treatment of landfill leachate using microbial fuel cells:
Alternative anodes and semi-continuous operation. Bioresour. Technol. 139, 383-387.
Gao, Y., Li, W., Lay, W.C., Coster, H.G., Fane, A.G. and Tang, C.Y. (2013) Characterization of
forward osmosis membranes by electrochemical impedance spectroscopy. Desalination
312, 45-51.
Ge, Z. and He, Z. (2012) Effects of draw solutions and membrane conditions on electricity
generation and water flux in osmotic microbial fuel cells. Bioresour. Technol. 109, 70-76.
Ge, Z., Li, J., Xiao, L., Tong, Y. and He, Z. (2013a) Recovery of electrical energy in microbial
fuel cells: brief review. Environ. Sci. Technol. Lett. 1(2), 137-141.
Ge, Z., Ping, Q., Xiao, L. and He, Z. (2013b) Reducing effluent discharge and recovering
bioenergy in an osmotic microbial fuel cell treating domestic wastewater. Desalination 312,
52-59.
Ge, Z., Wu, L., Zhang, F. and He, Z. (2015) Energy extraction from a large-scale microbial fuel
cell system treating municipal wastewater. J. Power Sources 297, 260-264.
Geise, G.M., Curtis, A.J., Hatzell, M.C., Hickner, M.A. and Logan, B.E. (2013) Salt concentration
differences alter membrane resistance in reverse electrodialysis stacks. Environ. Sci.
Technol. Lett. 1(1), 36-39.
Gotvajn, A.Ž., Tišler, T. and Zagorc-Končan, J. (2009) Comparison of different treatment
strategies for industrial landfill leachate. J. Hazard. Mater. 162(2), 1446-1456.
Grant, S.B., Saphores, J.-D., Feldman, D.L., Hamilton, A.J., Fletcher, T.D., Cook, P.L.,
Stewardson, M., Sanders, B.F., Levin, L.A. and Ambrose, R.F. (2012) Taking the “waste”
out of “wastewater” for human water security and ecosystem sustainability. Science
337(6095), 681-686.

224
Greenman, J., Gálvez, A., Giusti, L. and Ieropoulos, I. (2009) Electricity from landfill leachate
using microbial fuel cells: comparison with a biological aerated filter. Enzyme Microb.
Technol. 44(2), 112-119.
Grosvenor, A.P., Biesinger, M.C., Smart, R.S. and McIntyre, N.S. (2006) New interpretations of
XPS spectra of nickel metal and oxides. Surf. Sci. 600(9), 1771-1779.
Gupta, V., Sadegh, H., Yari, M., Shahryari Ghoshekandi, R., Maazinejad, B. and Chahardori, M.
(2015) Removal of ammonium ions from wastewater: A short review in development of
efficient methods. Global J. Environ. Sci. Manage. 1(2), 149-158.
Haddadi, S., Elbeshbishy, E. and Lee, H.-S. (2013) Implication of diffusion and significance of
anodic pH in nitrogen-recovering microbial electrochemical cells. Bioresour. Technol.
142, 562-569.
Haddadi, S., Nabi-Bidhendi, G. and Mehrdadi, N. (2014) Nitrogen removal from wastewater
through microbial electrolysis cells and cation exchange membrane. J. Environ. Health.
Sci. Eng. 12(1), 48.
Hamelers, H.V., Ter Heijne, A., Sleutels, T.H., Jeremiasse, A.W., Strik, D.P. and Buisman, C.J.
(2010) New applications and performance of bioelectrochemical systems. Appl. Microbiol.
Biotechnol. 85(6), 1673-1685.
Hancock, N.T., Phillip, W.A., Elimelech, M. and Cath, T.Y. (2011a) Bidirectional permeation of
electrolytes in osmotically driven membrane processes. Environ. Sci. Technol. 45(24),
10642-10651.
Hancock, N.T., Xu, P., Heil, D.M., Bellona, C. and Cath, T.Y. (2011b) Comprehensive bench-and
pilot-scale investigation of trace organic compounds rejection by forward osmosis.
Environ. Sci. Technol. 45(19), 8483-8490.
Harnisch, F. and Schröder, U. (2009) Selectivity versus mobility: separation of anode and cathode
in microbial bioelectrochemical systems. ChemSusChem 2(10), 921-926.
He, Z. (2017) Development of Microbial Fuel Cells Needs To Go beyond “Power Density”. ACS
Energy Lett. 2, 700-702.
He, Z., Huang, Y., Manohar, A.K. and Mansfeld, F. (2008) Effect of electrolyte pH on the rate of
the anodic and cathodic reactions in an air-cathode microbial fuel cell. Bioelectrochemistry
74(1), 78-82.
Higa, M., Tanioka, A. and Kira, A. (1998) A novel measurement method of Donnan potential at
an interface between a charged membrane and mixed salt solution. J. Membr. Sci. 140(2),
213-220.
Hoek, E.M. and Elimelech, M. (2003) Cake-enhanced concentration polarization: a new fouling
mechanism for salt-rejecting membranes. Environ. Sci. Technol. 37(24), 5581-5588.
Hoffert, M.I., Caldeira, K., Benford, G., Criswell, D.R., Green, C., Herzog, H., Jain, A.K.,
Kheshgi, H.S., Lackner, K.S. and Lewis, J.S. (2002) Advanced technology paths to global
climate stability: energy for a greenhouse planet. Science 298(5595), 981-987.
Holloway, R.W., Childress, A.E., Dennett, K.E. and Cath, T.Y. (2007) Forward osmosis for
concentration of anaerobic digester centrate. Water Res. 41(17), 4005-4014.

225
Holloway, R.W., Maltos, R., Vanneste, J. and Cath, T.Y. (2015) Mixed draw solutions for
improved forward osmosis performance. J. Membr. Sci. 491, 121-131.
Hoornweg, D. and Bhada-Tata, P. (2012) What a waste: a global review of solid waste
management.
Hou, D., Lu, L. and Ren, Z.J. (2016) Microbial fuel cells and osmotic membrane bioreactors have
mutual benefits for wastewater treatment and energy production. Water Res. 98, 183-189.
Howarth, R.W., Billen, G., Swaney, D., Townsend, A., Jaworski, N., Lajtha, K., Downing, J.A.,
Elmgren, R., Caraco, N. and Jordan, T. (1996) Nitrogen cycling in the North Atlantic
Ocean and its watersheds, pp. 75-139, Springer.
Hu, H., Fan, Y. and Liu, H. (2009) Hydrogen production in single-chamber tubular microbial
electrolysis cells using non-precious-metal catalysts. Int. J. Hydrogen Energy 34(20),
8535-8542.
Huang, Y.-X., Liu, X.-W., Sun, X.-F., Sheng, G.-P., Zhang, Y.-Y., Yan, G.-M., Wang, S.-G., Xu,
A.-W. and Yu, H.-Q. (2011) A new cathodic electrode deposit with palladium
nanoparticles for cost-effective hydrogen production in a microbial electrolysis cell. Int. J.
Hydrogen Energy 36(4), 2773-2776.
Ismail, Z.Z. and Ibrahim, M.A. (2015) Desalination of oilfield produced water associated with
treatment of domestic wastewater and bioelectricity generation in microbial osmotic fuel
cell. J. Membr. Sci. 490, 247-255.
Jadhav, G.S. and Ghangrekar, M.M. (2009) Performance of microbial fuel cell subjected to
variation in pH, temperature, external load and substrate concentration. Bioresour.
Technol. 100(2), 717-723.
Jarzebińska, A., Rowiński, P., Zawisza, I., Bilewicz, R., Siegfried, L. and Kaden, T. (1999)
Modified electrode surfaces for catalytic reduction of carbon dioxide. Anal. Chim. Acta
396(1), 1-12.
Jeremiasse, A.W., Hamelers, H.V., Saakes, M. and Buisman, C.J. (2010) Ni foam cathode enables
high volumetric H 2 production in a microbial electrolysis cell. Int. J. Hydrogen Energy
35(23), 12716-12723.
Jiao, W., Luo, S., He, Z. and Liu, Y. (2016) Applications of high gravity technologies for
wastewater treatment: A review. Chem. Eng. J.
Kelly, P.T. and He, Z. (2014) Nutrients removal and recovery in bioelectrochemical systems: a
review. Bioresour. Technol. 153, 351-360.
Ki, D., Popat, S.C. and Torres, C.I. (2016) Reduced overpotentials in microbial electrolysis cells
through improved design, operation, and electrochemical characterization. Chem. Eng. J.
287, 181-188.
Kim, J., Kim, K., Ye, H., Lee, E., Shin, C., McCarty, P.L. and Bae, J. (2010) Anaerobic fluidized
bed membrane bioreactor for wastewater treatment. Environ. Sci. Technol. 45(2), 576-581.
Kim, J.R., Cheng, S., Oh, S.-E. and Logan, B.E. (2007a) Power generation using different cation,
anion, and ultrafiltration membranes in microbial fuel cells. Environ. Sci. Technol. 41(3),
1004-1009.

226
Kim, J.R., Cheng, S., Oh, S.E. and Logan, B.E. (2007b) Power generation using different cation,
anion, and ultrafiltration membranes in microbial fuel cells. Environ. Sci. Technol. 41(3),
1004-1009.
Kim, J.R., Zuo, Y., Regan, J.M. and Logan, B.E. (2008) Analysis of ammonia loss mechanisms in
microbial fuel cells treating animal wastewater. Biotechnol. Bioeng. 99(5), 1120-1127.
Klaysom, C., Cath, T.Y., Depuydt, T. and Vankelecom, I.F. (2013) Forward and pressure retarded
osmosis: potential solutions for global challenges in energy and water supply. Chemical
Society Reviews 42(16), 6959-6989.
Koelliker, J. and Kissel, D. (1988) Chemical equilibria affecting ammonia volatilization, pp. 37-
52.
Kulikowska, D. and Klimiuk, E. (2008) The effect of landfill age on municipal leachate
composition. Bioresour. Technol. 99(13), 5981-5985.
Kumar, G., Saratale, R.G., Kadier, A., Sivagurunathan, P., Zhen, G., Kim, S.-H. and Saratale, G.D.
(2017) A review on bio-electrochemical systems (BESs) for the syngas and value added
biochemicals production. Chemosphere 177, 84-92.
Kundu, A., Sahu, J.N., Redzwan, G. and Hashim, M. (2013) An overview of cathode material and
catalysts suitable for generating hydrogen in microbial electrolysis cell. Int. J. Hydrogen
Energy 38(4), 1745-1757.
Kuntke, P., Geleji, M., Bruning, H., Zeeman, G., Hamelers, H. and Buisman, C. (2011) Effects of
ammonium concentration and charge exchange on ammonium recovery from high strength
wastewater using a microbial fuel cell. Bioresour. Technol. 102(6), 4376-4382.
Kuntke, P., Sleutels, T., Saakes, M. and Buisman, C. (2014) Hydrogen production and ammonium
recovery from urine by a Microbial Electrolysis Cell. Int. J. Hydrogen Energy 39(10),
4771-4778.
Kuntke, P., Śmiech, K., Bruning, H., Zeeman, G., Saakes, M., Sleutels, T., Hamelers, H. and
Buisman, C. (2012) Ammonium recovery and energy production from urine by a microbial
fuel cell. Water Res. 46(8), 2627-2636.
Kurniawan, T.A., Lo, W.-h. and Chan, G.Y. (2006) Physico-chemical treatments for removal of
recalcitrant contaminants from landfill leachate. J. Hazard. Mater. 129(1), 80-100.
Lackner, S., Gilbert, E.M., Vlaeminck, S.E., Joss, A., Horn, H. and van Loosdrecht, M.C. (2014)
Full-scale partial nitritation/anammox experiences–an application survey. Water Res. 55,
292-303.
Ledezma, P., Kuntke, P., Buisman, C.J., Keller, J. and Freguia, S. (2015) Source-separated urine
opens golden opportunities for microbial electrochemical technologies. Trends Biotechnol.
33(4), 214-220.
Lee, M.-Y., Kim, K.-Y., Yang, E. and Kim, I.S. (2015) Evaluation of hydrogen production and
internal resistance in forward osmosis membrane integrated microbial electrolysis cells.
Bioresour. Technol. 187, 106-112.
Lee, S., Boo, C., Elimelech, M. and Hong, S. (2010) Comparison of fouling behavior in forward
osmosis (FO) and reverse osmosis (RO). J. Membr. Sci. 365(1), 34-39.

227
Lefebvre, O., Tan, Z., Kharkwal, S. and Ng, H.Y. (2012) Effect of increasing anodic NaCl
concentration on microbial fuel cell performance. Bioresour. Technol. 112, 336-340.
Lei, X., Sugiura, N., Feng, C. and Maekawa, T. (2007) Pretreatment of anaerobic digestion effluent
with ammonia stripping and biogas purification. Journal of hazardous materials 145(3),
391-397.
Leong, J.X., Daud, W.R.W., Ghasemi, M., Liew, K.B. and Ismail, M. (2013) Ion exchange
membranes as separators in microbial fuel cells for bioenergy conversion: a comprehensive
review. Renewable and Sustainable Energy Reviews 28, 575-587.
Li, D., Zhang, X., Yao, J., Simon, G.P. and Wang, H. (2011a) Stimuli-responsive polymer
hydrogels as a new class of draw agent for forward osmosis desalination. Chem. Commun.
47(6), 1710-1712.
Li, W.-W., Yu, H.-Q. and He, Z. (2014a) Towards sustainable wastewater treatment by using
microbial fuel cells-centered technologies. Energ. Environ. Sci. 7(3), 911-924.
Li, W., Sheng, G., Liu, X. and Yu, H. (2011b) Recent advances in the separators for microbial fuel
cells. Bioresour. Technol. 102(1), 244-252.
Li, W., Yu, H. and He, Z. (2014b) Towards sustainable wastewater treatment by using microbial
fuel cells-centered technologies. Energ. Environ. Sci. 7(3), 911-924.
Li, X., Lu, Y. and He, Z. (2015) Removal of reverse-fluxed ammonium by anammox in a forward
osmosis system using ammonium bicarbonate as a draw solute. J. Membr. Sci.
Liang, Z. and Liu, J. (2008) Landfill leachate treatment with a novel process: Anaerobic
ammonium oxidation (Anammox) combined with soil infiltration system. J. Hazard. Mater.
151(1), 202-212.
Liao, P., Chen, A. and Lo, K. (1995) Removal of nitrogen from swine manure wastewaters by
ammonia stripping. Bioresour. Technol. 54(1), 17-20.
Ling, M., Wang, K. and Chung, T.-S. (2010) Highly water-soluble magnetic nanoparticles as novel
draw solutes in forward osmosis for water reuse. Ind. Eng. Chem. Res. 49(12), 5869-5876.
Liu, H., Grot, S. and Logan, B.E. (2005) Electrochemically assisted microbial production of
hydrogen from acetate. Environ. Sci. Technol. 39(11), 4317-4320.
Liu, J., Liu, L., Gao, B. and Yang, F. (2013) Integration of bio-electrochemical cell in membrane
bioreactor for membrane cathode fouling reduction through electricity generation. J.
Membr. Sci. 430, 196-202.
Liu, J., Wang, X., Wang, Z., Lu, Y., Li, X. and Ren, Y. (2017) Integrating microbial fuel cells with
anaerobic acidification and forward osmosis membrane for enhancing bio-electricity and
water recovery from low-strength wastewater. Water Res. 110, 74-82.
Liu, Y., Qin, M., Luo, S., He, Z. and Qiao, R. (2016) Understanding Ammonium Transport in
Bioelectrochemical Systems towards its Recovery. Sci. Rep. 6.
Logan, B.E. (2008) Microbial fuel cells, John Wiley & Sons.
Logan, B.E. (2009) Exoelectrogenic bacteria that power microbial fuel cells. Nature reviews.
Microbiology 7(5), 375.

228
Logan, B.E., Call, D., Cheng, S., Hamelers, H.V., Sleutels, T.H., Jeremiasse, A.W. and Rozendal,
R.A. (2008a) Microbial electrolysis cells for high yield hydrogen gas production from
organic matter. Environ. Sci. Technol. 42(23), 8630-8640.
Logan, B.E., Call, D., Cheng, S., Hamelers, H.V.M., Sleutels, T.H.J.A., Jeremiasse, A.W. and
Rozendal, R.A. (2008b) Microbial electrolysis cells for high yield hydrogen gas production
from organic matter. Environ. Sci. Technol. 42(23), 8630-8640.
Logan, B.E. and Elimelech, M. (2012) Membrane-based processes for sustainable power
generation using water. Nature 488(7411), 313-319.
Logan, B.E., Hamelers, B., Rozendal, R., Schröder, U., Keller, J., Freguia, S., Aelterman, P.,
Verstraete, W. and Rabaey, K. (2006) Microbial fuel cells: methodology and technology.
Environ. Sci. Technol. 40(17), 5181-5192.
Logan, B.E. and Rabaey, K. (2012) Conversion of wastes into bioelectricity and chemicals by
using microbial electrochemical technologies. Science 337(6095), 686-690.
Lu, X., Boo, C., Ma, J. and Elimelech, M. (2014a) Bidirectional diffusion of ammonium and
sodium cations in forward osmosis: Role of membrane active layer surface chemistry and
charge. Environ. Sci. Technol. 48(24), 14369-14376.
Lu, Y. and He, Z. (2015) Mitigation of Salinity Buildup and Recovery of Wasted Salts in a Hybrid
Osmotic Membrane Bioreactor–Electrodialysis System. Environ. Sci. Technol. 49(17),
10529-10535.
Lu, Y., Qin, M., Yuan, H., Abu-Reesh, I.M. and He, Z. (2014b) When bioelectrochemical systems
meet forward osmosis: accomplishing wastewater treatment and reuse through synergy.
Water 7(1), 38-50.
Luo, S., Sun, H., Ping, Q., Jin, R. and He, Z. (2016) A review of modeling bioelectrochemical
systems: engineering and statistical aspects. Energies 9(2), 111.
Lutchmiah, K., Verliefde, A., Roest, K., Rietveld, L. and Cornelissen, E. (2014a) Forward osmosis
for application in wastewater treatment: A review. Water Res. 58, 179-197.
Lutchmiah, K., Verliefde, A., Roest, K., Rietveld, L.C. and Cornelissen, E.R. (2014b) Forward
osmosis for application in wastewater treatment: a review. Water Res. 58, 179-197.
Mahmoud, M., Parameswaran, P., Torres, C.I. and Rittmann, B.E. (2014) Fermentation pre-
treatment of landfill leachate for enhanced electron recovery in a microbial electrolysis
cell. Bioresour. Technol. 151, 151-158.
Manish, S. and Banerjee, R. (2008) Comparison of biohydrogen production processes. Int. J.
Hydrogen Energy 33(1), 279-286.
Manuel, M.-F., Neburchilov, V., Wang, H., Guiot, S. and Tartakovsky, B. (2010) Hydrogen
production in a microbial electrolysis cell with nickel-based gas diffusion cathodes. J.
Power Sources 195(17), 5514-5519.
Matassa, S., Batstone, D.J., Hulsen, T., Schnoor, J. and Verstraete, W. (2015a) Can direct
conversion of used nitrogen to new feed and protein help feed the world?, ACS
Publications.

229
Matassa, S., Batstone, D.J., Hulsen, T., Schnoor, J. and Verstraete, W. (2015b) Can direct
conversion of used nitrogen to new feed and protein help feed the world? Environ. Sci.
Technol. 49(9), 5247-5254.
Maurer, M., Schwegler, P. and Larsen, T. (2003a) Nutrients in urine: energetic aspects of removal
and recovery. Water Science & Technology 48(1), 37-46.
Maurer, M., Schwegler, P. and Larsen, T. (2003b) Nutrients in urine: energetic aspects of removal
and recovery. Water Sci. Technol. 48(1), 37-46.
McCarty, P.L., Bae, J. and Kim, J. (2011) Domestic wastewater treatment as a net energy
producer–can this be achieved? Environ. Sci. Technol. 45(17), 7100-7106.
McCutcheon, J.R., McGinnis, R.L. and Elimelech, M. (2005) A novel ammonia—carbon dioxide
forward (direct) osmosis desalination process. Desalination 174(1), 1-11.
McCutcheon, J.R., McGinnis, R.L. and Elimelech, M. (2006) Desalination by ammonia–carbon
dioxide forward osmosis: influence of draw and feed solution concentrations on process
performance. J. Membr. Sci. 278(1), 114-123.
McGinnis, R.L., Hancock, N.T., Nowosielski-Slepowron, M.S. and McGurgan, G.D. (2013) Pilot
demonstration of the NH 3/CO 2 forward osmosis desalination process on high salinity
brines. Desalination 312, 67-74.
McGinnis, R.L., McCutcheon, J.R. and Elimelech, M. (2007) A novel ammonia–carbon dioxide
osmotic heat engine for power generation. J. Membr. Sci. 305(1), 13-19.
Mcintyre, N.S. and Cook, M.G. (1975) X-Ray Photoelectron Studies on Some Oxides and
Hydroxides of Cobalt, Nickel, and Copper. Anal. Chem. 47(13), 2208-2213.
Oh, S.-E. and Logan, B.E. (2007) Voltage reversal during microbial fuel cell stack operation. J.
Power Sources 167(1), 11-17.
Pant, D., Van Bogaert, G., Diels, L. and Vanbroekhoven, K. (2010) A review of the substrates
used in microbial fuel cells (MFCs) for sustainable energy production. Bioresour. Technol.
101(6), 1533-1543.
Pardeshi, P. and Mungray, A. (2014) High flux layer by layer polyelectrolyte FO membrane:
toward enhanced performance for osmotic microbial fuel cell. Int. J. Polym. Mater. Po.
63(12), 595-601.
Park, J., Jin, H., Lim, B.R., Park, K.Y. and Lee, K. (2010) Ammonia removal from anaerobic
digestion effluent of livestock waste using green alga Scenedesmus sp. Bioresour. Technol.
101(22), 8649-8657.
Peng, S., Liang, D.-W., Diao, P., Liu, Y., Lan, F., Yang, Y., Lu, S. and Xiang, Y. (2013) Nernst-
ping-pong model for evaluating the effects of the substrate concentration and anode
potential on the kinetic characteristics of bioanode. Bioresour. Technol. 136, 610-616.
Persat, A., Chambers, R.D. and Santiago, J.G. (2009) Basic principles of electrolyte chemistry for
microfluidic electrokinetics. Part I: acid–base equilibria and pH buffers. Lab on a Chip
9(17), 2437-2453.
Phillip, W.A., Yong, J.S. and Elimelech, M. (2010) Reverse draw solute permeation in forward
osmosis: modeling and experiments. Environ. Sci. Technol. 44(13), 5170-5176.

230
Phuntsho, S., Kim, J.E., Johir, M.A., Hong, S., Li, Z., Ghaffour, N., Leiknes, T. and Shon, H.K.
(2016) Fertiliser drawn forward osmosis process: Pilot-scale desalination of mine impaired
water for fertigation. J. Membr. Sci. 508, 22-31.
Phuntsho, S., Shon, H.K., Hong, S., Lee, S. and Vigneswaran, S. (2011) A novel low energy
fertilizer driven forward osmosis desalination for direct fertigation: evaluating the
performance of fertilizer draw solutions. J. Membr. Sci. 375(1), 172-181.
Phuntsho, S., Shon, H.K., Majeed, T., El Saliby, I., Vigneswaran, S., Kandasamy, J., Hong, S. and
Lee, S. (2012) Blended fertilizers as draw solutions for fertilizer-drawn forward osmosis
desalination. Environ. Sci. Technol. 46(8), 4567-4575.
Picioreanu, C., Head, I.M., Katuri, K.P., van Loosdrecht, M.C. and Scott, K. (2007) A
computational model for biofilm-based microbial fuel cells. Water Res. 41(13), 2921-2940.
Ping, Q., Huang, Z., Dosoretz, C. and He, Z. (2015) Integrated experimental investigation and
mathematical modeling of brackish water desalination and wastewater treatment in
microbial desalination cells. Water Res. 77, 13-23.
Ping, Q., Porat, O., Dosoretz, C.G. and He, Z. (2016) Bioelectricity inhibits back diffusion from
the anolyte into the desalinated stream in microbial desalination cells. Water Res. 88, 266-
273.
Ping, Q., Zhang, C., Chen, X., Zhang, B., Huang, Z. and He, Z. (2014) Mathematical model of
dynamic behavior of microbial desalination cells for simultaneous wastewater treatment
and water desalination. Environ. Sci. Technol. 48(21), 13010-13019.
Pinto, R., Srinivasan, B., Manuel, M.-F. and Tartakovsky, B. (2010) A two-population bio-
electrochemical model of a microbial fuel cell. Bioresour. Technol. 101(14), 5256-5265.
Powers, S.E., Collins, A.G., Edzwald, J.K. and Dietrich, J.M. (1987) Modeling an aerated bubble
ammonia stripping process. J. - Water Pollut. Control Fed. 59(2), 92-100.
Puig, S., Serra, M., Coma, M., Cabré, M., Balaguer, M.D. and Colprim, J. (2011) Microbial fuel
cell application in landfill leachate treatment. J. Hazard. Mater. 185(2), 763-767.
Puyol, D., Batstone, D.J., Hülsen, T., Astals, S., Peces, M. and Krömer, J.O. (2016) Resource
recovery from wastewater by biological technologies: opportunities, challenges, and
prospects. Frontiers in microbiology 7.
Qin, M., Abu-Reesh, I.M. and He, Z. (2016a) Effects of current generation and electrolyte pH on
reverse salt flux across thin film composite membrane in osmotic microbial fuel cells.
Water Res. 105, 583-590.
Qin, M. and He, Z. (2014) Self-supplied ammonium bicarbonate draw solute for achieving
wastewater treatment and recovery in a microbial electrolysis cell-forward osmosis-
coupled system. Environ. Sci. Technol. Lett. 1(10), 437-441.
Qin, M., Hynes, E.A., Abu-Reesh, I.M. and He, Z. (2017) Ammonium removal from synthetic
wastewater promoted by current generation and water flux in an osmotic microbial fuel
cell. J Clean Prod. 149, 856-862.

231
Qin, M., Molitor, H., Brazil, B., Novak, J.T. and He, Z. (2016b) Recovery of nitrogen and water
from landfill leachate by a microbial electrolysis cell–forward osmosis system. Bioresour.
Technol. 200, 485-492.
Qin, M., Ping, Q., Lu, Y., Abu-Reesh, I.M. and He, Z. (2015) Understanding electricity generation
in osmotic microbial fuel cells through integrated experimental investigation and
mathematical modeling. Bioresour. Technol. 195, 194-201.
Rabaey, K., Angenent, L., Schroder, U. and Keller, J. (2009) Bioelectrochemical systems, IWA
publishing.
Rabaey, K. and Rozendal, R.A. (2010) Microbial electrosynthesis—revisiting the electrical route
for microbial production. Nature Rev. Microbiol. 8(10), 706-716.
Rabaey, K. and Verstraete, W. (2005) Microbial fuel cells: novel biotechnology for energy
generation. Trends Biotechnol. 23(6), 291-298.
Raghavulu, S.V., Mohan, S.V., Goud, R.K. and Sarma, P. (2009) Effect of anodic pH
microenvironment on microbial fuel cell (MFC) performance in concurrence with aerated
and ferricyanide catholytes. Electrochem. Commun. 11(2), 371-375.
Recio-Garrido, D., Perrier, M. and Tartakovsky, B. (2016) Modeling, optimization and control of
bioelectrochemical systems. Chem. Eng. J. 289, 180-190.
Renou, S., Givaudan, J., Poulain, S., Dirassouyan, F. and Moulin, P. (2008) Landfill leachate
treatment: review and opportunity. J. Hazard. Mater. 150(3), 468-493.
Rittmann, B.E. and McCarty, P.L. (2012) Environmental biotechnology: principles and
applications, Tata McGraw-Hill Education.
Rousseau, R., Dominguez-Benetton, X., Délia, M.-L. and Bergel, A. (2013) Microbial bioanodes
with high salinity tolerance for microbial fuel cells and microbial electrolysis cells.
Electrochem. Commun. 33, 1-4.
Rozendal, R.A., Hamelers, H.V. and Buisman, C.J. (2006a) Effects of membrane cation transport
on pH and microbial fuel cell performance. Environ. Sci. Technol. 40(17), 5206-5211.
Rozendal, R.A., Hamelers, H.V., Euverink, G.J., Metz, S.J. and Buisman, C.J. (2006b) Principle
and perspectives of hydrogen production through biocatalyzed electrolysis. Int. J.
Hydrogen Energy 31(12), 1632-1640.
Ruscalleda, M., López, H., Ganigué, R., Puig, S., Balaguer, M. and Colprim, J. (2008)
Heterotrophic denitrification on granular anammox SBR treating urban landfill leachate.
Water Sci. Technol 58(9), 1749-1755.
Sánchez, E., Milán, Z., Borja, R., Weiland, P. and Rodriguez, X. (1995) Piggery waste treatment
by anaerobic digestion and nutrient removal by ionic exchange. Resources, conservation
and recycling 15(3), 235-244.
Sarmidi, M.R. (2009) Recovery of sodium citrate and citric acid by one step electrodialysis
process. Ph.D. Dissertation, Universiti Teknologi Malaysia, Johor ,Malaysia.
Sata, T. (2004) Ion exchange membranes: preparation, characterization, modification and
application, Royal Society of chemistry.

232
Schröder, U., Harnisch, F. and Angenent, L.T. (2015) Microbial electrochemistry and technology:
terminology and classification. Energ. Environ. Sci. 8(2), 513-519.
Selembo, P.A., Merrill, M.D. and Logan, B.E. (2009) The use of stainless steel and nickel alloys
as low-cost cathodes in microbial electrolysis cells. J. Power Sources 190(2), 271-278.
Selembo, P.A., Merrill, M.D. and Logan, B.E. (2010) Hydrogen production with nickel powder
cathode catalysts in microbial electrolysis cells. Int. J. Hydrogen Energy 35(2), 428-437.
Shaffer, D.L., Werber, J.R., Jaramillo, H., Lin, S. and Elimelech, M. (2015) Forward osmosis:
Where are we now? Desalination 356, 271-284.
Sharma, S.K. and Sanghi, R. (2013) Wastewater Reuse and Management, Springer.
She, Q., Jin, X., Li, Q. and Tang, C.Y. (2012) Relating reverse and forward solute diffusion to
membrane fouling in osmotically driven membrane processes. Water Res. 46(7), 2478-
2486.
Shouliang, H., Beidou, X., Haichan, Y., Liansheng, H., Shilei, F. and Hongliang, L. (2008)
Characteristics of dissolved organic matter (DOM) in leachate with different landfill ages.
Journal of Environmental Sciences 20(4), 492-498.
Singh, A., Chang, S.L.Y., Hocking, R.K., Bach, U. and Spiccia, L. (2013) Highly active nickel
oxide water oxidation catalysts deposited from molecular complexes. Energ. Environ. Sci.
6(2), 579-586.
Sleutels, T.H., Hamelers, H.V., Rozendal, R.A. and Buisman, C.J. (2009) Ion transport resistance
in microbial electrolysis cells with anion and cation exchange membranes. Int. J. Hydrogen
Energy 34(9), 3612-3620.
Sprynskyy, M., Lebedynets, M., Zbytniewski, R., Namieśnik, J. and Buszewski, B. (2005)
Ammonium removal from aqueous solution by natural zeolite, Transcarpathian mordenite,
kinetics, equilibrium and column tests. Sep. Purif. Technol. 46(3), 155-160.
Stenina, I., Sistat, P., Rebrov, A., Pourcelly, G. and Yaroslavtsev, A. (2004) Ion mobility in
Nafion-117 membranes. Desalination 170(1), 49-57.
Stillman, D., Krupp, L. and La, Y.-H. (2014) Mesh-reinforced thin film composite membranes for
forward osmosis applications: the structure–performance relationship. J. Membr. Sci. 468,
308-316.
Tang, C.Y., Kwon, Y.-N. and Leckie, J.O. (2007) Characterization of humic acid fouled reverse
osmosis and nanofiltration membranes by transmission electron microscopy and streaming
potential measurements. Environ. Sci. Technol. 41(3), 942-949.
Tartakovsky, B., Manuel, M.-F., Wang, H. and Guiot, S. (2009) High rate membrane-less
microbial electrolysis cell for continuous hydrogen production. Int. J. Hydrogen Energy
34(2), 672-677.
Teng, S.-X., Tong, Z.-H., Li, W.-W., Wang, S.-G., Sheng, G.-P., Shi, X.-Y., Liu, X.-W. and Yu,
H.-Q. (2010) Electricity generation from mixed volatile fatty acids using microbial fuel
cells. Appl. Microbiol. Biotechnol. 87(6), 2365-2372.
Thompson, N.A. and Nicoll, P.G. (2011) Forward osmosis desalination: a commercial reality, pp.
4-9.

233
Trypuć, M. and Kiełkowska, U. (1998) Solubility in the NH4HCO3 + NaHCO3 + H2O System.
Journal of Chemical & Engineering Data 43(2), 201-204.
Verrecht, B., Judd, S., Guglielmi, G., Brepols, C. and Mulder, J. (2008) An aeration energy model
for an immersed membrane bioreactor. Water Res. 42(19), 4761-4770.
Verstraete, W., Van de Caveye, P. and Diamantis, V. (2009) Maximum use of resources present
in domestic “used water”. Bioresour. Technol. 100(23), 5537-5545.
Voelcker, N.H., Alfonso, I. and Ghadiri, M.R. (2008) Catalyzed oxidative corrosion of porous
silicon used as an optical transducer for ligand–receptor interactions. Chembiochem 9(11),
1776-1786.
Wang, H. and Ren, Z.J. (2013) A comprehensive review of microbial electrochemical systems as
a platform technology. Biotechnol. Adv. 31(8), 1796-1807.
Wang, H. and Ren, Z.J. (2014) Bioelectrochemical metal recovery from wastewater: a review.
Water Res. 66, 219-232.
Wang, K.Y., Ong, R.C. and Chung, T.-S. (2010a) Double-skinned forward osmosis membranes
for reducing internal concentration polarization within the porous sublayer. Industrial &
Engineering Chemistry Research 49(10), 4824-4831.
Wang, K.Y., Ong, R.C. and Chung, T.-S. (2010b) Double-skinned forward osmosis membranes
for reducing internal concentration polarization within the porous sublayer. Ind. Eng.
Chem. Res. 49(10), 4824-4831.
Wang, R., Shi, L., Tang, C.Y., Chou, S., Qiu, C. and Fane, A.G. (2010c) Characterization of novel
forward osmosis hollow fiber membranes. J. Membr. Sci. 355(1), 158-167.
Wang, Z., Gong, H., Zhang, Y., Liang, P. and Wang, K. (2017) Nitrogen recovery from low-
strength wastewater by combined membrane capacitive deionization (MCDI) and ion
exchange (IE) process. Chem. Eng. J. 316, 1-6.
Water, U. (2014) The United Nations world water development report 2014: water and energy.
United Nations, Paris.
Werner, C.M., Logan, B.E., Saikaly, P.E. and Amy, G.L. (2013) Wastewater treatment, energy
recovery and desalination using a forward osmosis membrane in an air-cathode microbial
osmotic fuel cell. J. Membr. Sci. 428, 116-122.
Wojtowicz, J.A. (2001) The carbonate system in swimming pool water. Journal of the Swimming
Pool and Spa Industry 4(1), 54-59.
Won, S.G., Jeon, D.Y., Kwag, J.H., Kim, J.D. and Ra, C.S. (2015) Nitrogen Removal from Milking
Center Wastewater via Simultaneous Nitrification and Denitrification Using a Biofilm
Filtration Reactor. Asian Australas. J. Anim. Sci. 28(6), 896-902.
Wu, D., Wang, T., Huang, X., Dolfing, J. and Xie, B. (2015) Perspective of harnessing energy
from landfill leachate via microbial fuel cells: novel biofuels and electrogenic physiologies.
Appl. Microbiol. Biotechnol., 1-10.
Wu, S., Li, H., Zhou, X., Liang, P., Zhang, X., Jiang, Y. and Huang, X. (2016) A novel pilot-scale
stacked microbial fuel cell for efficient electricity generation and wastewater treatment.
Water Res. 98, 396-403.

234
Wu, X. and Modin, O. (2013) Ammonium recovery from reject water combined with hydrogen
production in a bioelectrochemical reactor. Bioresour. Technol. 146, 530-536.
Wu, Y., Yang, Q., Zeng, Q., Ngo, H.H., Guo, W. and Zhang, H. (2017) Enhanced low C/N nitrogen
removal in an innovative microbial fuel cell (MFC) with electroconductivity aerated
membrane (EAM) as biocathode. Chem. Eng. J. 316, 315-322.
Xiao, L., Wen, Z., Ci, S., Chen, J. and He, Z. (2012) Carbon/iron-based nanorod catalysts for
hydrogen production in microbial electrolysis cells. Nano Energy 1(5), 751-756.
Xie, M., Nghiem, L.D., Price, W.E. and Elimelech, M. (2012) Comparison of the removal of
hydrophobic trace organic contaminants by forward osmosis and reverse osmosis. Water
Res. 46(8), 2683-2692.
Yang, E., Chae, K.-J., Alayande, A.B., Kim, K.-Y. and Kim, I.S. (2016a) Concurrent performance
improvement and biofouling mitigation in osmotic microbial fuel cells using a silver
nanoparticle-polydopamine coated forward osmosis membrane. J. Membr. Sci. 513, 217-
225.
Yang, E., Chae, K.J. and Kim, I.S. (2015a) Comparison of different semipermeable membranes
for power generation and water flux in osmotic microbial fuel cells. J. Chem. Technol.
Biotechnol. 91(8), 2305-2312.
Yang, E., Kim, K.-Y., Chae, K.-J., Lee, M.-Y. and Kim, I.S. (2016b) Evaluation of energy and
water recovery in forward osmosis–bioelectrochemical hybrid system with cellulose
triacetate and polyamide asymmetric membrane in different orientations. Desalin. Water.
Treat. 57(16), 7406-7413.
Yang, E., Kim, K.Y., Chae, K.J., Lee, M.Y. and Kim, I.S. (2015b) Evaluation of energy and water
recovery in forward osmosis–bioelectrochemical hybrid system with cellulose triacetate
and polyamide asymmetric membrane in different orientations. Desalin. Water. Treat., 1-
8.
Yang, Y., Li, X., Yang, X. and He, Z. (2016c) Membrane aeration as an energy-efficient method
for supplying oxygen to microbial fuel cells. RSC Adv. 6(55), 49787-49791.
Yang, Y., Xu, M., Guo, J. and Sun, G. (2012) Bacterial extracellular electron transfer in
bioelectrochemical systems. Process Biochem. 47(12), 1707-1714.
Yong, J.S., Phillip, W.A. and Elimelech, M. (2012) Reverse permeation of weak electrolyte draw
solutes in forward osmosis. Industrial & Engineering Chemistry Research 51(41), 13463-
13472.
Yossan, S., Xiao, L., Prasertsan, P. and He, Z. (2013) Hydrogen production in microbial
electrolysis cells: Choice of catholyte. Int. J. Hydrogen Energy 38(23), 9619-9624.
Yuan, H., Abu-Reesh, I.M. and He, Z. (2015a) Enhancing desalination and wastewater treatment
by coupling microbial desalination cells with forward osmosis. Chem. Eng. J. 270, 437-
443.
Yuan, H., Abu-Reesh, I.M. and He, Z. (2016) Mathematical modeling assisted investigation of
forward osmosis as pretreatment for microbial desalination cells to achieve continuous
water desalination and wastewater treatment. J. Membr. Sci. 502, 116-123.

235
Yuan, H. and He, Z. (2015) Integrating membrane filtration into bioelectrochemical systems as
next generation energy-efficient wastewater treatment technologies for water reclamation:
A review. Bioresour. Technol. 195, 202-209.
Yuan, H., Li, J., Yuan, C. and He, Z. (2014) Facile Synthesis of MoS2@ CNT as an Effective
Catalyst for Hydrogen Production in Microbial Electrolysis Cells. ChemElectroChem
1(11), 1828-1833.
Yuan, H., Lu, Y., Abu-Reesh, I.M. and He, Z. (2015b) Bioelectrochemical production of hydrogen
in an innovative pressure-retarded osmosis/microbial electrolysis cell system: experiments
and modeling. Biotechnol. Biofuels 8(1), 116.
Zang, G., Sheng, G., Li, W., Tong, Z., Zeng, R.J., Shi, C. and Yu, H. (2012) Nutrient removal and
energy production in a urine treatment process using magnesium ammonium phosphate
precipitation and a microbial fuel cell technique. Phys. Chem. Chem. Phys. 14(6), 1978-
1984.
Zeng, Y., Choo, Y.F., Kim, B.-H. and Wu, P. (2010) Modelling and simulation of two-chamber
microbial fuel cell. J. Power Sources 195(1), 79-89.
Zhalko-Titarenko, O., Lazurskii, O. and Pokhodenko, V. (1990) Electrocatalytic reduction of
carbon dioxide on electrodes modified by polypyrrole with an immobilized complex of
nickel with 1, 4, 8, 11-tetraazacyclotetradecane. Theor. Exp. Chem. 26(1), 40-44.
Zhang, B. and He, Z. (2012) Integrated salinity reduction and water recovery in an osmotic
microbial desalination cell. RSC Adv. 2(8), 3265-3269.
Zhang, B. and He, Z. (2013a) Improving water desalination by hydraulically coupling an osmotic
microbial fuel cell with a microbial desalination cell. J. Membr. Sci. 441, 18-24.
Zhang, F., Brastad, K.S. and He, Z. (2011a) Integrating forward osmosis into microbial fuel cells
for wastewater treatment, water extraction and bioelectricity generation. Environ. Sci.
Technol. 45(15), 6690-6696.
Zhang, F. and He, Z. (2013b) A cooperative microbial fuel cell system for waste treatment and
energy recovery. Environmental technology 34(13-14), 1905-1913.
Zhang, F. and He, Z. (2015) Scaling up microbial desalination cell system with a post-aerobic
process for simultaneous wastewater treatment and seawater desalination. Desalination
360, 28-34.
Zhang, F., Jacobson, K.S., Torres, P. and He, Z. (2010) Effects of anolyte recirculation rates and
catholytes on electricity generation in a litre-scale upflow microbial fuel cell. Energy
Environ. Sci. 3(9), 1347-1352.
Zhang, F., Li, J. and He, Z. (2014a) A new method for nutrients removal and recovery from
wastewater using a bioelectrochemical system. Bioresour. Technol. 166, 630-634.
Zhang, F., Li, J. and He, Z. (2014b) A New Method for Nutrients Removal and Recovery from
Wastewater Using a Bioelectrochemical System. Bioresource Technology.
Zhang, L., Li, C., Ding, L., Xu, K. and Ren, H. (2011b) Influences of initial pH on performance
and anodic microbes of fed‐batch microbial fuel cells. J. Chem. Technol. Biotechnol. 86(9),
1226-1232.

236
Zhang, M., Zhang, M.T., Hou, C., Ke, Z.F. and Lu, T.B. (2014c) Homogeneous Electrocatalytic
Water Oxidation at Neutral pH by a Robust Macrocyclic Nickel (II) Complex. Angew.
Chem. Int. Ed. 53(48), 13042-13048.
Zhang, S., Wang, P., Fu, X. and Chung, T.-S. (2014d) Sustainable water recovery from oily
wastewater via forward osmosis-membrane distillation (FO-MD). Water Res. 52, 112-121.
Zhang, Y. and Angelidaki, I. (2015a) Counteracting ammonia inhibition during anaerobic
digestion by recovery using submersible microbial desalination cell. Biotechnol. Bioeng.
112(7), 1478-1482.
Zhang, Y. and Angelidaki, I. (2015b) Submersible microbial desalination cell for simultaneous
ammonia recovery and electricity production from anaerobic reactors containing high
levels of ammonia. Bioresour. Technol. 177, 233-239.
Zhao, F., Harnisch, F., Schröder, U., Scholz, F., Bogdanoff, P. and Herrmann, I. (2006) Challenges
and constraints of using oxygen cathodes in microbial fuel cells. Environ. Sci. Technol.
40(17), 5193-5199.
Zhao, S., Zou, L. and Mulcahy, D. (2011) Effects of membrane orientation on process performance
in forward osmosis applications. J. Membr. Sci. 382(1), 308-315.
Zhao, S., Zou, L., Tang, C.Y. and Mulcahy, D. (2012) Recent developments in forward osmosis:
opportunities and challenges. J. Membr. Sci. 396, 1-21.
Zhu, H., Zhang, L., Wen, X. and Huang, X. (2012) Feasibility of applying forward osmosis to the
simultaneous thickening, digestion, and direct dewatering of waste activated sludge.
Bioresour. Technol. 113, 207-213.
Zhu, X., Zhang, F., Li, W., Li, J., Li, L., Yu, H., Huang, M. and Huang, T. (2016) Insights into
enhanced current generation of an osmotic microbial fuel cell under membrane fouling
condition. J. Membr. Sci. 504, 40-46.
Zhu, X., Zhang, F., Li, W., Liu, H., Wang, Y. and Huang, M. (2015) Forward osmosis membrane
favors an improved proton flux and electricity generation in microbial fuel cells.
Desalination 372, 26-31.
Zhuang, L., Zhou, S., Li, Y. and Yuan, Y. (2010) Enhanced performance of air-cathode two-
chamber microbial fuel cells with high-pH anode and low-pH cathode. Bioresour. Technol.
101(10), 3514-3519.
Zou, S. and He, Z. (2016) Enhancing wastewater reuse by forward osmosis with self-diluted
commercial fertilizers as draw solutes. Water Res. 99, 235-243.
Zou, S., Qin, M., Moreau, Y. and He, Z. (2017) Nutrient-Energy-Water Recovery from Synthetic
Sidestream Centrate Using a Microbial Electrolysis Cell - Forward Osmosis Hybrid
System. J Clean Prod. 154, 16-25.