resource recovery-based sustainable water systems
TRANSCRIPT
Date: February 10, 2017
Resource Recovery-based
Sustainable Water Systems
- the City of Tomorrow
Xin (Cissy) Ma
Office of Research and Development
National Risk Management Research Laboratory
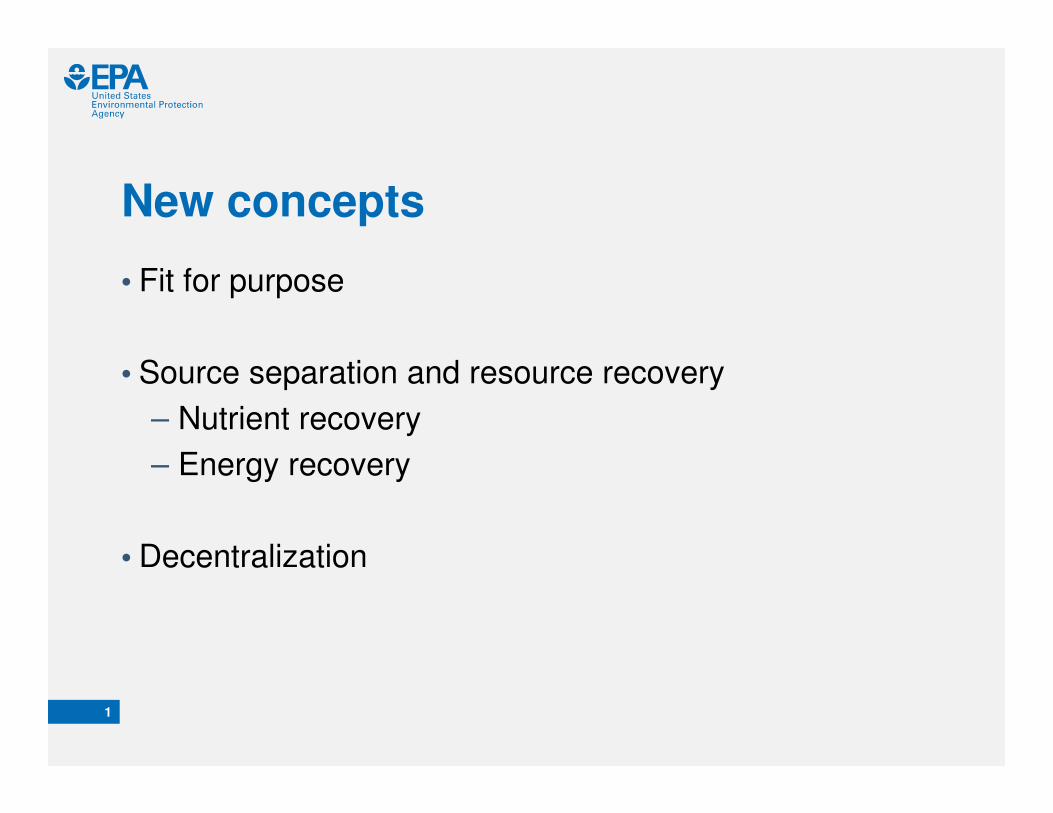
New concepts
• Fit for purpose
• Source separation and resource recovery
– Nutrient recovery
– Energy recovery
• Decentralization
1

New concepts
• Fit for purpose
• Source separation and resource recovery
– Nutrient recovery
– Energy recovery
• Decentralization
2

3
Water Demand and Water Use

Fit for Purpose
• Dual water supply systems
• Non-potable water source “Clean water”
– water reuse from treated greywater and rainwater
Alternative unit processes for non-potable water treatment
• Membrane bioreactors
• Wetland treatment
• Green infrastructure
4

AeMBR and AnMBR Energy Demand Comparison for High Density
Urban Land Use (MJ/Year)
Cashman, S., Mosley, J., Ma, X., Garland, J., Cashdollar, J., Bless D. (2016) Life Cycle Assessment and Cost Analysis of Water and
Wastewater Treatment Options for Sustainability: Influence of Scale on Membrane Bioreactor Systems. EPA 600 R-16 243.

Combined Sewer System vs Green Infrastructure
6
U.S. EPA. Protecting Water Quality from Urban Runoff; http://www.epa.gov/npdes/pubs/nps_urban-facts_final.pdf, 2003.
The role of ecosystem services in urban water systems

New concepts
• Fit for purpose
• Source separation and resource recovery
– Nutrient recovery
– Energy recovery
• Decentralization
7

Mixed Wastewater vs Source Separation
• There is no such thing as waste, only wasted resources.
• Wastewater composition
8
Urine0
5
10
15
20
25
30
35
40
45
N P K Ca Mg Na Cl S CODtotal
12
13
0.2 0.2
4
7
1
12
1.4 0.7 0.5 0.5 0.2 0.1 0 0.1
41
g/p
.d
Urine
Feces
Stichting Toegepast Onderzoek Waterbeheer (STOWA) (2002). Separate urine collection and treatment:
Options for sustainable wastewater systems and mineral recovery, STOWA.

Urine Separating Toilet
9
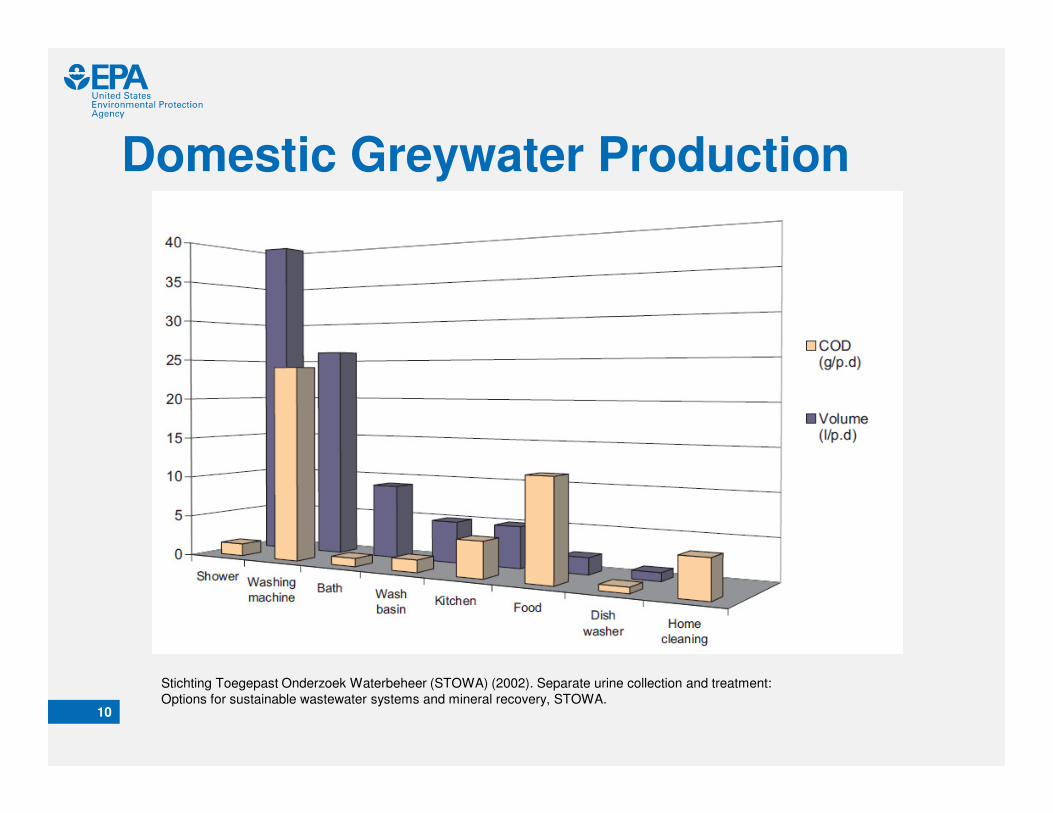
Domestic Greywater Production
10
Stichting Toegepast Onderzoek Waterbeheer (STOWA) (2002). Separate urine collection and treatment:
Options for sustainable wastewater systems and mineral recovery, STOWA.
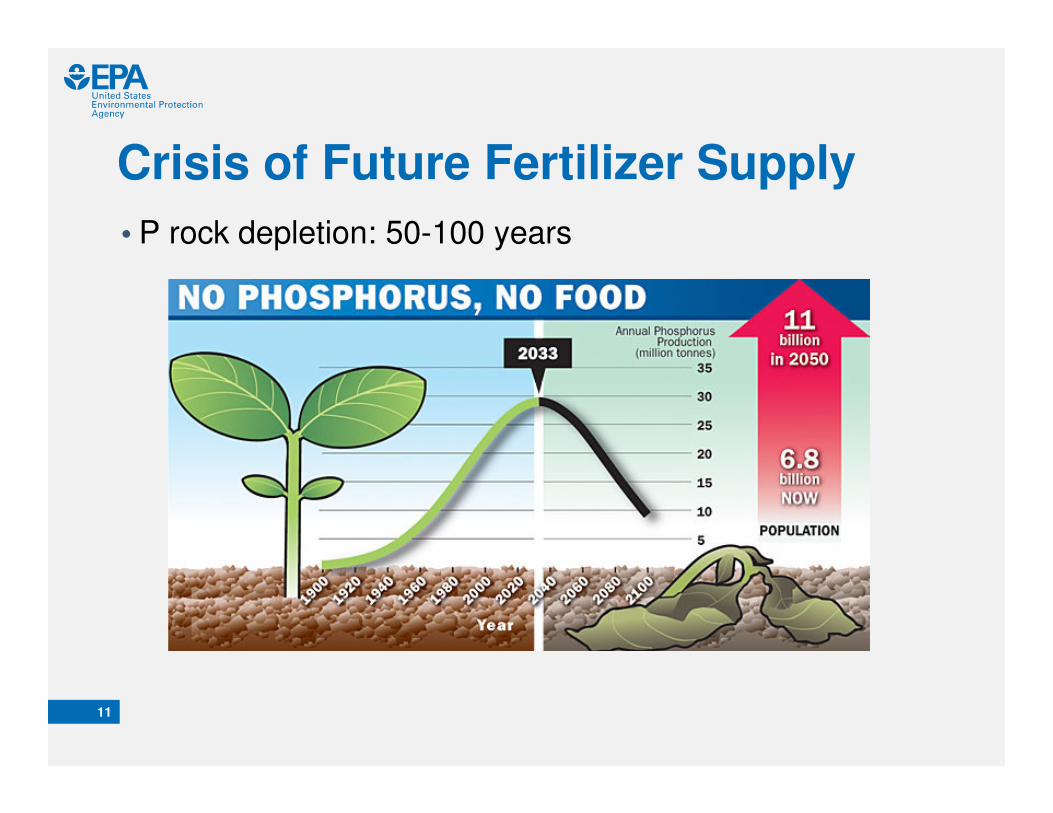
Crisis of Future Fertilizer Supply
• P rock depletion: 50-100 years
11

12
Crisis of Future Fertilizer Supply
• Consume 3-5% of the world’s natural gas production
• 500 million tons of fertilizer per year supporting 40% of the worlds’s population
• Nitrogen fixation - Haber Bosch Process
Fritz Haber1918 Nobel Prize
Professor who
Demonstrated
feasibility
Carl Bosch1931 Nobel Prize
Engineer who
scaled up process
• Smil, V., Enriching the Earth: Fritz Haber, Carl Bosch, and the Transformation of World Food Production The MIT Press Cambridge, MA, 2004.
• Fryzuk, M. D. Nature 427, p 498, 5 Feb 2004

13
Urine as a Nutrient Source
• Source separate the flows to maximize recovery
• Struvite crystalization
Mg2+ + NH4+ + PO4
3- = MgNH4PO4·6H2O
Magnesium Ammonium Phosphate
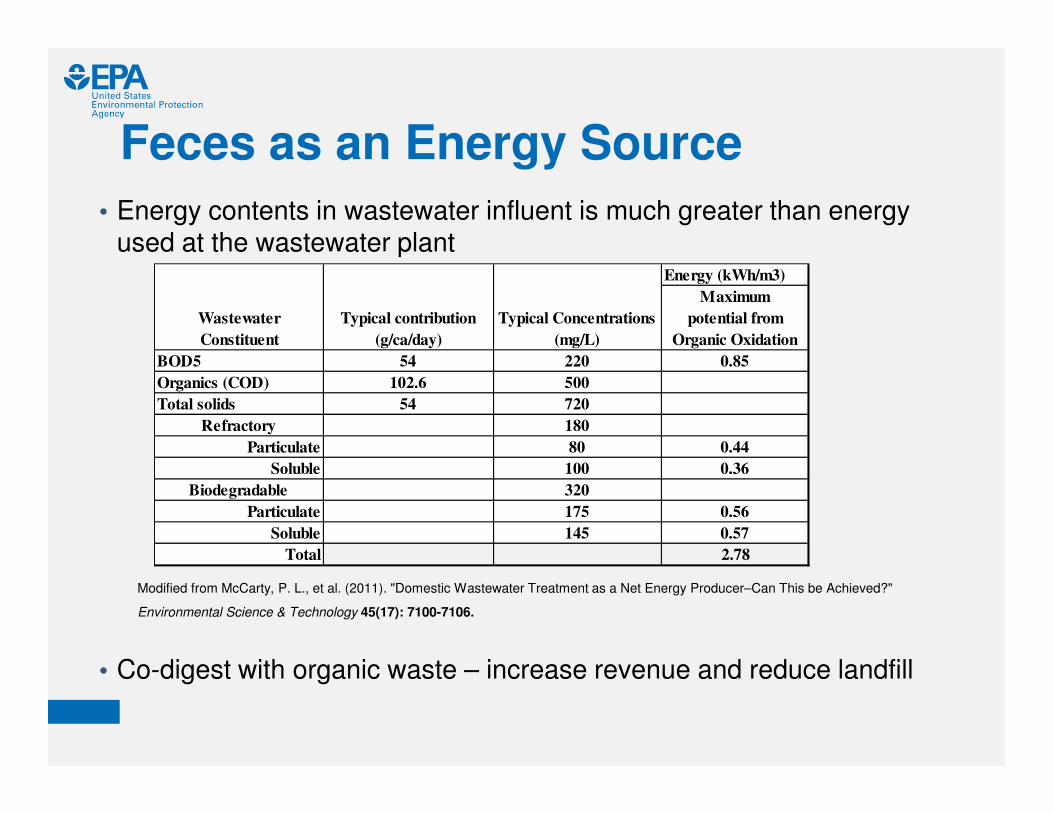
Feces as an Energy Source
• Energy contents in wastewater influent is much greater than energy used at the wastewater plant
• Co-digest with organic waste – increase revenue and reduce landfill
Energy (kWh/m3)
Maximum
potential from
Organic Oxidation
BOD5 54 220 0.85
Organics (COD) 102.6 500
Total solids 54 720
Refractory 180
Particulate 80 0.44
Soluble 100 0.36
Biodegradable 320
Particulate 175 0.56
Soluble 145 0.57
Total 2.78
Wastewater
Constituent
Typical contribution
(g/ca/day)
Typical Concentrations
(mg/L)
Modified from McCarty, P. L., et al. (2011). "Domestic Wastewater Treatment as a Net Energy Producer–Can This be Achieved?"
Environmental Science & Technology 45(17): 7100-7106.

Energy Recovery Technology
• Microbial Fuel Cell
• Anaerobic digestion – Combined heat and power
15
biogas Electricity
Heat

New concepts
• Fit for purpose
• Source separation and resource recovery
– Nutrient recovery
– Energy recovery
• Decentralization
16

Current Urban Water Systems - Cincinnati
17

Water Systems for the City of Tomorrow
18 Ma, X., Xue, X., Gonzalez-Mejia, A., Garland, J., and Cashdollar, J. (2015). "Sustainable Water Systems for the City of Tomorrow —
A Conceptual Framework." Sustainability 7(9): 12071

Water Systems for the City of Tomorrow
19 Ma, X., Xue, X., Gonzalez-Mejia, A., Garland, J., and Cashdollar, J. (2015). "Sustainable Water Systems for the City of Tomorrow —
A Conceptual Framework." Sustainability 7(9): 12071
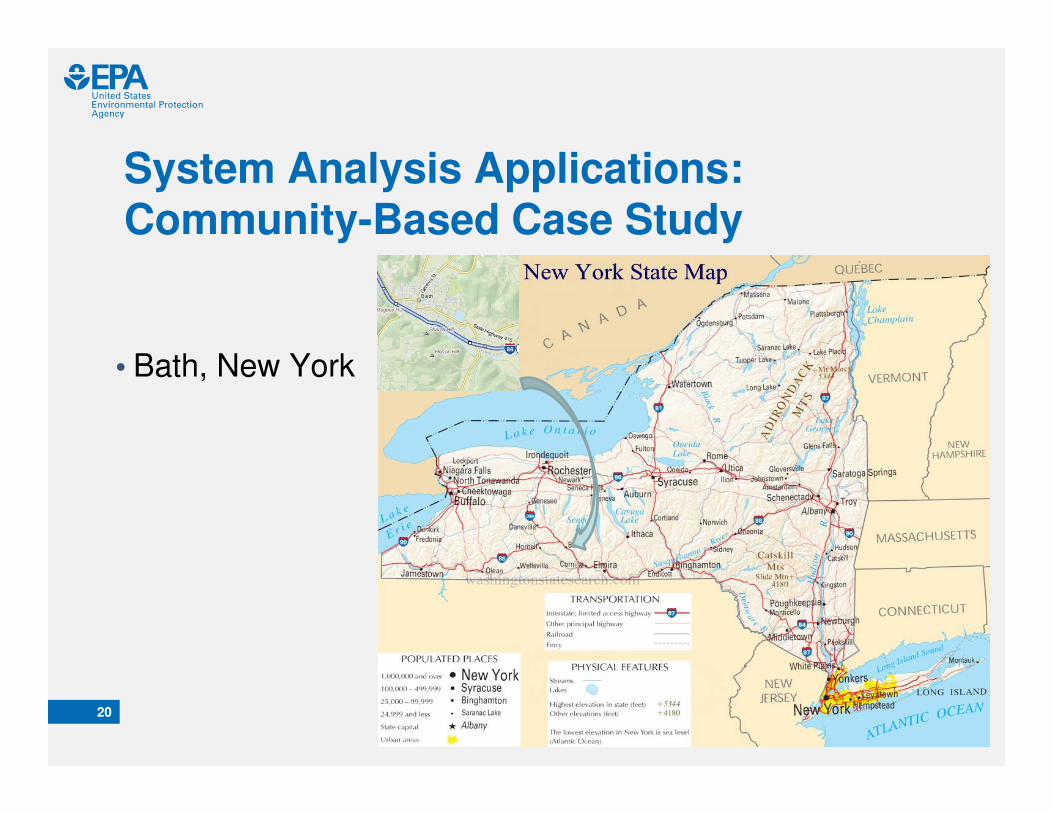
System Analysis Applications: Community-Based Case Study
• Bath, New York
20

Bath Project Background & Goals
21
• A plant upgrade is required to meet permitted effluent
nutrient standards
• Assess comparative environmental impacts of legacy
and upgraded treatment plants
• Quantify the environmental effect of anaerobic
digestion + composting
• Life cycle cost assessment of upgraded treatment plant

System Diagram

23
Legacy system

24
Upgraded system
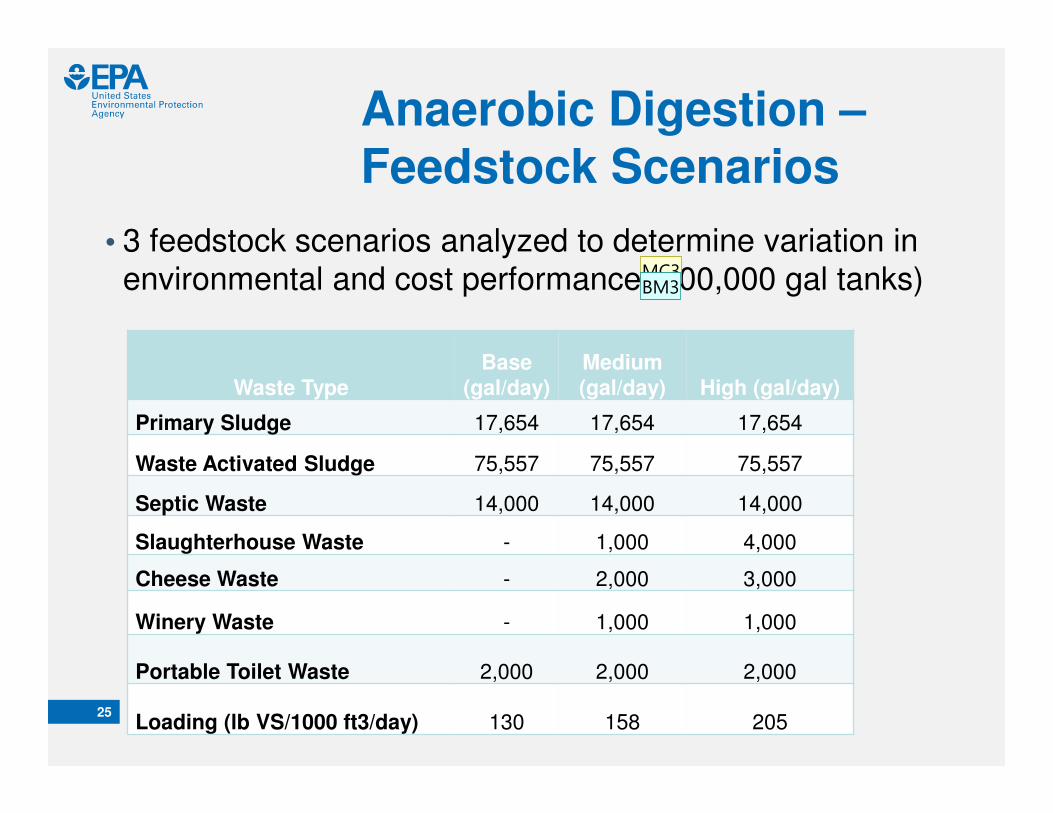
Anaerobic Digestion –Feedstock Scenarios
• 3 feedstock scenarios analyzed to determine variation in
environmental and cost performance (300,000 gal tanks)
25
Waste TypeBase
(gal/day)Medium (gal/day) High (gal/day)
Primary Sludge 17,654 17,654 17,654
Waste Activated Sludge 75,557 75,557 75,557
Septic Waste 14,000 14,000 14,000
Slaughterhouse Waste - 1,000 4,000
Cheese Waste - 2,000 3,000
Winery Waste - 1,000 1,000
Portable Toilet Waste 2,000 2,000 2,000
Loading (lb VS/1000 ft3/day) 130 158 205
MC3BM3

Slide 26
MC3 So this is different feed size, right?Ma, Cissy, 10/17/2016
BM3 refers to 3 feedstock quantity scenarios.Ben Morelli, 10/26/2016

Anaerobic Digestion Operational
Scenarios
26
Parameter Name
Low Yield Base Yield High Yield
UnitsValue Value Value
Percent Volatile Solids Reduction 40 50 60 %
Biogas Yield
Base 12.0 15.0 24.5 ft3/lb VS destroyed
Medium 13.8 18.5 25.1 ft3/lb VS destroyed
High 15.7 22.2 27.3 ft3/lb VS destroyed
Methane Content of Biogas 55 60 65 % w/w
Biogas Heat Content (MJ/ft3) 0.59 0.64 0.68 MJ/ft3
Electrical Efficiency 33 36 40 %
Thermal Efficiency 46 51 56 %
Reactor Heat Loss Northern US Northern US Southern US n.a.
Anaerobic Digestion –Performance Scenarios
MC1BM6

Slide 27
MC1 How about the different levels of emission (compost, etc.)? Since emission is an important parameter influencing GHP.Ma, Cissy, 10/17/2016
BM6 Added a slide (next in presentation)Ben Morelli, 10/26/2016
27
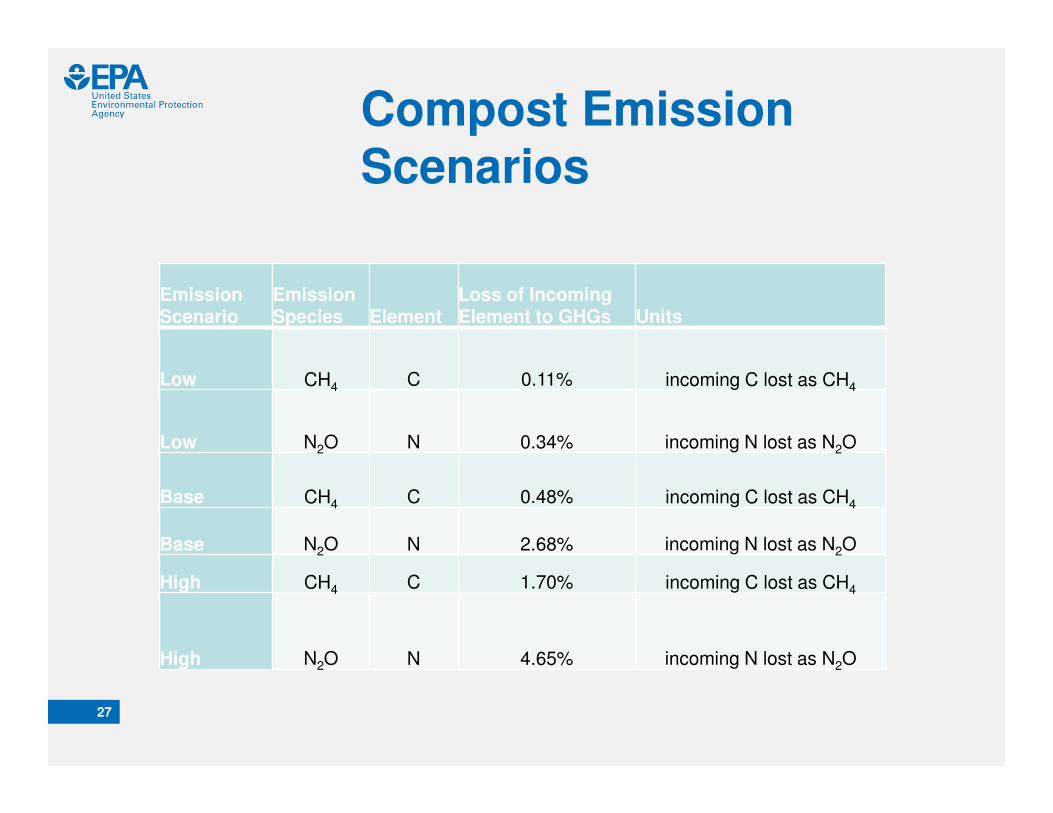
Compost EmissionScenarios
Emission Scenario
Emission Species Element
Loss of Incoming Element to GHGs Units
Low CH4 C 0.11% incoming C lost as CH4
Low N2O N 0.34% incoming N lost as N2O
Base CH4 C 0.48% incoming C lost as CH4
Base N2O N 2.68% incoming N lost as N2O
High CH4 C 1.70% incoming C lost as CH4
High N2O N 4.65% incoming N lost as N2O

Eutrophication ImpactsBase Results
• The estimated impact of nutrients (N and P) on waterways
is expected to be reduced by ~46% as a result of the
planned upgrades.
28
0.0236
0.0128
-0.005
0.000
0.005
0.010
0.015
0.020
0.025
Legacy Upgraded
kg N eq/m
3wastewater treated
Electricity Natural Gas ChemicalsUnit Process Emissions Effluent Release TransportLandfill Composting Land ApplicationAvoided Products Infrastructure DieselTotal
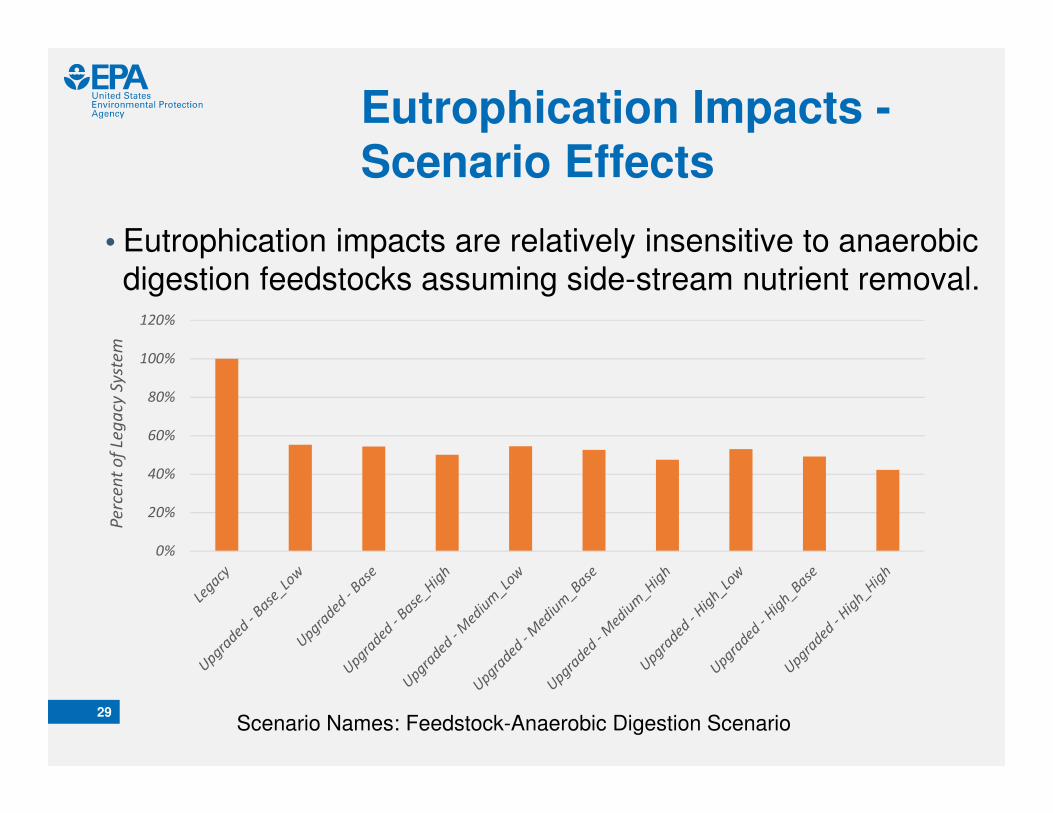
Eutrophication Impacts -
Scenario Effects
• Eutrophication impacts are relatively insensitive to anaerobic
digestion feedstocks assuming side-stream nutrient removal.
29
0%
20%
40%
60%
80%
100%
120%
Pe
rce
nt
of
Leg
acy
Sys
tem
Scenario Names: Feedstock-Anaerobic Digestion Scenario

Global Warming ImpactsBase Results
• Global warming potential increases by ~50% due to
composting, process emissions, and increased electricity
use for the upgraded system.
30
0.894 1.35
-0.5
0.0
0.5
1.0
1.5
Legacy Upgraded
kg C
O2
eq
/m3
wa
ste
wa
ter
tre
ate
d
Preliminary/Primary Biological TreatmentFacilities Sludge Handling and TreatmentSludge Disposal Effluent ReleaseTotal

Global Warming –Scenario Effects
31
0%
50%
100%
150%
200%
250%
300%
350%
Pe
rce
nt
of
Leg
acy
Sys
tem
Scenario Names: Feedstock-AD ScenarioLow Emissions Base Emissions High EmissionsComposting Scenarios

Cumulative Energy Demand (CED)
Base Results
• CED increases by 22 percent for the upgraded system,
mainly due to electricity use.
32
8.71 10.6
-2.0
0.0
2.0
4.0
6.0
8.0
10.0
12.0
Legacy Upgraded
MJ/
m3
wa
ste
wa
ter
tre
ate
d
Preliminary/Primary Biological Treatment
Facilities Sludge Handling and Treatment
Sludge Disposal Effluent Release

Cumulative Energy Demand (CED)
Base Results
• Results displayed by process category
33
8.7110.6
-5.0
-3.0
-1.0
1.0
3.0
5.0
7.0
9.0
11.0
13.0
15.0
Legacy UpgradedMJ/m
3wastewater treated
Electricity Natural Gas ChemicalsUnit Process Emissions Effluent Release TransportLandfill Composting Land ApplicationAvoided Products Infrastructure DieselTotal

CED – Scenario Effects
-100%
-50%
0%
50%
100%
150%
Pe
rce
nt
of
Lega
cy S
yste
m
Scenario Names: Feedstock-AD ScenarioLow Emissions Base Emissions High Emissions
Compost Scenarios34
Initial energy burden of nutrient
removal
� Initial energy burden of nutrient removal can be
reduced or reversed by anaerobic digestion.

Cost AnalysisUpgraded System
35
$29
$34
$46
$28
$33
$46
$26
$32
$44
$25
$31
$44
$23
$30
$42
$20
$28
$40
-$10
$0
$10
$20
$30
$40
$50
Low
Cost
Base
Cost
High
Cost
Low
Cost
Base
Cost
High
Cost
Low
Cost
Base
Cost
High
Cost
Low
Cost
Base
Cost
High
Cost
Low
Cost
Base
Cost
High
Cost
Low
Cost
Base
Cost
High
Cost
Mil
lio
n D
oll
ars
Construction ($) Operation ($/yr) Maintenance ($/yr) Material ($/yr) Chemical ($/yr) Energy ($/yr) Total NPV

AD and Compost Payback
• Difficult to achieve with low acceptance of high strength
organic waste.
36
Scenario (Feedstock Scenario-Anaerobic Digester Scenario)
Low Cost Scenario Base Cost Scenario High Cost Scenario
Anaerobic Digester
Composting Facility
Anaerobic Digester
Composting Facility
Anaerobic Digester
Composting Facility
Base Feed-Low AD None None None None None None
Base Feed-Base AD None None None None None None
Base Feed-High AD 72 None None None None None
Medium Feed-Low AD None 39 None None None None
Medium Feed-Base AD 271 82 None None None None
Medium Feed-High AD 32 440 177 None None None
High Feed-Low AD 219 11 None None None None
High Feed-Base AD 40 13 251 None None None
High Feed-High AD 16 18 41 None 45 None

Take Home Messages
37
• Management of composting and AD facilities are key to maximizing environmental performance.
• Addition of supplemental high strength organic waste benefits the majority of environmental impact categories and cost.
• Environmental benefits of AD are much easier to achieve than unit payback at this small scale.
• Electricity use is a key contributor to environmental impact, indicating the potential benefit of investing in energy efficiency.

Next Steps
• Energy recovery – increase AD size and acceptance of more
high strength organic waste, including their current treatment
processes
• Nutrient management – nutrient removal vs nutrient recovery
• Broader system analysis – environmental impacts (e.g., energy
and nutrient) in the watershed
• Constructed wetland – water reuse
• Revenue analysis – LCC on whether RRH can bring steady
revenue for utility to offset the investment cost
38