resource allocation and optimisation model raom october 2003
TRANSCRIPT

Resource allocation and optimisation model
Resource allocation and optimisation model
RAOMOctober 2003
2
Resource allocation and optimisationResource allocation and optimisation
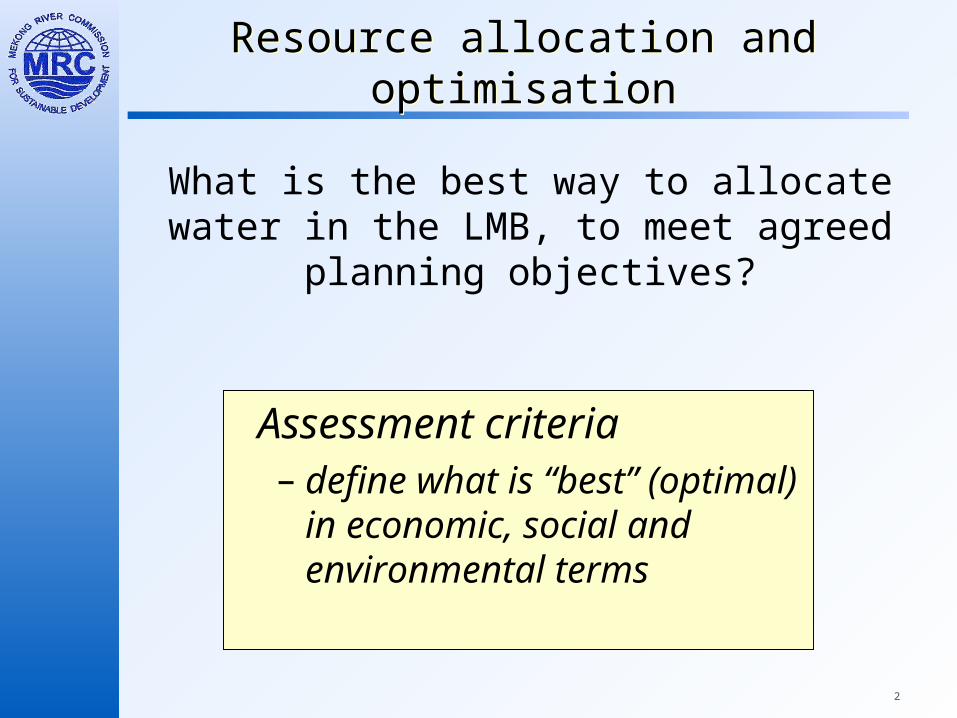
What is the best way to allocate water in the LMB, to meet agreed planning objectives?
Assessment criteria– define what is “best” (optimal)
in economic, social and environmental terms
3
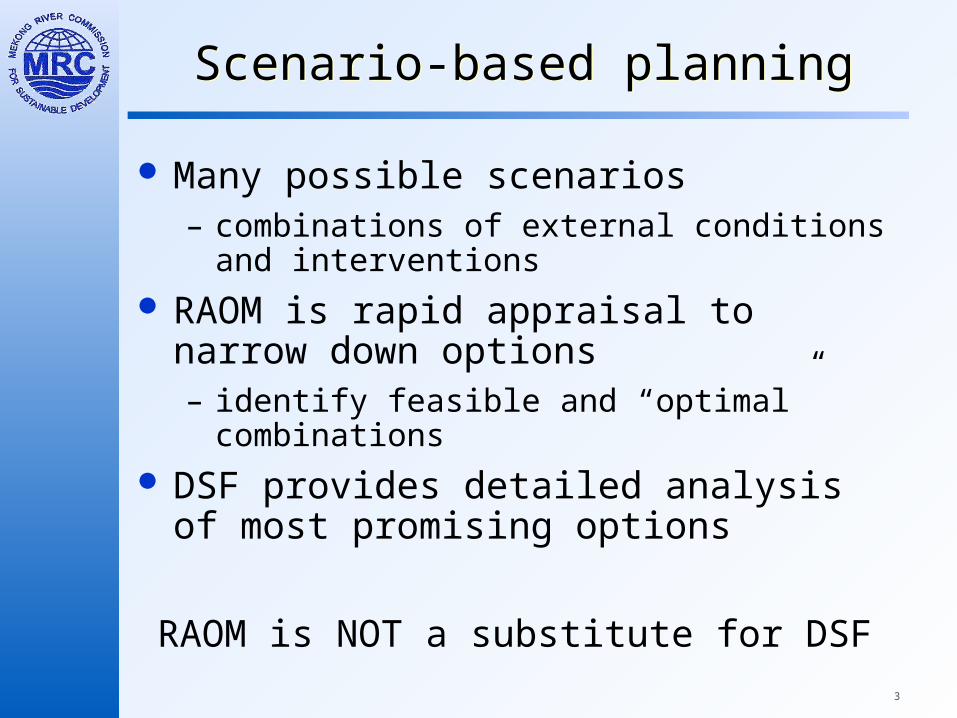
Many possible scenarios– combinations of external conditions and
interventions
RAOM is rapid appraisal to narrow down options– identify feasible and “optimal” combinations
DSF provides detailed analysis of most promising options
RAOM is NOT a substitute for DSF
Scenario-based planningScenario-based planning

4
Resource Allocation and Optimisation Model
Resource Allocation and Optimisation Model
Simplified hydrological model plus optimisation tool
Model being developed for BDP by Halcrow– spreadsheet based (Excel plus “What’s Best”®)
– fast and easy to run
– “lumped” model – NOT DETAILED

5
RAOMRAOM 10 sub-basins (BDP sub-areas)
Monthly time-step

6
OptimsationOptimsation
Values can be assigned to each water use Can optimise for different values
– economic return
– environmental values
– combination
Optimiser allows us to identify the “best” mix of uses to meet agreed objectives– within identified constraints

7
Storage
Irrigation
Water supply
Hydropower
Flow from catchment
INFLOW
OUTFLOW
$
In-stream use

8
Storage
Irrigation
Water supply
Hydropower
Flow from catchment
INFLOW
OUTFLOW
Z
$Zenv
Zfish
Zflood
In-stream use

9
1
2
3
10
....
Optimisation
$ Economic
Z Environment
$+Z Combined
10
Data required - hydrologyData required - hydrology
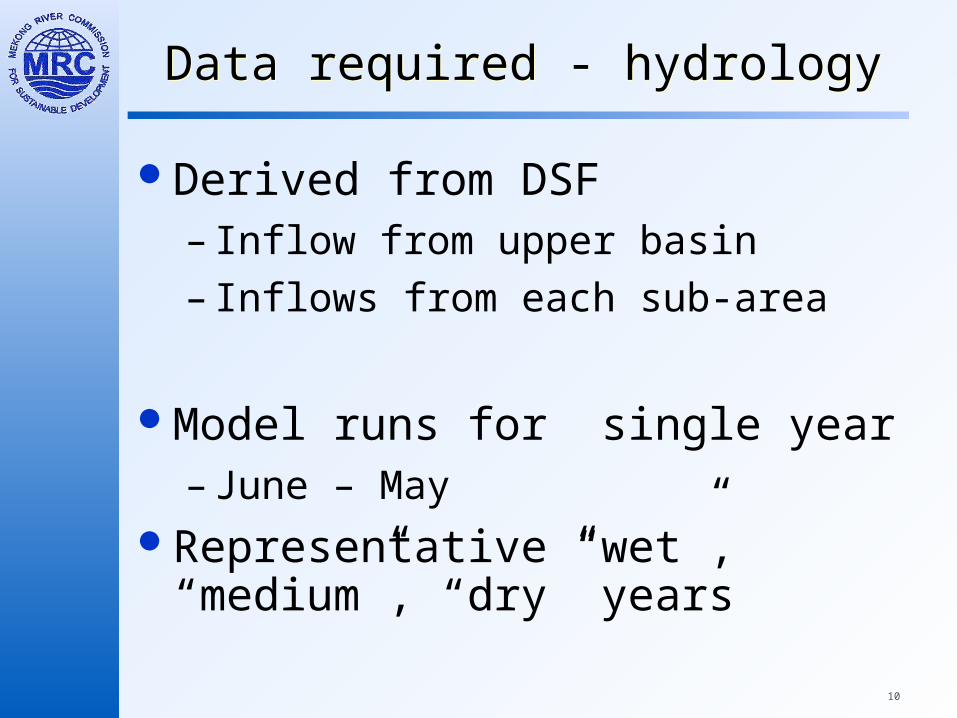
Derived from DSF– Inflow from upper basin
– Inflows from each sub-area
Model runs for single year – June – May
Representative “wet”, “medium”, “dry” years

11
0
20000
40000
60000
80000
100000
120000
140000
Jan-
91
Jul-9
1
Jan-
92
Jul-9
2
Jan-
93
Jul-9
3
Jan-
94
Jul-9
4
Jan-
95
Jul-9
5
Jan-
96
Jul-9
6
Jan-
97
Jul-9
7
Jan-
98
Jul-9
8
Jan-
99
Jul-9
9
Jan-
00
Jul-0
0
Means: Chiang Khan: Flow
Means: Chiang Saen: Flow
Means: Kho Khel: Flow
Means: Kratie: Flow
Means: Luang Prabang: Flow
Means: Mukdahan: Flow
Means: Neakluong: Flow
Means: Pak Mun: Flow
Means: Pakse: Flow
Means: Phnom Penh (Bassac): Flow
Means: Phnom Penh (Mekong): Flow
Means: Stung Treng: Flow
1999medium
1998low
2000high

12
Data required - damsData required - dams
Size of reservoirsPurpose
– Irrigation, hydropower, mixed
Water release pattern– from hydrological records, or calculated
Value of power production

13
Data required - irrigationData required - irrigation
Areas irrigated– Source of water (unregulated
catchment flow, mainstream river, irrigation or hydropower reservoir)
Crop water requirements (by month)Crop value

14
Data required - irrigationData required - irrigation
Basin 4 km2crop 1
crop 2
crop 3
crop 4
Value ($/km2) 100 220 300 300
Unregulated 1000
Regulated Irrigation 200
Hydropower etc 20
Main river reach 50
15
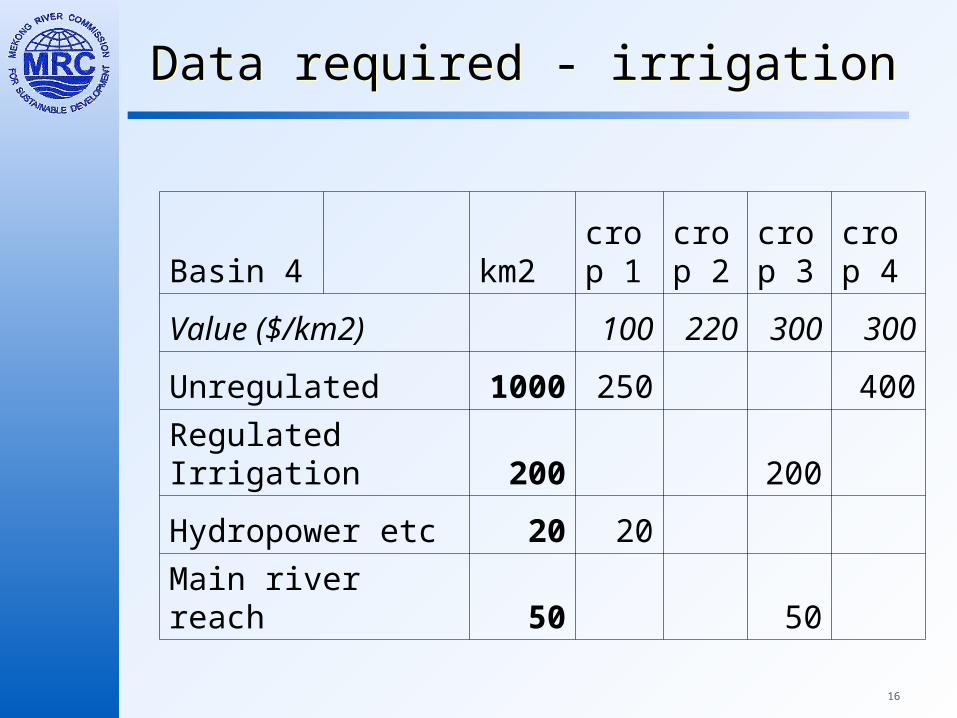
Data required - irrigationData required - irrigation
0.00
0.05
0.10
0.15
0.20
0.25
J J A S O N D J F M A M
Crop 1
Crop 2
Crop 3
Crop 4
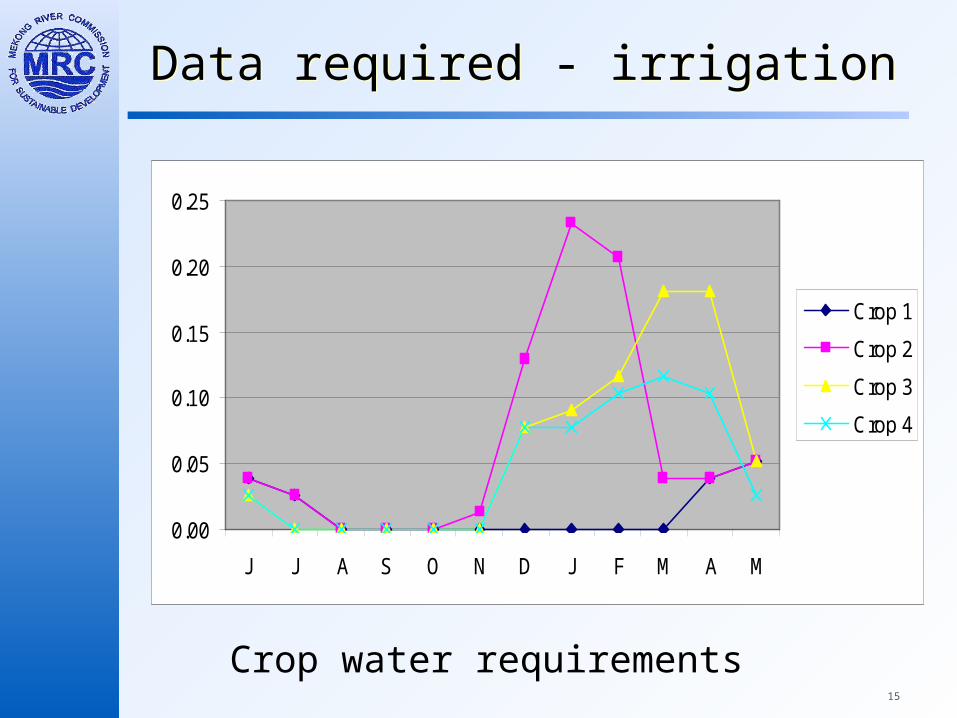
Crop water requirements
16
Data required - irrigationData required - irrigation
Basin 4 km2crop 1
crop 2
crop 3
crop 4
Value ($/km2) 100 220 300 300
Unregulated 1000 250 400
Regulated Irrigation 200 200
Hydropower etc 20 20
Main river reach 50 50

17
0
20000
40000
60000
80000
100000
120000
J J A S O N D J F M A M
1998/9
1999/2000
2000/01
Baseline

18
Scenario 1: increased irrigationScenario 1: increased irrigation
Sub-area Baseline Scenario 1
Area Irrigated km2
1 100 400
2 2020 2222
3 5100 5600
4 1270 2750
5 15000 16500
6 400 900
7 1500 3500
8 200 2150
25590 34022

19
Dry year 1998
Medium year 1999
Wet year2000
June 1% 0% 0%
July 0% 0% 0%
August 0% 0% 0%
September 0% 0% 0%
October 0% 0% 0%
November 0% 0% 0%
December 3% 3% 3%
January 5% 5% 5%
February 10% 10% 10%
March 11% 11% 10%
April 8% 8% 10%
May 1% 1% 1%
Flow decrease at Kratie with increased irrigation
20
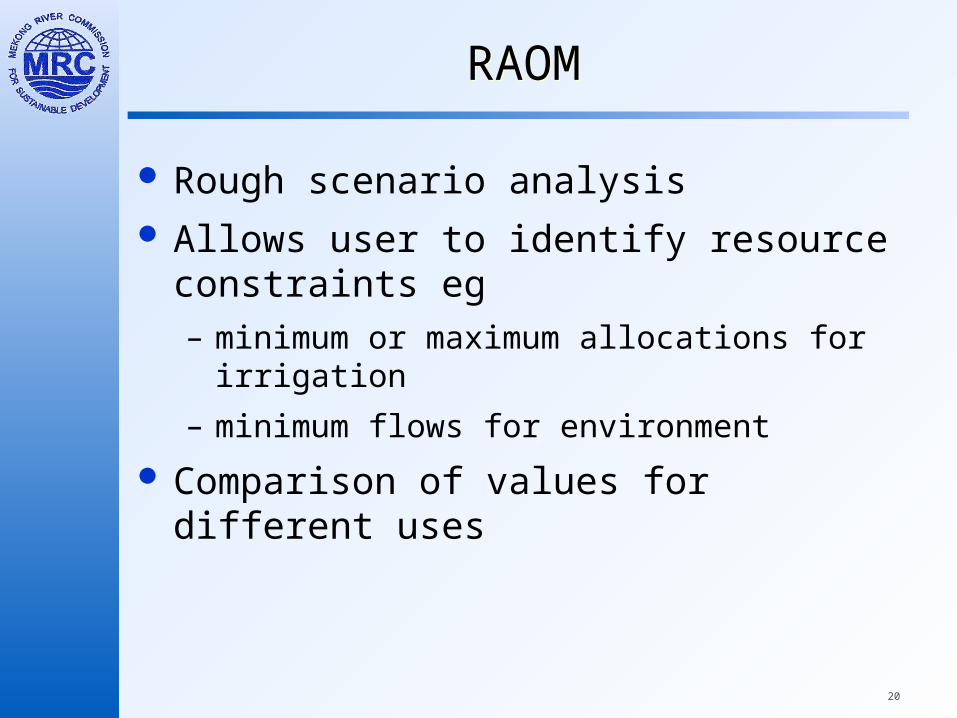
RAOMRAOM
Rough scenario analysis Allows user to identify resource constraints
eg– minimum or maximum allocations for irrigation
– minimum flows for environment
Comparison of values for different uses
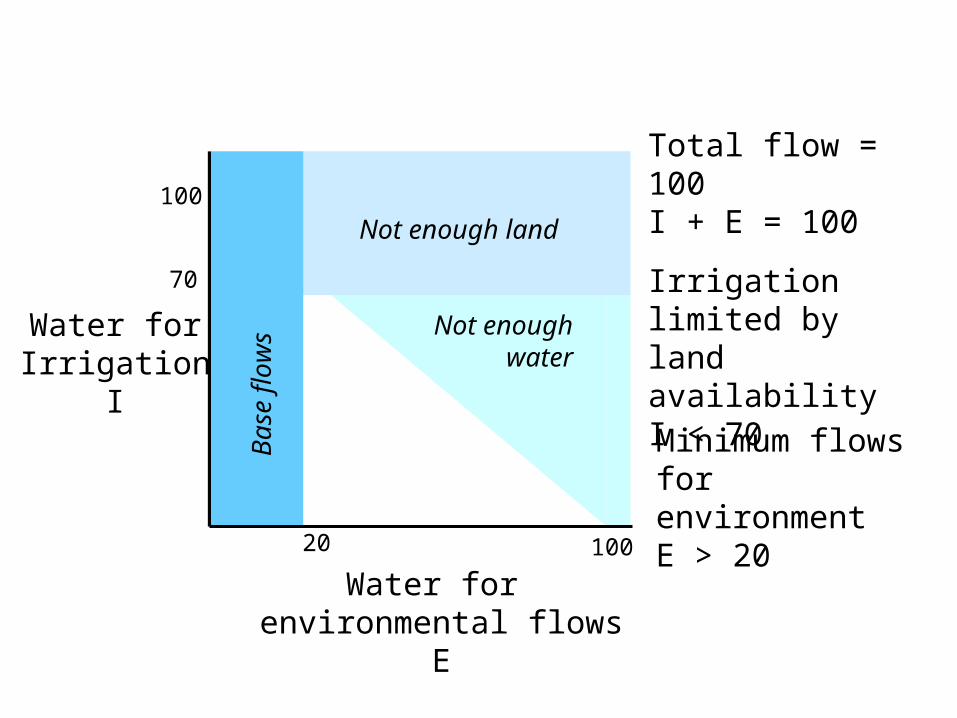
Not enough water
70
Not enough land
Total flow = 100I + E = 100
Irrigation limited by land availabilityI < 70
100
100
Minimum flows for environmentE > 20
20
Ba
se fl
ow
sWater forIrrigation
I
Water for environmental flows
E

But which allocation is optimal?
100
100
70
20
Water forIrrigation
I
Water for environmental flows
E
INFEASIBLE
FEASIBLE
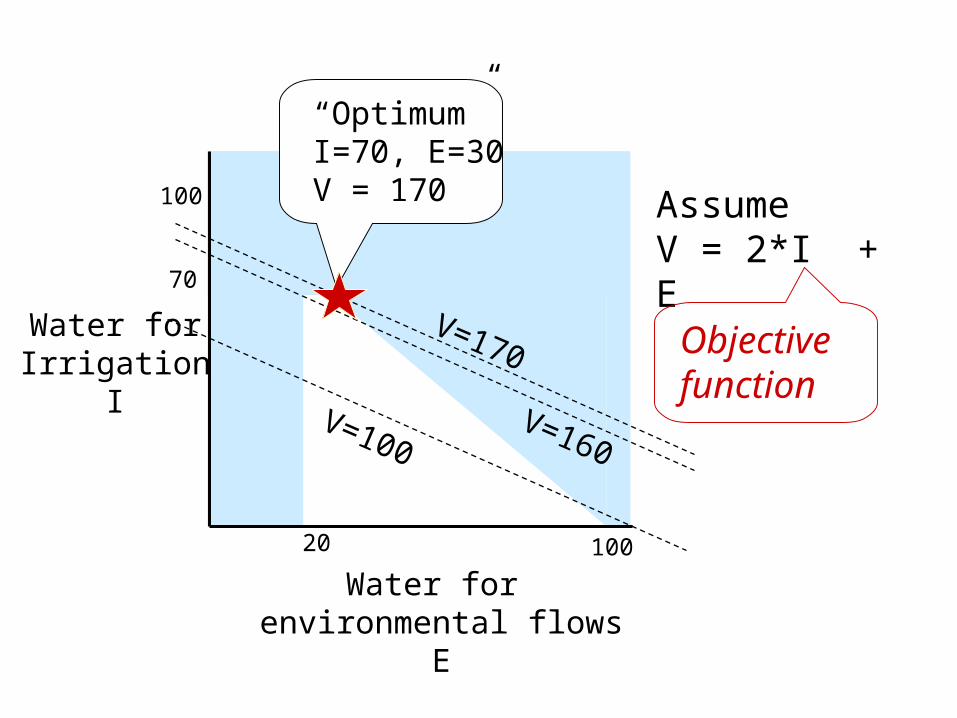
AssumeV = 2*I + E
100
100
70
20
Water forIrrigation
I
Water for environmental flows
E
V=100
V=170
V=160
“Optimum”I=70, E=30V = 170
Objective function

24
Data inputsData inputs
Hydrological data from WUP DSF– inflows– catchment flows– storage for irrigation, hydropower– extraction for irrigation, water supply– outflows
25
Data inputsData inputs
Hydrological data from WUP DSFEconomic data compiled by BDP
– crop types and gross margins
– value of hydropower production

26
Data inputsData inputs
Hydrological data from WUP DSFEconomic data compiled by BDPBDP and IBFMP will assess “values”
of different uses– input from EP, FP, FMP, AIFP, NP
– need to develop links between river flows and environment (flood extent, wetland quality, fish productivity etc)
environmental indices
– costs / value of environmental flows and floods
27
Data inputsData inputs
Hydrological data from WUP DSFEconomic data compiled by BDPBDP and IBFMP will assess “values”
of different uses
Hydrological modeling in RAOM is consistent with the WUP Basin Models,
but much simplified

28
WUP DSFWUP DSF
DSF analyses impacts of particular scenarios
– detailed hydrological model
– environmental (and social) impacts
– detailed spatial and temporal analysis
– complex
– time-consuming

29
ISIS (below Kratie)> 800 sub-basinsHourly time-step
SWAT 172 sub-basinsDaily time-step
DSF