resolving the skills shortage in the eca region: a policy...
TRANSCRIPT

89
C H A P T E R 3
Resolving the Skills Shortage in the ECA Region: A Policy Framework
This chapter identifies the major impediments that prevent the educa-tion system from delivering the skills that are being demanded by the labor markets as identified in the previous chapters. It then offers a policy framework and policy directions to help overcome these impediments. The impediments and a policy framework for addressing them guide the discussion of education system reform for the remainder of the book.
Here we argue that the three most pressing problems of ECA educa-tion systems that get in the way of imparting the needed skills are: (1) the lack of data on the skills and competencies that students actually acquire as a result of the educational process; (2) the legacy of central planning—particularly its effect on the management of education sys-tems in the region—which makes education systems inflexible and resis-tant to the initiative of front-line actors (who can actually improve education); and (3) the inefficient use of resources, a problem that has become particularly acute in the current economic climate. Certainly these are not the only impediments to making education systems more responsive to skills needs in the region. However, they are common to all ECA countries and lie at the heart of addressing the skills deficiencies discussed in chapter 2.1
SNJD_89-114.indd 89SNJD_89-114.indd 89 9/27/11 6:54:27 PM9/27/11 6:54:27 PM
90 Skills, Not Just Diplomas
The lack of data on student performance, the legacy of central planning, and the inefficient use of resources affect all levels of education in the ECA region, but are most apparent at the pre-university level. This level is the foundation of the education system in every country and gen-erally absorbs two-thirds of total education funding in the ECA region. The same three impediments affect tertiary education in a slightly differ-ent way, as this sector has already undergone significant reform over the past 20 years, during which time it has doubled or tripled in size in many countries (see chapter 5). Because most ECA countries do not yet have adult education systems in the modern sense, these impediments cannot be fairly characterized as problems of this sector, though the policy recommendations offered in this chapter are applicable to adult educa-tion also.
To be fair, ECA countries face these impediments to different degrees, but none have fully escaped the legacy of central planning, which empha-sized strict top-down control, compliance with pre-established norms, and intensive management involvement in operational details.2 In terms of measuring the quality and relevance of education, central planning focused on generating data on inputs—that is, checking whether local actors were in compliance with detailed norms for all inputs. Yet in terms of whether students acquired skills and competencies, these systems operated with the lights off—without the information needed—and as a result, educa-tional spending in the region remains highly inefficient. Today, virtually no ECA country has been able to downsize its school network and staff in the face of falling student numbers. They are accordingly stuck with too many schools and too many teachers, which absorb resources that could other-wise be used to improve the quality of education.
Operating in the Dark: Ministries Know Too Little to Effectively Manage the Education Sector
As mentioned in chapter 2, ministries of education across ECA know far too little about the nature of the skills shortages in their economies or the strengths and weaknesses of their own education systems. As a result, they lack an important precondition for effectively managing the sector. Better data alone does not make better policies. But operating in the darkness makes it impossible to gauge the magnitude of the problems facing policy makers. This section describes the current status of educational data and policy making in the region, identifying the missing data needed and showing how their absence impedes education in the region.
SNJD_89-114.indd 90SNJD_89-114.indd 90 9/27/11 6:54:28 PM9/27/11 6:54:28 PM

Resolving the Skills Shortage in the ECA Region: A Policy Framework 91
Educational Data Focus on Diplomas, not SkillsIt is a problem worldwide that educational data tend to focus on quantity—for example, the number of enrolled and graduating students—and not the quality of education. Where international comparative data are available, they focus on the quality of primary or lower secondary education. Given that the current policy debate in the ECA region focuses on “skills,” the lack of data on educational quality is problematic, particu-larly because very few young people in the region enter the labor market with only a lower secondary education. As figure 3.1 shows, most ECA students complete at least an upper secondary degree. But with no inter-national assessment of the skills and competencies of upper secondary or tertiary graduates, it is impossible to quantify the gap in competencies between recent labor market entrants in, say, Bulgaria and Germany. The data that are available today document how many students graduate in a particular year, not what they offer employers in terms of competencies.
Lack of relevant data on students and their individual performance is particularly acute in the vocational sector because of the large variety of vocational schools in the ECA region and the (likely) heterogeneity of their student populations. The tendency of educational data to focus on quantity, rather than quality and relevance, is also acute in adult education
Figure 3.1 Educational Background of 25–34-year-olds in the ECA Region, 2006(percent)
143
2712
63
61
57
56
61
31
2540
1726
6
0
10
20
30
40
50
60
70
80
90
100
EU10+1 MI CIS W. Balkans LI CIS Turkey
compulsory or less upper secondary beyond upper secondary
Source: Author’s calculations, based on EBRD-World Bank 2006.
Note: LI = low-income, MI = middle-income.
SNJD_89-114.indd 91SNJD_89-114.indd 91 9/27/11 6:54:28 PM9/27/11 6:54:28 PM

92 Skills, Not Just Diplomas
and training. At best, current surveys in that sector measure the number of training hours and courses in which individuals participate, or whether a firm offers training. But no international comparative data yet exist to compare the quality or relevance of such training.
Narrow focus and understanding of educational quality. Many ECA countries tend to focus on their very best students and equate their performance with “quality education.” Indeed, in discussions about the quality of education generally, school principals, local education authori-ties, and representatives of education ministries often point to particular students’ accomplishments at the “Math Olympiads” as examples of how well their schools perform. Similarly, university rectors mention how many of their graduates manage to pursue further education at top uni-versities abroad.
Although it is important to create an environment where excellence can flourish, the few high-achieving students should not be the principal focus of ECA school systems, nor the criteria by which they measure their performance. Whereas the principals of ECA schools know how many of their students compete in and win Math Olympiads, they know very little about the average performance of their students, and much less about the performance of their schools vis-à-vis similar schools elsewhere in the country. As a result, policy makers have little information about the performance of the weakest students in their schools: students with a dif-ferent mother tongue, a different ethnic origin, or, simply, from economi-cally disadvantaged backgrounds. These students are most in need of support, yet, across the ECA region very little effort is made to under-stand how far behind they are and whether existing policies—such as small classes, extracurricular activities, or other interventions—are work-ing. Without relevant data, problem areas go unnoticed, and the effective-ness of policy interventions cannot be measured.
A broader understanding of educational performance relies on standard-ized tests and looks at all students, differentiating their performance by external factors (e.g., parental income and socioeconomic background). In this view, truly outstanding schools are not necessarily those with the high-est average score on standardized tests, but rather, schools that, compared to their peers, manage to generate the biggest improvements in test scores.
Limited Participation in National and International AssessmentsFor some countries in the ECA region, information weaknesses are compounded by limited participation in international student learning
SNJD_89-114.indd 92SNJD_89-114.indd 92 9/27/11 6:54:28 PM9/27/11 6:54:28 PM

Resolving the Skills Shortage in the ECA Region: A Policy Framework 93
assessments, such as PISA, PIRLS, and TIMSS. Five ECA countries (Tajikistan, Turkmenistan, Uzbekistan, Belarus, and Kosovo) have never participated in such an assessment. For these countries, it is impossible to assess the quality of even primary and lower secondary education. Moreover, three ECA countries have only just begun to participate in such assessments.
ECA countries have also been slow to use national standardized assess-ments to measure and analyze student learning outcomes, largely for historical reasons. Prior to 1990, assessing students and granting diplomas were left entirely in the hands of teachers and schools. A recent United Nations Children’s Fund (UNICEF) report argues that this approach was rooted in the philosophy “that external checks on outcomes were not needed in a tightly controlled system of educational inputs and pro-cesses.” As a result, “attempts in the early 1990s to introduce external tests and examinations ran counter to the public mood, which saw them as attempts to re-establish central control and undermine professional trust in teachers’ judgment” (UNICEF 2007, 58).
Policy makers in ECA countries are recognizing, however, that objective, standardized measures of learning outcomes are needed for a number of reasons. First, they remain the best indicator available for measuring the performance of an education system (Vegas and Petrow 2008). National and international learning assessments provide policy makers a quantitative indicator of learning outcomes that can be compared across schools and across time. These data in turn shed light on which policies are working and which need tweaking; they also illuminate weaknesses and identify areas where new policies may be needed.
Second, standardized assessments allow students and their parents to compare a student’s performance relative to his or her peers, and a school’s performance relative to that of other schools. Third, when used alongside other indicators of performance, standardized assessments can be utilized to hold education managers and teachers accountable for results. In a decentralized education system in which local authorities play an important role in day-to-day management, such instruments are especially important for a central government to identify system needs, direct funding where it is most needed, and tailor new policies to support schools and local authorities, as needed (see box 3.1).
Limited experience of using data to drive educational policy. Despite some progress in developing national learning assessments and
SNJD_89-114.indd 93SNJD_89-114.indd 93 9/27/11 6:54:28 PM9/27/11 6:54:28 PM

94 Skills, Not Just Diplomas
participating in international assessments, no country in the ECA region has yet moved from regularly gathering data on learning outcomes to using this data to improve policy making. The simple reason is that each step along the path shown in figure 3.2 requires time and capacity building. Specifically, moving from a culture where little or no data are available to a culture where data are gathered, analyzed, disseminated, and actively used to inform educational policies requires new skills.
On a positive note, some countries in the region (primarily the new member states of the EU) now have several years’ experience with performance measurement, both in terms of establishing their own national assessment centers and participating in several rounds of international assessments (see figure 3.3). This group of countries is gradually adding the capacity to analyze test scores to design better policies. However, this book finds that no ECA country has, as of 2010, actually reached this stage. Less encouraging, a large number of coun-tries in the region (mostly the low-income CIS countries, but also Turkey and Belarus) have either made no or only small steps in this direction (see far left column in figure 3.3). If this latter group of
Box 3.1
The Value of Standardized External Student Assessments in ECA Countries
When small questionnaires on students’ socioeconomic backgrounds are
administered together with standardized tests (e.g., PIRLS, PISA, TIMSS—see
chapter 2), school systems can gauge their performance in imparting knowl-
edge and skills to their weakest students, who are often socioeconomically
disadvantaged. These students will never compete in Math Olympiads. They
drop out of school earlier than their peers, and, because they are marginal stu-
dents, never show up in national averages. Yet, an important strength of a school
system is measured by how many of these students—those with the weakest
parental support—acquire competencies needed for the labor market. Indeed,
the most successful school systems in the world, Finland and the Republic of
Korea among them, show that the way to raise overall educational quality for all
students is to focus on raising the educational quality provided to the lowest-
achieving part of the student population.
SNJD_89-114.indd 94SNJD_89-114.indd 94 9/27/11 6:54:29 PM9/27/11 6:54:29 PM

Resolving the Skills Shortage in the ECA Region: A Policy Framework 95
countries has begun to participate in international assessments, it has only been quite recently.
No systematic tracking of graduates’ employment outcomes. When stu-dents graduate, ministries of education in the ECA region do not system-atically collect, analyze, and disseminate information on their employment outcomes. Such information is useful for helping policy makers and higher education institutions detect which programs and fields of study are in high demand among employers. Moreover, such information can help students make better choices about which university to attend and which field of study to pursue.
Several OECD countries provide examples of how data on graduation can be collected and disseminated. Norway has tracked such data since 1972; Italy, since 1998; and the Netherlands, since 1989. In the Netherlands, almost all graduates of higher education institutions are surveyed a year and a half after they graduate. The survey collects com-prehensive information on a range of different topics, including informa-tion on the school-to-work transition (asking such questions as, How long did it take to find a job? Did it involve unemployment spells?); the type and quality of employment, if any (e.g., sector and educational and skills requirements); and students’ satisfaction with the education that they have completed (Did it provide a solid basis for entering the labor mar-ket? Did it develop the relevant skills? Did it achieve the right mix
collectingdata
analyzing anddisseminatingdata
usinganalysis toimprovepolicies
assessinglearningoutcomes
e.g.,performance-basedbudgeting
identifyingemploymentoutcomes ofgraduates
Figure 3.2 Learning to Use Data to Drive Education Policy
Source: Authors.
SNJD_89-114.indd 95SNJD_89-114.indd 95 9/27/11 6:54:29 PM9/27/11 6:54:29 PM

96 Skills, Not Just Diplomas
between practical and theoretical knowledge?). Table 3.1 shows the types of information that the survey collects.
Legacy of Central Planning
As noted earlier, many problems in education systems go unnoticed and unaddressed in the ECA region because these systems do not produce
not started, veryearly stages, no, orrare participationin internationalassessments
early piloting ofown assessmentinstruments,someparticipation ininternationalassessments
several years ofexperience withown assessmentsand regular participation ininternationalassessments
several years ofexperience inmeasuring,analyzing, andmaking use oflearning results toimprove educationpolicy
Bulgaria
Hungary
Latvia
Lithuania
Romania
Serbia
Slovenia
Albania
Croatia
Czech Republic
Estonia
Georgia
Macedonia, FYR
Moldova
Montenegro
Poland
Russian Federation
Slovak Republic
Ukraine
Armenia
Azerbaijan
Belarus
Bosnia andHerzagovina
Kazakhstan
Kosovo
Kyrgyz Republic
Tajikistan
Turkey
Turkmenistan
Uzbekistan
Figure 3.3 Status of Measuring and Using Data on Student Learning Outcomes in the ECA Region, 2009
Sources: Authors’ assessments based on data from UNICEF (2007, table 2.1); the extent of countries’ participation
in PISA, PIRLS, and TIMSS since 1995; and inputs from World Bank country experts. The UNICEF data is drawn from
“Table 2.1: Status of Reforms of Assessment and Examination Systems, 2006,” regarding “Introduction of other
school exams or assessments (e.g. basic school)” and “Introduction of sample-based national assessment.” In this
table, UNICEF scores the progress of countries on a range of 0 to 4, with 0 representing “not planned or started”
and 4 representing “operational.” In addition, the figure above uses World Bank staff compilations on the number
of international assessments in which each country has participated.
Note: As a signal that data-driven policy is a way to build capacity, the year in which countries first participated in
an international assessment was one of the indicators used to group countries.
SNJD_89-114.indd 96SNJD_89-114.indd 96 9/27/11 6:54:29 PM9/27/11 6:54:29 PM

Tab
le 3
.1
Info
rmat
ion
Co
llect
ed fr
om
Tra
cer
Stu
dy
of D
utc
h U
niv
ersi
ty G
rad
uat
es, 2
00
7
Dur
atio
n of
jo
b se
arch
(in
mon
ths)
Full-
tim
e em
ploy
men
t (%
)
Unl
imit
ed
term
co
ntra
ct (%
)M
onth
ly g
ross
in
com
e (e
uros
)
Man
ager
ial o
r pr
ofes
sion
al
(% IS
CO 1
or 2
)H
igh
use
of s
kills
(%)
Hig
h jo
b sa
tisf
acti
on (%
)
Mea
nM
ean
Mea
nM
ean
Med
ian
Mea
nM
ean
Mea
n
Scie
nce
an
d m
ath
0.7
88
.44
5.6
24
99
24
29
83
.67
1.0
77
.5
Me
dic
ine
an
d h
eal
th0
.77
9.0
41
.02
90
42
78
38
2.6
78
.98
1.7
Eng
ine
eri
ng
1.0
94
.46
6.2
27
72
26
31
87
.47
5.2
72
.8
Eco
no
mic
s1
.09
6.1
71
.32
95
42
78
37
0.3
65
.67
0.1
Law
1.2
92
.75
7.5
28
64
27
32
87
.86
6.0
70
.2
Hu
man
itie
s an
d a
rts
1.2
59
.14
3.0
21
88
22
26
66
.05
0.4
61
.3
Soci
al s
cie
nce
s1
.36
0.6
45
.42
31
72
35
07
2.0
63
.96
5.4
Ag
ricu
ltu
re1
.58
6.7
45
.62
13
72
32
88
4.2
73
.27
1.2
Sour
ce: T
able
pro
vid
ed
by
the
Re
sear
ch C
en
tre
for
Edu
cati
on
an
d t
he
Lab
ou
r M
arke
t (R
OA
), Th
e N
eth
erl
and
s, 2
00
8, a
t re
qu
est
of t
he
au
tho
rs.
97
SNJD_89-114.indd 97SNJD_89-114.indd 97 9/27/11 6:54:29 PM9/27/11 6:54:29 PM

98 Skills, Not Just Diplomas
sufficient data to gauge their performance. The legacy of highly central-ized, Soviet-style management then compounds these problems.3 Education authorities at most levels of the system have neither the power nor the incentives to make key operating decisions, such as reallocating budgets to meet urgent local needs, that would improve the performance of their respective institutions (see next section). Instead, actors in the sector are held accountable for complying with detailed, centrally deter-mined norms (e.g. on class sizes, or the number of nonteaching staff to be employed).
The implicit assumption appears to be that if norms are followed, a quality education will result. There is little management understanding that there are multiple ways to deliver quality education, some of which must be discovered by the principals and teachers of individual schools. Surveys of the main actors in the sector (undertaken as part of the PISA and Teaching and Learning International Survey [TALIS] studies) verify this general picture of education sector management in the region.4
Schools Lack Autonomy and Are Held Accountable for Complying with Norms ECA countries can be roughly sorted into three groups according to the degree of autonomy granted to schools at the pre-university level. At one end of the spectrum, schools in the new EU member states have been granted significant autonomy over budgets, some aspects of staffing, and—in some cases—instructional content. At the other end, schools in low-income countries, such as the Kyrgyz Republic and Azerbaijan, enjoy very little autonomy and continue to be micromanaged from the center. Schools in the Russian Federation, Serbia, Turkey, and several other coun-tries lie somewhere in between: some autonomy has been granted to schools or to some schools as part of pilot projects.
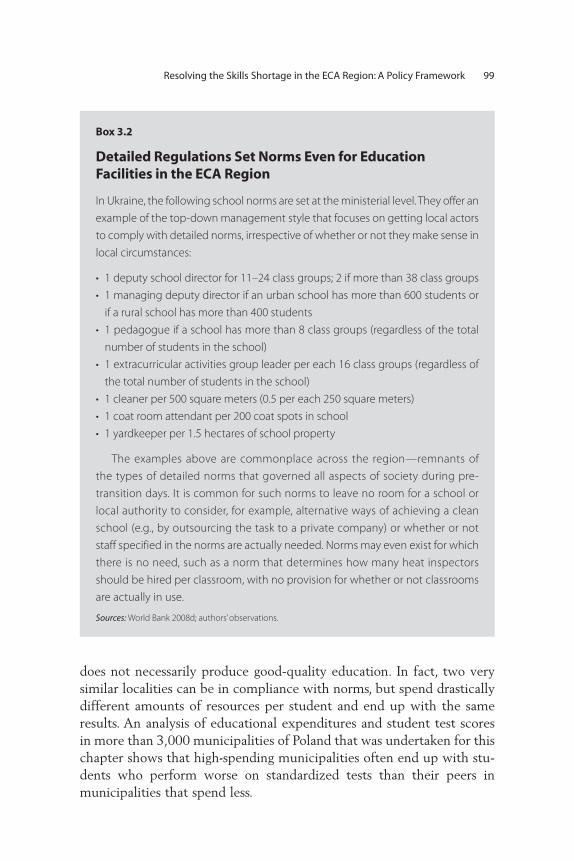
Rather than provide a “framework” of broad, overall rules for the sec-tor, legislation on education in the region is highly detailed, spelling out minute norms for all operational areas (see box 3.2). Legions of inspec-tors are employed to visit schools to verify if they are in compliance with these norms, acting more like police officers than pedagogical counsel-ors. The result is a system that focuses on compliance with norms, not quality education.
Complying with norms does not necessarily lead to better results.Detailed data on spending and test scores now exist for some ECA coun-tries, including Poland, and show that complying with input standards
SNJD_89-114.indd 98SNJD_89-114.indd 98 9/27/11 6:54:30 PM9/27/11 6:54:30 PM
Resolving the Skills Shortage in the ECA Region: A Policy Framework 99
does not necessarily produce good-quality education. In fact, two very similar localities can be in compliance with norms, but spend drastically different amounts of resources per student and end up with the same results. An analysis of educational expenditures and student test scores in more than 3,000 municipalities of Poland that was undertaken for this chapter shows that high-spending municipalities often end up with stu-dents who perform worse on standardized tests than their peers in municipalities that spend less.
Box 3.2
Detailed Regulations Set Norms Even for Education Facilities in the ECA Region
In Ukraine, the following school norms are set at the ministerial level. They offer an
example of the top-down management style that focuses on getting local actors
to comply with detailed norms, irrespective of whether or not they make sense in
local circumstances:
• 1 deputy school director for 11–24 class groups; 2 if more than 38 class groups
• 1 managing deputy director if an urban school has more than 600 students or
if a rural school has more than 400 students
• 1 pedagogue if a school has more than 8 class groups (regardless of the total
number of students in the school)
• 1 extracurricular activities group leader per each 16 class groups (regardless of
the total number of students in the school)
• 1 cleaner per 500 square meters (0.5 per each 250 square meters)
• 1 coat room attendant per 200 coat spots in school
• 1 yardkeeper per 1.5 hectares of school property
The examples above are commonplace across the region—remnants of
the types of detailed norms that governed all aspects of society during pre-
transition days. It is common for such norms to leave no room for a school or
local authority to consider, for example, alternative ways of achieving a clean
school (e.g., by outsourcing the task to a private company) or whether or not
staff specified in the norms are actually needed. Norms may even exist for which
there is no need, such as a norm that determines how many heat inspectors
should be hired per classroom, with no provision for whether or not classrooms
are actually in use.
Sources: World Bank 2008d; authors’ observations.
SNJD_89-114.indd 99SNJD_89-114.indd 99 9/27/11 6:54:30 PM9/27/11 6:54:30 PM

100 Skills, Not Just Diplomas
An example of this analysis compares the two municipalities of Tarłów (in the south-central region of Poland) and Rutka-Tartak (in the north-east), both in compliance with norms for class sizes in Poland. The two localities are also very similar in a number of ways: both are rural, have a similar proportion of adults with secondary or higher education, and roughly similar income levels. While they are similar in a number of ways, the educational spending and results of the two towns vary widely—suggesting large inefficiencies. Sixth-graders in Tarłów scored an average of 18 out of 40 on a national achievement test in 2009, while sixth-graders in Rutka-Tartak scored, on average, 26—a full eight points higher. Oddly, the high-performing municipality, Rutka-Tartak, spent the least per student: an average of only Zl 3,710 per pupil, compared to an aver-age of Zl 8,330 per student in Tarłów (see figure 3.4). That is, Rutka-Tartak achieved much better results at half the cost.
Further analysis revealed that the differences mostly boiled down to differences in class sizes. Tarłów’s higher per student costs were a result of relatively smaller classes (an average class size of 15), compared to an average class size of 24 in Rutka-Tartak (see figure 3.5). Smaller classes imply higher per student costs, yet test score results suggest that these smaller classes are not resulting in better learning outcomes.
Source: Authors’ analysis of data from the Ministry of Finance, Central Statistical Office, Ministry of National Edu-
cation, and Central Examination Board, Poland, and the World Bank’s BOOST database; Kheyfets and others 2011.
Note: Size of bubble indicates relative size of per student spending.
Rutka-TartakZl 3,710
TarłówZl 8,330
14
16
18
20
22
24
26
28
30
10.0 12.5 15.0 17.5 20.0 22.5 25.0 27.5 30.0 32.5 35.0 37.5 40.0 42.5 45.0 47.5 50.0
sixt
h-g
rad
e te
st s
core
(m
ax =
40)
adults with secondary education or higher, as % of total
Figure 3.4 Relationship between Primary School Test Scores, Adult Education Levels, and Per Student Spending in Two Municipalities of Poland
SNJD_89-114.indd 100SNJD_89-114.indd 100 9/27/11 6:54:30 PM9/27/11 6:54:30 PM

Resolving the Skills Shortage in the ECA Region: A Policy Framework 101
The story of Rutka-Tartak and Tarłów illustrates what is a widespread phenomenon across the region: educational spending varies widely and has little connection to learning outcomes. Furthermore, there are no management mechanisms built into the education systems of these countries to take corrective action in such cases. In fact, there are no mechanisms to collect per student spending and test scores in different localities. Not surprisingly, actors in these education systems care about complying with norms, not about what it costs to deliver education ser-vices or what results are achieved.
Inflexible Management Inhibits ReformThe strong focus on meeting detailed norms, together with the lack of student performance data, has created rigid education systems that are unable to respond to changing conditions. One area in which this inability to reform is highly apparent is vocational education and train-ing (VET). ECA education systems inherited large numbers of voca-tional schools from the communist system, which in pre-transition days supplied workers to state-owned enterprises. Despite large drops in student numbers, these schools still enroll almost 40 percent of all
Figure 3.5 Relationship between Primary School Test Scores, Average Class Size, and Per Student Spending in Two Municipalities of Poland
Rutka-TartakZl 3,710
TarłówZl 8,33014
16
18
20
22
24
26
28
30
13 14 15 16 17 18 19 20 21 22 23 24 25 26 27 28 29
sixt
h-g
rad
e t
est
sco
re (
max
= 4
0)
average class size
Source: Authors’ analysis of data from the Ministry of Finance, Central Statistical Office, Ministry of National Edu-
cation, and Central Examination Board, Poland, and the World Bank’s BOOST database; Kheyfets and others 2011.
Note: Size of bubble indicates relative size of per student spending. See end note for data sources used for this
analysis.
SNJD_89-114.indd 101SNJD_89-114.indd 101 9/27/11 6:54:30 PM9/27/11 6:54:30 PM

102 Skills, Not Just Diplomas
upper secondary graduates (the largest proportion of any region in the world, see figure B2.1). The most highly vocationalized programs were in Central and Eastern Europe, where the average share of vocational secondary school students was over 70 percent in 1989. Turkey, not a transition country, also has a strong vocational focus in secondary edu-cation, with programs patterned after the German dual-system model. As economic conditions and employer requirements have changed, however, education systems in these countries have been unable to reform the sector to deliver the skills in demand on the labor market. In addition, the majority of these programs were terminal, that is, they did not provide access to higher education.
Given that secondary education was overwhelmingly focused on voca-tional and technical training in planned economies, the management of vocational secondary education was often separated from that of general secondary education programs. (The latter was the gateway to university study, an opportunity that was limited to the select few in these econo-mies.) In many ECA countries today, management of secondary educa-tion is thus divided across two or more ministries. Even in Turkey, the one nontransition country in the ECA region, there is a distinct fragmentation of responsibility and oversight of secondary education within the same ministry.
A further complication is that local governments in the ECA region are typically responsible for the management and, to some degree, the financing, of general secondary education in most ECA countries, whereas the central government remains responsible for managing and funding vocational secondary education. Specifically, in many countries it is the national Ministry of Education that retained management control over vocational schools (as did other national-level ministries that ran such schools, for example, a Ministry of Agriculture that sponsored a forestry school). The fragmentation is thus not only across ministries, but across authority levels (national and local) also.
This double management fragmentation makes it more difficult to adjust the supply of education programs to changes in demand (i.e., changes in skills requirements and labor market opportunities, which are then translated into changing student demand). This reluctance or inca-pacity to reform these education programs to meet skill needs is exacer-bated by the fact that core ministries, including ministries of finance and economy, are often more concerned than ministries of education—where management control is actually located—about the efficiency of educa-tion programs and their responsiveness to changing skill needs.
SNJD_89-114.indd 102SNJD_89-114.indd 102 9/27/11 6:54:30 PM9/27/11 6:54:30 PM

Resolving the Skills Shortage in the ECA Region: A Policy Framework 103
Due to the fractionalized authority structures, the lack of autonomy, and a management focus on norms, principals of vocational schools or local education planners have been virtually incapable of modernizing these dinosaurs into attractive secondary education alternatives for students. Economic transition necessitates widespread changes in educa-tion at this level and in vocational education programs in particular, but rigid and divided management systems and shrinking budgets have made it hard to implement these changes. Many vocational schools remain unreformed, with outdated equipment, an outdated curriculum that offers too many narrow specializations, and an aging (and possibly increasingly unqualified) teacher workforce. Paradoxically, firms in the region are seeking more graduates with technical skills and have raised salaries in areas with skills shortages to attract workers with these abilities. Nevertheless, vocational programs in the region are still largely failing to provide the needed skills.
Inefficient Use of Funds
Education funding in the ECA region is also dictated by norms rather than a common-sense response to conditions on the ground. With money tied to norms, schools and local authorities have no flexibility or incentive to improve the efficiency of spending. In particular, schools in most coun-tries in the region continue to be financed based on the number of classes and teachers employed (i.e., inputs), not the number of students that they serve. Centrally determined norms dictate the subjects that must be taught, and how many classes must be created at each grade level. Norms on class numbers determine the required number of teaching hours, which establish the required number of teachers. Funding flows are then rigidly earmarked for either personnel costs or nonpersonnel costs, leav-ing local managers no ability to reallocate funds where they are most needed. As a result, the system finds it difficult to correct course in the face of change.
The most glaring example of this problem has been the inability of the sector to downsize in response to falling student numbers over the past two decades. The ensuing crisis has strained the resources of education systems throughout the region and brought the teaching profession to the brink—compromising both its quality and attractiveness to future teach-ers. Although the problems associated with smaller student numbers are presently most urgent at the pre-university level of education, they will soon impact the university sector as well.
SNJD_89-114.indd 103SNJD_89-114.indd 103 9/27/11 6:54:30 PM9/27/11 6:54:30 PM

104 Skills, Not Just Diplomas
All but five ECA countries—Turkey and a few low-income CIS countries—have experienced a dramatic decline in student enrollments as a result of demographic trends in the past 20 years, differing only in terms of the severity of the decline and its onset. As figure 3.6 shows, in some countries student numbers have declined by as much as 40 percent since the beginning of the transition.
Despite highly centralized management, the responsibility for identi-fying which schools to close was placed on the shoulders of regional or local authorities or both in most ECA countries. Yet these actors had no incentive to undertake the politically sensitive and administratively dif-ficult task of closing schools, particularly if their schools remained in compliance with generous norms on class sizes. With norms for class sizes allowing for variations as large as 25 percent (e.g., a minimum of 20 and a maximum of 25 students) or with no minimum class size at all (e.g., Serbia and Belarus), years could pass before a school was not in compli-ance with class size norms. Even then, local authorities usually had ways to postpone closing schools by asking education ministries for exceptions, adding additional financing from their own sources to keep schools in operation, or inflating student numbers to keep schools in compliance.
Source: EdStats Database.
Note: LI = low-income, MI = Middle-income.
a. Western Balkan population estimates are based on Albania, Bosnia and Herzegovina, and FYR Macedonia only.
60
70
80
90
100
110
120
130
19901992
19941996
19982000
20022004
2006
LI CIS MI CIS EU Western Balkana Turkey
Figure 3.6 Dynamics of the 6- to 12-year-old Population in the ECA Region, 1990–2006 (1990 = 100)
SNJD_89-114.indd 104SNJD_89-114.indd 104 9/27/11 6:54:31 PM9/27/11 6:54:31 PM

Resolving the Skills Shortage in the ECA Region: A Policy Framework 105
Plummeting Student-Teacher Ratios Reflect the Failure to Adjust to New RealitiesDeclining student-teacher ratios across the region provide clear evidence that policy adjustments to date have not successfully addressed inefficient spending in the sector. Take the example of Moldova. The average school in Moldova was built in 1971, when pre-university students totaled 1.2 million and demographics looked favorable. After the Soviet Union collapsed, student numbers soon started to plummet. By 2010, there were less than 700,000 students in the country’s schools (a 44 percent drop from the peak student population of 1995). Yet the number of teachers in these schools has not declined since 2003. In fact, there were as many schools in Moldova in 2009 as there were in 1994; on average, each school has only 56 percent of the students for which it was built. Student-teacher ratios are one way to look at the inability to adjust to falling student numbers. Before the transition, average student-teacher ratios in the ECA region were roughly similar to those observed in other regions in the world, but have since dropped significantly (see figure 3.7).
Figure 3.7 Primary School Student-Teacher Ratios in ECA Compared to Other Regions of the World, 1990–2008
15
17
19
21
23
25
27
29
19901991
19921993
19941995
19961997
19981999
20002001
20022003
20042005
20062007
2008
stu
den
t-te
ach
er ra
tio
(pri
mar
y)
East Asia and Pacific Europe and Central Asia
Latin America and the Caribbean Middle East and North Africa
Source: EdStats database, plus author’s linear interpolations for missing years.
Note: Actual data are marked with dots. One of the problems with international data on student-teacher ratios
(in both the World Bank’s EdStats database and other international education databases) is that it is unclear
whether or not data for a particular country is reported on a full-time equivalent basis.
SNJD_89-114.indd 105SNJD_89-114.indd 105 9/27/11 6:54:31 PM9/27/11 6:54:31 PM

106 Skills, Not Just Diplomas
These low ratios are problematic for two reasons. First, other things being equal, lower student-teacher ratios imply that it is more costly to finance education per student. There is no evidence, however, that these rising costs have resulted in better-quality education (for instance, see figure 3.8 for the case of Romania, where TIMSS scores have remained roughly flat for a decade). Second, lower student-teacher ratios mean that more of the education sector’s scarce resources are tied up in employee costs, leaving very few resources available for either innovations or much-needed classroom learning materials (e.g., new textbooks, computers, Internet access).
Teaching Profession Increasingly Devalued The largest casualty of inefficient resource use has been the teaching pro-fession, with evidence pointing to its significant devaluation—and a resul-tant deterioration in its quality at the pre-university level. Given limited resources, a teaching work force that is oversized relative to the number of students is poorly paid; indeed, teachers in most ECA countries earn salaries below the national median.5 Over time, low wages and uncer-tainty about the future have diminished the attractiveness of teaching in the ECA region.
The current teaching workforce has become overwhelmingly female and is aging rapidly (see figure 3.9). The percentage of female primary
Sources: Authors’ calculations based on TIMSS (various years) and expenditure data obtained from Romania’s
Ministry of Public Finance.
Figure 3.8 Real Per Student Expenditure Compared to TIMSS Math Scores in Romania, 1999–2008
472 475 461
0
50
100
150
200
250
300
350
400
450
500
0
50
100
150
200
250
300
19992000
20012002
20032004
20052006
20072008
TIM
SS s
core
ind
ex, 1
999
= 1
00
TIMSS (math) expenditure per student (real, index 1999 = 100)
SNJD_89-114.indd 106SNJD_89-114.indd 106 9/27/11 6:54:31 PM9/27/11 6:54:31 PM

Resolving the Skills Shortage in the ECA Region: A Policy Framework 107
school teachers in non-EU members of the region is, in fact, considerably higher than in the EU15 countries (EdStats Database). And education systems throughout the region are finding it difficult to hire qualified teachers in key subjects, such as English and information technology.
Finally, the quality of students now applying to pedagogical schools is inferior to that of students applying to other programs of study, with few of the brightest university graduates entering the profession. A recent study (Silova 2009) looked at the situation of teacher training institu-tions in two countries in the ECA region (Azerbaijan and the Kyrgyz Republic) where detailed data on centralized university admission tests—ideal for such analysis—were available. Consistent with the other indica-tors reviewed in this section, Silova’s analysis supports the thesis that the prestige and attractiveness of the teaching profession is low and declining in both countries.
Considered separately, these facts might not be alarming. Taken together, however, they make a compelling case that ECA countries are failing to attract the professionals who are urgently needed to improve the quality of education in the region.
Figure 3.9 Percentage of Students with a Teacher Over 50 Years Old in ECA Countries, Selected Years
0
10
20
30
40
50
60B
ulg
aria
Hu
ng
ary
Lith
uan
ia
Rom
ania
Slo
vak
Rep
ub
lic
Slo
ven
ia
Mac
edo
nia
, FY
R
Turk
ey
Russ
ian
Fed
erat
ion
Arm
enia
EU10+1 SEE MI CIS
LI CIS
per
cen
t
countries
1995 1999 2003 2007
Sources: IEA (1995, 1999, 2003, and 2007): Mathematics and Science Teacher Background Data Almanacs.
Note: LI = low-income, MI = middle-income.
SNJD_89-114.indd 107SNJD_89-114.indd 107 9/27/11 6:54:32 PM9/27/11 6:54:32 PM

108 Skills, Not Just Diplomas
Addressing the Skills Challenge
Education systems in the ECA region are facing daunting challenges with limited resources. Resolution of the most urgent challenges of these systems—overstaffing at the pre-university level, delivering the skills and competencies needed on the contemporary job market, and revamping vocational education and giving it an appropriate weight in secondary education—can no longer be delayed.
The very urgency of these problems presents policy makers in the region an opportunity to reform the way in which the education sector is man-aged overall. Specifically, they can systematically collect student perfor-mance data in order make better-informed decisions, make greater efforts to reduce the role of the central government in day-to-day operational issues at the school level, and link educational spending to agreed perfor-mance goals. As will be discussed in more detail in chapter 5, some of these principles have already been employed in many ECA countries at the ter-tiary level. The challenge is to disseminate these same principles at all levels of education.
Turn on the LightsIn order to provide quality learning for all, countries in the ECA region first need to understand how much their students are actually learning. As noted earlier in this chapter, all ECA countries need to begin systemati-cally collecting data on how their education systems are performing, principally via standardized student assessments and graduate tracer studies (both of which need to be linked to student background informa-tion). Central ministries can then use this data to design policy improve-ments. To accommodate such a shift, education ministry staff will need training in both analyzing trends in education performance data and developing education policy options based on such data.
Participation in international assessments such as PISA and TIMSS is a valuable step in this direction, as it gives countries access to significant practical advice on how to design and administer student achievement tests, analyze results, draw policy conclusions, and, equally important, manage the dissemination and communication of these results to system stakeholders and the media. This subject is discussed in more detail in the following chapter.
Introduce Autonomy and Accountability at Lower Levels of the Education SystemOvercoming the legacy of central planning involves changing the focus of education management away from detailed norms and instead holding
SNJD_89-114.indd 108SNJD_89-114.indd 108 9/27/11 6:54:32 PM9/27/11 6:54:32 PM
Resolving the Skills Shortage in the ECA Region: A Policy Framework 109
actors accountable for performance (or results). School principals and local authorities need more decision-making authority to pursue new opportunities, and the flexibility to experiment. At the central level, this implies that policy makers in the ECA region would relinquish certain duties and assume others so that education systems may innovate and improve student learning outcomes. The opportunity before central gov-ernments in these countries is to move away from micromanaging schools and classrooms and focus instead on “steering” the system.
Extending autonomy throughout education systems means placing authority and responsibility in the hands of the people most able to inno-vate and improve the quality of education: local managers and education authorities (see Osborne and Gaebler 1992). The solution is not simply to scrap norms altogether and replace them with expanded autonomy at lower levels—a change in accountability relationships is also needed. The art of reform will thus challenge central governments in ECA countries to build new and more sophisticated relationships with local authorities, principals, teachers, and other stakeholders—relationships based on incentives and accountability relationships that make these actors part-ners in achieving agreed performance goals. Not surprisingly, most sys-temic education reforms that have taken place in OECD countries since the 1980s have focused on devolving responsibility for day-to-day deci-sions to the front lines, that is, to individual schools (OECD 2004b).
Aligning the incentives of stakeholders in the education sector with the student learning outcomes desired by policy makers will require edu-cation ministries to set overall performance goals; articulate who is responsible and accountable to whom and for what; and ensure that these responsibilities are agreed, accepted, and understood. Ministries will also need to provide lower-level actors the support they need to meet agreed education goals, whether in the form of financing, advice, or knowledge sharing of best practices. Collaborative structures, shared leadership, and the spirit of public service will be invaluable for supporting efforts to improve learning outcomes in the region. Teachers, students, and local education authorities need both resources and the organizational and human capacity to perform. Teachers in the region, whose salaries are rarely competitive with private sector wages, also need to feel valued, respected, and recognized for their service.
Introduce Performance-based FinancingEducation financing in the ECA region can be more than just a flow of monetary resources, it can signal a desired policy direction to local educa-tion managers. More flexible, smarter financing in the form of block
SNJD_89-114.indd 109SNJD_89-114.indd 109 9/27/11 6:54:32 PM9/27/11 6:54:32 PM

110 Skills, Not Just Diplomas
grants (i.e., contract- or performance-based) offers funding to learning institutions in return for meeting agreed learning outcomes. Not only does such financing give local education managers much-needed flexibility that line-item, input-based budgets do not permit, it keeps them focused on student results.
The majority of ECA countries have recognized the limitations of input-based financing schemes and have come to appreciate that financ-ing can be used as a policy instrument. At the pre-university level, a typical first step away from input-based financing is to introduce a fund-ing formula in which the number of students enrolled in a school is the main component. In fact, 11 ECA countries have introduced such formu-lae and fully abandoned input-based financing (see figure 3.10).6 In essence, this means that public money is being allowed to “follow the
Source: Authors’ assessment.
Figure 3.10 Progress Towards Results-based Education Financing in the ECA Region, 2010
not started orvery earlystages indiscussions
per studentfinancing underdiscussion
piloting of perstudent financing
per studentfinancing widelyintroduced
Armenia (2005)
Bulgaria (2008)
Czech Republic(1992) Estonia (2001)
Georgia (2007)
Hungary (1990)
Kosovo (2002)
Lithuania (2001)
Poland (2000)
Romania (2010)
Slovak Republic(2004)
Azerbaijan
Latvia
Macedonia, FYR
Serbia
SloveniaAlbania
Belarus
Bosnia andHerzegovina Croatia
Kazakhstan
Montenegro
Turkey
Ukraine
Kyrgyz Republic(2006)
Russian Federation(1998)
Tajikistan (2005)
Uzbekistan (2008)
Moldova (2010)
SNJD_89-114.indd 110SNJD_89-114.indd 110 9/27/11 6:54:32 PM9/27/11 6:54:32 PM

Resolving the Skills Shortage in the ECA Region: A Policy Framework 111
student” rather than inputs (e.g., staff). Money can follow the student in many forms, such as student vouchers and block grants tied to student numbers. Countries that introduce per student financing typically design formulae that make it explicit and transparent how much a school will receive (see chapter 4).
Summary
There are three major impediments preventing education systems in ECA countries from helping to reduce the skills shortage in their region. First, ECA education systems have been operating without crucial information—in the dark. By focusing on top-achieving students, they neither seek to deliver quality education to all students, nor do they sys-tematically collect data on the learning and employment outcomes of all students. Second, the legacy of central planning keeps the governance and management of school systems highly centralized, with central policy makers intensely involved in operational details. A focus on compliance with norms, together with financing schemes based on inputs and not outputs, means that most local education authorities and school princi-pals in the ECA region lack the autonomy and authority to make crucial management decisions for their own institutions.
Third, education systems in the ECA region use financial resources highly inefficiently. Nowhere is this more apparent than in the pre- university sector, where few countries have adjusted teacher staffing levels in response to falling student numbers over the past 20 years. As a result, student-teacher ratios have fallen sharply as per student costs have ris-en—more so than in any other region in the world.
Policy makers in the region can overcome these impediments by com-mitting to quality education for all students, supported by systematic data collection on student outcomes; expanding autonomy at lower levels of the education system in return for accountability for student perfor-mance; and introducing performance-based financing. ECA countries are specifically encouraged to develop national learning assessments, system-atically participate in international assessments, conduct regular tracer studies of graduates to determine their employment outcomes, and then use this data to inform education policy.
Overcoming the legacy of central planning will require central policy makers to reduce the role of the central government in day-to-day operations of their education systems. By concentrating on setting system standards and overall goals, the central government can then manage
SNJD_89-114.indd 111SNJD_89-114.indd 111 9/27/11 6:54:33 PM9/27/11 6:54:33 PM

112 Skills, Not Just Diplomas
education systems for performance instead of compliance with norms. Greater autonomy can be granted to local education authorities and school principals in return for their accountability for improved student (and school) performance. Finally, policy makers can introduce perfor-mance-based financing (through such mechanisms as block grants or vouchers) and grant greater flexibility and decision-making power over school budgets to local education managers in return for meeting agreed learning outcomes.
The remainder of this report focuses on how governments can use the conceptual framework presented in this chapter—the three key problems impeding the education systems’ ability to address the skills shortage and their corresponding policy solutions—to improve educational outcomes in pre-university, tertiary, and adult education, respectively, with an emphasis on practical options.
Notes
1. As a nontransition country, Turkey sometimes represents a different case. Although much of the discussion in this chapter is relevant to Turkey, it will be noted in those cases where it is not.
2. Although Turkey was not a command economy, it too has a very centralized system, evident, for example, in the lack of autonomy and accountability in the education system.
3. Again, though Turkey was not a command economy, it has a very centralized education system.
4. The PISA assessment conducted by the OECD provides evidence of these large differences in school autonomy, based on a questionnaire administered to school principals (in which three questions relate to budgeting). Data from the 2006 PISA show that schools in Estonia enjoy the most autonomy of all ECA countries, irrespective of how the question on budgeting is asked, while schools in Azerbaijan enjoy the least. It should be noted that PISA data must be interpreted with some caution, as it is unclear what is meant by “having more autonomy on budgeting.” Does it mean more autonomy to formulate budgets, to re-allocate resources within budgets, to determine salaries and annual increases, or something else? Still, certain ECA countries have unam-biguously granted substantially more flexibility to schools, principals, and governing boards than have others. A much better source of information on differences in school autonomy is provided by the Teaching and Learning International Survey (TALIS) study, also conducted by the OECD. In this survey, teachers and principals are asked more specific questions related to the degree of autonomy in their schools. Unfortunately, only six ECA countries
SNJD_89-114.indd 112SNJD_89-114.indd 112 9/27/11 6:54:33 PM9/27/11 6:54:33 PM

Resolving the Skills Shortage in the ECA Region: A Policy Framework 113
(Turkey, plus all new EU member states at the time) participated in the 2008 study, which confirmed that schools in Estonia enjoy substantial autonomy.
5. Comparing teacher salaries to those of other professions is not an easy task, both because salary differentials can derive from differences in educational background, experience, and other factors, and because different professions enjoy different noncash benefits. However, available data show that teacher salaries in the ECA region are low and that the gap between their salaries and the median economy-wide salary has widened in many countries. See the fol-lowing data sources on teacher salaries: for OECD countries, OECD 2008 (accessible online at www.oecd.org/edu/eag2010); for CIS countries, CISSTAT, online database of the Interstate Commerce Committee of the Commonwealth of Independent States (Statistics of the Countries of the CIS, Annual Data from 1991 to 2010, http://www.cisstat.com/2base/frame00.htm); for economy-wide annual salaries for all countries, OECD StatExtracts, http://stats.oecd.org/Index.aspx. (All URLs accessed December 2010.)
6. The “result” referred to in this figure is a student enrolled. As discussed in chapter 4, a more desirable per student financing scheme would be to finance a student who is graduating, or better yet, a student who is graduating with a desired level of competencies. However, even the most advanced ECA coun-tries (in terms of moving to school financing based on results) still base financing on the number of students enrolled (an intermediate result, at best). This report therefore intentionally distinguishes between the inputs of teach-ers, classes, and finances, and among students “enrolled,” “graduating,” “gradu-ating with a desired level of competencies,” or “graduating and finding a job” as results (or outputs).
SNJD_89-114.indd 113SNJD_89-114.indd 113 9/27/11 6:54:33 PM9/27/11 6:54:33 PM

SNJD_89-114.indd 114SNJD_89-114.indd 114 9/27/11 6:54:33 PM9/27/11 6:54:33 PM