resolving the debt crisis of low-income countries
TRANSCRIPT
Resolving the Debt Crisis of Low-Income Countries
Jeffrey Sachs
Brookings Papers on Economic Activity, 2002, 1, pp. 257-286 (Article)
Published by Brookings Institution PressDOI: 10.1353/eca.2002.0013
For additional information about this article
Access provided by University of California , Santa Barbara (28 Jul 2013 21:35 GMT)
http://muse.jhu.edu/journals/eca/summary/v2002/2002.1sachs.html
Resolving the Debt Crisis of Low-Income Countries
THE IDEA OF BANKRUPTCY FOR insolvent sovereign borrowers has beenaround a long time, at least since Adam Smith’s favorable mention of it inthe Wealth of Nations.1 Kenneth Rogoff and Jeromin Zettelmeyer haverecently reviewed the history of the idea, as has Ann Pettifor.2 The currentinternational framework for workouts of distressed sovereign borrowersis woefully inadequate, lacking both the efficiency and the equity protec-tions that characterize well-designed bankruptcy systems. This paperfocuses on one part of the problem, namely, the plight of the world’s mosthighly indebted poor countries, and illustrates the serious problems thathave arisen because of the weakness of international institutional arrange-ments. I conclude with several recommendations for reform.
Motivations for Bankruptcy Laws
Bankruptcy laws have two somewhat distinct motivations. The first isto overcome the collective action problems that arise when multiple cred-
257
J E F F R E Y D . S A C H SHarvard University
I would like to thank Pierre Yared for superb research assistance.1. “When national debts have once been accumulated to a certain degree, there is
scarce, I believe, a single instance of their having been fairly and completely paid. The lib-eration of public revenue, if it has ever been brought about at all, has always been broughtabout by a bankruptcy; sometimes by an avowed one, but always by a real one, though fre-quently by a pretended payment [in a depreciated currency] . . . . When it becomes neces-sary for a state to declare itself bankrupt, in the same manner as when it becomes necessaryfor an individual to do so, a fair, open, and avowed bankruptcy is always the measure whichis both least dishonourable to the debtor, and least hurtful to the creditor” (Smith 1776[2000], Book V, Chapter III, pp. 1008–09).
2. Rogoff and Zettelmeyer (2002); Pettifor (2002).
0675-06 BPEA/Sachs 7/22/02 1:13 PM Page 257
itors confront an insolvent debtor.3 In the absence of a bankruptcy law, acreditor “grab race” can undermine the value of the assets of an insolventdebtor. The bankruptcy law forestalls the grab race through devices suchas an automatic stay on debt collection that is triggered by the filing of abankruptcy petition. In bankruptcy reorganizations under Chapter 11 ofthe U.S. bankruptcy code, further protections against a grab race areimplemented, such as debtor-in-possession financing and provisions forconfirmation of a restructuring plan in the absence of unanimity amongcreditors; the latter weaken the power of an individual creditor to hold outfor special treatment.
The second motivation of bankruptcy law is to offer a “fresh start” toan insolvent debtor. Whereas the motivation to avoid a grab race appliesin principle to all kinds of insolvent debtors—businesses, individuals, andmunicipalities—the motivation for a fresh start applies only to individuals(Chapters 7, 12, and 13) and municipalities (Chapter 9) rather than tobusinesses.4 The key instrumentality of the fresh start is the discharge ofdebt, which frees the debtor from future collection efforts while leavingthe debtor with some exempt assets and with a future income stream. Aninsolvent debtor may seek the discharge of debt even when there is onlyone creditor, and thus no possibility of a creditor grab race.
The motivation for forestalling a creditor grab race is efficiency. Themotivations for offering a fresh start, however, include both efficiency andequity. The creditors’ claims are superseded by the higher interest of pro-tecting the autonomy of the individual vis-à-vis the creditors,5 or analo-gously, of ensuring that a debt-strapped municipality maintains thesovereignty needed to provide public services to its residents. For exam-ple, under Chapter 9, a municipality’s assets cannot be liquidated to paycreditors, because that would undermine sovereignty. Moreover, “neithercreditors nor the court may control the affairs of a municipality indirectlythrough the mechanism of proposing a plan of adjustment of the munici-pality’s debts that would in effect determine the municipality’s future tax
258 Brookings Papers on Economic Activity, 1:2002
3. I have previously discussed these issues in many places, including, for example,Sachs (1984, 1995).
4. Under Chapter 11, businesses are allowed a fresh start only to the extent that credi-tor interests are thereby protected. Creditors can force the conversion of a Chapter 11restructuring into a Chapter 7 liquidation by failing to confirm the reorganization plan.
5. For a similar reason, individuals may not voluntarily sell themselves into slavery.The autonomy of human beings takes precedence over any contractual obligations, eventhose voluntarily and knowingly made.
0675-06 BPEA/Sachs 7/22/02 1:13 PM Page 258
and spending decisions.”6 Indeed, the powers of the court and of creditorsare deeply circumscribed. “The debtor’s day-to-day activities are not sub-ject to court approval and . . . the debtor may borrow money without courtauthority. . . . The court also cannot interfere with the operations of thedebtor or with the debtor’s use of its property and revenues.”7 Mostimportant, neither under individual bankruptcy (Chapter 7 or Chapter 13)nor under municipal bankruptcy (Chapter 9) do creditors obtain the maxi-mum discounted value of income and property potentially collectablefrom the debtor. Individuals and municipalities are allowed to keepimportant property out of the creditors’ reach, such as a homestead up to acertain value, as well as keep most or all future income.8
The idea of the fresh start can be framed variously in terms of ethics(preserving the autonomy of the individual or the sovereign), equity (pre-serving an acceptable standard of living for an insolvent debtor), or exante efficiency (bankruptcy mechanisms as a way to spread risks betweena debtor and world financial markets when other risk-spreading mecha-nisms such as contingent contracts are incomplete). In any case, thedebtor is not reduced to destitution and permanent servitude to creditors.The borrowing costs to a debtor rise in anticipation of the possibility ofbankruptcy, but the downside risks of extreme adverse shocks are therebylimited.
International Sovereign Borrowers
For hundreds of years, sovereign borrowers have experienced repay-ment crises, including defaults and restructuring of debts.9 Despite therepeated experience of sovereign debt crises, and despite the importantefficiency and equity issues they pose, no international system of sover-eign bankruptcy has been devised. In the age of imperialism in the nine-teenth and early twentieth centuries, creditors often resorted to force or
Jeffrey D. Sachs 259
6. Bankruptcy Judges Division (2000, p. 51).7. Bankruptcy Judges Division (2000, p. 48).8. Thus, in an individual bankruptcy under Chapter 7, creditors are paid out of the
property of the bankruptcy estate, and remaining debts are discharged. The individual’sfuture income stream is protected against any future collection efforts. Thus repayment ofdebts is limited to the amount available from the liquidation of nonexempt property anddoes not extend to the discounted value of the debtor’s future labor income.
9. Borchard and Wynne (1951); Sachs (1989); Sachs and Jorgensen (1989).
0675-06 BPEA/Sachs 7/22/02 1:13 PM Page 259
the threat of force to collect debts, including the removal of insolvent sov-ereigns from power. Since the Great Depression, however, sovereign debtcrises have generally been worked out in negotiations between creditorsand debtors, often with the heavy political engagement of major creditorpowers or international institutions such as the International MonetaryFund (IMF), where creditors predominate. These negotiations have beencharacterized by a high degree of ad hockery and a low degree of system-atization of international rules.
This ad hockery has come at a very high cost. Insolvent countries haveoften been locked into decades of instability and impoverishment. Thereis certainly no guarantee of a fresh start. The creditor grab race has oftenundermined economic stability in debtor countries, to the detriment ofboth creditors and debtors. Debtor nations complain bitterly about the lossof sovereignty to creditor-led institutions, especially the IMF and theWorld Bank. And ad hoc bailouts of private creditors by official lenders—for example, through IMF loans to debtor governments to maintain debtservicing to private lenders in the creditor countries—have been widelyseen as creating moral hazard, encouraging future indiscriminate lendingby creditors to weak borrowers on the basis of expected future bailouts.
The absence of a fresh start for sovereign debtors can have a particu-larly pernicious effect on economic and social development. In a countrywhose government is insolvent, but that has not been released fromextremely onerous debt servicing, the provision of public goods is likelyto be severely curtailed. Macroeconomic stability and even public order(in the case that services such as health, police, and fire services are lim-ited) can easily be lost. Prolonged political uncertainty and instabilitymay result, as the sovereign power has limited means to defend itselfagainst internal insurgencies and external military threats.
The IMF’s recent recognition of the need for more-formal processes iswithout doubt a breakthrough in and of itself, as well as a major spur fornew ideas in this area.10 Any specific bankruptcy proposals launched inresponse to the IMF initiative should recognize the two intertwined moti-vations of bankruptcy: addressing the collective action problems andgranting a fresh start. For the world’s middle-income countries, with mul-tiple classes of creditors including important private sector creditors
260 Brookings Papers on Economic Activity, 1:2002
10. Krueger (2001).
0675-06 BPEA/Sachs 7/22/02 1:13 PM Page 260
(banks, bondholders, suppliers), the collective action problems probablyloom largest and are the most complex.11 For the low-income countries,the issue of a fresh start—suitably interpreted—is probably even moreimportant. Dozens of low-income countries have been stuck for twodecades or more in a persistent debt trap from which they are not recover-ing. For these countries, bankruptcy procedures will have to be consid-ered in the much larger context of the overall foreign assistance strategyof the creditor-donor community.
This paper focuses mainly on the issue of insolvency among low-income countries. Because these countries’ debts are owed mainly to offi-cial rather than private creditors, the focus naturally falls as well on theresolution of official debts, especially in the Paris Club and the claimsheld by the Bretton Woods institutions themselves.
Poverty Traps and the Debt Overhang
One key hypothesis of this paper is that poor countries are vulnerableto a poverty trap, which can be caused or exacerbated by an excessive for-eign debt burden. The basic idea of a poverty trap is that nonlinearities insaving, investment, and production can lead some low-income countriesto remain stuck at low or even falling levels of GNP per capita, despite theforces of economic convergence that are also at play in the world econ-omy, such as the potential for capital inflows into capital-scarce countriesand the diffusion of technology from rich to poor countries. To illustratethe key ideas, I introduce a very simple model in which the net saving ratefalls to zero when income drops below a minimum subsistence level.12
Suppose that individuals require a level of minimum real consumptionm to meet basic needs of personal health and hygiene, food intake, andshelter. (Unless otherwise noted, all variables are in per capita terms.)
Jeffrey D. Sachs 261
11. The key complexity, of course, is the reconciliation of national laws on creditor-debtor relations that govern outstanding loan agreements, with the global objective ofavoiding the creditor grab race. It seems likely that the IMF Articles of Agreement willneed amending so that international treaty law supersedes national law in the event of asovereign bankruptcy.
12. A neoclassical version of the same model (based on intertemporal optimization inthe presence of a minimum consumption constraint) is presented by Ben-David (1998), andthe original model of this type was offered by Nelson (1956).
0675-06 BPEA/Sachs 7/22/02 1:13 PM Page 261
When income y is above m, the household saves a constant fraction σ ofthe excess y – m. When income is below m, household saving is zero, asthe household consumes as much income as possible in order to come asclose as possible to meeting basic needs. Thus
Income is equal to output q plus foreign aid f minus service d on foreigndebt, so that
(2) y = q + f – d.
Output is simply assumed to be linear in reproducible capital:
(3) q = Ak.
Capital accumulation follows the standard accumulation equation:
(4) dk/dt = s – (n + δ)k,
where n is the rate of population growth and δ the rate of depreciation ofreproducible capital. It is assumed, realistically, that f – d < m, that is, thatforeign aid net of debt service does not fully cover basic needs. It is alsoassumed that Aσ – δ – n > 0, so that the economy maintains positive eco-nomic growth as long as y > m.
The economy grows or shrinks depending on the level of the capitalstock k. A threshold between output growth and output decline occurswhere the capital stock k* = σ(m + d – f )/(Aσ – δ – n). When k < (m +d – f )/A < k*, saving equals zero, dk/dt = – (δ + n)k, and the economyshrinks at the growth rate –(δ + n). When instead (m + d – f )/A < k < k*,dk/dt = σ(Ak + f – d – m) – (δ + n)k < 0. Output and the capital stockdecline to the point where saving equals zero and the economy once againshrinks at the rate –(δ + n). Finally, when k > k*, the economy grows, andat a rising rate, which asymptotically approaches Aσ – δ – n.
The growth of output may be graphed against the level of the capitalstock (figure 1), for given parameters and given levels of debt service andforeign assistance. For k > k*, the economy grows; for k < k*, the econ-omy shrinks; and for k = k*, output is stagnant. A rise in foreign aid or acut in debt servicing of size ∆ shifts the growth curve upward by theamount ∆σ/k, assuming that k > k*, and k* itself falls by the amount
( )( – ) .
10
sy m
y m y m=
<≥
if
if σ
262 Brookings Papers on Economic Activity, 1:2002
0675-06 BPEA/Sachs 7/22/02 1:13 PM Page 262
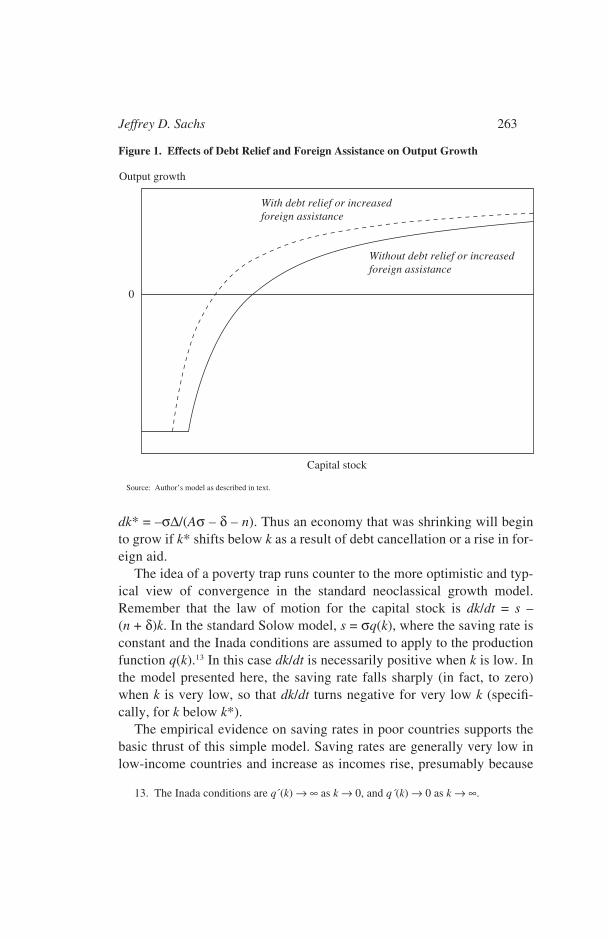
dk* = –σ∆/(Aσ – δ – n). Thus an economy that was shrinking will beginto grow if k* shifts below k as a result of debt cancellation or a rise in for-eign aid.
The idea of a poverty trap runs counter to the more optimistic and typ-ical view of convergence in the standard neoclassical growth model.Remember that the law of motion for the capital stock is dk/dt = s –(n + δ)k. In the standard Solow model, s = σq(k), where the saving rate isconstant and the Inada conditions are assumed to apply to the productionfunction q(k).13 In this case dk/dt is necessarily positive when k is low. Inthe model presented here, the saving rate falls sharply (in fact, to zero)when k is very low, so that dk/dt turns negative for very low k (specifi-cally, for k below k*).
The empirical evidence on saving rates in poor countries supports thebasic thrust of this simple model. Saving rates are generally very low inlow-income countries and increase as incomes rise, presumably because
Jeffrey D. Sachs 263
13. The Inada conditions are q´(k) → ∞ as k → 0, and q´(k) → 0 as k → ∞.
Figure 1. Effects of Debt Relief and Foreign Assistance on Output Growth
Source: Author’s model as described in text.
With debt relief or increasedforeign assistance
Without debt relief or increasedforeign assistance
0
Output growth
Capital stock
0675-06 BPEA/Sachs 7/22/02 1:13 PM Page 263
of the rising margin of income above subsistence. Norman Loayza, KlausSchmidt-Hebbel, and Luis Servén calculate that “in developing countries,a doubling of income per capita is estimated, other things equal, to raisethe long-run private saving rate by some ten percentage points of dispos-able income,”14 a finding shared by many studies showing that savingrates do indeed rise with income (or fall in a crisis). Ibrahim Elbadawi andFrancis Mwega find that African saving rates were not only low butfalling in the 1980s and 1990s compared with the 1970s,15 consistent withthe idea that Africa’s economic stagnation in the past twenty years hasbeen provoked, in part, by low saving rates associated with very lowincome per capita.16
Poverty traps can, of course, arise for other reasons as well. For verylow k, the marginal productivity of capital may be very low rather thanvery high (as assumed in the Inada conditions), because a threshold levelof k may be needed for capital to become productive. For this reason, too,dk/dt may turn negative when k is very small. For example, the profitableuse of modern technology may depend on a minimum scale of the market,or a minimum level of public expenditure on public goods, or a minimumquality of infrastructure such as ports and electric power. When k is toolow, q(k) and q´(k) will both be very low, and σq(k) – (n + δ)k becomesnegative. Alternatively, a demographically induced poverty trap is possi-ble if n becomes large as y becomes very small (that is, if the populationgrowth rate varies inversely with income per capita) and dq(k)/dk does notbecome too large as k approaches zero. In that case, a very poor popula-tion has so many children that saving per capita is insufficient to maintainthe capital-labor ratio.17 Yet another alternative is that the returns tohuman capital accumulation are a rising function of the level of human
264 Brookings Papers on Economic Activity, 1:2002
14. Loayza, Schmidt-Hebbel, and Servén (2000, p. 180).15. Elbadawi and Mwega (1998).16. According to their appendix table 1.1, the Sub-Saharan African countries had aver-
age gross domestic saving equal to 11.7 percent of GDP in the 1970s, falling to 6.7 percentin the 1980s, and 6.2 percent in the period 1990–95.
17. A plausible pattern is as follows. Very poor countries have very high infant andchild mortality rates because of lack of coverage of modern health services. This in turnleads to high fertility rates, as households compensate for the high mortality rates by hav-ing more children. Higher fertility rates in turn lead to lower investment in human capitalper child (the famous quality-quantity trade-off), which in turn leads to low or negativeeconomic growth. This in turn prolongs the health crisis.
0675-06 BPEA/Sachs 7/22/02 1:13 PM Page 264
capital, so that poor and uneducated parents do not find it profitable toeducate their children.18
At very low levels of income per capita, the most important invest-ments for poverty alleviation and overall economic growth are likely to bepublic sector investments in basic human capital (primary health and edu-cation) and basic infrastructure (such as roads from rural villages to portsand major cities). The reason is that private investments are unlikely to bemade in economies where basic literacy and health are not achieved. Iron-ically, despite the critical importance of public investment in health andeducation, public (and private) spending on health and education is usu-ally treated in national income accounts as consumption rather thaninvestment. Whatever the accounting, a properly articulated growthmodel would distinguish between public and private investment andwould recognize the critical role of public investment in human capitaland basic infrastructure. Since taxes are generally collected only onincomes in excess of the subsistence threshold m (for example, the ruralpoor are typically exempted from income and value-added taxes), tax col-lections would be equal to τ(y – m), where τ is the tax rate applied toincomes above subsistence. The previous model would then operateessentially as before, but with capital accumulation in human capital andinfrastructure being determined mainly by budgetary outlays, rather thanby overall national saving. Debt relief or foreign aid would work throughbudgetary flows rather than overall national income flows.
What kinds of economies are likely to find themselves in a povertytrap? First—and for present purposes critical—poor countries with aheavy inherited debt burden are likely to be in the zone of negativegrowth. Second, and very important, economies with intrinsically lowproductivity A are especially vulnerable. Low-productivity economiesinclude geographically isolated regions (such as landlocked states andcountries with a small internal market, especially those that are remotefrom larger markets) and regions with adverse ecologies (such as tropicalrainforests and regions with high rates of malaria transmission, fragilesoils, or water stress). Third, economies with low initial levels of repro-ducible capital k, perhaps the result of previous war or natural disaster, areobviously vulnerable. Fourth, countries with very high fertility rates, for
Jeffrey D. Sachs 265
18. Azariadis and Drazen (1990).
0675-06 BPEA/Sachs 7/22/02 1:13 PM Page 265
cultural reasons or in response to high infant and child mortality rates, areespecially vulnerable as well.
Not all very poor countries fall into a poverty trap. Indeed, countervail-ing forces, the most important of which are inflows of technology andcapital from the rich countries, can promote very high growth rates inpoor settings. In particular, if a poor country has an adequate mix offavorable geography (good ports, proximity to major markets), physicalecology (fertile soils, plentiful rainfall, absence of tropical diseases), littleinherited debt, large internal markets (to spur domestic and foreigninvestment aimed at the home market), and good governance (to promoteprivate sector investment and provide essential public services), theprospects for rapid growth are likely to be high and the risk of a povertytrap is likely to be remote.
The Debt Overhang and the Poverty Trap in Low-Income Countries
The rich creditor governments that “own and operate” the principalinternational financial institutions—such as the IMF, the World Bank, andthe Paris Club—have failed to acknowledge the pervasive risks of povertytraps for very low income countries. During the late 1970s and early1980s, several dozen developing countries, including a large number ofvery poor countries, fell into serious sovereign debt crises. And althoughdebt service burdens were rising, inflation-adjusted foreign assistance percapita in the recipient countries was declining. The squeeze of rising debtburdens and falling aid levels threw a large number of poor countries intopersistent stagnation or economic decline. For roughly twenty years thestandard interpretation of this phenomenon was that the countries neededyet more “structural adjustment” rather than debt relief or increased for-eign assistance.
As debt burdens became more and more untenable, and as sustainedgrowth in dozens of low-income countries proved elusive, the officialcreditors wrote off increasingly large portions of the debts owed them. Butthroughout the process, creditors failed to put sufficient political will orserious analysis into the debt reduction operations. Debt reduction targetswere set and reset arbitrarily—writing off 30 percent, then 50 percent, andso on—rather than based on serious assessments of the needs of each coun-
266 Brookings Papers on Economic Activity, 1:2002
0675-06 BPEA/Sachs 7/22/02 1:13 PM Page 266
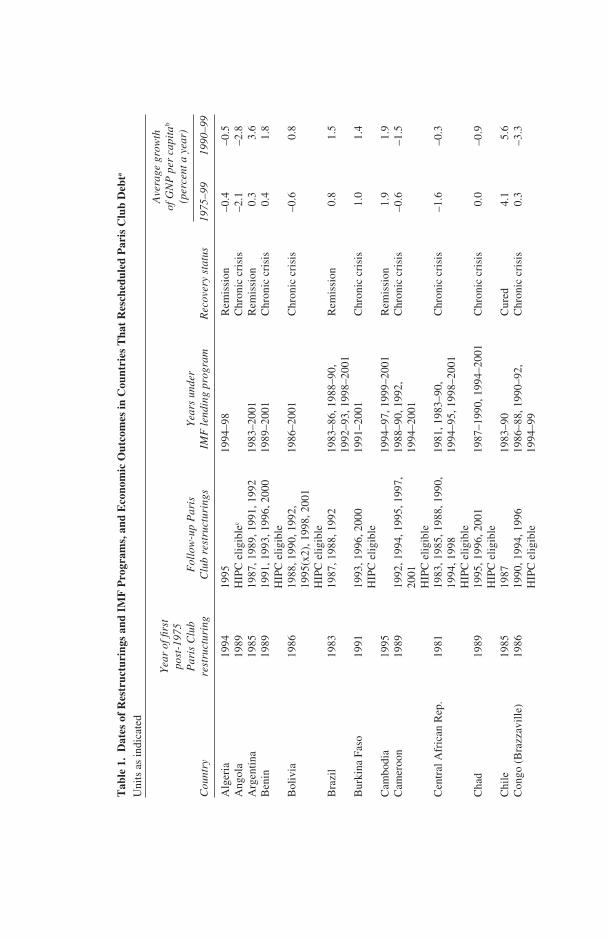
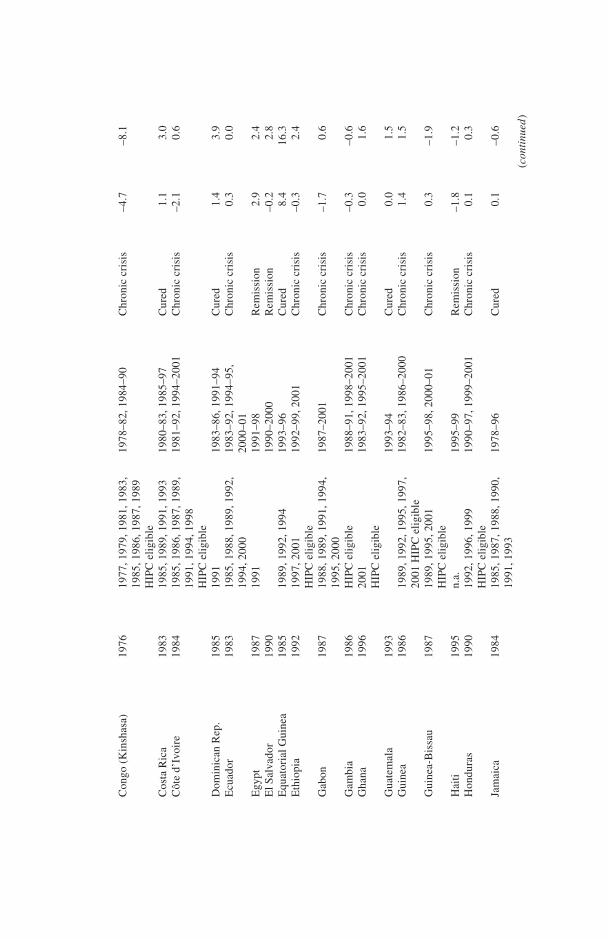
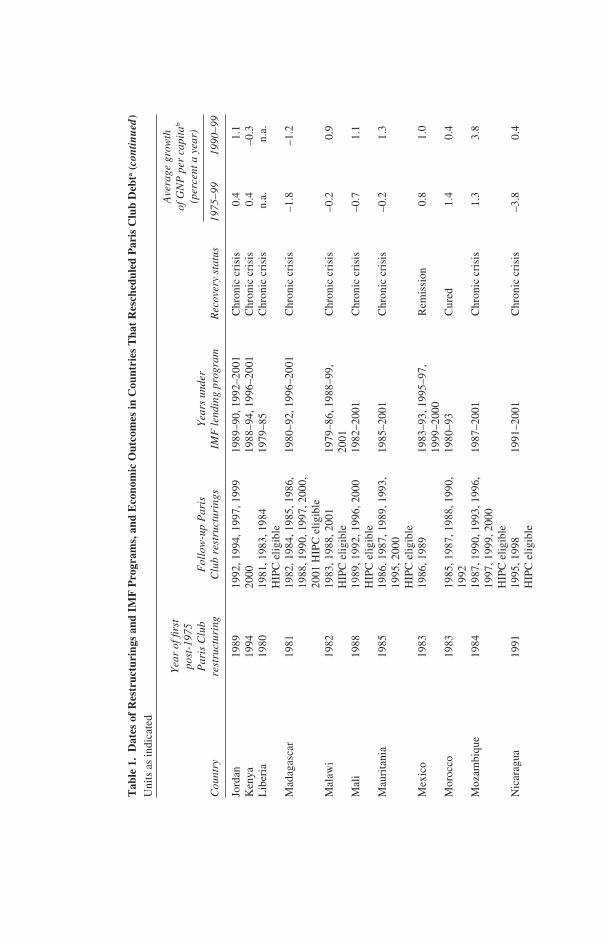
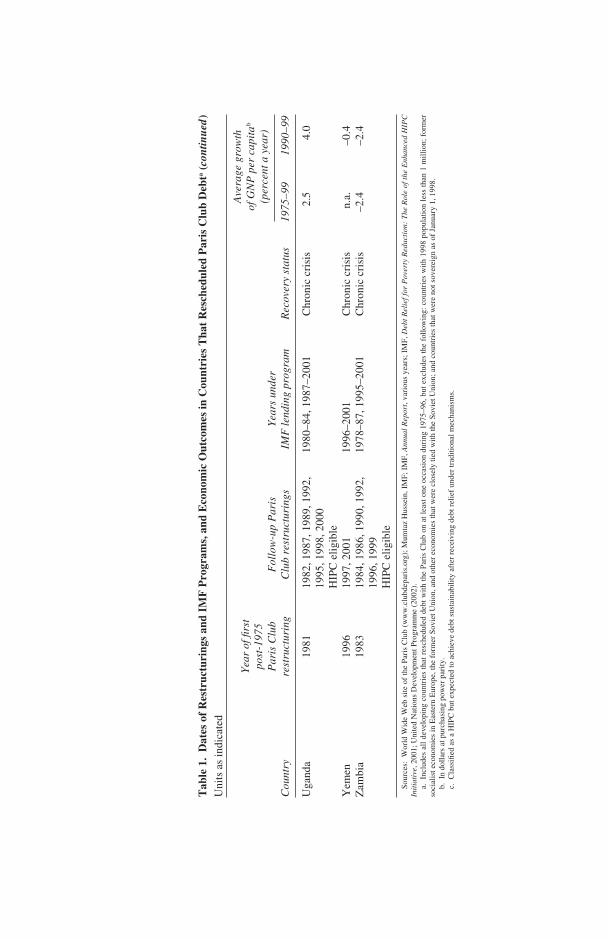
try. To examine the debt restructuring process more formally, table 1 liststhose countries that required Paris Club restructurings during the periodfrom 1975 to 1996. For these purposes I exclude the transition economies,because the debt and restructuring problems of Eastern Europe, the formerSoviet Union, and other economies once closely linked to the Soviet Unionpose special issues. I also exclude very small economies (those with popu-lations less than 1 million in 1998) and countries that were not sovereign asof January 1, 1980. Fifty-nine developing countries in the included grouprescheduled their debts in the Paris Club during this period; only thirty didnot, of which eight were oil-exporting states.19
For all Paris Club reschedulers during 1975–96, the countries are clas-sified according to the outcome of the debt restructuring operations. Sincea debt crisis signifies a kind of macroeconomic pathology, a three-waymedical analogy is used: countries are either cured, or in remission, or inchronic crisis. The criteria for this classification are as follows:
—A country is considered cured of its debt crisis if it is current on itsdebt servicing, did not restructure its debt in the Paris Club during1997–2001, is not a candidate for relief under the Heavily Indebted PoorCountries (HIPC) initiative, and was not under an IMF lending programduring 1998–2001.
—A country is considered in remission if it meets the conditions for“cured” except that it was under a lending program with the IMF during1998–2001.
—A country is considered to be in a chronic crisis if it required a ParisClub restructuring during 1997–2001, or is a candidate for HIPC relief, oris in default on its Paris Club debts.
Note that all countries deemed eligible for further debt relief under theenhanced HIPC program are considered to be in a chronic crisis, sincethese countries are acknowledged to require further debt cancellation tobring their debts to sustainable levels.
Of the fifty-nine countries shown in table 1 that required a Paris Clubrestructuring of their debt during 1975–96, only eight have been cured:
Jeffrey D. Sachs 267
19. The twenty-two non-oil-exporting states that did not reschedule are Bangladesh,Botswana, Burundi, China, Colombia, India, Lebanon, Lesotho, Malaysia, Mauritius,Myanmar, Nepal, Papua New Guinea, Paraguay, Singapore, South Africa, South Korea, SriLanka, Syria, Thailand, Tunisia, and Uruguay. The eight oil-exporting states that did notreschedule are Iran, Iraq, Kuwait, Libya, Oman, Saudi Arabia, the United Arab Emirates,and Venezuela. Despite having a population of less than 1 million in 1998, EquatorialGuinea is included in Paris Club reschedulings.
0675-06 BPEA/Sachs 7/22/02 1:13 PM Page 267
Tab
le 1
.D
ates
of
Res
truc
turi
ngs
and
IMF
Pro
gram
s, a
nd E
cono
mic
Out
com
es in
Cou
ntri
es T
hat
Res
ched
uled
Par
is C
lub
Deb
ta
Uni
ts a
s in
dica
ted
Yea
r of
firs
tA
vera
ge g
row
th
post
-197
5of
GN
P p
er c
apit
ab
Par
is C
lub
Fol
low
-up
Par
isY
ears
und
er(p
erce
nt a
yea
r)
Cou
ntry
rest
ruct
urin
gC
lub
rest
ruct
urin
gsIM
F le
ndin
g pr
ogra
mR
ecov
ery
stat
us19
75–9
919
90–9
9
Alg
eria
1994
1995
1994
–98
Rem
issi
on–0
.4–0
.5A
ngol
a19
89H
IPC
eli
gibl
ecC
hron
ic c
risi
s–2
.1–2
.8A
rgen
tina
1985
1987
, 198
9, 1
991,
199
219
83–2
001
Rem
issi
on0.
33.
6B
enin
1989
1991
, 199
3, 1
996,
200
019
89–2
001
Chr
onic
cri
sis
0.4
1.8
HIP
C e
ligi
ble
Bol
ivia
1986
1988
, 199
0, 1
992,
19
86–2
001
Chr
onic
cri
sis
–0.6
0.8
1995
(x2)
, 199
8, 2
001
HIP
C e
ligi
ble
Bra
zil
1983
1987
, 198
8, 1
992
1983
–86,
198
8–90
, R
emis
sion
0.8
1.5
1992
–93,
199
8–20
01B
urki
na F
aso
1991
1993
, 199
6, 2
000
1991
–200
1C
hron
ic c
risi
s1.
01.
4H
IPC
eli
gibl
eC
ambo
dia
1995
1994
–97,
199
9–20
01R
emis
sion
1.9
1.9
Cam
eroo
n19
8919
92, 1
994,
199
5, 1
997,
19
88–9
0, 1
992,
Chr
onic
cri
sis
–0.6
–1.5
2001
1994
–200
1H
IPC
eli
gibl
eC
entr
al A
fric
an R
ep.
1981
1983
, 198
5, 1
988,
199
0,
1981
, 198
3–90
,C
hron
ic c
risi
s–1
.6–0
.319
94, 1
998
1994
–95,
199
8–20
01H
IPC
eli
gibl
eC
had
1989
1995
, 199
6, 2
001
1987
–199
0, 1
994–
2001
Chr
onic
cri
sis
0.0
–0.9
HIP
C e
ligi
ble
Chi
le19
8519
8719
83–9
0C
ured
4.1
5.6
Con
go (
Bra
zzav
ille
)19
8619
90, 1
994,
199
619
86–8
8, 1
990–
92,
Chr
onic
cri
sis
0.3
–3.3
HIP
C e
ligi
ble
1994
–99
0675-06 BPEA/Sachs 7/22/02 1:13 PM Page 268
Con
go (
Kin
shas
a)19
7619
77, 1
979,
198
1, 1
983,
19
78–8
2, 1
984–
90C
hron
ic c
risi
s–4
.7–8
.119
85, 1
986,
198
7, 1
989
HIP
C e
ligi
ble
Cos
ta R
ica
1983
1985
, 198
9, 1
991,
199
319
80–8
3, 1
985–
97C
ured
1.1
3.0
Côt
e d’
Ivoi
re19
8419
85, 1
986,
198
7, 1
989,
19
81–9
2, 1
994–
2001
Chr
onic
cri
sis
–2.1
0.6
1991
, 199
4, 1
998
HIP
C e
ligi
ble
Dom
inic
an R
ep.
1985
1991
1983
–86,
199
1–94
Cur
ed1.
43.
9E
cuad
or19
8319
85, 1
988,
198
9, 1
992,
19
83–9
2, 1
994–
95,
Chr
onic
cri
sis
0.3
0.0
1994
, 200
020
00–0
1E
gypt
1987
1991
1991
–98
Rem
issi
on2.
92.
4E
l Sal
vado
r19
9019
90–2
000
Rem
issi
on–0
.22.
8E
quat
oria
l Gui
nea
1985
1989
, 199
2, 1
994
1993
–96
Cur
ed8.
416
.3E
thio
pia
1992
1997
, 200
119
92–9
9, 2
001
Chr
onic
cri
sis
–0.3
2.4
HIP
C e
ligi
ble
Gab
on19
8719
88, 1
989,
199
1, 1
994,
19
87–2
001
Chr
onic
cri
sis
–1.7
0.6
1995
, 200
0G
ambi
a19
86H
IPC
eli
gibl
e19
88–9
1, 1
998–
2001
Chr
onic
cri
sis
–0.3
–0.6
Gha
na19
9620
0119
83–9
2, 1
995–
2001
Chr
onic
cri
sis
0.0
1.6
HIP
C e
ligi
ble
Gua
tem
ala
1993
1993
–94
Cur
ed0.
01.
5G
uine
a19
8619
89, 1
992,
199
5, 1
997,
19
82–8
3, 1
986–
2000
Chr
onic
cri
sis
1.4
1.5
2001
HIP
C e
ligi
ble
Gui
nea-
Bis
sau
1987
1989
, 199
5, 2
001
1995
–98,
200
0–01
Chr
onic
cri
sis
0.3
–1.9
HIP
C e
ligi
ble
Hai
ti19
95n.
a.19
95–9
9R
emis
sion
–1.8
–1.2
Hon
dura
s19
9019
92, 1
996,
199
919
90–9
7, 1
999–
2001
Chr
onic
cri
sis
0.1
0.3
HIP
C e
ligi
ble
Jam
aica
1984
1985
, 198
7, 1
988,
199
0,
1978
–96
Cur
ed0.
1–0
.619
91, 1
993
(con
tinu
ed)
0675-06 BPEA/Sachs 7/22/02 1:13 PM Page 269
Tab
le 1
.D
ates
of
Res
truc
turi
ngs
and
IMF
Pro
gram
s, a
nd E
cono
mic
Out
com
es in
Cou
ntri
es T
hat
Res
ched
uled
Par
is C
lub
Deb
ta(c
ontin
ued)
Uni
ts a
s in
dica
ted
Yea
r of
firs
tA
vera
ge g
row
th
post
-197
5of
GN
P p
er c
apit
ab
Par
is C
lub
Fol
low
-up
Par
isY
ears
und
er(p
erce
nt a
yea
r)
Cou
ntry
rest
ruct
urin
gC
lub
rest
ruct
urin
gsIM
F le
ndin
g pr
ogra
mR
ecov
ery
stat
us19
75–9
919
90–9
9
Jord
an19
8919
92, 1
994,
199
7, 1
999
1989
–90,
199
2–20
01C
hron
ic c
risi
s0.
41.
1K
enya
1994
2000
1988
–94,
199
6–20
01C
hron
ic c
risi
s0.
4–0
.3L
iber
ia19
8019
81, 1
983,
198
419
79–8
5C
hron
ic c
risi
sn.
a.n.
a.H
IPC
eli
gibl
eM
adag
asca
r19
8119
82, 1
984,
198
5, 1
986,
19
80–9
2, 1
996–
2001
Chr
onic
cri
sis
–1.8
–1.2
1988
, 199
0, 1
997,
200
0,
2001
HIP
C e
ligi
ble
Mal
awi
1982
1983
, 198
8, 2
001
1979
–86,
198
8–99
, C
hron
ic c
risi
s–0
.20.
9H
IPC
eli
gibl
e20
01M
ali
1988
1989
, 199
2, 1
996,
200
019
82–2
001
Chr
onic
cri
sis
–0.7
1.1
HIP
C e
ligi
ble
Mau
rita
nia
1985
1986
, 198
7, 1
989,
199
3,
1985
–200
1C
hron
ic c
risi
s–0
.21.
319
95, 2
000
HIP
C e
ligi
ble
Mex
ico
1983
1986
, 198
919
83–9
3, 1
995–
97,
Rem
issi
on0.
81.
019
99–2
000
Mor
occo
1983
1985
, 198
7, 1
988,
199
0,
1980
–93
Cur
ed1.
40.
419
92M
ozam
biqu
e19
8419
87, 1
990,
199
3, 1
996,
19
87–2
001
Chr
onic
cri
sis
1.3
3.8
1997
, 199
9, 2
000
HIP
C e
ligi
ble
Nic
arag
ua19
9119
95, 1
998
1991
–200
1C
hron
ic c
risi
s–3
.80.
4H
IPC
eli
gibl
e
0675-06 BPEA/Sachs 7/22/02 1:13 PM Page 270

Nig
er19
8319
84, 1
985,
198
6,
1983
–91,
199
4–99
, C
hron
ic c
risi
s–2
.2–1
.019
88(x
2), 1
990,
199
4,
2001
1996
, 200
1H
IPC
eli
gibl
eN
iger
ia19
8619
89, 1
991,
200
019
87–9
2, 2
000–
01C
hron
ic c
risi
s–0
.8–0
.5P
akis
tan
1981
1999
, 200
1(x2
)19
80–8
3, 1
989–
91,
Chr
onic
cri
sis
2.9
1.3
1993
–200
1P
anam
a19
8519
9019
78–8
7, 1
992–
2001
Rem
issi
on0.
72.
4P
eru
1978
1983
, 198
4, 1
991,
199
3,
1979
–80,
198
2–85
, R
emis
sion
–0.8
3.2
1996
1993
–200
1P
hili
ppin
es19
8419
87, 1
989,
199
1, 1
994
1978
–81,
198
3–20
00R
emis
sion
0.1
0.9
Sen
egal
1981
1982
, 198
3, 1
985,
198
6,
1979
–92,
199
4–20
01C
hron
ic c
risi
s–0
.30.
619
87, 1
989,
199
0, 1
991,
19
94, 1
995,
199
8, 2
000
HIP
C e
ligi
ble
Sie
rra
Leo
ne19
7719
80, 1
984,
198
6, 1
992,
1978
–82,
198
4–89
,C
hron
ic c
risi
s–2
.5–7
.0
1994
, 199
619
94–9
8H
IPC
eli
gibl
eS
omal
ia19
8519
87 H
IPC
eli
gibl
e19
85–9
0C
hron
ic c
risi
sn.
a.n.
a.S
udan
1979
1982
, 198
3, 1
984
1979
–85
Chr
onic
cri
sis
n.a.
n.a.
HIP
C e
ligi
ble
Tan
zani
a19
8619
88, 1
990,
199
2, 1
997,
19
80–8
2, 1
986–
94,
Chr
onic
cri
sis
n.a.
–0.1
2000
, 200
219
96–2
001
HIP
C e
ligi
ble
Tog
o19
7919
81, 1
983,
198
4, 1
985,
19
79–9
8C
hron
ic c
risi
s–1
.3–0
.519
88, 1
989,
199
0, 1
992,
19
95 H
IPC
eli
gibl
eT
rini
dad
and
Tob
ago
1989
1990
1989
–91
Cur
ed0.
42.
0T
urke
y19
7819
79, 1
980
1978
–85,
199
4–96
, R
emis
sion
2.1
2.2
1999
–200
1(c
onti
nued
)
0675-06 BPEA/Sachs 7/22/02 1:13 PM Page 271
Tab
le 1
.D
ates
of
Res
truc
turi
ngs
and
IMF
Pro
gram
s, a
nd E
cono
mic
Out
com
es in
Cou
ntri
es T
hat
Res
ched
uled
Par
is C
lub
Deb
ta(c
ontin
ued)
Uni
ts a
s in
dica
ted
Yea
r of
firs
tA
vera
ge g
row
th
post
-197
5of
GN
P p
er c
apit
ab
Par
is C
lub
Fol
low
-up
Par
isY
ears
und
er(p
erce
nt a
yea
r)
Cou
ntry
rest
ruct
urin
gC
lub
rest
ruct
urin
gsIM
F le
ndin
g pr
ogra
mR
ecov
ery
stat
us19
75–9
919
90–9
9
Uga
nda
1981
1982
, 198
7, 1
989,
199
2,
1980
–84,
198
7–20
01C
hron
ic c
risi
s2.
54.
019
95, 1
998,
200
0H
IPC
eli
gibl
eY
emen
1996
1997
, 200
119
96–2
001
Chr
onic
cri
sis
n.a.
–0.4
Zam
bia
1983
1984
, 198
6, 1
990,
199
2,
1978
–87,
199
5–20
01C
hron
ic c
risi
s–2
.4–2
.419
96, 1
999
HIP
C e
ligi
ble
Sou
rces
:W
orld
Wid
e W
eb s
ite
of th
e P
aris
Clu
b (w
ww
.clu
bdep
aris
.org
); M
umta
z H
usse
in, I
MF
; IM
F, A
nnua
l Rep
ort,
vari
ous
year
s; I
MF
, Deb
t Rel
ief f
or P
over
ty R
educ
tion
: T
he R
ole
of th
e E
nhan
ced
HIP
CIn
itia
tive
, 200
1; U
nite
d N
atio
ns D
evel
opm
ent P
rogr
amm
e (2
002)
.a.
Incl
udes
all
dev
elop
ing
coun
trie
s th
at r
esch
edul
ed d
ebt
wit
h th
e P
aris
Clu
b on
at
leas
t on
e oc
casi
on d
urin
g 19
75–9
6, b
ut e
xclu
des
the
foll
owin
g: c
ount
ries
wit
h 19
98 p
opul
atio
n le
ss t
han
1 m
illi
on;
form
erso
cial
ist e
cono
mie
s in
Eas
tern
Eur
ope,
the
form
er S
ovie
t Uni
on, a
nd o
ther
eco
nom
ies
that
wer
e cl
osel
y ti
ed w
ith
the
Sov
iet U
nion
; and
cou
ntri
es th
at w
ere
not s
over
eign
as
of J
anua
ry 1
, 199
8.b.
In d
olla
rs a
t pur
chas
ing
pow
er p
arit
y.c.
Cla
ssifi
ed a
s a
HIP
C b
ut e
xpec
ted
to a
chie
ve d
ebt s
usta
inab
ilit
y af
ter
rece
ivin
g de
bt r
elie
f un
der
trad
itio
nal m
echa
nism
s.
0675-06 BPEA/Sachs 7/22/02 1:13 PM Page 272
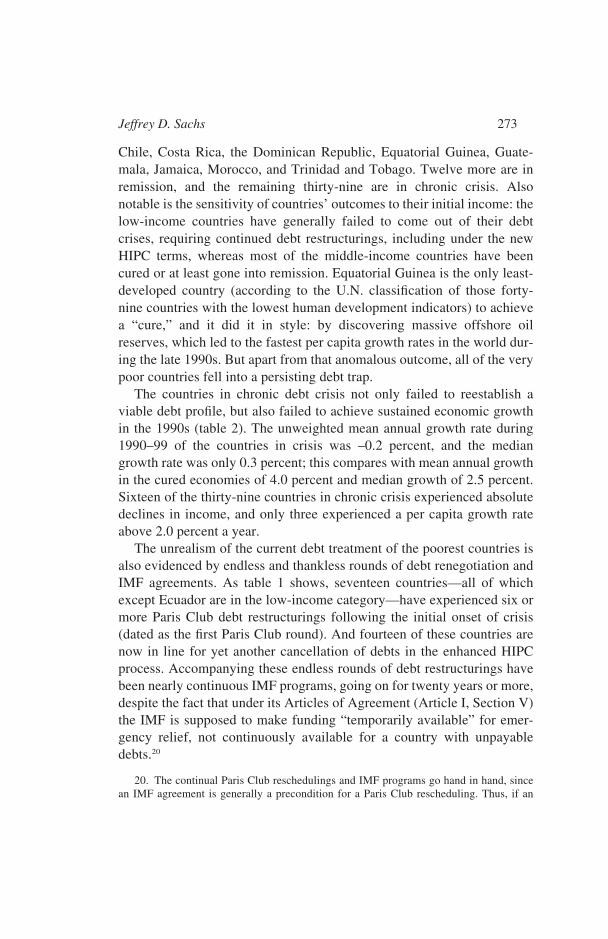
Chile, Costa Rica, the Dominican Republic, Equatorial Guinea, Guate-mala, Jamaica, Morocco, and Trinidad and Tobago. Twelve more are inremission, and the remaining thirty-nine are in chronic crisis. Alsonotable is the sensitivity of countries’ outcomes to their initial income: thelow-income countries have generally failed to come out of their debtcrises, requiring continued debt restructurings, including under the newHIPC terms, whereas most of the middle-income countries have beencured or at least gone into remission. Equatorial Guinea is the only least-developed country (according to the U.N. classification of those forty-nine countries with the lowest human development indicators) to achievea “cure,” and it did it in style: by discovering massive offshore oilreserves, which led to the fastest per capita growth rates in the world dur-ing the late 1990s. But apart from that anomalous outcome, all of the verypoor countries fell into a persisting debt trap.
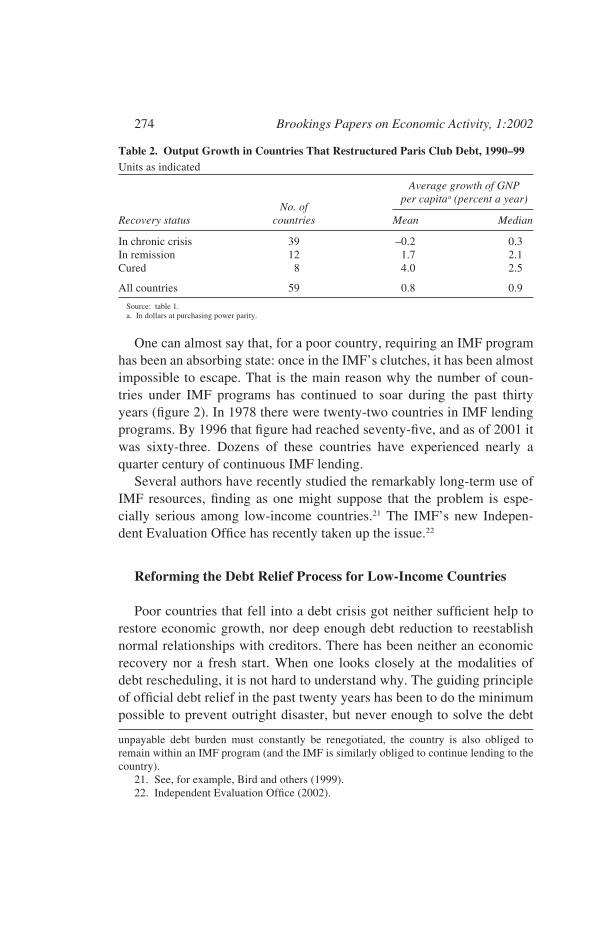
The countries in chronic debt crisis not only failed to reestablish aviable debt profile, but also failed to achieve sustained economic growthin the 1990s (table 2). The unweighted mean annual growth rate during1990–99 of the countries in crisis was –0.2 percent, and the mediangrowth rate was only 0.3 percent; this compares with mean annual growthin the cured economies of 4.0 percent and median growth of 2.5 percent.Sixteen of the thirty-nine countries in chronic crisis experienced absolutedeclines in income, and only three experienced a per capita growth rateabove 2.0 percent a year.
The unrealism of the current debt treatment of the poorest countries isalso evidenced by endless and thankless rounds of debt renegotiation andIMF agreements. As table 1 shows, seventeen countries—all of whichexcept Ecuador are in the low-income category—have experienced six ormore Paris Club debt restructurings following the initial onset of crisis(dated as the first Paris Club round). And fourteen of these countries arenow in line for yet another cancellation of debts in the enhanced HIPCprocess. Accompanying these endless rounds of debt restructurings havebeen nearly continuous IMF programs, going on for twenty years or more,despite the fact that under its Articles of Agreement (Article I, Section V)the IMF is supposed to make funding “temporarily available” for emer-gency relief, not continuously available for a country with unpayabledebts.20
Jeffrey D. Sachs 273
20. The continual Paris Club reschedulings and IMF programs go hand in hand, sincean IMF agreement is generally a precondition for a Paris Club rescheduling. Thus, if an
0675-06 BPEA/Sachs 7/22/02 1:13 PM Page 273
274 Brookings Papers on Economic Activity, 1:2002
Table 2. Output Growth in Countries That Restructured Paris Club Debt, 1990–99 Units as indicated
Average growth of GNP
No. ofper capitaa (percent a year)
Recovery status countries Mean Median
In chronic crisis 39 –0.2 0.3In remission 12 1.7 2.1Cured 8 4.0 2.5
All countries 59 0.8 0.9
Source: table 1.a. In dollars at purchasing power parity.
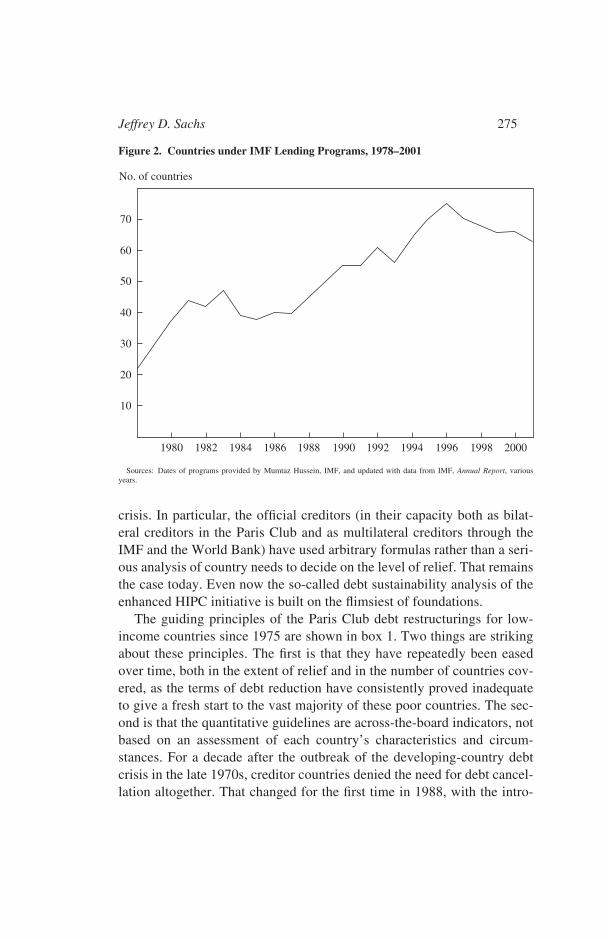
One can almost say that, for a poor country, requiring an IMF programhas been an absorbing state: once in the IMF’s clutches, it has been almostimpossible to escape. That is the main reason why the number of coun-tries under IMF programs has continued to soar during the past thirtyyears (figure 2). In 1978 there were twenty-two countries in IMF lendingprograms. By 1996 that figure had reached seventy-five, and as of 2001 itwas sixty-three. Dozens of these countries have experienced nearly aquarter century of continuous IMF lending.
Several authors have recently studied the remarkably long-term use ofIMF resources, finding as one might suppose that the problem is espe-cially serious among low-income countries.21 The IMF’s new Indepen-dent Evaluation Office has recently taken up the issue.22
Reforming the Debt Relief Process for Low-Income Countries
Poor countries that fell into a debt crisis got neither sufficient help torestore economic growth, nor deep enough debt reduction to reestablishnormal relationships with creditors. There has been neither an economicrecovery nor a fresh start. When one looks closely at the modalities ofdebt rescheduling, it is not hard to understand why. The guiding principleof official debt relief in the past twenty years has been to do the minimumpossible to prevent outright disaster, but never enough to solve the debt
unpayable debt burden must constantly be renegotiated, the country is also obliged toremain within an IMF program (and the IMF is similarly obliged to continue lending to thecountry).
21. See, for example, Bird and others (1999).22. Independent Evaluation Office (2002).
0675-06 BPEA/Sachs 7/22/02 1:13 PM Page 274
crisis. In particular, the official creditors (in their capacity both as bilat-eral creditors in the Paris Club and as multilateral creditors through theIMF and the World Bank) have used arbitrary formulas rather than a seri-ous analysis of country needs to decide on the level of relief. That remainsthe case today. Even now the so-called debt sustainability analysis of theenhanced HIPC initiative is built on the flimsiest of foundations.
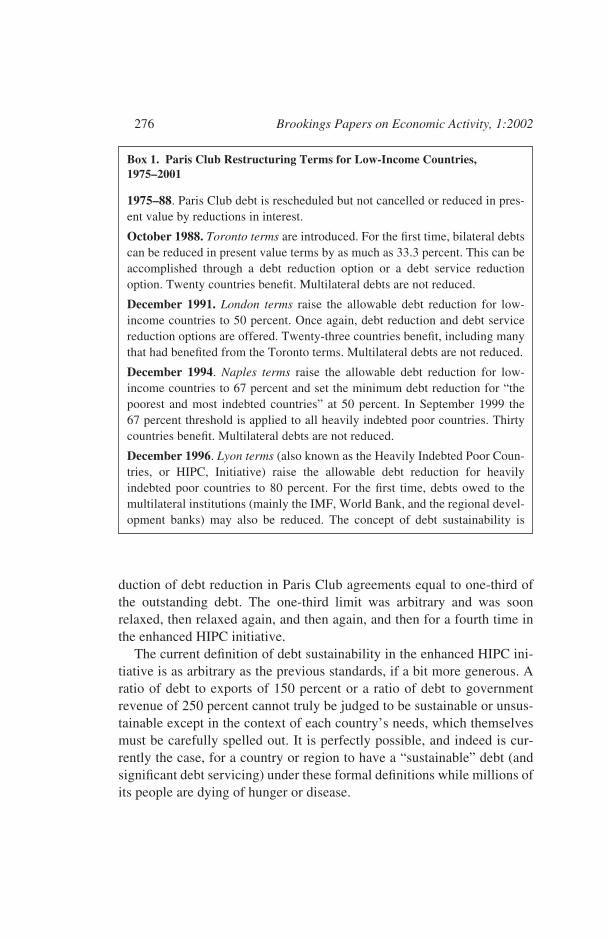
The guiding principles of the Paris Club debt restructurings for low-income countries since 1975 are shown in box 1. Two things are strikingabout these principles. The first is that they have repeatedly been easedover time, both in the extent of relief and in the number of countries cov-ered, as the terms of debt reduction have consistently proved inadequateto give a fresh start to the vast majority of these poor countries. The sec-ond is that the quantitative guidelines are across-the-board indicators, notbased on an assessment of each country’s characteristics and circum-stances. For a decade after the outbreak of the developing-country debtcrisis in the late 1970s, creditor countries denied the need for debt cancel-lation altogether. That changed for the first time in 1988, with the intro-
Jeffrey D. Sachs 275
Figure 2. Countries under IMF Lending Programs, 1978–2001
Sources: Dates of programs provided by Mumtaz Hussein, IMF, and updated with data from IMF, Annual Report, variousyears.
70
60
50
40
30
20
10
1980 1982 1984 1986 1988 1990 1992 1994 1996 1998 2000
No. of countries
0675-06 BPEA/Sachs 7/22/02 1:13 PM Page 275
276 Brookings Papers on Economic Activity, 1:2002
Box 1. Paris Club Restructuring Terms for Low-Income Countries,1975–2001
1975–88. Paris Club debt is rescheduled but not cancelled or reduced in pres-ent value by reductions in interest.
October 1988. Toronto terms are introduced. For the first time, bilateral debtscan be reduced in present value terms by as much as 33.3 percent. This can beaccomplished through a debt reduction option or a debt service reductionoption. Twenty countries benefit. Multilateral debts are not reduced.
December 1991. London terms raise the allowable debt reduction for low-income countries to 50 percent. Once again, debt reduction and debt servicereduction options are offered. Twenty-three countries benefit, including manythat had benefited from the Toronto terms. Multilateral debts are not reduced.
December 1994. Naples terms raise the allowable debt reduction for low-income countries to 67 percent and set the minimum debt reduction for “thepoorest and most indebted countries” at 50 percent. In September 1999 the67 percent threshold is applied to all heavily indebted poor countries. Thirtycountries benefit. Multilateral debts are not reduced.
December 1996. Lyon terms (also known as the Heavily Indebted Poor Coun-tries, or HIPC, Initiative) raise the allowable debt reduction for heavilyindebted poor countries to 80 percent. For the first time, debts owed to themultilateral institutions (mainly the IMF, World Bank, and the regional devel-opment banks) may also be reduced. The concept of debt sustainability is
duction of debt reduction in Paris Club agreements equal to one-third ofthe outstanding debt. The one-third limit was arbitrary and was soonrelaxed, then relaxed again, and then again, and then for a fourth time inthe enhanced HIPC initiative.
The current definition of debt sustainability in the enhanced HIPC ini-tiative is as arbitrary as the previous standards, if a bit more generous. Aratio of debt to exports of 150 percent or a ratio of debt to governmentrevenue of 250 percent cannot truly be judged to be sustainable or unsus-tainable except in the context of each country’s needs, which themselvesmust be carefully spelled out. It is perfectly possible, and indeed is cur-rently the case, for a country or region to have a “sustainable” debt (andsignificant debt servicing) under these formal definitions while millions ofits people are dying of hunger or disease.
0675-06 BPEA/Sachs 7/22/02 1:13 PM Page 276
Jeffrey D. Sachs 277
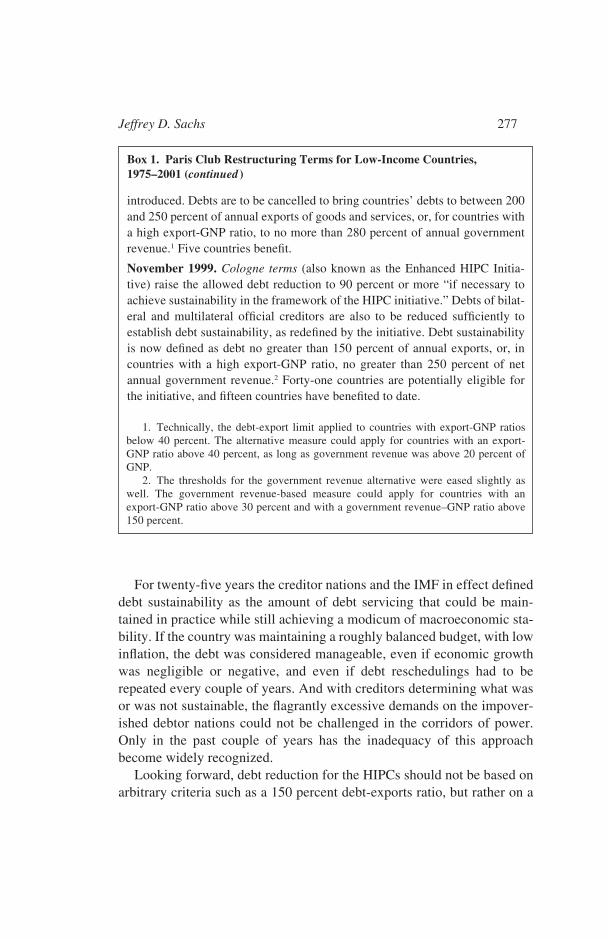
Box 1. Paris Club Restructuring Terms for Low-Income Countries,1975–2001 (continued )
introduced. Debts are to be cancelled to bring countries’ debts to between 200and 250 percent of annual exports of goods and services, or, for countries witha high export-GNP ratio, to no more than 280 percent of annual governmentrevenue.1 Five countries benefit.
November 1999. Cologne terms (also known as the Enhanced HIPC Initia-tive) raise the allowed debt reduction to 90 percent or more “if necessary toachieve sustainability in the framework of the HIPC initiative.” Debts of bilat-eral and multilateral official creditors are also to be reduced sufficiently toestablish debt sustainability, as redefined by the initiative. Debt sustainabilityis now defined as debt no greater than 150 percent of annual exports, or, incountries with a high export-GNP ratio, no greater than 250 percent of netannual government revenue.2 Forty-one countries are potentially eligible forthe initiative, and fifteen countries have benefited to date.
1. Technically, the debt-export limit applied to countries with export-GNP ratiosbelow 40 percent. The alternative measure could apply for countries with an export-GNP ratio above 40 percent, as long as government revenue was above 20 percent ofGNP.
2. The thresholds for the government revenue alternative were eased slightly aswell. The government revenue-based measure could apply for countries with anexport-GNP ratio above 30 percent and with a government revenue–GNP ratio above150 percent.
For twenty-five years the creditor nations and the IMF in effect defineddebt sustainability as the amount of debt servicing that could be main-tained in practice while still achieving a modicum of macroeconomic sta-bility. If the country was maintaining a roughly balanced budget, with lowinflation, the debt was considered manageable, even if economic growthwas negligible or negative, and even if debt reschedulings had to berepeated every couple of years. And with creditors determining what wasor was not sustainable, the flagrantly excessive demands on the impover-ished debtor nations could not be challenged in the corridors of power.Only in the past couple of years has the inadequacy of this approachbecome widely recognized.
Looking forward, debt reduction for the HIPCs should not be based onarbitrary criteria such as a 150 percent debt-exports ratio, but rather on a
0675-06 BPEA/Sachs 7/22/02 1:13 PM Page 277
systematic assessment of each country’s needs for debt reduction andincreased foreign assistance, measured against explicit developmentobjectives. The right starting point for assessing needs should be the inter-nationally accepted targets for economic development that are (ostensi-bly) the guiding framework for the global development partnershipbetween rich and poor countries. The targets are enshrined in the Millen-nium Development Goals (MDGs), a set of eight major goals and eigh-teen intermediate targets endorsed by all U.N. members at the MillenniumSummit in New York in September 2000 and recently reconfirmed by theU.N. membership in the Monterrey Consensus of the International Con-ference on Financing for Development in Monterrey, Mexico, in March2002. The MDGs are quantified goals for poverty alleviation, reduction ofhunger, reduction of disease burden, and other targets, mostly for the year2015.23
In principle, if the MDGs are taken as the baseline, and if there is aworking economic model of growth and poverty for each country, it ispossible to calculate a level of net resource transfers (f – d in terms of themodel above) needed to achieve a given level of output per capita in thetarget year 2015. Suppose, for example, that there is a target level of out-put per capita qT that should be achieved by 2015 in order to reduceextreme poverty by half (the first of the MDGs). That implies a target cap-ital stock kT equal to qT/A that should be achieved by that year. Assumingfor simplicity a constant level of f – d during the period 2002 to 2015, it isa simple exercise to take the differential equation for the capital stock,dk/dt = σ(Ak + f – d – m) – (δ + n)k < 0, and to calculate the level of f – dneeded to reach kT in 2015.24
In practice, what is needed is nothing short of a country-specific “busi-ness plan” for scaling up essential public services (health, education,basic infrastructure) as part of an overall strategy for meeting the MDGs.In addition, each government—in conjunction with civil society—shouldarticulate an overall development strategy that includes economic reformsand improved governance and accountability. The country-level businessplan would provide an assessment of the financial gaps that must be
278 Brookings Papers on Economic Activity, 1:2002
23. The goals are listed at www.undp.org/mdg/Millennium%20Development%20Goals.pdf.
24. Simply solving the first-order linear differential equation shows that k(2015) =exp(13β)k(2002) − [1 – exp(13β)](σ/β)(f – d – m), where β = Aσ – δ – n. From here it isstraightforward to solve for f – d.
0675-06 BPEA/Sachs 7/22/02 1:13 PM Page 278
bridged by development assistance and debt cancellation so that the coun-try can scale up essential services. The Commission on Macroeconomicsand Health of the World Health Organization (WHO) recently completedsuch an exercise for the health sector. For low-income countries in Sub-Saharan Africa, for example, it was found that spending on health careservices needs to increase from 3.9 percent of GNP in 2002 to 13.2 per-cent of GNP in 2015, in order to extend the coverage of essential healthservices to roughly two-thirds of the population.25 The commissionassumed that these countries could muster an increase of 2.0 percentagepoints of GNP for health out of their own domestic revenues, leaving agap of nearly 8 percent of GNP to be provided by donors (a sum estimatedto equal $26 billion a year as of 2015).26
Annual debt service owed by a HIPC rarely exceeds 5 percent of itsGNP. Thus, even if all of the HIPCs’ debts were cancelled, the savingswould not be enough to fund the increased outlays needed just for health,much less the sums also needed for expanded education and basic infra-structure, such as water and sanitation, and feeder roads to villages. Forthe twenty-four countries that had reached the “decision point” of theHIPC process by the end of 2000,27 the average level of debt servicingwas scheduled to decline from 4 percent of GNP in 1998 to 3 percent dur-ing 1999–2000, and 2 percent during 2001–05.28 Thus, even if all remain-ing debt servicing were cancelled, for a saving of 2 percent of GNP, theHIPCs would still likely need large increases in foreign assistance.
The idea of linking debt reduction to a detailed assessment of the finan-cial requirements for meeting the debtors’ essential needs may seem obvi-ous, even trivial, but it is radically different from what the creditor-donornations have done during the past quarter century. Debts owed by low-income countries have been collected, or partially cancelled, without anyserious assessment of actual country needs anchored in specific develop-ment targets. And as we have seen, the results have been quite miserable.The vast majority of the HIPCs have suffered chronically from low or
Jeffrey D. Sachs 279
25. WHO (2002, table A2.9, p. 171).26. As shown in WHO (2002, pp. 172–73).27. The decision point marks the beginning of interim relief under the HIPC initiative.
Following successful implementation of a poverty reduction program for a few more years(up to three), the completion point is reached, under which the negotiated cancellation ofthe debt is completed.
28. IMF (2001, table 2, p. 8).
0675-06 BPEA/Sachs 7/22/02 1:13 PM Page 279
negative economic growth rates, and many have experienced a seriousdeterioration of social conditions. Almost all of the countries listed as inchronic crisis in table 1 are far off track from meeting many if not most ofthe MDGs by 2015.29
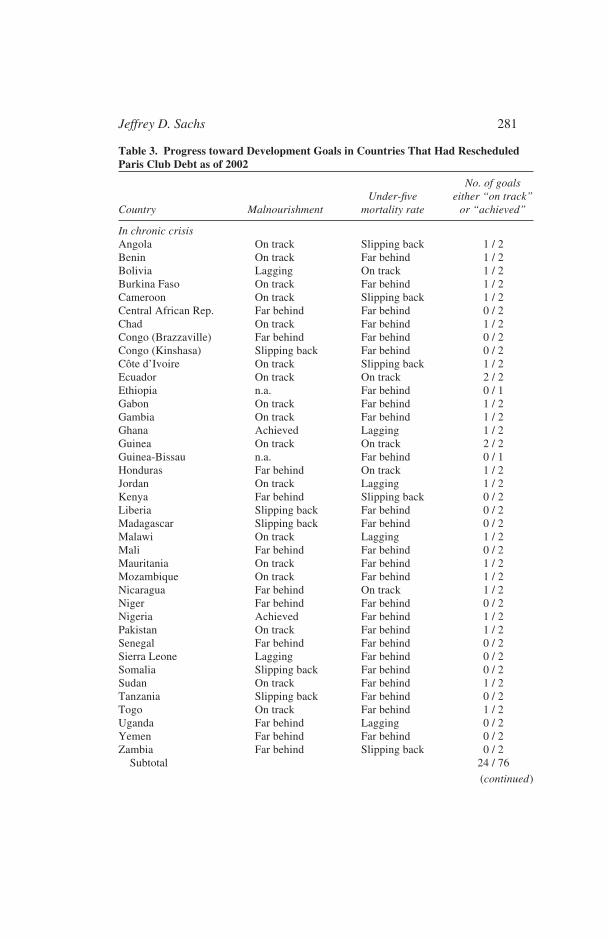
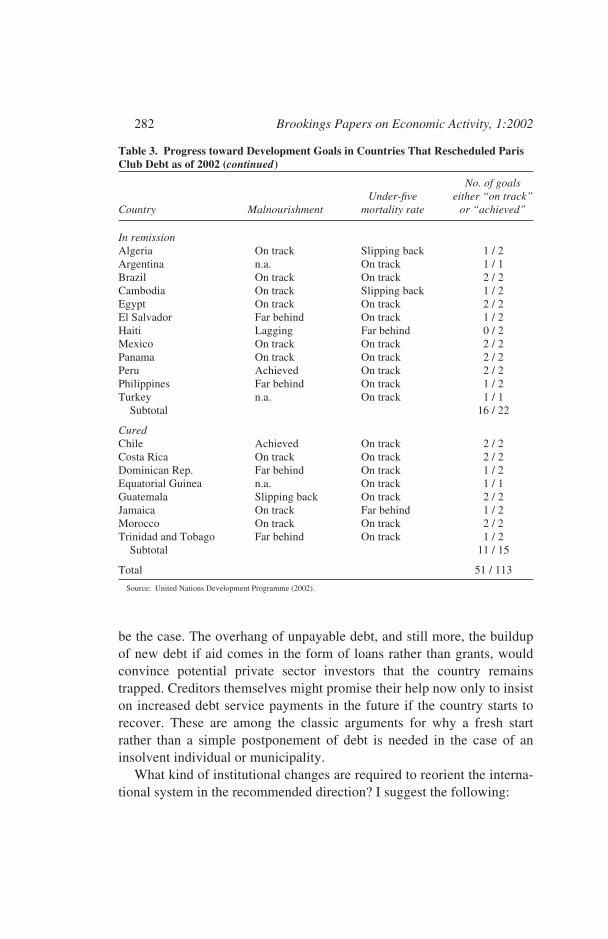
Table 3 highlights just how poorly the economies in chronic crisis aredoing in terms of two central MDGs, those relating to child mortality andhunger, according to the most recent assessment made by the UnitedNations Development Programme (UNDP).30 (The table singles out thesetwo MDGs because they are the goals for which current data are mostcomplete.) The child mortality goal is to reduce the child mortality rate bytwo-thirds by 2015 from its 1990 level. As table 3 shows, only five of thethirty-nine countries in chronic crisis are in a position to achieve that goal.Meanwhile, nine of the twelve economies in remission are on track orhave already achieved the target, and among the eight cured economiesonly Jamaica is not on track. Regarding hunger, the goal is to halve theproportion of malnourished people on a country-by-country basis by 2015from the 1990 level. Only nineteen of the thirty-seven crisis economiesfor which data are available are deemed to be on track for this goal orhave achieved it. Of the ten countries in remission for which data areavailable, seven are on the desired trajectory. Among the cured economies,the corresponding figure is four out of seven. The crisis countries areclearly struggling, whereas the in-remission and cured economies are invastly better shape.
Reforming the Treatment of Heavily Indebted Poor Countries
In the very simple model I have used for illustrative purposes, eco-nomic growth depends on net resource transfers (f – d), whether or notthose transfers come in the form of new grants or loans (both signified byan increase in f ) or in the form of debt cancellation (reduced d). To theextent that debts are cancelled, the needed increase in development assis-tance f is lessened. If debts are not cancelled, the same endpoint could inprinciple be reached by scaling up the level of official development assis-tance to cover the extra debt service as well. In practice this is unlikely to
280 Brookings Papers on Economic Activity, 1:2002
29. UNDP (2002).30. UNDP (2002).
0675-06 BPEA/Sachs 7/22/02 1:13 PM Page 280
Jeffrey D. Sachs 281
Table 3. Progress toward Development Goals in Countries That Had RescheduledParis Club Debt as of 2002
No. of goalsUnder-five either “on track”
Country Malnourishment mortality rate or “achieved”
In chronic crisisAngola On track Slipping back 1 / 2Benin On track Far behind 1 / 2Bolivia Lagging On track 1 / 2Burkina Faso On track Far behind 1 / 2Cameroon On track Slipping back 1 / 2Central African Rep. Far behind Far behind 0 / 2Chad On track Far behind 1 / 2Congo (Brazzaville) Far behind Far behind 0 / 2Congo (Kinshasa) Slipping back Far behind 0 / 2Côte d’Ivoire On track Slipping back 1 / 2Ecuador On track On track 2 / 2Ethiopia n.a. Far behind 0 / 1Gabon On track Far behind 1 / 2Gambia On track Far behind 1 / 2Ghana Achieved Lagging 1 / 2Guinea On track On track 2 / 2Guinea-Bissau n.a. Far behind 0 / 1Honduras Far behind On track 1 / 2Jordan On track Lagging 1 / 2Kenya Far behind Slipping back 0 / 2Liberia Slipping back Far behind 0 / 2Madagascar Slipping back Far behind 0 / 2Malawi On track Lagging 1 / 2Mali Far behind Far behind 0 / 2Mauritania On track Far behind 1 / 2Mozambique On track Far behind 1 / 2Nicaragua Far behind On track 1 / 2Niger Far behind Far behind 0 / 2Nigeria Achieved Far behind 1 / 2Pakistan On track Far behind 1 / 2Senegal Far behind Far behind 0 / 2Sierra Leone Lagging Far behind 0 / 2Somalia Slipping back Far behind 0 / 2Sudan On track Far behind 1 / 2Tanzania Slipping back Far behind 0 / 2Togo On track Far behind 1 / 2Uganda Far behind Lagging 0 / 2Yemen Far behind Far behind 0 / 2Zambia Far behind Slipping back 0 / 2
Subtotal 24 / 76
(continued)
0675-06 BPEA/Sachs 7/22/02 1:13 PM Page 281
be the case. The overhang of unpayable debt, and still more, the buildupof new debt if aid comes in the form of loans rather than grants, wouldconvince potential private sector investors that the country remainstrapped. Creditors themselves might promise their help now only to insiston increased debt service payments in the future if the country starts torecover. These are among the classic arguments for why a fresh startrather than a simple postponement of debt is needed in the case of aninsolvent individual or municipality.
What kind of institutional changes are required to reorient the interna-tional system in the recommended direction? I suggest the following:
282 Brookings Papers on Economic Activity, 1:2002
Table 3. Progress toward Development Goals in Countries That Rescheduled ParisClub Debt as of 2002 (continued)
No. of goalsUnder-five either “on track”
Country Malnourishment mortality rate or “achieved”
In remissionAlgeria On track Slipping back 1 / 2Argentina n.a. On track 1 / 1Brazil On track On track 2 / 2Cambodia On track Slipping back 1 / 2Egypt On track On track 2 / 2El Salvador Far behind On track 1 / 2Haiti Lagging Far behind 0 / 2Mexico On track On track 2 / 2Panama On track On track 2 / 2Peru Achieved On track 2 / 2Philippines Far behind On track 1 / 2Turkey n.a. On track 1 / 1
Subtotal 16 / 22
CuredChile Achieved On track 2 / 2Costa Rica On track On track 2 / 2Dominican Rep. Far behind On track 1 / 2Equatorial Guinea n.a. On track 1 / 1Guatemala Slipping back On track 2 / 2Jamaica On track Far behind 1 / 2Morocco On track On track 2 / 2Trinidad and Tobago Far behind On track 1 / 2
Subtotal 11 / 15
Total 51 / 113
Source: United Nations Development Programme (2002).
0675-06 BPEA/Sachs 7/22/02 1:13 PM Page 282
—The creditors should understand that, in a sovereign insolvency,whether under Chapter 9 in the United States or an international sovereigninsolvency, the systemic goal is not the simple maximization of debtrepayments to the creditors. Repayments to creditors must be placed inthe context of additional objectives: a fresh start for an insolvent sover-eign, preservation of its public functions, and achievement of broaddevelopment objectives. For low-income countries, the basic standard fordebt collection should be to restructure debts in order to provide a macro-economic framework within which the countries can achieve the MDGs.
—Each HIPC should be encouraged—indeed, required, in order toobtain comprehensive debt cancellation—to prepare medium-term plansfor scaling up its investments in health, education, and basic infrastruc-ture during the period from now until 2015. The targets should be set inorder to meet the MDGs. These plans should be designed in conjunctionwith civil society, as part of the ongoing poverty reduction strategyprocess.
—The key U.N. agencies, including the UNDP, the WHO, andUNICEF, and the Bretton Woods institutions should support the countriesin this costing exercise, but they should also carry out independent esti-mates of the countries’ financing needs and incorporate those estimatesinto their own key country strategy documents.
—An independent review panel, with representatives appointed byboth creditor and debtor countries but not representing either, shouldreview the evidence from the countries and from the international agen-cies and make recommendations on the scale of debt cancellation andincreased foreign assistance that should be granted to each country. Formost HIPCs, the objective evidence will support a complete cancellationof debts, plus an increase in foreign assistance, all on a conditional basisto ensure that the increased net resource flow in fact supports the desireddevelopment objectives. The review panel could be convened under IMFauspices, but the recommendations should not be subject to a vote by theIMF’s creditor-dominated executive board. In principle, such recommen-dations should be binding. In practice, it is almost certain that the richcountries will concur with such a system only if such a review panel oper-ates on an advisory basis.
—The United Nations and the Bretton Woods institutions should pro-vide published yearly updates on the progress of each country towardeach of the MDGs. These assessments would help not only in monitoring
Jeffrey D. Sachs 283
0675-06 BPEA/Sachs 7/22/02 1:13 PM Page 283
the low-income countries, but in monitoring the creditor-donor countriesas well.
To the extent that the new system is merely advisory to the creditors,these recommendations may seem unnecessarily modest and might notresolve many of the political economy barriers that have blocked a morerealistic approach to debt cancellation for the poorest countries. But theymight just do the trick. A transparent process would shine important pub-lic light on the shortcomings of the creditor-dominated approach of thepast quarter century. The objective evidence would underscore that thepoorest countries are utterly impoverished and face multiple challenges ofeducation, hunger, water and sanitation, and basic health that cannot bemet without vastly larger flows of resources from the creditor countries.With the world just now recommitted to the MDGs after the Monterreyconference, an organized and intensive spotlight on the shortfall of prac-tice relative to aspiration might help the international community comemuch closer to meeting its avowed aims.
284 Brookings Papers on Economic Activity, 1:2002
0675-06 BPEA/Sachs 7/22/02 1:13 PM Page 284
References
Azariadis, Costas, and Allan Drazen. 1990. “Threshold Externalities in EconomicDevelopment.” Quarterly Journal of Economics 105(2): 501–26.
Bankruptcy Judges Division. 2000. Bankruptcy Basics. Public InformationSeries. Washington (June). (www.uscourts.gov/bankbasic.pdf, accessed May6, 2002.)
Ben-David, Dan. 1998. “Convergence Clubs and Subsistence Economies.” Jour-nal of Development Economics 55(1): 155–71.
Bird, Graham, Mumtaz Hussain, and Joseph P. Joyce. 2000. “Many HappyReturns? Recidivism and the IMF.” Working Paper 2000-04. Wellesley Col-lege (March).
Borchard, Edwin M., and William H. Wynne. 1951. State Insolvency and ForeignBondholders. Yale University Press.
Elbadawi, Ibrahim, and Francis Mwega. 1998. “Can Africa’s Saving Collapse beReverted?” Presented at a World Bank conference on “Savings across theWorld,” September 16–18. (www.worldbank.org/research/projects/savings/pdffiles/mwega2.pdf, accessed May 6, 2002.)
Independent Evaluation Office. 2002. Prolonged Use of IMF Resources: Termsand References for an Evaluation by the Independent Evaluation Office. Wash-ington: International Monetary Fund.
International Monetary Fund. 2001. Impact of Debt Reduction under the HIPCInitiative on External Debt Service and Social Expenditures. Washington.
Krueger, Anne. 2001. “International Financial Architecture for 2002: A NewApproach to Sovereign Debt Restructuring.” Address given at the NationalEconomists’ Club, November 26. (www.imf.org/external/np/speeches/2001/112601.htm, accessed on May 6, 2002.)
Loayza, Norman, Klaus Schmidt-Hebbel, and Luis Servén. 2000. “What DrivesPrivate Saving across the World?” Review of Economics and Statistics 82(2):165–81.
Nelson, Richard. 1956. “A Theory of the Low-Level Equilibrium Trap in Under-developed Economies.” American Economic Review 46(5): 894–908.
Pettifor, Anne. 2002. “Chapter 9/11? Resolving International Debt Crises—TheJubilee Framework for International Insolvency.” London: New EconomicsFoundation (February). (www.jubileeplus.org/analysis/reports/jubilee_framework.pdf, accessed May 6, 2002.)
Rogoff, Kenneth, and Jeromin Zettelmeyer. 2002. “Early Ideas on SovereignBankruptcy Reorganization: A Survey.” Working Paper 02/57. Washington:International Monetary Fund (March).
Sachs, Jeffrey D. 1984. “Theoretical Issues in International Borrowing.” Prince-ton Studies in International Finance 54. Princeton University (July).
———, ed. 1989. Developing Country Debt and Economic Performance. Uni-versity of Chicago Press.
Jeffrey D. Sachs 285
0675-06 BPEA/Sachs 7/22/02 1:13 PM Page 285
———. 1995. “Do We Need an International Lender of Last Resort.” Frank D.Graham Lecture, Princeton University. (www2.cid.harvard.edu/cidpapers/intllr.pdf, accessed May 6, 2002.)
Sachs, Jeffrey D., and Erika Jorgensen. 1989. “Default and Renegotiation ofLatin American Foreign Bonds in the Interwar Period.” In The InternationalDebt Crisis in Historical Perspective, edited by Barry Eichengreen and PeterH. Lindert. MIT Press.
Smith, Adam, and Edwin Cannan. 2000. Wealth of Nations. New York: ModernLibrary.
United Nations Development Programme. 2002. “How Many Countries Are onTrack? The Millennium Declaration’s Goals for Development and PovertyEradication.” Human Development Report (March). New York.
World Health Organization. 2002. Macroeconomics and Health: Investing inHealth for Economic Development: Report of the Commission on Macro-economics and Health. Geneva.
286 Brookings Papers on Economic Activity, 1:2002
0675-06 BPEA/Sachs 7/22/02 1:13 PM Page 286