resolved measurements of xco in ngc...
TRANSCRIPT

The Astrophysical Journal, 744:42 (11pp), 2012 January 1 doi:10.1088/0004-637X/744/1/42C© 2012. The American Astronomical Society. All rights reserved. Printed in the U.S.A.
RESOLVED MEASUREMENTS OF XCO IN NGC 6946
Jennifer Donovan Meyer1, Jin Koda1, Rieko Momose2,3, Masayuki Fukuhara2, Thomas Mooney1, Sarah Towers1,4,Fumi Egusa5,6, Robert Kennicutt7, Nario Kuno8,9, Misty Carty10, Tsuyoshi Sawada3,11, and Nick Scoville6
1 Department of Physics & Astronomy, Stony Brook University, Stony Brook, NY 11794, USA2 Department of Astronomy, University of Tokyo, Hongo, Bunkyo-ku, Tokyo 113-0033, Japan
3 National Astronomical Observatory of Japan, Mitaka, Tokyo 181-8588, Japan4 Department of Physics, Western Michigan University, Kalamazoo, MI 49008, USA
5 Institute of Space and Astronautical Science, Japan Aerospace Exploration Agency, Chuo-ku, Sagamihara, Kanagawa 252-5210, Japan6 Department of Astronomy, California Institute of Technology, Pasadena, CA 91125, USA
7 Institute of Astronomy, University of Cambridge, Cambridge CB3 0HA, UK8 Nobeyama Radio Observatory, Minamimaki, Minamisaku, Nagano 384-1305, Japan
9 Department of Astronomical Science, The Graduate University for Advanced Studies (SOKENDAI), 2-21-1 Osawa, Mitaka, Tokyo 181-0015, Japan10 Department of Astronomy, University of Maryland, College Park, MD 20742, USA11 Joint ALMA Office, Alonso de Cordova 3107, Vitacura, Santiago 763-0355, ChileReceived 2011 July 26; accepted 2011 September 23; published 2011 December 13
ABSTRACT
We present the largest sample to date of giant molecular clouds (GMCs) in a substantial spiral galaxy other thanthe Milky Way. We map the distribution of molecular gas with high resolution and image fidelity within the central5 kpc of the spiral galaxy NGC 6946 in the 12CO (J = 1–0) transition. By combining observations from theNobeyama Radio Observatory 45 m single dish telescope and the Combined Array for Research in MillimeterAstronomy interferometer, we are able to obtain high image fidelity and accurate measurements of LCO comparedwith previous purely interferometric studies. We resolve individual GMCs, measure their luminosities and virialmasses, and derive XCO—the conversion factor from CO measurements to H2 masses—within individual clouds.On average, we find that XCO = 1.2 × 1020 cm−2 (K km s−1)−1, which is consistent within our uncertainties withpreviously derived Galactic values as well as the value we derive for Galactic GMCs above our mass sensitivitylimit. The properties of our GMCs are largely consistent with the trends observed for molecular clouds detected inthe Milky Way disk, with the exception of six clouds detected within ∼400 pc of the center of NGC 6946, whichexhibit larger velocity dispersions for a given size and luminosity, as has also been observed at the Galactic center.
Key words: galaxies: individual (NGC 6946) – galaxies: ISM – ISM: molecules
Online-only material: color figure
1. INTRODUCTION
Studies of extragalactic giant molecular clouds (GMCs)shape our understanding of spiral galaxies on both small andlarge scales. Within GMCs, on scales smaller than these massivebound gas structures, individual gas cores inside the cloudscondense and form new stars. On scales larger than GMCs,global galaxy dynamics govern the motions of these massivegas clouds, where we study the physical environments whichcreate and destroy them. Much of what is known about theevolution of the interstellar medium in spiral galaxies has beenlearned by analyzing the properties of these large molecularclouds of gas (i.e., Wada 2008; Koda et al. 2009; Tasker & Tan2009; Dobbs et al. 2011; Egusa et al. 2011).
In order to study the gas of GMCs, which is primarilycomposed of molecular hydrogen, other molecular tracers—themost common of these being the lower rotational transitions ofCO—are typically observed since the overall gas temperaturesare too low to directly excite H2 line emission. Accuratedeterminations of the masses of GMCs are thus dependent uponan accurate relation between CO flux and H2 mass, known inthe literature as the XCO factor. Values of this conversion factorhave been derived for molecular clouds within our own Galaxy(Solomon et al. 1987; Scoville et al. 1987; Dame et al. 2001)as well as compiled for nearby galaxies (Bolatto et al. 2008); towithin a factor of two, the typical value seems to hover around2–3 × 1020 cm−2 (K km s−1)−1 (Solomon et al. 1987, butsee Heyer et al. 2009; Scoville et al. 1987; Wilson & Scoville
1990; Dame et al. 2001; Oka et al. 2001; Blitz et al. 2007;Bolatto et al. 2008), with higher values observed in the SmallMagellanic Cloud (SMC; Israel 1997; Leroy et al. 2007; Blitzet al. 2007; Bolatto et al. 2008).
The conversion factor, derived from Galactic clouds andresolved extragalactic GMCs in various environments, is used toderive molecular gas masses for unresolved GMCs in galaxiesout to high redshift. Deriving this value in nearby GMCsis therefore crucial to our understanding of the amount ofmolecular gas, molecular fraction, and star formation efficiency(star formation rate per unit gas mass) in galaxies as a functionof redshift and environment.
For galaxies other than the Milky Way, GMC studies aretypically resolution-limited (see the discussion in Rosolowsky& Leroy 2006). In order to identify individual molecular clouds,only nearby galaxies can be studied, which has kept the availablesample of extragalactic clouds relatively small. For this reason,investigations into individual extragalactic GMC properties, andvariations of these with GMC environments, have been mostlylimited to clouds inhabiting Local Group galaxies (e.g., Wilson& Scoville 1990; Arimoto et al. 1996; Israel 1997; Boselli et al.2002; Blitz et al. 2007; Bolatto et al. 2008; Hughes et al. 2010;Bigiel et al. 2010; Leroy et al. 2011).
Even when they are resolvable, the determination of GMCboundaries is not straightforward. In addition to being limitedby instrumental resolution, the appropriate spatial separation oftwo (or more) adjacent clouds is not always obvious in crowdedor highly blended regions. Various studies of Galactic GMCs
1

The Astrophysical Journal, 744:42 (11pp), 2012 January 1 Donovan Meyer et al.
(e.g., Solomon et al. 1987; Scoville et al. 1987) have solvedthis issue by identifying clouds “by hand” above a specifictemperature contour (which is dependent upon the sensitivityof the instrument). More recently, automated algorithms havebeen developed (e.g., Williams et al. 1994; Rosolowsky & Leroy2006) in order to identify individual clouds; these commonlyused codes differ in their clump identification philosophy,particularly with regard to the amount of flux included inidentified clumps, as discussed at length by Rosolowsky &Leroy (2006).
Before even identifying individual GMCs, many studiesof extragalactic clouds suffer from the more fundamentalproblem of missing zero spacing information. Observing thegas distribution of a galaxy with only an interferometer neglectsextended flux on the largest scales, where it is “resolved out”by the beam of an interferometric array. This effect can be quitesignificant (Koda et al. 2011).
1.1. CARMA and NRO45 CO Survey of Nearby Galaxies
To investigate GMC evolution in galactic disks and resolvethe physics which controls the star formation rate within GMCs,we will present resolved observations of GMCs across thedisks of nearby galaxies in a CO Survey of Nearby Galaxiesbased on observations using the Combined Array for Researchin Millimeter Astronomy (CARMA) interferometer and theNobeyama Radio Observatory 45 m (NRO45) single dishtelescopes. To date, 13 galactic disks have been observed withboth CARMA and NRO45 as part of the survey, and 4 additionalgalaxies have been observed with the single dish. The designof the survey will be discussed in J. Koda et al. (2012, inpreparation). In our survey, we will resolve individual GMCsin a significant sample of nearby spiral galaxies with a varietyof morphologies in order to study the evolution of molecularclouds and star formation.
In this paper, we combine observations from CARMA andNRO45 in order to achieve high resolution, as well as extremelyhigh image fidelity, and resolve individual extragalactic GMCsin NGC 6946 to highlight the results made possible by oursurvey. In Section 2 we describe the observations, and we presentthe results in Section 3 as well as a discussion of the boundariesof individual GMCs. We utilize the well-known CLUMPFINDalgorithm (Williams et al. 1994) to derive sizes and velocitydispersions for individual GMCs. In Section 4, we discussthe properties of our detected GMC sample and determine theconversion factor XCO within individual clouds. We summarizeour conclusions in Section 5.
2. OBSERVATIONS
2.1. Nobeyama Radio Observatory
We observe NGC 6946 in the 12CO (1–0) transition withthe Nobeyama 45 m single dish telescope,12 using the BeamArray Receiver System (BEARS) instrument. Observationswere performed during the early months of 2008, 2009, and2010 (throughout our three-year observing program at NRO)as part of our CO Survey of Nearby Galaxies. BEARS is amulti-beam receiver with 25 beams, which are aligned in a 5 ×5 orientation. The FWHM of the 45 m dish is 15′′ at 115 GHz(19.′′7 after regridding), and we observe with channel incrementsof 500 kHz and Hanning smooth for a velocity resolution
12 Nobeyama Radio Observatory is a branch of the National AstronomicalObservatory of Japan, National Institutes of Natural Sciences.
of 2.54 km s−1. After dropping the edge channels, we use abandwidth of 265 MHz (690 km s−1). For most of the scans, thesystem temperature in the double sideband (DSB) of BEARSranges from 300 to 400 K; scans with Tsys much higher than400 K (due to being observed during daylight hours) are heavilydown-weighted and as a result do not contribute much to thefinal images. The ratio of the upper-to-lower sideband (knownas the scale factor) was confirmed each year to be within afew percent by observing Galactic CO sources (e.g., asymptoticgiant branch stars) with BEARS and the single sideband (SSB)S100 receiver and making subsequent corrections. We use theS40 receiver and Galactic masers for pointing. The pointingwas checked roughly every two hours during the observationsand was accurate to 2′′–3′′. We convert TA∗ to Tmb assumingthat the main beam efficiency of the telescope is 0.4 (i.e.,Tmb = TA∗/0.4).
Using on-the-fly (OTF) mapping, NGC 6946 was scanned inthe R.A. and decl. directions, and positions external to the galaxy(OFF positions) were observed between scans. Extrapolatingbetween OFF scans on opposite sides of the galaxy greatlyreduced nonlinearities in the spectral baselines. The duration ofeach scan (ON + OFF) was ∼1 minute, and the entire galaxy wasmapped in ∼40 minutes; a total of 36 usable maps were takenfor a total of 24 hr of observation time (including ON, OFF,and slew time). The scans were separated by 5′′, resulting inoversampling by a factor of three compared to the 15′′ FWHMof the beam, which is necessary in order to achieve Nyquistsampling (5.′′96) of λCO/D = 11.′′92 (where λCO is the observedwavelength, 2.6 mm, and D is the antenna diameter, 45 m). Thedata reduction and sky subtraction, performed by interpolatingbetween the OFF scans for each OTF (ON) scan, were completedusing the NOSTAR package developed at the NRO. Spatialbaseline-subtracted maps were made separately from the scansin the R.A. and decl. directions in order to minimize systematicerrors in the scan directions, and these were subsequently co-added. The rms noise of these single dish observations is 0.13 K(0.57 Jy beam−1).
2.2. CARMA
To complement the single dish observations, NGC 6946 wasalso observed in the 12CO (1–0) transition in 2009 April with theC and D configurations of CARMA. CARMA is a 15-elementinterferometer which combines six 10 m antennae (originally theOwens Valley Radio Observatory, or OVRO) with nine 6 m an-tennae (formerly the Berkeley–Illinois–Maryland Association,or BIMA) to achieve superior uv-coverage compared to eitherof its predecessors. The observations of NGC 6946 were per-formed using three dual sidebands, each with 63 channels, fora total bandwidth of ∼100 MHz (after removing six edge chan-nels per sideband) and a channel width of 2.54 km s−1. After atotal of ∼21 hr on source (including calibrators), we achieve anrms of 0.73 K.
2.3. Combination Procedure
In order to combine the data from the single dish andinterferometer, the NRO45 image is converted to visibilities,combined with the CARMA visibilities in the uv-plane, and thenew uv data set is imaged together. We follow the procedurethoroughly described in Koda et al. (2011) for the imaging ofM51, and we refer the reader to that paper for the details of theNRO45 deconvolution, combination in uv-space, and imagingprocess. In that paper, the relative uv-coverage of the single
2

The Astrophysical Journal, 744:42 (11pp), 2012 January 1 Donovan Meyer et al.
Figure 1. CO map of NGC 6946 (left) and flux assigned to 134 clumps by CLUMPFIND (right). Our imaging is optimized to resolve GMCs but not to detect lessmassive GMCs.
Table 112CO Observations of NGC 6946
Observing Parameter NRO45 CARMA Combined
Observing time (hr) 24 21 45Bandwidth (MHz) 265 100 100Velocity resolution (km s−1) 2.54 2.54 2.54Beam size (′′) 19.7 · · · 2.3 × 2.3rms (K) 0.13 0.73 1.9 (0.11 Jy beam−1)
dish and interferometer observations enabled the single dishvisibilities to be flagged beyond 4 kλ, as CARMA visibilitiesexisted down to this value. We keep the NRO45 visibilities out to10 kλ in order to ensure sufficient overlap between the two setsof uv-coverage. The rms of the combined cube is 0.11 Jy beam−1
(1.9 K) using the combined synthesized beam, discussed below.We maintain the instrumental velocity resolution of 2.54 km s−1
to optimize our ability to resolve, not only to detect, GMCs. Theobserving parameters for both the single dish and interferometricdata sets are summarized in Table 1.
2.3.1. Combined Synthesized Beam
Combining interferometric and single dish information isnon-trivial, as each is imprinted with the intrinsic beam size withwhich the observation is made. Typically, when deconvolving in-terferometric data, the process (e.g., CLEAN) removes the syn-thesized beam pattern at the location of each emission peak de-tected in the dirty map above some threshold and replaces it witha convolution beam, which is typically Gaussian in shape. Theconvolution beam in the case of a combined (interferometer +single dish) data set requires a beam comprised of weightedcomponents from both telescopes and is effectively a super-position of two Gaussians with quite different FWHM sizes.Cleaning algorithms, such as invert within the interferometricdata reduction package miriad, yield an output dirty beam whosepoint-spread function can be fitted with one Gaussian to achievethe beam size, but we find that this method does not lead to fluxconservation since the two-component beam does not have asimple Gaussian shape.
Table 2Properties of NGC 6946
R.A.J2000 20h34m52.s3Decl.J2000 60◦09′14′′Morphologya SABcdDistanceb 6.08 MpcOptical velocitya 40 km s−1
Major diametera 11.′5
Notes. References: a NASA/IPAC ExtragalacticDatabase (NED); b Herrmann et al. (2008).
In order to ensure that we conserve the flux in our combinedNRO45+CARMA cube, we assume that the single dish obser-vations accurately measure the total flux of NGC 6946. Wecalculate the flux in the single dish dirty map and compare itto the flux measured in the combined cleaned map; if the fluxis conserved, these should be equal. We choose the beam sizewhich leads to flux conservation by setting equal the single dishflux per single dish beam (with units Jy beam−1
SD), both of whichwe know, and the flux in the combined dirty map per combinedbeam (with units Jy beam−1
comb), where we know the flux but notthe beam size:
fluxSD (Jy)
beamSD (′′)= fluxcombined (Jy)
beamcombined (′′). (1)
In this way, we calculate the intrinsic size of the combinedbeam (2.′′3 × 2.′′3) and use this value to clean the combinedmap. We refer the reader to Koda et al. (2011) for a completediscussion of this step in the data combination procedure.
3. RESULTS
3.1. Imaging
NGC 6946 is a well-known nearby spiral galaxy. Its generalproperties are listed in Table 2, and our CO imaging is presentedin Figures 1 and 2. The combined uv data sets are imaged withpurely uniform weighting (robust = −5), where a weighting
3

The Astrophysical Journal, 744:42 (11pp), 2012 January 1 Donovan Meyer et al.
Figure 2. CO emission from NGC 6946; every other velocity channel is shown. The contour plotted represents 2σ (0.22 Jy beam−1).
scheme is applied to the visibilities which is inversely propor-tional to the sampling density (in effect, weighting all cells thesame at the cost of higher rms noise). This method takes advan-tage of the highest possible resolution of the array and yields abeam size of 2.′′3 (calculated as described in Section 2.3.1).
We overlay the high-resolution CO imaging on a HubbleSpace Telescope (HST) Hα image of the center of NGC 6946in Figure 3. The CO emission traces the spiral arm and barstructures at the center of the galaxy. To the north and southeastof the nucleus, the CO emission and dust lanes apparent in theHα image appear to be well matched. As the spiral arm structureconsists of adjacent stellar light and dust features (inferred fromthe Hα absorption), where the CO does not match the absorptionprecisely, its peaks tend to be found on the edge of the absorptionfeature nearer to the stellar component.
NGC 6946 is known to host a molecular bar (Ball et al. 1985),and we show the velocity field of NGC 6946 in Figure 4 toaccentuate the regions where narrow spatial regions span largeranges in velocity. These are the offset ridges of the galactic bar,which largely coincide with the edges of the dust lanes seen inthe Hα image.
3.2. Defining Giant Molecular Clouds
Given the distance of NGC 6946 and our spatial resolution of68 pc, we expect to be sensitive to the largest GMCs and giantmolecular associations (GMAs). The typical size of a GalacticGMC is 40 pc (Scoville & Sanders 1987), but measurements
range from less than 20 pc to over 100 pc (Solomon et al. 1987;Scoville et al. 1987). We utilize CLUMPFIND (Williams et al.1994), a well-known algorithm designed to search image cubesin three-dimensional (x–y–v) space for coherent emission, inorder to decompose our detected CO emission into individualmolecular clouds (e.g., Koda et al. 2009; Egusa et al. 2011).
CLUMPFIND assigns emission to individual clouds by con-touring the emission in a data cube at multiples of the rmsnoise, identifying peaks, and following the peaks to lower in-tensities. We find CLUMPFIND to be the simplest algorithmfor cloud decomposition, as it requires only two user-specifiedinputs: the contour increment and the minimum contour level(i.e., where to stop), and it assumes no physical priors in theclump decomposition process. We find that the most believableoutput is returned when using twice the rms noise of the datacube (0.11 Jy beam−1) for both the increment and minimumcontour level; Williams et al. (1994) also strongly recommendthese values for the two parameters. We show an example of theclouds extracted by the algorithm in several subsequent velocitychannels in Figure 5.
All clumps returned by the algorithm have integrated fluxmeasurements greater than 3σ (0.33 Jy beam−1). Additionally,the velocity profile of each clump is visually inspected usingthe clplot package within CLUMPFIND, and any clumps withprofiles which do not appear to be single entities (i.e., apparentlyblended profiles) are removed from the sample.
The algorithm returns the FWHM extents of each clump inthe x-, y-, and v-directions, calculates the total two-dimensional
4

The Astrophysical Journal, 744:42 (11pp), 2012 January 1 Donovan Meyer et al.
Figure 3. Central region of NGC 6946 is shown. CO contours are overlaid on the CO imaging (left) and Hα imaging from HST (right). The molecular gas coincideswith the spiral arm structures, namely, the apparent stellar features and dust lanes. North is up, and east is to the left.
Figure 4. Velocity field of the CO emission in NGC 6946. CO velocities are color-coded (left) with contours drawn every 10 km s−1. The same contours are shownoverlaid on the HST Hα image (right).
areas of each clump from the pixels assigned and the totaldetected flux within the three-dimensional clump volume, andderives clump radii assuming the calculated areas are circular.We account for the beam size (the spatial resolution element)by subtracting in quadrature the beam size of a point sourcewith the same peak temperature as the clump, measured out to
the radius at which the increment equals the minimum contourlevel (where T = ΔT ), from the radii calculated using the areamethod (as described in Appendix A of Williams et al. 1994).We account for the velocity resolution, or the (non-Gaussian)channel width, in our velocity dispersions by approximatingthe instrumental dispersion to be half of the channel width and
5

The Astrophysical Journal, 744:42 (11pp), 2012 January 1 Donovan Meyer et al.
Figure 5. Clouds detected in the central region of NGC 6946. Channels areseparated by 5 km s−1and colors are coded by clump number. The black circlesindicate the same scale on each panel.
(A color version of this figure is available in the online journal.)
subtracting this value in quadrature from the measured velocitydispersions. The equations are
R =
√√√√R2
meas −(
b
2.355
√2 ln
(Tpeak
ΔT
))2
, (2)
and
σv =√
σ 2v,meas −
(Δvchan
2
)2
. (3)
Rosolowsky & Leroy (2006) define more complex treatmentsof these quantities which require the extrapolations of cloudsout to 0 K. We find good agreement between the values forthe velocity dispersion (to within 4%) calculated using bothmethods, but the size measurements diverge for clouds smallerthan our beam size. Since our measurements of size and velocitydispersion are measured out to a contour equal to twice the rms,not extrapolated to 0 K, we opt to use the Williams method toestimate the sizes and velocity dispersions of the clouds.
Following, e.g., Wilson & Scoville (1990), we take theuncertainties in our measurements to be 25% of the spatial beamsize (17 pc) and half of our velocity channel width (1.3 km s−1).These values are appropriate for the largest clouds in our sample,but the uncertainties in the clouds with sizes and velocitydispersions near our resolution limits may be larger. RunningCLUMPFIND to a lower minimum contour level (1.5σ ) createsmore detections of faint clouds, but the resulting change inXCO within the individual GMCs presented in this paper is wellwithin these quoted measurement errors.
3.2.1. Derived Properties
We use the cloud measurements to calculate cloud virialmasses in the following manner. Using the definition of potentialenergy from McKee & Zweibel (1992) and the kinetic energyin terms of the one-dimensional velocity dispersion, Williamset al. (1994) express the virial mass as
Mvir = 5ΔRσ 2v
αvirG, (4)
where ΔR is the circular radius of a clump, σv is the one-dimensional velocity dispersion, G is the gravitational constant,
and αvir is the “virial parameter” which describes a non-uniformdensity profile. If we parameterize the density profile as
ρ(r) = ρ1
(R1
r
)β
, (5)
we find that integrating over dM = ρ(r)ydydx yields
Mvir = 4πρ1R31
3 − β. (6)
Substituting the expressions in Equations (5) and (6) intothe gravitational energy for a spherical body (Equation (2.32),Binney & Tremaine 2008) yields the relation
3
5αvir = 3 − β
5 − 2β. (7)
It follows that for β = 0, αvir = 1; for β = 1, αvir = 10/9;and for β = 2, αvir = 5/3 (as also mentioned by Williams et al.1994).
If we assume that β = 1, as many authors do (e.g., Solomonet al. 1987; Rosolowsky & Leroy 2006; Bolatto et al. 2008), andG = 1/232 (using units of km s−1, parsecs, and solar mass),substituting into Equation (4) yields
Mvir = 1040Rσ 2v , (8)
as shown by Solomon et al. (1987) and similarly by Wilson &Scoville (1990). We assume that the GMCs are virialized, anassumption consistent with previous studies, and derive virialmasses using the measurements of R and σv (corrected for theirrespective resolution elements) via Equation (8).
Solomon et al. (1987) describe the virial mass as
Mvir = 3fpSσ 2v
G, (9)
where fp is called a projection factor and the size of the cloud(S) is related to the effective radius (derived from the circulararea of the cloud on the sky) such that Reff = 1.91 S. However,this projection factor, indicated to equal 2.9, is not explicitlyderived and as a result does not appear in many recent paperson this topic. Using the formulae shown above, it is trivial toderive that fp = 2.9 when αvir = 10/9.
To calculate XCO, in effect the mass-to-light ratio for molec-ular clouds, we compare the virial masses of each cloud to theluminosities derived from each cloud’s integrated CO flux. Wecalculate cloud luminosities via
LCO = 13.6λmm2FCO
θaθb
, (10)
where λ is the observed wavelength (in mm), FCO is the fluxdensity in Jy beam−1 km s−1 arcsec2, and θa and θb are thebeam axes (arcsec). Finally, with Mvir in units of solar massesand LCO in units of K km s−1 pc2, and including a factor of1.36 to account for helium, we compute XCO (the CO-to-H2conversion factor) as follows:
XCO[cm−2(K km s−1)−1] = 4.60 × 10¹⁹ Mvir
LCO. (11)
6

The Astrophysical Journal, 744:42 (11pp), 2012 January 1 Donovan Meyer et al.
Table 3Properties of GMCs in NGC 6946
Number R.A.J2000 Decl.J2000 R σv LCO Mvir XCO
(pc) (km s−1) (105 K km s−1 pc2) (105 M�) (1020 [cm−2 (K km s−1)−1])
1 20h 34m 52.s73 60◦ 9′ 12′′ 117 11.5 118 161 0.6302 20h 34m 52.s66 60◦ 9′ 14′′ 155 14.7 152 348 1.053 20h 34m 52.s73 60◦ 9′ 13′′ 154 7.89 88.5 99.7 0.5184 20h 34m 53.s60 60◦ 9′ 19′′ 189 9.04 117 161 0.6335 20h 34m 51.s79 60◦ 9′ 18′′ 123 8.86 55.8 101 0.8296 20h 34m 52.s73 60◦ 9′ 89.7 10.5 31.7 104 1.507 20h 34m 52.s80 60◦ 9′ 30′′ 146 9.91 46.2 149 1.498 20h 34m 48.s05 60◦ 7′ 53′′ 145 5.84 28.9 51.6 0.8229 20h 34m 51.s66 60◦ 9′ 23′′ 113 14.2 50.1 236 2.1710 20h 34m 41.s48 60◦ 8′ 47′′ 43.8 3.82 3.09 6.64 0.98911 20h 34m 52.s20 60◦ 9′ 27′′ 94.8 12.0 28.7 143 2.2912 20h 34m 51.s93 60◦ 9′ 19′′ 95.8 17.6 42.0 309 3.3813 20h 34m 45.s77 60◦ 8′ 138 5.52 24.4 43.7 0.82514 20h 34m 41.s21 60◦ 8′ 49′′ 40.4 4.89 4.59 10.0 1.0115 20h 34m 42.s95 60◦ 9′ 6.′′5 116 8.01 23.0 77.1 1.5416 20h 34m 50.s72 60◦ 8′ 25′′ 98.0 5.87 13.5 35.1 1.2017 20h 34m 55.s08 60◦ 9′ 51′′ 45.2 4.90 4.66 11.3 1.1118 20h 34m 43.s22 60◦ 8′ 35′′ 76.0 2.76 6.49 6.04 0.42819 20h 34m 59.s76 60◦ 8′ 18′′ 89.5 5.02 8.55 23.4 1.2620 20h 35m 2.s913 60◦ 9′ 13′′ 57.8 2.63 3.33 4.17 0.57621 20h 34m 55.s88 60◦ 8′ 25′′ 60.3 2.76 3.22 4.79 0.68322 20h 34m 56.s01 60◦ 8′ 15′′ 82.0 3.84 5.87 12.6 0.98623 20h 34m 58.s09 60◦ 8′ 37′′ 37.4 2.56 2.06 2.55 0.56924 20h 34m 53.s80 60◦ 8′ 10′′ 49.3 2.85 2.21 4.15 0.86325 20h 34m 55.s34 60◦ 8′ 53′′ 59.3 4.59 4.06 13.0 1.4826 20h 34m 54.s67 60◦ 8′ 5.′′0 56.9 5.02 3.75 14.9 1.8327 20h 34m 50.s92 60◦ 9′ 58′′ 90.3 4.19 6.66 16.5 1.1428 20h 34m 53.s13 60◦ 10′ 65.7 3.51 3.80 8.42 1.0229 20h 34m 50.s32 60◦ 8′ 27′′ 60.9 3.15 3.43 6.29 0.84430 20h 34m 53.s07 60◦ 8′ 59′′ 39.2 5.40 1.89 11.9 2.90
4. DISCUSSION
4.1. Structure and Dynamics of CO
From Figure 1, it is clear that most of the bright CO emissionwhich is included in the resolved GMCs is coincident with spiralarms, but significant emission is also found in the inter-armregions. The GMCs identified by the CLUMPFIND algorithmtend to be the largest, brightest clouds: those in the spiral arms.The inter-arm emission appears to be more extended, whichis consistent with it being less likely to display an apparentlyself-gravitating velocity profile.
4.2. Properties of Individual GMCs
We resolve a total of 134 clouds. After discarding potentialblends, as described in Section 3.2, 120 clouds remain inour GMC sample. Using the equations in Section 3.2 toaccount for the instrumental resolution elements, 64 cloudshave a real velocity dispersion. We require that clouds have avelocity dispersion of at least 2.54 km s−1 (twice our estimatedinstrumental dispersion) to be included in the sample, leaving30 resolved clouds. The entire sample of 134 identified cloudsis useful to examine the overall distribution of molecular gaswhich exists in GMCs, but the 30 fully resolved clouds will bethe ones for which we derive virial masses, luminosities, andXCO. These clouds are listed in Table 3.
The radii and velocity dispersions of the 30 fully resolvedGMCs are shown in Figure 6, as are the measurements ofresolved Milky Way disk clouds detected by Solomon et al.(1987) for comparison. Solomon et al. (1987) performed the
Figure 6. Radii plotted against the velocity dispersions of the GMC sampledetected in NGC 6946 are shown. The properties of the Milky Way GMCsample measured by Solomon et al. (1987) are plotted for comparison. Theempirical relation of Solomon et al. of 0.72 ×R0.5 is also shown.
seminal study of GMCs in the Galactic disk and showed thatthe relationship between the sizes and velocity dispersions ofGMCs are not related by an exponent of 1
3 , as predicted byKolmogorov turbulence (Larson 1981), but instead by an indexof 0.5, as is consistent with clouds in virial equilibrium.
However, more recently, comparisons of GMCs at the Galac-tic center using various tracers have been made to those
7

The Astrophysical Journal, 744:42 (11pp), 2012 January 1 Donovan Meyer et al.
Figure 7. Luminosities and velocity dispersions of the NGC 6946 and GalacticSolomon et al. (1987) samples are shown. The fit to the Galactic points, LCO ≈130 σ 5
v K km s−1 pc2, is also shown.
throughout the disk, indicating that departures from the tra-ditional relation do occur for clouds at the Galactic center(Miyazaki & Tsuboi 2000; Oka et al. 2001). The observed ten-dency is for clouds to exhibit higher velocity dispersions for agiven size. Although our map covers the central region of NGC6946, the measurements of its GMCs are largely consistent withthe Galactic disk relation with some scatter, particularly for thelargest clouds. The measurements of radius and velocity dis-persion may even be consistent with a slope larger than 0.5,the value measured by several authors for Milky Way cloudswithin the disk and at the Galactic center (Solomon et al. 1987;Miyazaki & Tsuboi 2000; Oka et al. 2001).
For the largest clouds, the observed scatter goes to higherσv for a given size, and in fact, the six clouds which fall wellabove the Solomon relation are all located within ∼400 pc ofthe center of NGC 6946, consistent with the trend observed tobe true for the center of our Galaxy. The smallest clouds whichdeviate from the Solomon relation are very close to our velocityresolution limit. While we are not sensitive to the full range ofGMCs detected in the Galaxy by Solomon et al. (1987), ourdetected GMCs are largely consistent with the biggest clouds inthe Galactic sample. While the Milky Way clouds included in theSolomon et al. (1987) study were measured using a contouringmethod which is physically distinct from the decompositionalgorithm employed in this paper, the consistent trends presentin both samples indicate similar underlying physics at work inboth the center of NGC 6946 and the disk of our Galaxy.
The GMC luminosities are shown in Figure 7. The Galacticpoints and their linear fit (Solomon et al. 1987) are alsoshown for comparison. Again, our GMC sample is largelyconsistent with the measurements of the brightest Galacticclouds in the Solomon sample, though a fit to the NGC 6946clouds would be shallower than the relation measured bySolomon et al. (1987). The brightest GMCs—the same cloudswhich fall above the Solomon radius–σv relation—appear tobe underluminous for their velocity dispersion compared tothe Galactic relation. Though blended clouds could artificiallyproduce this relationship, since the total luminosity of multipleoptically thick 12CO clouds along the same line of sight maynot increase linearly with the amount of CO-emitting gas(depending on the geometry), the velocity dispersion wouldbetray the presence of more than one cloud via multiple peaks.We individually inspect each cloud to select them on the basis of
Figure 8. Luminosities and virial masses of the NGC 6946 GMC sample andthe Galactic Solomon et al. (1987) sample are shown. The overplotted fit to theGalactic points, Mvir = 39 × (LCO)0.81, is consistent with both sets of GMCs.
Figure 9. Histogram of the GMC masses in the NGC 6946 sample. The solidline indicates the sample of 120 resolved clouds with apparently self-gravitatingprofiles, and the shaded area indicates the sample of 30 clouds on which webase our analysis.
their apparently unblended velocity profiles, so blended clouds(at least at our velocity resolution limit) cannot explain thisfinding.
4.3. CO-to-H2 Conversion Factor
The virial masses and CO luminosities of our NGC 6946GMC sample are shown in Figure 8. Once again, we compareour measurements to the Galactic sample; the overlaid linear fitis derived in Solomon et al. (1987). The median mass of ourGMC sample is comparable to the most massive Galactic diskGMCs, but we find excellent consistency between the trends.The histogram of our GMC sample is shown in Figure 9.
Including a factor of 1.36 to account for heavier elements, theaverage value of XCO for the GMC sample is 1.2 × 1020 cm−2
(K km s−1)−1; this value can vary by as much as a factor of twowith our assumed uncertainties. This value is roughly a factor oftwo below the average value of the conversion factor which wecalculate from the Solomon et al. (1987) Galactic disk clouds of2.6 × 1020 cm−2 (K km s−1)−1 (derived using the same factorfor heavier elements). If we calculate XCO from the Solomon
8
The Astrophysical Journal, 744:42 (11pp), 2012 January 1 Donovan Meyer et al.
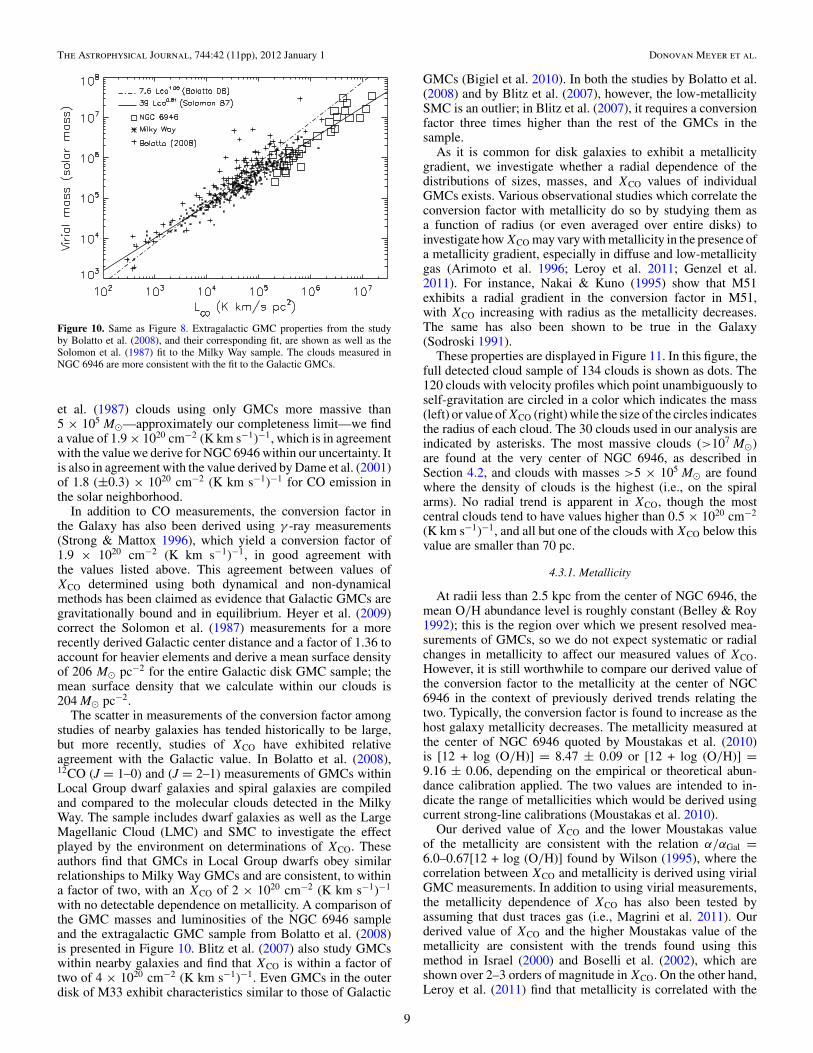
Figure 10. Same as Figure 8. Extragalactic GMC properties from the studyby Bolatto et al. (2008), and their corresponding fit, are shown as well as theSolomon et al. (1987) fit to the Milky Way sample. The clouds measured inNGC 6946 are more consistent with the fit to the Galactic GMCs.
et al. (1987) clouds using only GMCs more massive than5 × 105 M�—approximately our completeness limit—we finda value of 1.9 × 1020 cm−2 (K km s−1)−1, which is in agreementwith the value we derive for NGC 6946 within our uncertainty. Itis also in agreement with the value derived by Dame et al. (2001)of 1.8 (±0.3) × 1020 cm−2 (K km s−1)−1 for CO emission inthe solar neighborhood.
In addition to CO measurements, the conversion factor inthe Galaxy has also been derived using γ -ray measurements(Strong & Mattox 1996), which yield a conversion factor of1.9 × 1020 cm−2 (K km s−1)−1, in good agreement withthe values listed above. This agreement between values ofXCO determined using both dynamical and non-dynamicalmethods has been claimed as evidence that Galactic GMCs aregravitationally bound and in equilibrium. Heyer et al. (2009)correct the Solomon et al. (1987) measurements for a morerecently derived Galactic center distance and a factor of 1.36 toaccount for heavier elements and derive a mean surface densityof 206 M� pc−2 for the entire Galactic disk GMC sample; themean surface density that we calculate within our clouds is204 M� pc−2.
The scatter in measurements of the conversion factor amongstudies of nearby galaxies has tended historically to be large,but more recently, studies of XCO have exhibited relativeagreement with the Galactic value. In Bolatto et al. (2008),12CO (J = 1–0) and (J = 2–1) measurements of GMCs withinLocal Group dwarf galaxies and spiral galaxies are compiledand compared to the molecular clouds detected in the MilkyWay. The sample includes dwarf galaxies as well as the LargeMagellanic Cloud (LMC) and SMC to investigate the effectplayed by the environment on determinations of XCO. Theseauthors find that GMCs in Local Group dwarfs obey similarrelationships to Milky Way GMCs and are consistent, to withina factor of two, with an XCO of 2 × 1020 cm−2 (K km s−1)−1
with no detectable dependence on metallicity. A comparison ofthe GMC masses and luminosities of the NGC 6946 sampleand the extragalactic GMC sample from Bolatto et al. (2008)is presented in Figure 10. Blitz et al. (2007) also study GMCswithin nearby galaxies and find that XCO is within a factor oftwo of 4 × 1020 cm−2 (K km s−1)−1. Even GMCs in the outerdisk of M33 exhibit characteristics similar to those of Galactic
GMCs (Bigiel et al. 2010). In both the studies by Bolatto et al.(2008) and by Blitz et al. (2007), however, the low-metallicitySMC is an outlier; in Blitz et al. (2007), it requires a conversionfactor three times higher than the rest of the GMCs in thesample.
As it is common for disk galaxies to exhibit a metallicitygradient, we investigate whether a radial dependence of thedistributions of sizes, masses, and XCO values of individualGMCs exists. Various observational studies which correlate theconversion factor with metallicity do so by studying them asa function of radius (or even averaged over entire disks) toinvestigate how XCO may vary with metallicity in the presence ofa metallicity gradient, especially in diffuse and low-metallicitygas (Arimoto et al. 1996; Leroy et al. 2011; Genzel et al.2011). For instance, Nakai & Kuno (1995) show that M51exhibits a radial gradient in the conversion factor in M51,with XCO increasing with radius as the metallicity decreases.The same has also been shown to be true in the Galaxy(Sodroski 1991).
These properties are displayed in Figure 11. In this figure, thefull detected cloud sample of 134 clouds is shown as dots. The120 clouds with velocity profiles which point unambiguously toself-gravitation are circled in a color which indicates the mass(left) or value of XCO (right) while the size of the circles indicatesthe radius of each cloud. The 30 clouds used in our analysis areindicated by asterisks. The most massive clouds (>107 M�)are found at the very center of NGC 6946, as described inSection 4.2, and clouds with masses >5 × 10⁵ M� are foundwhere the density of clouds is the highest (i.e., on the spiralarms). No radial trend is apparent in XCO, though the mostcentral clouds tend to have values higher than 0.5 × 1020 cm−2
(K km s−1)−1, and all but one of the clouds with XCO below thisvalue are smaller than 70 pc.
4.3.1. Metallicity
At radii less than 2.5 kpc from the center of NGC 6946, themean O/H abundance level is roughly constant (Belley & Roy1992); this is the region over which we present resolved mea-surements of GMCs, so we do not expect systematic or radialchanges in metallicity to affect our measured values of XCO.However, it is still worthwhile to compare our derived value ofthe conversion factor to the metallicity at the center of NGC6946 in the context of previously derived trends relating thetwo. Typically, the conversion factor is found to increase as thehost galaxy metallicity decreases. The metallicity measured atthe center of NGC 6946 quoted by Moustakas et al. (2010)is [12 + log (O/H)] = 8.47 ± 0.09 or [12 + log (O/H)] =9.16 ± 0.06, depending on the empirical or theoretical abun-dance calibration applied. The two values are intended to in-dicate the range of metallicities which would be derived usingcurrent strong-line calibrations (Moustakas et al. 2010).
Our derived value of XCO and the lower Moustakas valueof the metallicity are consistent with the relation α/αGal =6.0–0.67[12 + log (O/H)] found by Wilson (1995), where thecorrelation between XCO and metallicity is derived using virialGMC measurements. In addition to using virial measurements,the metallicity dependence of XCO has also been tested byassuming that dust traces gas (i.e., Magrini et al. 2011). Ourderived value of XCO and the higher Moustakas value of themetallicity are consistent with the trends found using thismethod in Israel (2000) and Boselli et al. (2002), which areshown over 2–3 orders of magnitude in XCO. On the other hand,Leroy et al. (2011) find that metallicity is correlated with the
9

The Astrophysical Journal, 744:42 (11pp), 2012 January 1 Donovan Meyer et al.
Figure 11. Spatial distribution of radii, masses, and XCO values. In these plots, all 134 resolved clouds are shown as dots. The 120 clouds whose velocity profilesindicate that the clouds are apparently self-gravitating entities are identified by a colored circle as well. The 30 clouds which have real velocity dispersions aftersubtracting the velocity resolution element, which used in our analysis, are indicated by asterisks. The radii, mass, and XCO of each cloud with such a velocity profileis coded by color and size to indicate the values of these properties.
conversion factor at metallicities below [12 + log (O/H)] = 8.2;the entire Moustakas range of values for the metallicity at thecenter of NGC 6946 is higher than this value.
In the Milky Way, Balser et al. (2011) measure a radialmetallicity gradient in a sample of Galactic disk H ii regionsto be [12 + log (O/H)] = (8.962 ± 0.045)–(0.0446 ± 0.0046)Rgal, which yields Galactic disk metallicities in the range of8.5–8.7 at radii of 5–10 kpc. These measurements of the Galacticdisk metallicity are consistent with the Moustakas range ofvalues of the metallicity at the center of NGC 6946; thus, itis not unreasonable to expect that the GMCs in the two regionsare physically similar, especially within our quoted uncertaintyfor XCO.
4.4. “Diffuse” Fraction of CO
The fraction of emission in our CO cube which is identifiedas emission from the 30 GMCs with approximately Gaussianvelocity profiles (suggesting self-gravitation) greater than ourvelocity resolution element is 19%; the total mass in thiscomponent is 2.2 × 10⁸ M�. If we include all of the GMCsidentified by CLUMPFIND, which includes clouds which arespatially resolved but exhibit blended velocity profiles, thefraction increases to 31%. However, since the algorithm discardsemission contours below 2σ , fainter emission around GMCs isnot included. While this does not affect XCO, as described inSection 3.2, it does artificially elevate the “diffuse” fraction thatwe find. For instance, the fraction of emission included in allGMCs in the 1.5σ run is 47% (compared to 31%).
The critical density for collisional excitation of CO (J =1–0) emission is 300 cm−3 (Scoville & Sanders 1987), which isroughly the average gas density within a GMC (Solomon et al.1987). The CO emission that is not identified as belonging toGMCs in our analysis is unlikely to be entirely diffuse (i.e.,below the critical density). In addition, our velocity resolutionof 2.54 km s−1—optimal for resolving more massive GMCs—isnot optimal for the detection of less massive GMCs.
We expect to be sensitive to clouds down to a limit of ∼5 ×10⁵ M�, but certainly clouds less massive than this limit willcontribute as well. In their Galactic GMC sample, Scoville &Sanders (1987) find that ∼50% of the total H2 mass resides
in clouds less massive than 4 × 10⁵ M�, and the other halfis found in clouds more massive than this value. Taking ourestimate—that roughly half of the CO emission that we detect(in our 1.5σ run of CLUMPFIND) is assigned to clouds moremassive than ∼5 × 10⁵ M�—in conjunction with the Scoville &Sanders (1987) result for the Galaxy indicates that the fractionof truly diffuse CO that we detect is likely small.
5. CONCLUSIONS
In this paper, we present the first galaxy from our CO Sur-vey of Nearby Galaxies taken with CARMA and NRO45.The high image fidelity afforded by our combined observa-tions allows us to study extragalactic molecular clouds with un-precedented resolution. We utilize the clump-finding algorithmCLUMPFIND (Williams et al. 1994) with the recommended rmsnoise-dependent inputs and find that the general trends recov-ered by the clouds resemble those of Galactic clouds (Solomonet al. 1987), but the clouds within ∼400 pc of the center of NGC6946 exhibit higher velocity dispersion for a given size, similarto the behavior observed by Oka et al. (2001) for clouds at theGalactic center. These clouds also exhibit higher velocity dis-persions for a given luminosity, which is not likely to be causedby blends of clouds (at least at our velocity resolution limit).
We derive an average value of XCO of 1.2 × 1020 cm−2
(K km s−1)−1, which can vary by as much as a factor of twowith our assumed measurement uncertainties, and is consistentwithin our errors with accepted Galactic values of XCO (Dameet al. 2001). The trends which we observe among the GMCs atthe center of NGC 6946 are broadly consistent with Galactictrends seen by Solomon et al. (1987), even though we use aphenomenologically different algorithm to define the clouds,and we detect clouds comparable to the brightest and mostmassive clouds in the Galactic sample. The most massive clouds(>107 M�) are found at the very center of NGC 6946, andclouds with masses >5 × 10⁵ M� are found where the densityof clouds is the highest (i.e., on the spiral arms). No radial trendis apparent in XCO, though the most central clouds tend to havevalues higher than 0.5 × 1020 cm−2 (K km s−1)−1, and all butone of the clouds with XCO below this value are smaller than70 pc.
10

The Astrophysical Journal, 744:42 (11pp), 2012 January 1 Donovan Meyer et al.
When we run the clump decomposition algorithm down to1.5σ , which does not change our measured value of XCO butdoes incorporate more extended emission around our detectedGMCs, we find that 47% of our detected CO emission isidentified as belonging to a GMC. Our study is optimized toresolve larger and more massive GMCs as opposed to detectingless massive GMCs; we are most sensitive to clouds above∼5 × 10⁵ M�. If we adopt the Scoville & Sanders (1987) findingin the Galaxy that 50% of the H2 mass is in clouds more massivethan 4 × 10⁵ M� and 50% is in clouds less massive than thisvalue, then the fraction of truly diffuse CO emission that wedetect in NGC 6946 must be small.
Studies of this nature will soon be expanded when theAtacama Large Millimeter/Submillimeter Array comes online,as observations will be feasible with better sensitivity andresolution in a fraction of the observing time.
The authors thank the anonymous referee for the suggestionswhich improved the discussion of this paper. This researchhas made use of the NASA/IPAC Extragalactic Database(NED) which is operated by the Jet Propulsion Laboratory,California Institute of Technology, under contract with theNational Aeronautics and Space Administration.
REFERENCES
Arimoto, N., Sofue, Y., & Tsujimoto, T. 1996, PASJ, 48, 275Ball, R., Sargent, A. I., Scoville, N. Z., Lo, K. Y., & Scott, S. L. 1985, ApJ, 298,
L21Balser, D. S., Rood, R. T., Bania, T. M., & Anderson, L. D. 2011, ApJ, 738, 27Belley, J., & Roy, J.-R. 1992, ApJS, 78, 61Bigiel, F., Bolatto, A., Leroy, A., et al. 2010, ApJ, 725, 1159Binney, J., & Tremaine, S. 2008, Galactic Dynamics (2nd ed.; Princeton, NJ:
Princeton Univ. Press)Blitz, L., Fukui, Y., Kawamura, A., et al. 2007, in Protostars and Planets V, ed.
B. Reipurth, D. Jewitt, & K. Keil (Tucson, AZ: Univ. Arizona Press), 81
Bolatto, A. D., Leroy, A. K., Rosolowsky, E., Walter, F., & Blitz, L. 2008, ApJ,686, 948
Boselli, A., Lequeux, J., & Gavazzi, G. 2002, A&A, 384, 33Dame, T. M., Hartmann, D., & Thaddeus, P. 2001, ApJ, 547, 792Dobbs, C. L., Burkert, A., & Pringle, J. E. 2011, MNRAS, 1302,
arXiv:1107.0154Egusa, F., Koda, J., & Scoville, N. 2011, ApJ, 726, 85Genzel, R., Tacconi, L. J., Combes, F., et al. 2011, arXiv:1106.2098Herrmann, K. A., Ciardullo, R., Feldmeier, J. J., & Vinciguerra, M. 2008, ApJ,
683, 630Heyer, M., Krawczyk, C., Duval, J., & Jackson, J. M. 2009, ApJ, 699,
1092Hughes, A., Wong, T., Ott, J., et al. 2010, MNRAS, 406, 2065Israel, F. 2000, in Molecular Hydrogen in Space, ed. F. Combes & G. Pineau
des Forets (Cambridge: Cambridge Univ. Press), 293Israel, F. P. 1997, A&A, 328, 471Koda, J., Sawada, T., Wright, M. C. H., et al. 2011, ApJS, 193, 19Koda, J., Scoville, N., Sawada, T., et al. 2009, ApJ, 700, L132Larson, R. B. 1981, MNRAS, 194, 809Leroy, A., Bolatto, A., Stanimirovic, S., et al. 2007, ApJ, 658, 1027Leroy, A. K., Bolatto, A., Gordon, K., et al. 2011, ApJ, 737, 12Magrini, L., Bianchi, S., Corbelli, E., et al. 2011, arXiv:1106.0618McKee, C. F., & Zweibel, E. G. 1992, ApJ, 399, 551Miyazaki, A., & Tsuboi, M. 2000, ApJ, 536, 357Moustakas, J., Kennicutt, R. C., Jr., Tremonti, C. A., et al. 2010, ApJS, 190,
233Nakai, N., & Kuno, N. 1995, PASJ, 47, 761Oka, T., Hasegawa, T., Sato, F., et al. 2001, ApJ, 562, 348Rosolowsky, E., & Leroy, A. 2006, PASP, 118, 590Scoville, N. Z., & Sanders, D. B. 1987, in Interstellar Processes, ed. D. J.
Hollenbach & H. A. Thronson, Jr. (Astrophysics and Space Science Library,Vol. 134; Dordrecht: Reidel), 21
Scoville, N. Z., Yun, M. S., Sanders, D. B., Clemens, D. P., & Waller, W. H.1987, ApJS, 63, 821
Sodroski, T. J. 1991, ApJ, 366, 95Solomon, P. M., Rivolo, A. R., Barrett, J., & Yahil, A. 1987, ApJ, 319, 730Strong, A. W., & Mattox, J. R. 1996, A&A, 308, L21Tasker, E. J., & Tan, J. C. 2009, ApJ, 700, 358Wada, K. 2008, ApJ, 675, 188Williams, J. P., de Geus, E. J., & Blitz, L. 1994, ApJ, 428, 693Wilson, C. D. 1995, ApJ, 448, L97Wilson, C. D., & Scoville, N. 1990, ApJ, 363, 435
11