resolute forest products - pfresolu.com · resolute forest products rbc capital markets forest...
TRANSCRIPT

RESOLUTE FORESTPRODUCTSRBC CAPITAL MARKETS FORESTPRODUCTS CONFERENCE
April 3, 2018

Statements in this Annual Report on Form 10-K (“Form 10-K”) that are not reported financial results or other historical information of Resolute Forest Products Inc.(with its subsidiaries and affiliates, either individually or collectively, unless otherwise indicated, referred to as “Resolute Forest Products,” “Resolute,” “we,” “our,”“us” or the “Company”) are “forward-looking statements” within the meaning of the Private Securities Litigation Reform Act of 1995. They include, for example,statements relating to our: efforts and initiatives to reduce costs and increase revenues and profitability; business and operating outlook; future pension fundingobligations; assessment of market conditions; growth strategies and prospects, and the growth potential of the Company and the industry in which we operate;liquidity; future cash flows, including as a result of the changes to our pension funding obligations; and strategies for achieving our goals generally, including thestrategies described in Part II, Item 7, “Management’s Discussion and Analysis of Financial Condition and Results of Operations – Overview – Our Business,” ofthis Form 10-K. Forward-looking statements may be identified by the use of forward-looking Terminology such as the words “should,” “would,” “could,” “will,” “may,”“expect,” “believe,” “anticipate,” “attempt,” “project” and other terms with similar meaning indicating possible Future events or potential impact on our business orResolute Forest Products’ shareholders.
The reader is cautioned not to place undue reliance on these forward-looking statements, which are not guarantees of future performance. These statements arebased on management’s current assumptions, beliefs and expectations, all of which involve a number of business risks and uncertainties that could cause actualresults to differ materially. The potential risks and uncertainties that could cause our actual future financial condition, results of operations and performance to differmaterially from those expressed or implied in this Form 10-K include, but are not limited to, the impact of: developments in non-print media, and the effectiveness ofour responses to these developments; intense competition in the forest products industry; any inability to offer products certified to globally recognized forestrymanagement and chain of custody standards; any inability to successfully implement our strategies to increase our earnings power; the possible failure tosuccessfully integrate acquired businesses with ours or to realize the anticipated benefits of acquisitions, such as Atlas Paper Holdings Inc. and its subsidiaries(“Atlas Tissue”), or divestitures or other strategic transactions or projects, such as our Calhoun (Tennessee) tissue operations; uncertainty or changes in political oreconomic conditions in the United States, Canada or other countries in which we manufacture or sell our products; global economic conditions; the highly cyclicalnature of the forest products industry; any difficulties in obtaining timber or wood fiber at favorable prices, or at all; changes in the cost of purchased energy andother raw materials; physical and financial risks associated with global, regional and local weather and climate conditions and change; any disruption in operationsor increased labor costs due to labor disputes; difficulties in our employee relations or retention; disruptions to our supply chain, operations or the delivery of ourproducts; cybersecurity risks; risks related to the operation and transition of legacy system applications; negative publicity, even if unjustified; currency fluctuations;any increase in the level of required contributions to our pension plans, including as a result of any increase in the amount by which they are underfunded; ourability to maintain adequate capital resources to provide for all of our substantial capital requirements; the terms of our outstanding indebtedness, which couldrestrict our current and future operations; losses that are not covered by insurance; any additional closure costs and long-lived asset or goodwill impairment oraccelerated depreciation charges; any need to record additional valuation allowances against our recorded deferred income tax assets; our exports from onecountry to another country becoming or remaining subject to duties, cash deposit requirements, border taxes, quotas or other trade remedies or restrictions;countervailing or anti-dumping duties on imports to the U.S. of our paper products and substantially all of our softwood lumber products produced at our Canadianmills; any failure to comply with laws or regulations generally; any additional environmental or health and safety liabilities; any violation of trade laws, export controlsor other laws relating to our international sales and operations; adverse outcomes of legal proceedings or disputes in which we are involved; the actions of holdersof a significant percentage of our common stock; and the potential risks and uncertainties described under the heading “Risk Factors” in Part I, Item 1A of theCompany’s Annual Report on Form 10-K for the year ended December 31, 2017.
All forward-looking statements in this Form 10-K are expressly qualified by the cautionary statements contained or referred to in this section and in our other filingswith the United States Securities and Exchange Commission (the “SEC”) and the Canadian securities regulatory authorities. We disclaim any obligation to publiclyupdate or revise any forward-looking information, whether as a result of new information, future events or otherwise, except as required by law.
All figures in US$ unless otherwise noted
CAUTIONARY STATEMENTS REGARDINGFORWARD-LOOKING INFORMATION
2

3
WHO WE ARENorth American forest products companywith a leading market presence
100% of managedwoodlands certified byindependent third parties
100% chain of custodycertified for sawmills andpulp and paper mills
7,700 employees
2017 sales: $3.5 billionProducts marketed in closeto 70 countries
GLOBAL LEADER:• 3rd largest pulp producer in
NA• Largest Canadian producer
of wood products east ofthe Rockies
• Largest producer ofnewsprint in the world
• Largest producer ofuncoated mechanicalpapers in NA
17 pulp and paper mills• market pulp (7 facilities):
1.7 million mt of capacity• newsprint (8 facilities):
1.8 million mt of capacity• specialty papers (6 facilities):
1.2 million short tons ofcapacity (1.1 million mt)
Energy assets• Total installed capacity:
496 MW• 7 hydroelectric facilities• 7 cogeneration facilities
19 wood products facilities• Lumber capacity:
2.4 billion MBF1
• Remanufactured woodcapacity: 82 million MBF
• Engineered wood capacity:145 million linear feet
• Wood pellets: 45,000 mt ofcapacity
3 tissue mills• Capacity: 128,000 st
(116,000 mt)• 14 converting lines• 1 recycling center
FACILITIESIN THE UNITED STATES AND CANADA
1. Our current fiber supply limits our operating capacity to about 2.1 billion board feetper year. In 2017, we shipped 1.9 billion board feet of construction-grade lumber.
4
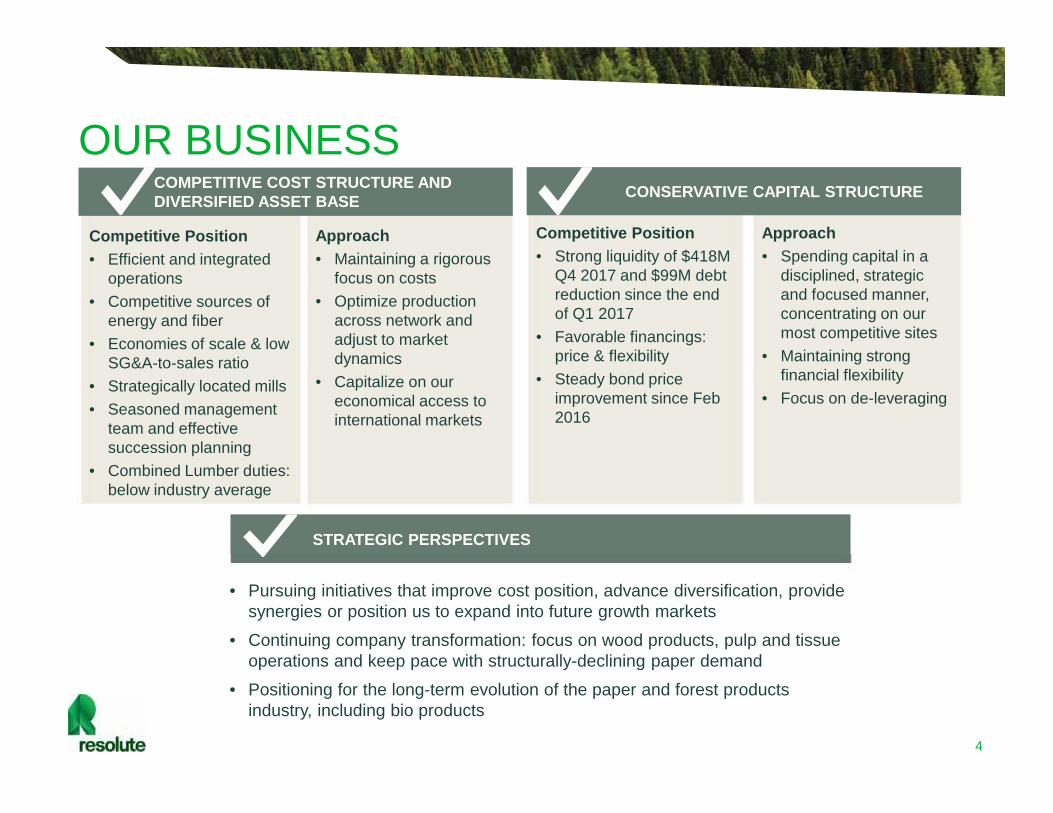
Approach• Maintaining a rigorous
focus on costs• Optimize production
across network andadjust to marketdynamics
• Capitalize on oureconomical access tointernational markets
Competitive Position• Efficient and integrated
operations• Competitive sources of
energy and fiber• Economies of scale & low
SG&A-to-sales ratio• Strategically located mills• Seasoned management
team and effectivesuccession planning
• Combined Lumber duties:below industry average
STRATEGIC PERSPECTIVES
Competitive Position• Strong liquidity of $418M
Q4 2017 and $99M debtreduction since the endof Q1 2017
• Favorable financings:price & flexibility
• Steady bond priceimprovement since Feb2016
• Pursuing initiatives that improve cost position, advance diversification, providesynergies or position us to expand into future growth markets
• Continuing company transformation: focus on wood products, pulp and tissueoperations and keep pace with structurally-declining paper demand
• Positioning for the long-term evolution of the paper and forest productsindustry, including bio products
Approach• Spending capital in a
disciplined, strategicand focused manner,concentrating on ourmost competitive sites
• Maintaining strongfinancial flexibility
• Focus on de-leveraging
COMPETITIVE COST STRUCTURE ANDDIVERSIFIED ASSET BASE CONSERVATIVE CAPITAL STRUCTURE
OUR BUSINESS

5
1. Maximize value generation from paper Global leader in newsprint and specialty papers
with competitive assets
2. Grow in pulp, tissue and wood products Core segments with solid long-term opportunities Strategic investments
3. Integrate pulp into high quality tissue Acquisition and capital investments into
synergistic business with steady demand growth
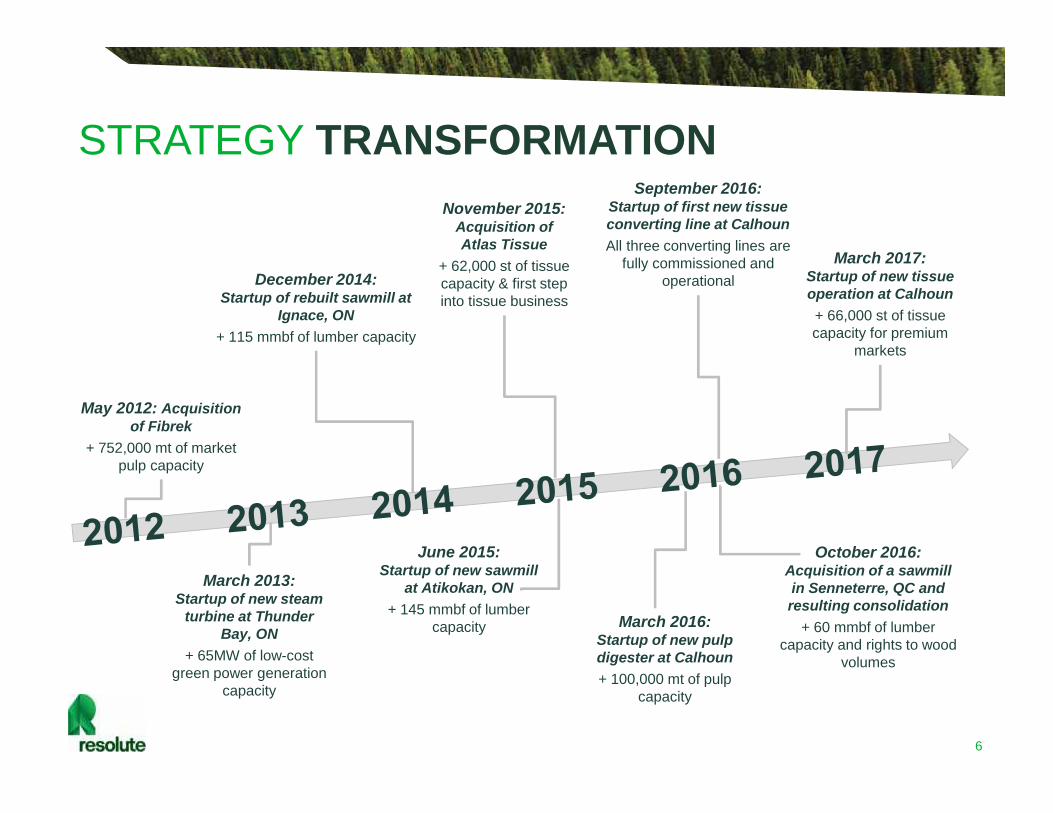
STRATEGY TRANSFORMATION
6
May 2012: Acquisitionof Fibrek
+ 752,000 mt of marketpulp capacity
June 2015:Startup of new sawmill
at Atikokan, ON+ 145 mmbf of lumber
capacity
December 2014:Startup of rebuilt sawmill at
Ignace, ON+ 115 mmbf of lumber capacity
March 2016:Startup of new pulpdigester at Calhoun+ 100,000 mt of pulp
capacity
March 2017:Startup of new tissueoperation at Calhoun+ 66,000 st of tissuecapacity for premium
markets
March 2013:Startup of new steam
turbine at ThunderBay, ON
+ 65MW of low-costgreen power generation
capacity
November 2015:Acquisition ofAtlas Tissue
+ 62,000 st of tissuecapacity & first stepinto tissue business
September 2016:Startup of first new tissueconverting line at CalhounAll three converting lines are
fully commissioned andoperational
STRATEGY TRANSFORMATION
October 2016:Acquisition of a sawmillin Senneterre, QC andresulting consolidation
+ 60 mmbf of lumbercapacity and rights to wood
volumes

STRATEGY TRANSFORMATION
7
1. Based on annual sales of $100 million for Atlas Tissue2. Chart includes targeted EBITDA run rate of $10 million for Atlas Tissue3. Chart excludes adjusted EBITDA for « corporate and other » of $1 million and negative $43 million for the years ended December 31, 2011 and 2017,
respectively, for illustrative purposes4. Adjusted EBITDA is a non-GAAP financial measure. Refer to Appendices A and B for a definition and reconciliation of non-GAAP financial measures.
2017
Sal
esA
djus
ted
EB
ITD
A3,
4
2011
1
2
$498 million $364 million
$4.8 billion $3.5 billionMarket pulp
26%
Tissue3%
Woodproducts
22%
Newsprint24%
Specialtypapers
25%
Market pulp26%
Tissue3%
Woodproducts
52%
Newsprint10%
Specialtypapers
9%
Market pulp14%
Woodproducts
10%
Newsprint38%
Specialtypapers
38%
Market pulp24%
Woodproducts
2%
Newsprint33%
Specialtypapers
41%
Growth Market= 24%
Growth Market= 26%
Growth Market= 51%
Growth Market= 81%
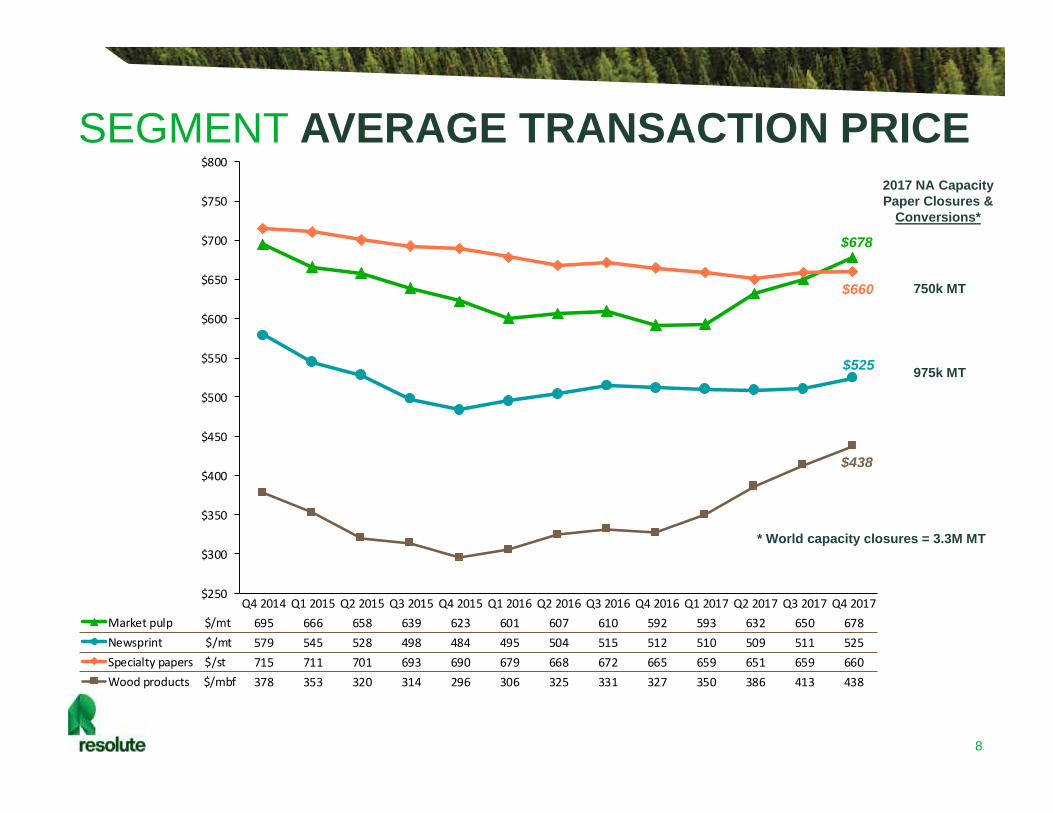
SEGMENT AVERAGE TRANSACTION PRICE
8
750k MT
$678
$525
$660
$438
$250
$300
$350
$400
$450
$500
$550
$600
$650
$700
$750
$800
Q4 2014 Q1 2015 Q2 2015 Q3 2015 Q4 2015 Q1 2016 Q2 2016 Q3 2016 Q4 2016 Q1 2017 Q2 2017 Q3 2017 Q4 2017Market pulp $/mt 695 666 658 639 623 601 607 610 592 593 632 650 678Newsprint $/mt 579 545 528 498 484 495 504 515 512 510 509 511 525Specialty papers $/st 715 711 701 693 690 679 668 672 665 659 651 659 660Wood products $/mbf 378 353 320 314 296 306 325 331 327 350 386 413 438
* World capacity closures = 3.3M MT
975k MT
2017 NA CapacityPaper Closures &
Conversions*

BUSINESS OUTLOOK
9
Pulp• Cautiously optimistic: impact of any incremental demand from China,
and limited capacity additions forecasted after Q2
• Further price increases in Q1
Tissue • Leadership team focused on improving market access
WoodProducts
• Remains a key contributor to our overall profitability in 2018 givenexpected demand growth in the U.S.
Paper
• Industry capacity reductions, resulting in strong supply and demanddynamics in the short-term
• Price increases in Q1: newsprint, coated and uncoated groundwoodpaper as well as uncoated freesheet
Labor • Labor shortages (truckers and trade) expected to continue to affectour business and results
2017FINANCIALS
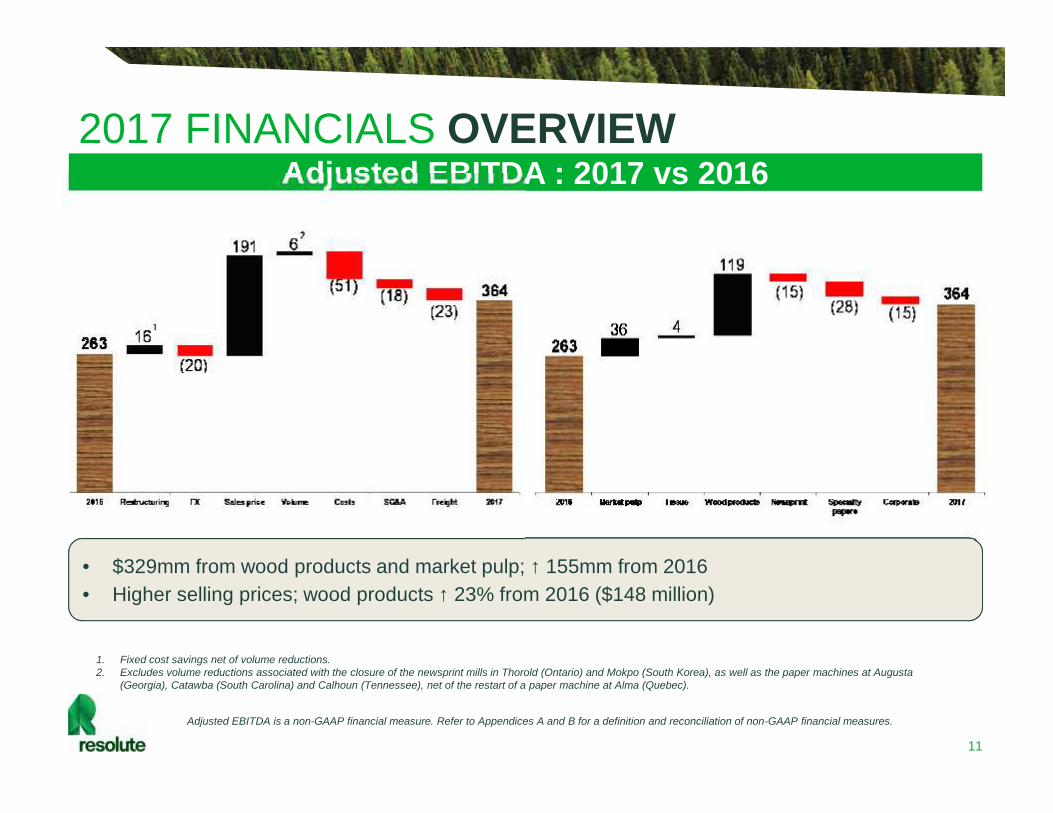
2017 FINANCIALS OVERVIEW
11
• $329mm from wood products and market pulp; ↑ 155mm from 2016• Higher selling prices; wood products ↑ 23% from 2016 ($148 million)• $329mm from wood products and market pulp; ↑ 155mm from 2016• Higher selling prices; wood products ↑ 23% from 2016 ($148 million)
Adjusted EBITDA is a non-GAAP financial measure. Refer to Appendices A and B for a definition and reconciliation of non-GAAP financial measures.
Adjusted EBITDA : 2017 vs 2016
1. Fixed cost savings net of volume reductions.2. Excludes volume reductions associated with the closure of the newsprint mills in Thorold (Ontario) and Mokpo (South Korea), as well as the paper machines at Augusta
(Georgia), Catawba (South Carolina) and Calhoun (Tennessee), net of the restart of a paper machine at Alma (Quebec).

2017 FINANCIALS MARKET PULP
12
1. EBITDA is a non-GAAP financial measure. Refer to Appendices A and B for a definition and reconciliation of non-GAAP financial measures.2. The “all-in” delivered cost is the total cost of each ton shipped (cost of sales, depreciation and amortization, distribution costs and selling, general and administrative expenses).
9483
10091 92 94 100
89
Q1 2016 Q2 2016 Q3 2016 Q4 2016 Q1 2017 Q2 2017 Q3 2017 Q4 2017
Inventory (000's mt)
Global chemical pulp demand ↑ 3.7% in2017 vs. 2016
– China ↑ 7.6%; North America ↑ 2.7%;Western Europe ↓ 0.2%
– 2017 global demand ↑ 2.5% for softwood,↑ 4.9% for hardwood
Q4 Transaction price ↑ $28/mt vs. Q3 Q4 Shipments ↑ 40k mt vs. Q3 Q4 Delivered cost ↓ $12/mt vs. Q3
678
583
525
550
575
600
625
650
675
700
Q1 2016 Q2 2016 Q3 2016 Q4 2016 Q1 2017 Q2 2017 Q3 2017 Q4 2017
$/m
t
average transaction price "all-in" delivered cost ²
(US$mm) Q4 2017 Q3 2017 2017 2016
Sales 262 227 911 836
Operating income 37 19 79 37
EBITDA1 44 27 110 74
Shipments (000’s mt) 388 348 1,425 1,388

2017 FINANCIALS TISSUE
13
1. Includes only Atlas Tissue.2. EBITDA is a non-GAAP financial measure. Refer to Appendices A and B for a definition and reconciliation of non-GAAP financial measures.
1,542
1,697
1,200
1,400
1,600
1,800
2,000
2,200
Q1 2016 Q2 2016 Q3 2016 Q4 2016 Q1 2017 Q2 2017 Q3 2017 Q4 2017
$/st
average transaction price "all-in" delivered cost
(250)
(200)
(150)
(100)
(50)
0
50
100
Q1 2016 Q2 2016 Q3 2016 Q4 2016 Q1 2017 Q2 2017 Q3 2017 Q4 2017$/
st
EBITDA / unit
US consumption ↑ 1.8% in 2017 vs. 2016‒ Away-from-home shipments ↑ 2.9%‒ At-home shipments ↑ 1.4%
Q4 Transaction price ↑ $50/st vs. Q3 Bath tissue equivalent to TAD quality now
manufactured at Calhoun Integrated pulp provides benefits in rising pulp
price market
(US$mm)only Atlas Tissue
Q4 2017 Q3 2017 2017 2016
Sales 20 21 81 89
Operating loss (2) (3) (6) (10)
EBITDA2 (1) (1) (1) (5)
Shipments (000’s st) 13 14 53 54
1 1
1
53 4 5
8 810
13
Q1 2016 Q2 2016 Q3 2016 Q4 2016 Q1 2017 Q2 2017 Q3 2017 Q4 2017
Inventory (000's st)
Atlas TissueCalhoun
14
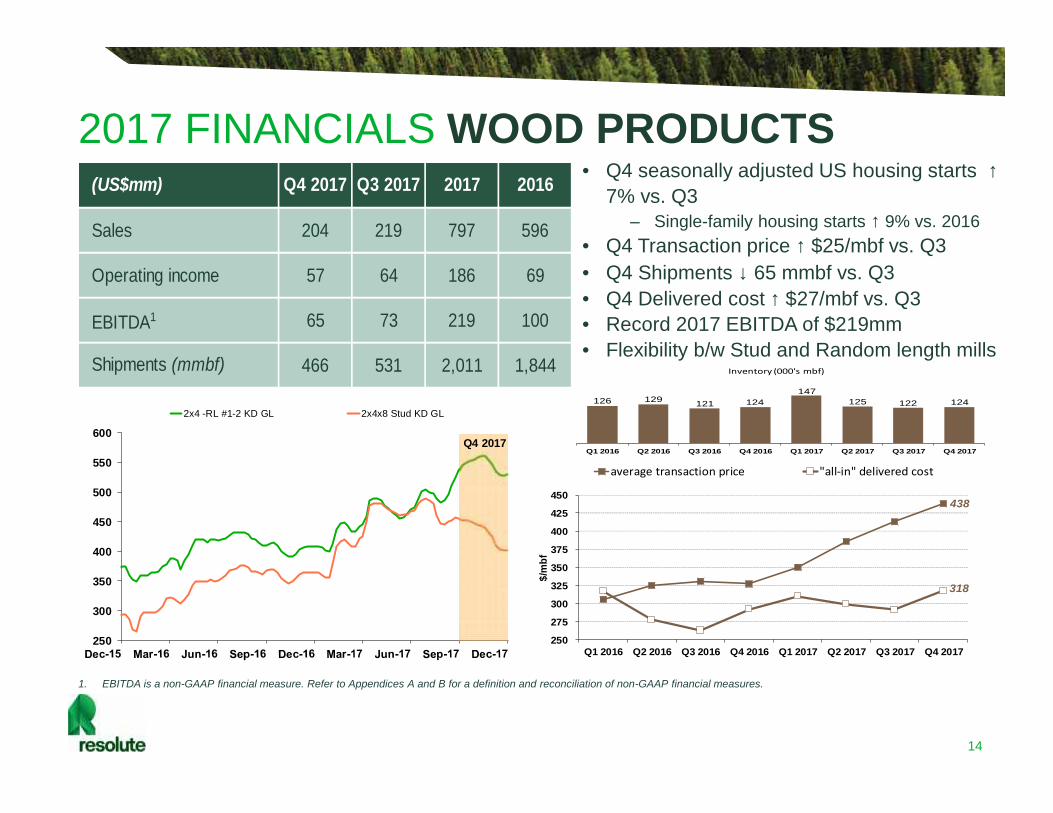
2017 FINANCIALS WOOD PRODUCTS
1. EBITDA is a non-GAAP financial measure. Refer to Appendices A and B for a definition and reconciliation of non-GAAP financial measures.
Q4 seasonally adjusted US housing starts ↑7% vs. Q3
‒ Single-family housing starts ↑ 9% vs. 2016 Q4 Transaction price ↑ $25/mbf vs. Q3 Q4 Shipments ↓ 65 mmbf vs. Q3 Q4 Delivered cost ↑ $27/mbf vs. Q3 Record 2017 EBITDA of $219mm Flexibility b/w Stud and Random length mills
438
318
250
275
300
325
350
375
400
425
450
Q1 2016 Q2 2016 Q3 2016 Q4 2016 Q1 2017 Q2 2017 Q3 2017 Q4 2017
$/m
bf
average transaction price "all-in" delivered cost
126 129 121 124147
125 122 124
Q1 2016 Q2 2016 Q3 2016 Q4 2016 Q1 2017 Q2 2017 Q3 2017 Q4 2017
Inventory (000's mbf)
250
300
350
400
450
500
550
600
2x4 -RL #1-2 KD GL 2x4x8 Stud KD GL
Q4 2017
(US$mm) Q4 2017 Q3 2017 2017 2016
Sales 204 219 797 596
Operating income 57 64 186 69
EBITDA1 65 73 219 100
Shipments (mmbf) 466 531 2,011 1,844
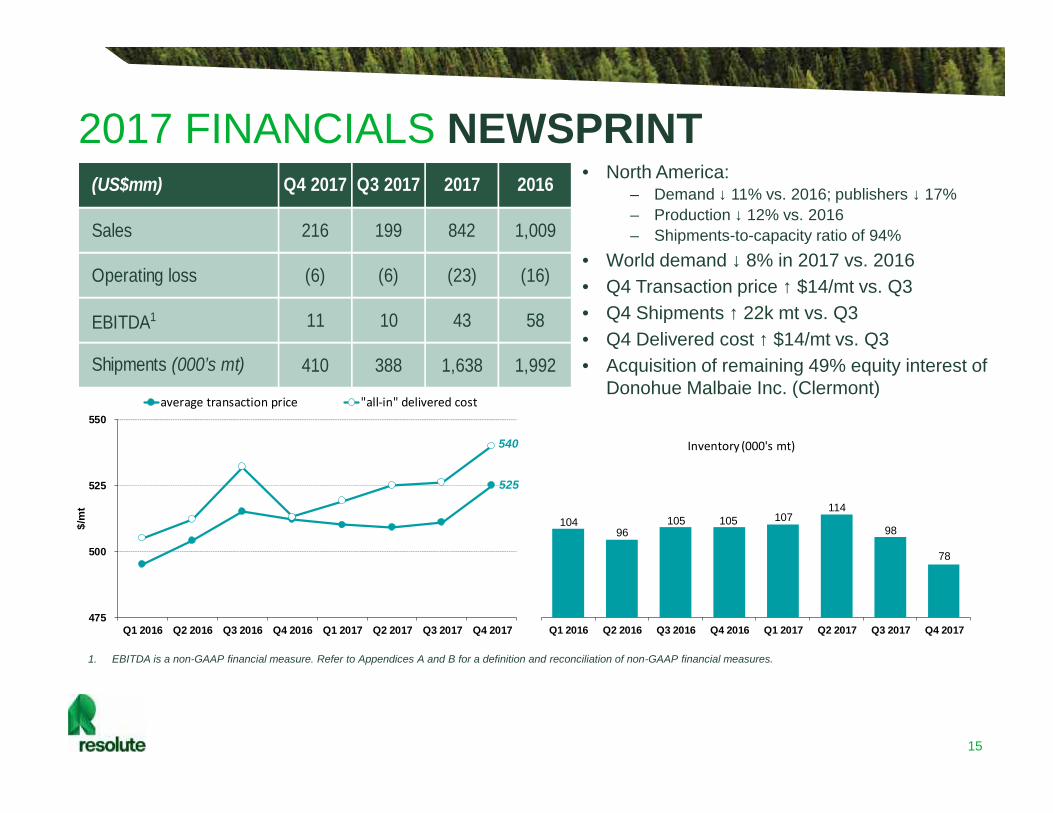
2017 FINANCIALS NEWSPRINT
15
1. EBITDA is a non-GAAP financial measure. Refer to Appendices A and B for a definition and reconciliation of non-GAAP financial measures.
10496
105 105 107114
98
78
Q1 2016 Q2 2016 Q3 2016 Q4 2016 Q1 2017 Q2 2017 Q3 2017 Q4 2017
Inventory (000's mt)
525
540
475
500
525
550
Q1 2016 Q2 2016 Q3 2016 Q4 2016 Q1 2017 Q2 2017 Q3 2017 Q4 2017
$/m
t
average transaction price "all-in" delivered cost
North America:‒ Demand ↓ 11% vs. 2016; publishers ↓ 17%‒ Production ↓ 12% vs. 2016‒ Shipments-to-capacity ratio of 94%
World demand ↓ 8% in 2017 vs. 2016 Q4 Transaction price ↑ $14/mt vs. Q3 Q4 Shipments ↑ 22k mt vs. Q3 Q4 Delivered cost ↑ $14/mt vs. Q3 Acquisition of remaining 49% equity interest of
Donohue Malbaie Inc. (Clermont)
(US$mm) Q4 2017 Q3 2017 2017 2016
Sales 216 199 842 1,009
Operating loss (6) (6) (23) (16)
EBITDA1 11 10 43 58
Shipments (000’s mt) 410 388 1,638 1,992
660
703
600
625
650
675
700
725
Q1 2016 Q2 2016 Q3 2016 Q4 2016 Q1 2017 Q2 2017 Q3 2017 Q4 2017
$/st
average transaction price "all-in" delivered cost
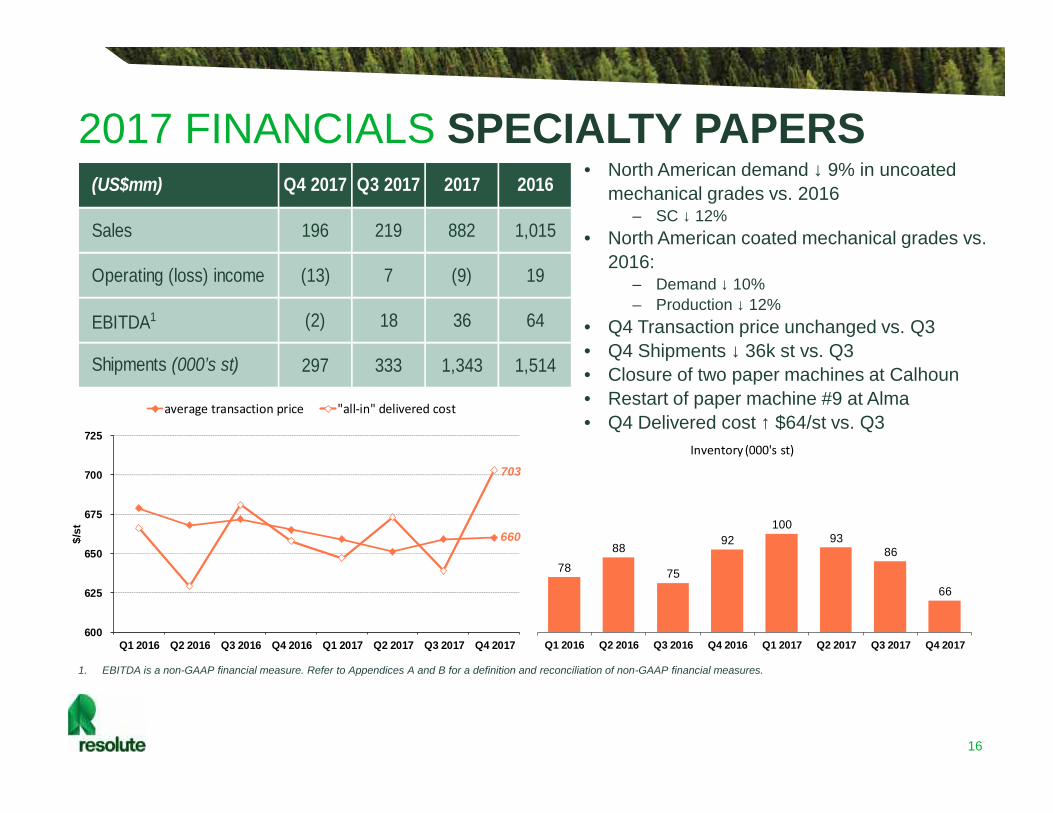
2017 FINANCIALS SPECIALTY PAPERS
16
1. EBITDA is a non-GAAP financial measure. Refer to Appendices A and B for a definition and reconciliation of non-GAAP financial measures.
78
88
75
92100
9386
66
Q1 2016 Q2 2016 Q3 2016 Q4 2016 Q1 2017 Q2 2017 Q3 2017 Q4 2017
Inventory (000's st)
North American demand ↓ 9% in uncoatedmechanical grades vs. 2016
– SC ↓ 12% North American coated mechanical grades vs.
2016:– Demand ↓ 10%– Production ↓ 12%
Q4 Transaction price unchanged vs. Q3 Q4 Shipments ↓ 36k st vs. Q3 Closure of two paper machines at Calhoun Restart of paper machine #9 at Alma Q4 Delivered cost ↑ $64/st vs. Q3
(US$mm) Q4 2017 Q3 2017 2017 2016
Sales 196 219 882 1,015
Operating (loss) income (13) 7 (9) 19
EBITDA1 (2) 18 36 64
Shipments (000’s st) 297 333 1,343 1,514

17
2017 FINANCIALS KEY METRICS« All-in » delivered cost1 EBITDA per unit1,2
583
318
540
703
200
300
400
500
600
700
800
$/un
it
Market pulp $/mt Wood products $/mbfNewsprint $/mt Specialty papers $/st
113
139
27
(7)-20
0
20
40
60
80
100
120
140
160
$/un
it
Market pulp $/mt Wood products $/mbfNewsprint $/mt Specialty papers $/st
EBITDA2
contribution fromcogen(in $US millions)
Q1’16 Q2’16 Q3’16 Q4’16 Q1’17 Q2’17 Q3’17 Q4’17
13 13 9 10 13 9 9 9
1. Performance metrics related to our tissue segment are available on page 13.2. EBITDA is a non-GAAP financial measure. Refer to Appendices A and B for a definition and reconciliation of non-GAAP financial measures.
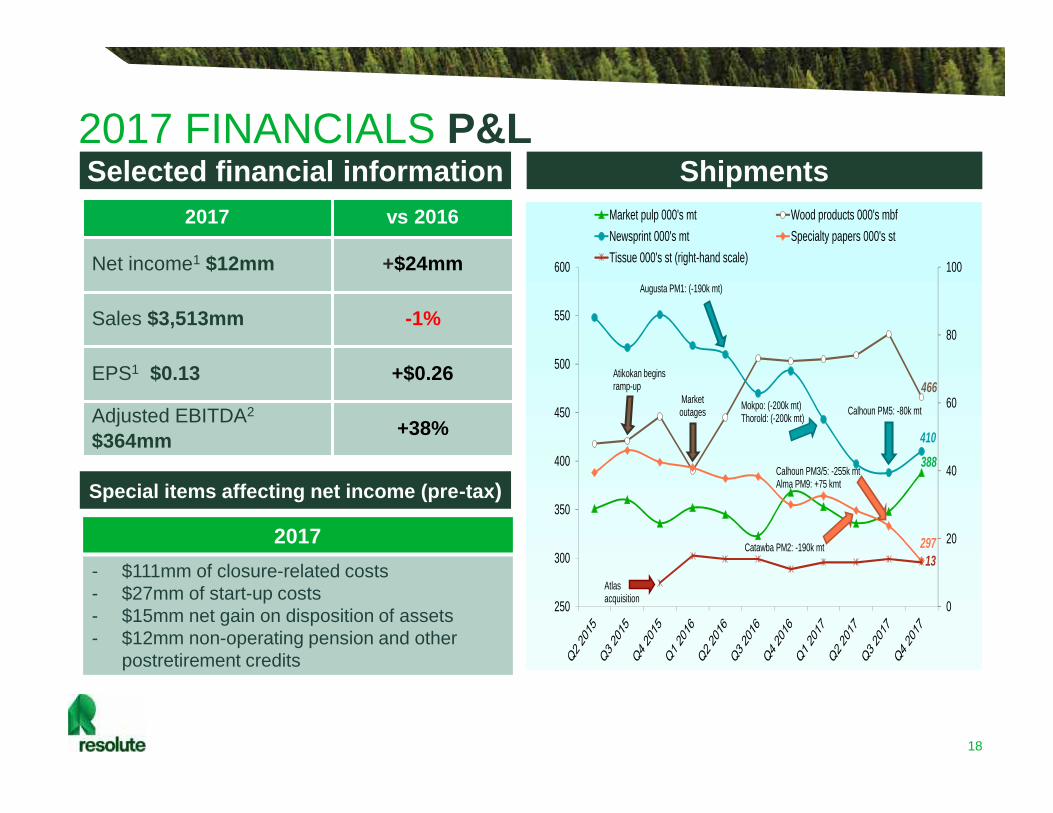
2017 FINANCIALS P&L
18
Selected financial information2017 vs 2016
Net income1 $12mm +$24mm
Sales $3,513mm -1%
EPS1 $0.13 +$0.26
Adjusted EBITDA2
$364mm +38%
Special items affecting net income (pre-tax)
2017- $111mm of closure-related costs- $27mm of start-up costs- $15mm net gain on disposition of assets- $12mm non-operating pension and other
postretirement credits
Shipments
388
466
410
29713
0
20
40
60
80
100
250
300
350
400
450
500
550
600
Market pulp 000's mt Wood products 000's mbfNewsprint 000's mt Specialty papers 000's stTissue 000's st (right-hand scale)
Atikokan beginsramp-up
Atlasacquisition
Augusta PM1: (-190k mt)
Marketoutages Mokpo: (-200k mt)
Thorold: (-200k mt)Calhoun PM5: -80k mt
Catawba PM2: -190k mt
Calhoun PM3/5: -255k mtAlma PM9: +75 kmt

2017 FINANCIALS LIQUIDITY
19
Available liquidity(US$mm)
2017 2016
Q4 Q3 Q2 Q1 Q4 Q3 Q2 Q1
Total debt 789 832 840 881 762 727 611 611
Cash on hand 6 38 44 39 35 55 40 37
Available under revolving credit facilities 412 362 370 341 433 465 412 406
Net debt / Adj. EBITDA 2.2x 2.4x 2.9x 3.1x 2.8x 2.8x 2.2x 2.1x
Capital expenditures 28 20 47 69 72 78 52 47
• Repayments of $51mm under revolvingcredit facilities in Q4 and $99mm since theend of Q1
• Liquidity of $418mm• 2017 net cash provided by operations of
$158mm• 2017 Capex of $164mm ↓ $85mm from
2016• Cumulative duty deposits of $75mm
(US$mm) Q4 2017 vsQ4 2016
Cash 6 -29
Working capital 618 +38
Total debt 789 +27
Interest 13 +4
20
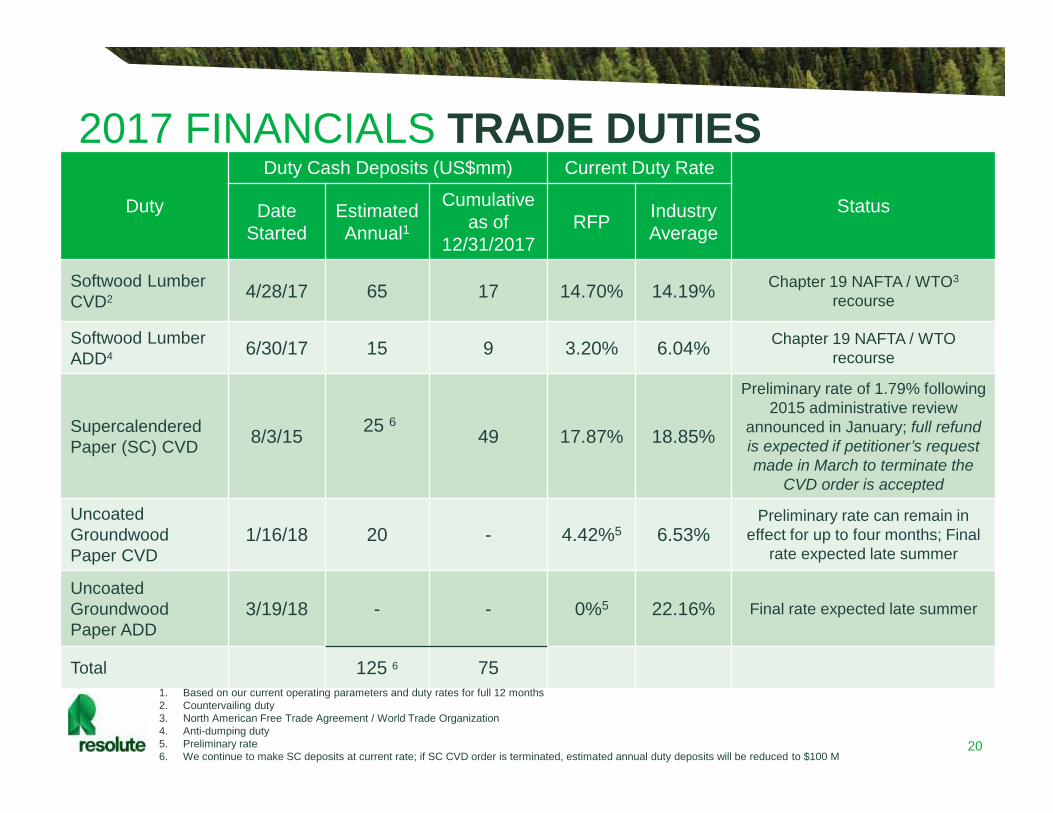
2017 FINANCIALS TRADE DUTIESDuty
Duty Cash Deposits (US$mm) Current Duty Rate
StatusDateStarted
EstimatedAnnual1
Cumulativeas of
12/31/2017RFP Industry
Average
Softwood LumberCVD2 4/28/17 65 17 14.70% 14.19% Chapter 19 NAFTA / WTO3
recourse
Softwood LumberADD4 6/30/17 15 9 3.20% 6.04% Chapter 19 NAFTA / WTO
recourse
SupercalenderedPaper (SC) CVD 8/3/15 25 6
49 17.87% 18.85%
Preliminary rate of 1.79% following2015 administrative review
announced in January; full refundis expected if petitioner’s requestmade in March to terminate the
CVD order is accepted
UncoatedGroundwoodPaper CVD
1/16/18 20 - 4.42%5 6.53%Preliminary rate can remain in
effect for up to four months; Finalrate expected late summer
UncoatedGroundwoodPaper ADD
3/19/18 - - 0%5 22.16% Final rate expected late summer
Total 125 6 751. Based on our current operating parameters and duty rates for full 12 months2. Countervailing duty3. North American Free Trade Agreement / World Trade Organization4. Anti-dumping duty5. Preliminary rate6. We continue to make SC deposits at current rate; if SC CVD order is terminated, estimated annual duty deposits will be reduced to $100 M
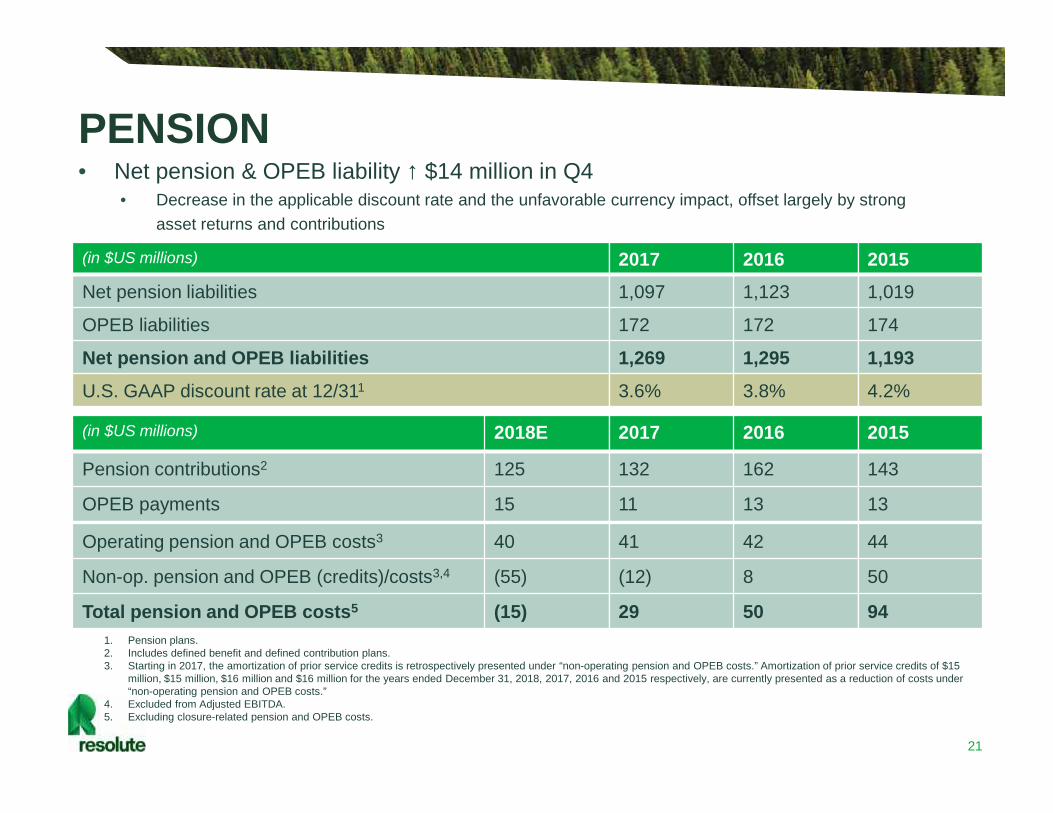
PENSION
21
(in $US millions) 2017 2016 2015Net pension liabilities 1,097 1,123 1,019
OPEB liabilities 172 172 174
Net pension and OPEB liabilities 1,269 1,295 1,193
U.S. GAAP discount rate at 12/311 3.6% 3.8% 4.2%
• Net pension & OPEB liability ↑ $14 million in Q4• Decrease in the applicable discount rate and the unfavorable currency impact, offset largely by strong
asset returns and contributions
(in $US millions) 2018E 2017 2016 2015
Pension contributions2 125 132 162 143
OPEB payments 15 11 13 13
Operating pension and OPEB costs3 40 41 42 44
Non-op. pension and OPEB (credits)/costs3,4 (55) (12) 8 50
Total pension and OPEB costs5 (15) 29 50 941. Pension plans.2. Includes defined benefit and defined contribution plans.3. Starting in 2017, the amortization of prior service credits is retrospectively presented under “non-operating pension and OPEB costs.” Amortization of prior service credits of $15
million, $15 million, $16 million and $16 million for the years ended December 31, 2018, 2017, 2016 and 2015 respectively, are currently presented as a reduction of costs under“non-operating pension and OPEB costs.”
4. Excluded from Adjusted EBITDA.5. Excluding closure-related pension and OPEB costs.

22
2017 FINANCIALS PENSION2017 Pension Plans Deficit
AccountingBasis
FundingPurposes3 Variance
Net pensionliabilities(US$mm)
1,097 579 518
Funded ratio(%) 80.2% 88.9%
Discount rate(%) 3.6% 4.9%
1. The assumptions for 2018-2020 estimated total pension contributions can be found in the table “Assumptions used for 2018-2020”above which includes defined benefit and defined contribution plans.
2. In 2016 and 2017, we undertook steps to optimize our pension contributions. When compared to the baseline contributions of 2016,we estimate that pension contributions will drop by approximately $170M between 2017 and 2020, including $30M realized in 2017.
3. Funding for pension plans in Quebec are on a going concern basis; in Ontario on a solvency basis; and in the U.S. on a 25-yearaverage interest rate basis.
Assumptions used for 2018-2020
Discount rate: going concern 5.7%
Canadian dollar US$ 0.8080
90
100
110
120
130
140
150
160
170
2016 2017 2018 2019/2020
Mill
ions
of U
SD
Actual/estimate
Total Pension Contributions
1,2
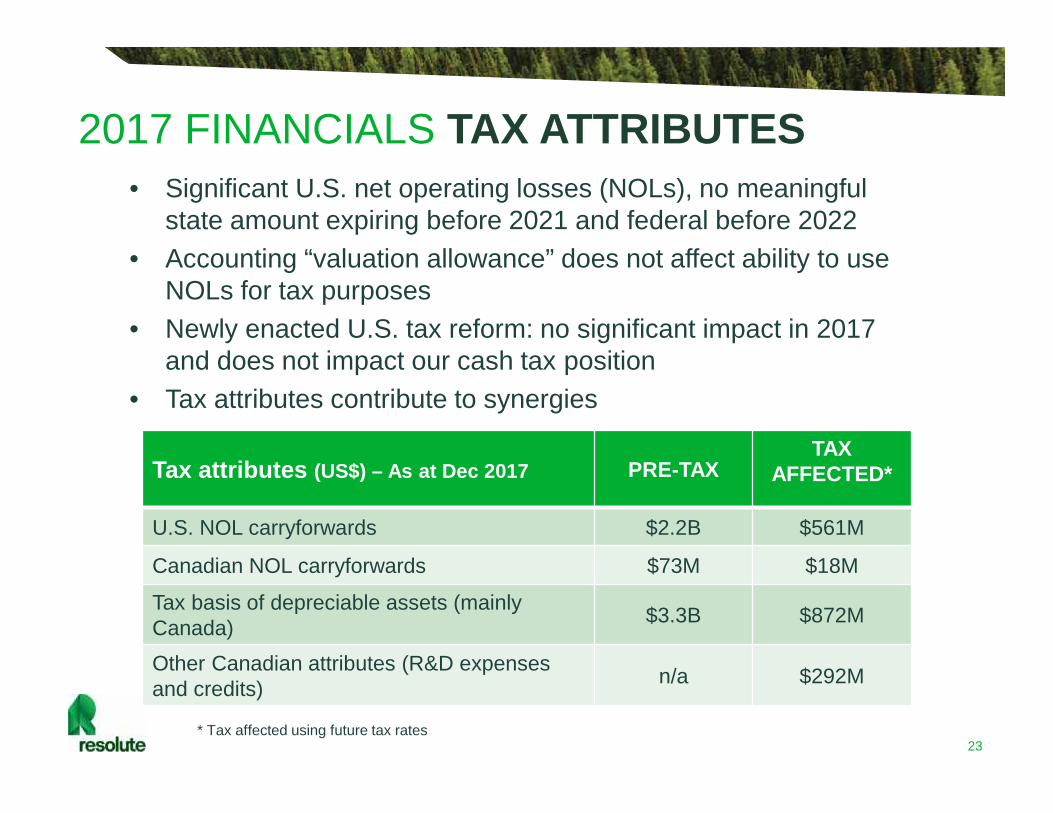
2017 FINANCIALS TAX ATTRIBUTES
23
• Significant U.S. net operating losses (NOLs), no meaningfulstate amount expiring before 2021 and federal before 2022
• Accounting “valuation allowance” does not affect ability to useNOLs for tax purposes
• Newly enacted U.S. tax reform: no significant impact in 2017and does not impact our cash tax position
• Tax attributes contribute to synergies
Tax attributes (US$) – As at Dec 2017 PRE-TAXTAX
AFFECTED*
U.S. NOL carryforwards $2.2B $561M
Canadian NOL carryforwards $73M $18M
Tax basis of depreciable assets (mainlyCanada) $3.3B $872M
Other Canadian attributes (R&D expensesand credits) n/a $292M
* Tax affected using future tax rates
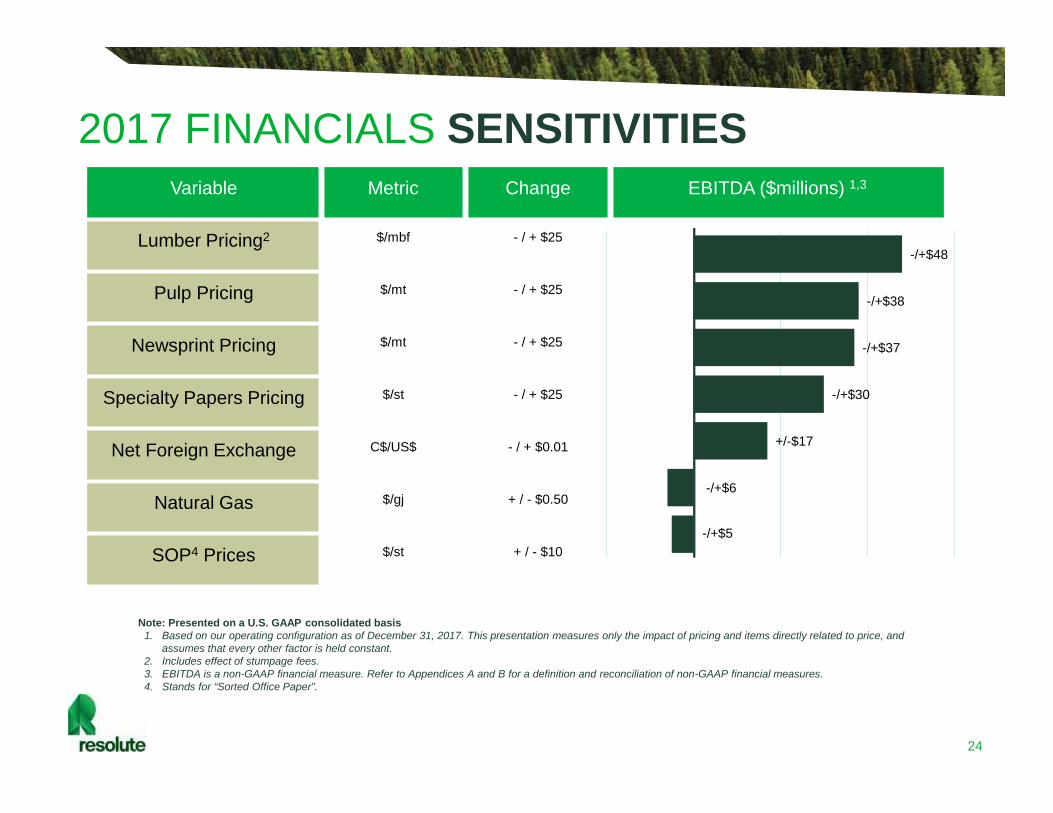
2017 FINANCIALS SENSITIVITIES
24
Note: Presented on a U.S. GAAP consolidated basis1. Based on our operating configuration as of December 31, 2017. This presentation measures only the impact of pricing and items directly related to price, and
assumes that every other factor is held constant.2. Includes effect of stumpage fees.3. EBITDA is a non-GAAP financial measure. Refer to Appendices A and B for a definition and reconciliation of non-GAAP financial measures.4. Stands for “Sorted Office Paper”.
Variable Metric Change EBITDA ($millions) 1,3
Lumber Pricing2 $/mbf - / + $25
Pulp Pricing $/mt - / + $25
Newsprint Pricing $/mt - / + $25
Specialty Papers Pricing $/st - / + $25
Net Foreign Exchange C$/US$ - / + $0.01
Natural Gas $/gj + / - $0.50
SOP4 Prices $/st + / - $10-/+$5
-/+$6
+/-$17
-/+$30
-/+$37
-/+$38
-/+$48
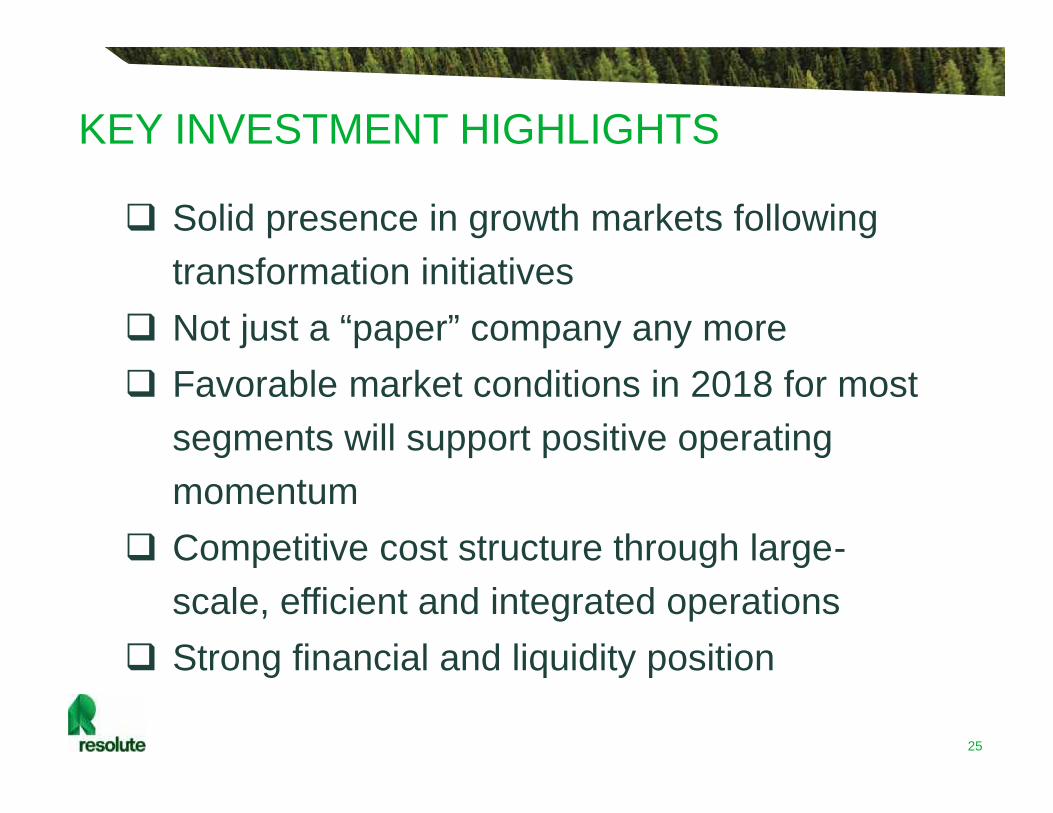
25
Solid presence in growth markets followingtransformation initiatives
Not just a “paper” company any more Favorable market conditions in 2018 for most
segments will support positive operatingmomentum
Competitive cost structure through large-scale, efficient and integrated operations
Strong financial and liquidity position
KEY INVESTMENT HIGHLIGHTS

BUSINESS SEGMENTS& INDUSTRY OVERVIEW

27
OUR OPERATIONS
1. Calhoun PM5, including Newsprint capacity, closed on September 30, 20172. Thorold mill indefinitely idled on March 10, 2017
1
2
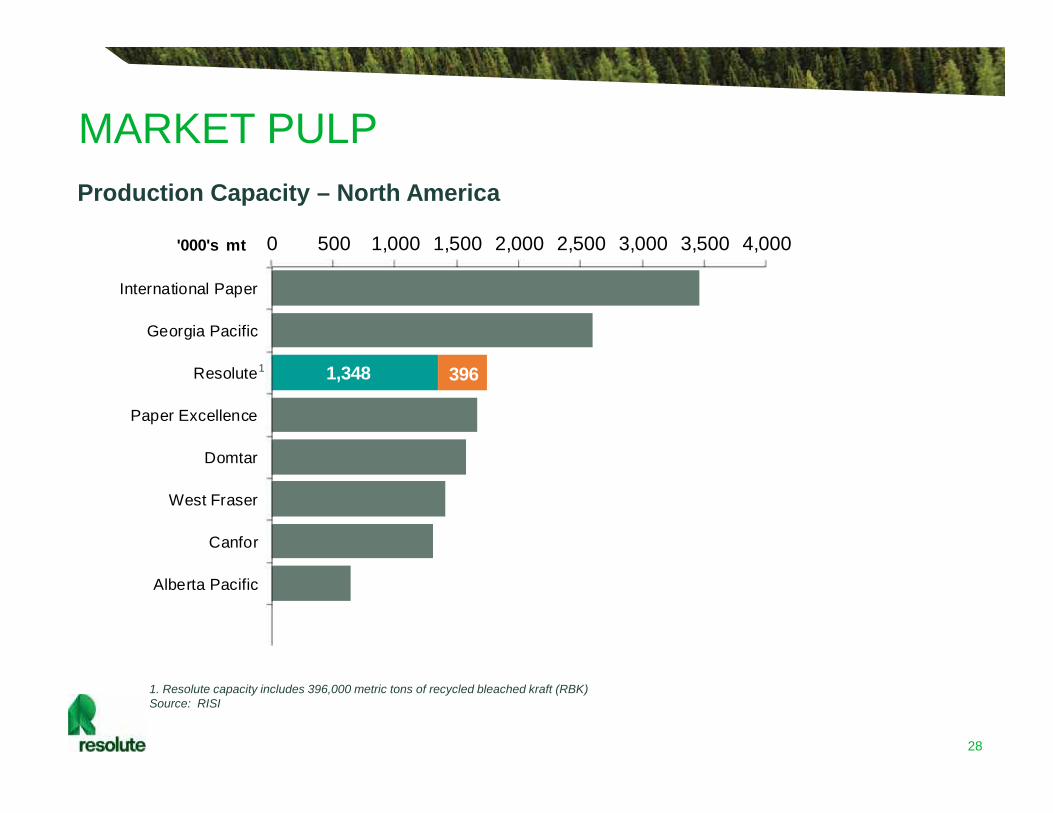
MARKET PULP
28
1,348 396
0 500 1,000 1,500 2,000 2,500 3,000 3,500 4,000
International Paper
Georgia Pacific
Resolute
Paper Excellence
Domtar
West Fraser
Canfor
Alberta Pacific
'000's mt
1. Resolute capacity includes 396,000 metric tons of recycled bleached kraft (RBK)Source: RISI
Production Capacity – North America
1

0
500
1,000
1,500
2,000
2,500
3,000
Geo
rgia
-Pac
ific
Proc
ter &
Gam
ble
Kim
berly
-Cla
rk
Cas
cade
s
Essi
ty
Cle
arw
ater
Pap
er
KP T
issu
e
Firs
t Qua
lity
Tiss
ue
J.D
. Irv
ing
Soun
dvie
w P
aper
ST P
aper
Res
olut
e Fo
rest
Pro
duct
s
Dun
n Pa
per
Orc
hids
St. C
roix
Tis
sue
Von
Dre
hle
Gor
ham
Pap
er a
nd T
issu
e
Sofid
el
Roy
al P
aper
Con
verti
ng
Ervi
ng In
dust
ries
Littl
e R
apid
s
MPI
Pap
erm
ills
Pape
r Pak
Indu
strie
s
Gre
at L
akes
Tis
sue
Seam
an P
aper
Sim
kins
Indu
strie
s
Flow
er C
ity T
issu
e
000s
of s
hort
tons
29
TISSUEProduction Capacity – North America
Sources: RISI, Company filings
62,000 short tons
66,000 short tons
Calhoun Converting
Calhoun Tissue Machine
30
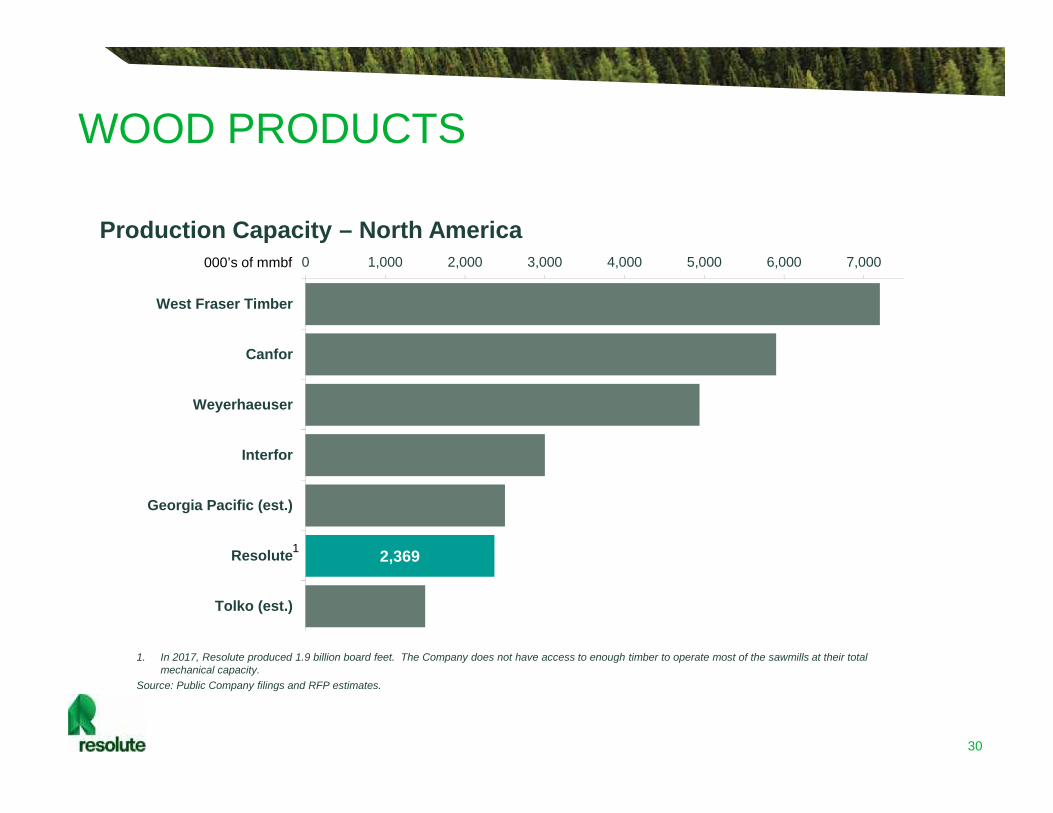
WOOD PRODUCTS
Production Capacity – North America
2,369
0 1,000 2,000 3,000 4,000 5,000 6,000 7,000
West Fraser Timber
Canfor
Weyerhaeuser
Interfor
Georgia Pacific (est.)
Resolute
Tolko (est.)
000’s of mmbf
1
1. In 2017, Resolute produced 1.9 billion board feet. The Company does not have access to enough timber to operate most of the sawmills at their totalmechanical capacity.
Source: Public Company filings and RFP estimates.

31
NEWSPRINT
1. Includes Ponderay joint venture & excludes Thorold, Mokpo and Calhoun PM5 capacity closed in 2017.Sources: RISI, annual reports
1,800
0 500 1,000 1,500 2,000 2,500
Resolute
White Birch
Kruger
Catalyst
Norpac
Alberta
000’s of mt1
1,800
0 500 1,000 1,500 2,000 2,500
Resolute
Norske Skog
UPM
Nippon
Stora Enso
Oji Paper
000’s of mt
Production Capacity – World
Production Capacity – North America
1

32
SPECIALTY PAPERS
Production Capacity – North America
Production Capacity – World
479
804
245
405
360
768
313
415
360
0 500 1,000 1,500 2,000
Catalyst
Resolute
Verso
Irving
Norpac
Stern
000’s of mt
Uncoated Mechanical
Coated Mechanical
2,010
1,770
479
804
605
2,794
290
768
1,165
313
400
0 1,000 2,000 3,000 4,000 5,000 6,000
UPM
Stora Enso
Catalyst
SAPPI
Resolute
Norske Skog
000’s of mt
1
1
1. Resolute’s capacity excludes Calhoun PM3 and PM5 and Catawba PM2 capacity closed in 2017 and includes the restart of a papermachine at Alma.
Sources : RISI, annual reports
33
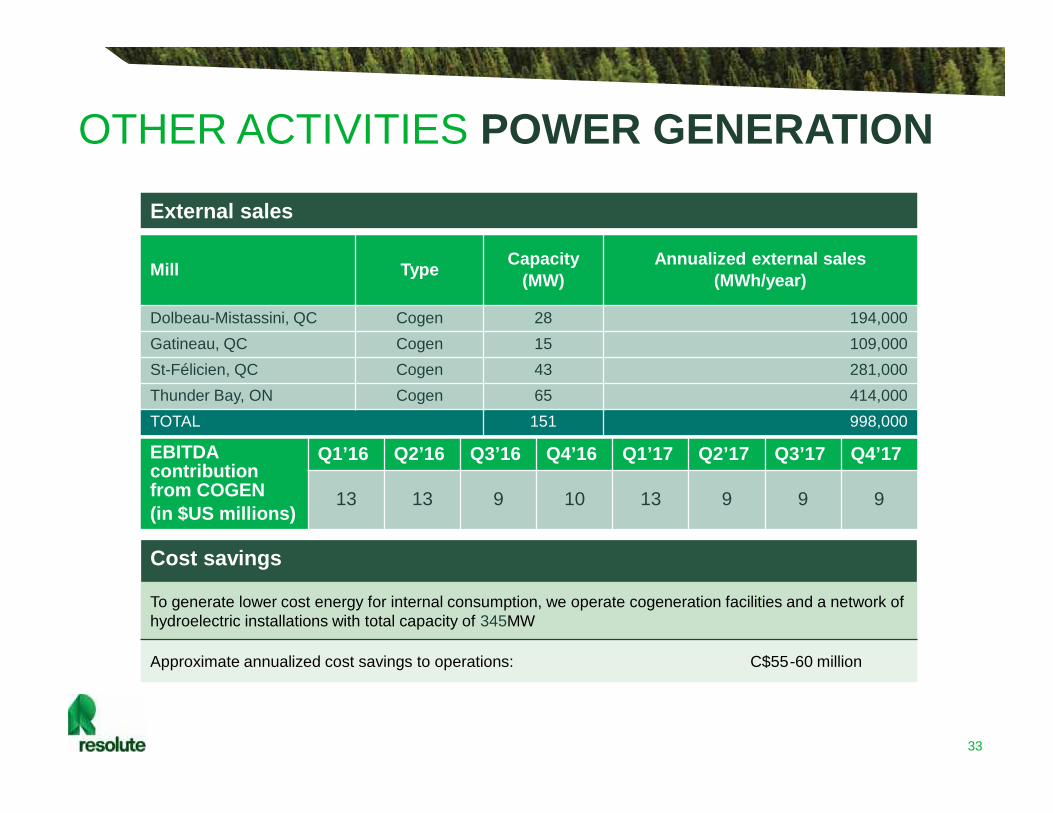
OTHER ACTIVITIES POWER GENERATION
External sales
EBITDAcontributionfrom COGEN(in $US millions)
Q1’16 Q2’16 Q3’16 Q4’16 Q1’17 Q2’17 Q3’17 Q4’17
13 13 9 10 13 9 9 9
Mill Type Capacity(MW)
Annualized external sales(MWh/year)
Dolbeau-Mistassini, QC Cogen 28 194,000Gatineau, QC Cogen 15 109,000St-Félicien, QC Cogen 43 281,000Thunder Bay, ON Cogen 65 414,000TOTAL 151 998,000
Cost savings
To generate lower cost energy for internal consumption, we operate cogeneration facilities and a network ofhydroelectric installations with total capacity of 345MW
Approximate annualized cost savings to operations: C$55-60 million

APPENDIX A

35
Three months ended December 31, 2017(unaudited, in millions, except per share amounts) EPS
GAAP, as reported 54$ 13$ 0.14$
Adjustments for special items:Foreign exchange loss - 1 0.01Closure costs, impairment and other related charges 5 5 0.05Start-up costs 9 9 0.10Net gain on disposition of assets (13) (13) (0.14)Non-operating pension and OPEB credits (4) (4) (0.04)Other expense, net - 4 0.04Income tax effect of special items - (1) (0.01)
Adjusted for special items 51$ 14$ 0.15$
Three months ended December 31, 2016(unaudited, in millions, except per share amounts) EPS
GAAP, as reported (18)$ (45)$ (0.50)$
Adjustments for special items:Foreign exchange loss - 10 0.11Closure costs, impairment and other related charges 25 25 0.28Inventory write-downs related to closures 2 2 0.02Start-up costs 3 3 0.03Non-operating pension and OPEB costs 2 2 0.02Other income, net - (3) (0.03)Income tax effect of special items - (1) (0.01)
Adjusted for special items 14$ (7)$ (0.08)$
RESOLUTE FOREST PRODUCTS INC.RECONCILIATION OF OPERATING INCOME AND NET INCOME ADJUSTED FOR SPECIAL ITEMS
Net income(loss)
Operatingincome (loss)
Operatingincome (loss)
Net income(loss)
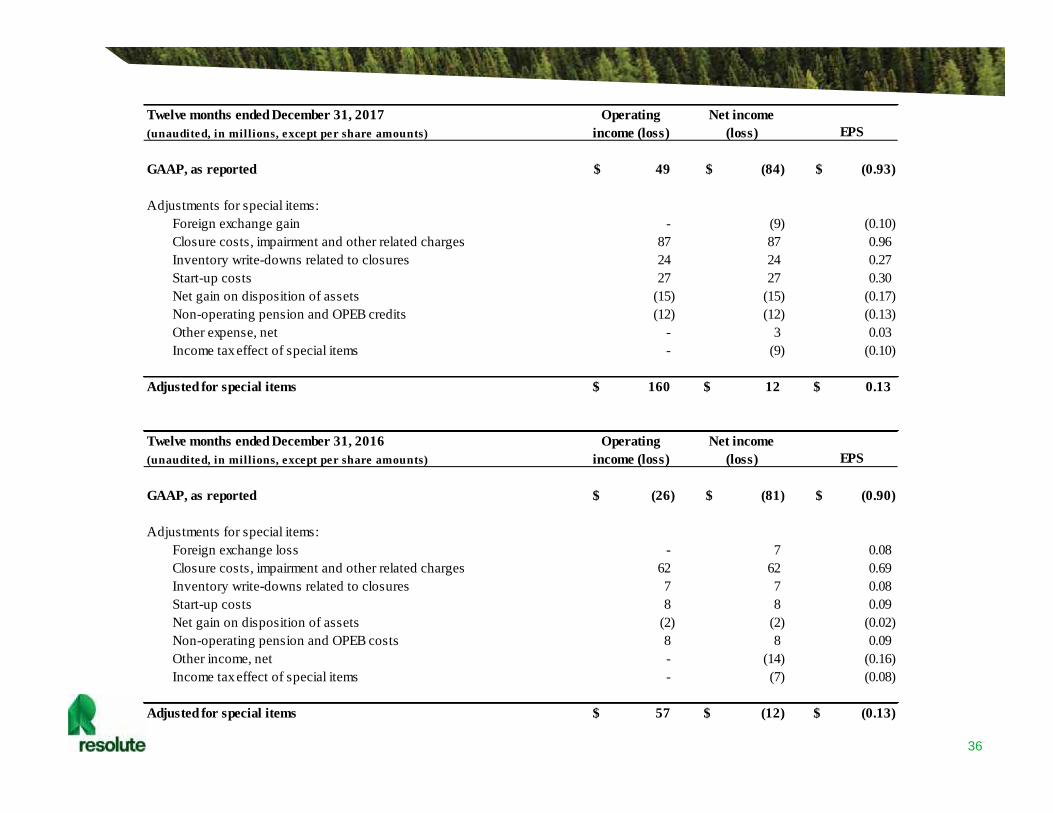
A reconciliation of our operating income, net income and net income per share reported before special items is presented in thetables below. See Note 1 to the Reconciliations of Non-GAAP Measures regarding our use of non-GAAP measures contained in ourFebruary 1, 2018, press release available on our website.
36
Twelve months ended December 31, 2017(unaudited, in millions, except per share amounts) EPS
GAAP, as reported 49$ (84)$ (0.93)$
Adjustments for special items:Foreign exchange gain - (9) (0.10)Closure costs, impairment and other related charges 87 87 0.96Inventory write-downs related to closures 24 24 0.27Start-up costs 27 27 0.30Net gain on disposition of assets (15) (15) (0.17)Non-operating pension and OPEB credits (12) (12) (0.13)Other expense, net - 3 0.03Income tax effect of special items - (9) (0.10)
Adjusted for special items 160$ 12$ 0.13$
Twelve months ended December 31, 2016(unaudited, in millions, except per share amounts) EPS
GAAP, as reported (26)$ (81)$ (0.90)$
Adjustments for special items:Foreign exchange loss - 7 0.08Closure costs, impairment and other related charges 62 62 0.69Inventory write-downs related to closures 7 7 0.08Start-up costs 8 8 0.09Net gain on disposition of assets (2) (2) (0.02)Non-operating pension and OPEB costs 8 8 0.09Other income, net - (14) (0.16)Income tax effect of special items - (7) (0.08)
Adjusted for special items 57$ (12)$ (0.13)$
Operatingincome (loss)
Net income(loss)
Operatingincome (loss)
Net income(loss)
37
Three months ended December 31, 2017(unaudited, in millions) Market pulp Tissue Wood products Newsprint
Specialtypapers
Corporate andother Total
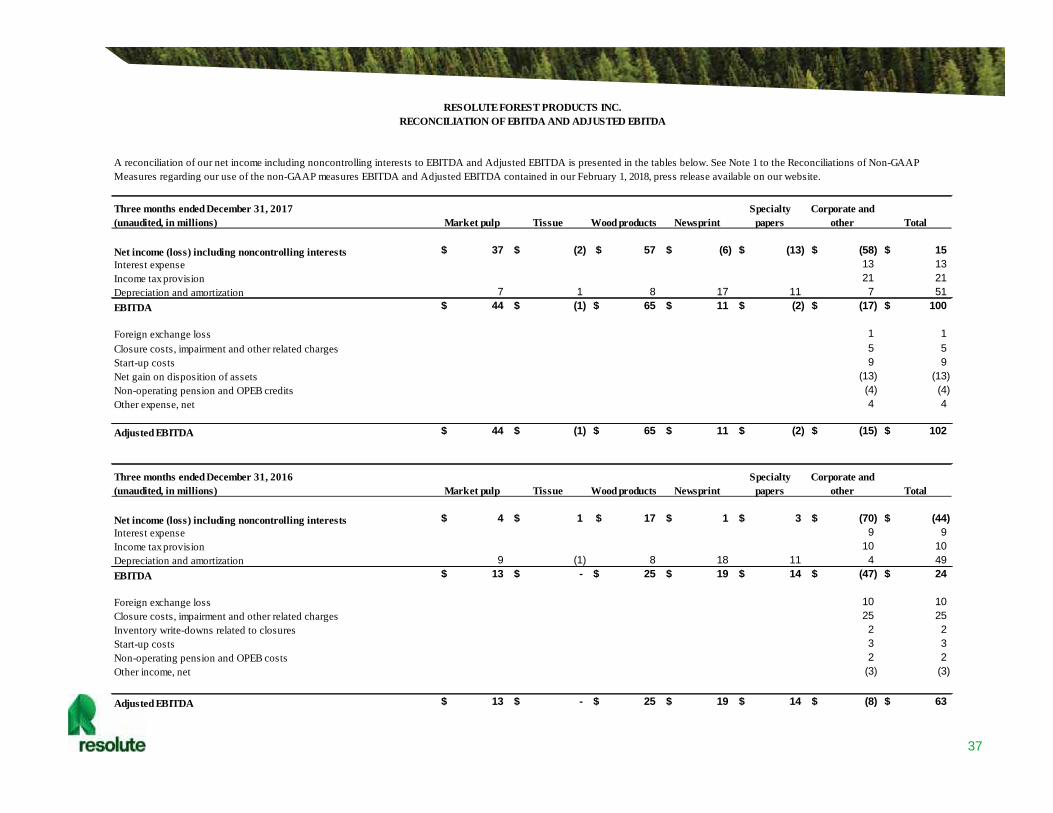
Net income (loss) including noncontrolling interests 37$ (2)$ 57$ (6)$ (13)$ (58)$ 15$Interest expense 13 13Income tax provision 21 21Depreciation and amortization 7 1 8 17 11 7 51EBITDA 44$ (1)$ 65$ 11$ (2)$ (17)$ 100$
Foreign exchange loss 1 1Closure costs, impairment and other related charges 5 5Start-up costs 9 9Net gain on disposition of assets (13) (13)Non-operating pension and OPEB credits (4) (4)Other expense, net 4 4
Adjusted EBITDA 44$ (1)$ 65$ 11$ (2)$ (15)$ 102$
Three months ended December 31, 2016(unaudited, in millions) Market pulp Tissue Wood products Newsprint
Specialtypapers
Corporate andother Total
Net income (loss) including noncontrolling interests 4$ 1$ 17$ 1$ 3$ (70)$ (44)$Interest expense 9 9Income tax provision 10 10Depreciation and amortization 9 (1) 8 18 11 4 49EBITDA 13$ -$ 25$ 19$ 14$ (47)$ 24$
Foreign exchange loss 10 10Closure costs, impairment and other related charges 25 25Inventory write-downs related to closures 2 2Start-up costs 3 3Non-operating pension and OPEB costs 2 2Other income, net (3) (3)
Adjusted EBITDA 13$ -$ 25$ 19$ 14$ (8)$ 63$
RESOLUTE FOREST PRODUCTS INC.RECONCILIATION OF EBITDA AND ADJUSTED EBITDA
A reconciliation of our net income including noncontrolling interests to EBITDA and Adjusted EBITDA is presented in the tables below. See Note 1 to the Reconciliations of Non-GAAPMeasures regarding our use of the non-GAAP measures EBITDA and Adjusted EBITDA contained in our February 1, 2018, press release available on our website.

38
Twelve months ended December 31, 2017(unaudited, in millions) Market pulp Tissue Wood products Newsprint
Specialtypapers
Corporate andother Total
Net income (loss) including noncontrolling interests 79$ (6)$ 186$ (23)$ (9)$ (305)$ (78)$Interest expense 49 49Income tax provision 84 84Depreciation and amortization 31 5 33 66 45 24 204EBITDA 110$ (1)$ 219$ 43$ 36$ (148)$ 259$
Foreign exchange gain (9) (9)Closure costs, impairment and other related charges 87 87Inventory write-downs related to closures 24 24Start-up costs 27 27Net gain on disposition of assets (15) (15)Non-operating pension and OPEB credits (12) (12)Other expense, net 3 3
Adjusted EBITDA 110$ (1)$ 219$ 43$ 36$ (43)$ 364$
Twelve months ended December 31, 2016(unaudited, in millions) Market pulp Tissue Wood products Newsprint
Specialtypapers
Corporate andother Total
Net income (loss) including noncontrolling interests 37$ (10)$ 69$ (16)$ 19$ (175)$ (76)$Interest expense 38 38Income tax provision 19 19Depreciation and amortization 37 5 31 74 45 14 206EBITDA 74$ (5)$ 100$ 58$ 64$ (104)$ 187$
Foreign exchange loss 7 7Closure costs, impairment and other related charges 62 62Inventory write-downs related to closures 7 7Start-up costs 8 8Net gain on disposition of assets (2) (2)Non-operating pension and OPEB costs 8 8Other income, net (14) (14)
Adjusted EBITDA 74$ (5)$ 100$ 58$ 64$ (28)$ 263$
APPENDIX B

40
Resolute Forest Products Inc.
Financial and Operating Statistics (Page 1 of 5)Variance
(in millions, except per share amounts and otherw ise indicated) First Second Third Fourth Total First Second Third Fourth Total checks
Income Statement Data
Sales 877$ 891$ 888$ 889$ 3,545$ 872$ 858$ 885$ 898$ 3,513$
Operating income (loss) - (18) 10 (18) (26) (6) (47) 48 54 49
Interest expense (10) (9) (10) (9) (38) (11) (12) (13) (13) (49)
Other income (expense), net 13 - 1 (7) 7 - 5 6 (5) 6
Net income (loss) including noncontrolling interests (7) (40) 15 (44) (76) (46) (73) 26 15 (78)
Net income (loss) attributable to noncontrolling interests 1 2 1 1 5 1 1 2 2 6
Net income (loss) attributable to Resolute Forest Products Inc. (8) (42) 14 (45) (81) (47) (74) 24 13 (84)
Diluted net income (loss) per share attributable to Resolute Forest Products Inc. common shareholders (0.09)$ (0.47)$ 0.15$ (0.50)$ (0.90)$ (0.52)$ (0.82)$ 0.26$ 0.14$ (0.93)$
Dividends declared per common share -$ -$ -$ -$ -$ -$ -$ -$ -$ -$
Average diluted shares outstanding (in thousands) 89,610 89,818 90,392 90,068 89,882 90,195 90,344 91,639 93,032 90,474
Ending shares outstanding (in thousands) 89,493 89,505 89,507 89,751 89,751 89,751 89,751 89,798 90,197 90,197
Financial Position
Cash and cash equivalents 37$ 40$ 55$ 35$ 35$ 39$ 44$ 38$ 6$ 6$
Working capital (2) 620 573 578 580 580 630 580 608 618 618
Fixed assets, net 1,811 1,801 1,839 1,842 1,842 1,866 1,779 1,737 1,716 1,716
Total assets 4,289 4,245 4,312 4,277 4,277 4,335 4,171 4,232 4,147 4,147
Current portion of long-term debt 1 1 1 1 1 1 1 - 1 1
Long-term debt, net of current portion 610 610 726 761 761 880 839 832 788 788
Net debt (3) 574 571 672 727 727 842 796 794 783 783
Liquidity (4) 443 452 520 468 468 380 414 400 418 418
Total Resolute Forest Products Inc. shareholders' equity 1,932 1,899 1,919 1,693 1,693 1,655 1,590 1,607 1,599 1,599
Noncontrolling interests 14 16 17 18 18 19 20 22 1 1
Total equity 1,946 1,915 1,936 1,711 1,711 1,674 1,610 1,629 1,600 1,600
Cash Flow Information
Cash flows provided by (used in) operations 6$ 63$ (18)$ 30$ 81$ (39)$ 99$ 39$ 59$ 158$
Cash invested in fixed assets (47) (52) (78) (72) (249) (69) (47) (20) (28) (164)
Dispositions of assets 5 - - - 5 - - 3 18 21
Decrease (increase) in countervailing duty cash deposits on supercalendered paper (6) (6) (5) (6) (23) (5) (7) (5) (5) (22)
Decrease (increase) in countervailing and anti-dumping duty cash deposits on softwood lumber - - - - - - (4) (14) (8) (26)
Cash flows provided by (used in) investing activities (48) (59) (82) (84) (273) (75) (54) (39) (24) (192)
Issuance of long-term debt - - 46 - 46 - - - - -
Net borrowings under revolving credit facilities 20 - 70 35 125 118 (41) (7) (51) 19
Cash flows provided by (used in) financing activities 20 (1) 115 35 169 118 (41) (8) (66) 3
2016 (1) 2017 (1)

41
Resolute Forest Products Inc.
Financial and Operating Statistics (Page 2 of 5)
(in millions, except per unit items and otherw ise indicated) First Second Third Fourth Total First Second Third Fourth Total
Sales
Market pulp 211$ 210$ 198$ 217$ 836$ 209$ 213$ 227$ 262$ 911$
Tissue 23 24 23 19 89 20 20 21 20 81
Wood products 119 145 168 164 596 177 197 219 204 797
Newsprint 257 257 242 253 1,009 226 201 199 216 842
Specialty papers 267 255 257 236 1,015 240 227 219 196 882
Total sales 877$ 891$ 888$ 889$ 3,545$ 872$ 858$ 885$ 898$ 3,513$
Shipments to Third Parties (thousands of units)
Market pulp (mt) 352 345 323 368 1,388 353 336 348 388 1,425
Tissue (st) (5) 15 14 14 11 54 13 13 14 13 53
Wood products (mbf) 390 445 506 503 1,844 505 509 531 466 2,011
Newsprint (mt) 519 510 470 493 1,992 443 397 388 410 1,638
Specialty papers (st) 393 382 384 355 1,514 364 349 333 297 1,343
Average Transaction Price per Unit
Market pulp ($/mt) 601$ 607$ 610$ 592$ 602$ 593$ 632$ 650$ 678$ 639$
Tissue ($/st) (5) 1,560 1,673 1,682 1,668 1,643 1,543 1,541 1,492 1,542 1,529
Wood products ($/mbf) 306 325 331 327 323 350 386 413 438 396
Newsprint ($/mt) 495 504 515 512 506 510 509 511 525 514
Specialty papers ($/st) 679 668 672 665 671 659 651 659 660 657
2016 (1) 2017 (1)

42
Resolute Forest Products Inc.
Financial and Operating Statistics (Page 3 of 5)
(in millions, except per unit items and otherw ise indicated) First Second Third Fourth Total First Second Third Fourth Total
Operating Income (Loss)
Market pulp 19$ 10$ 4$ 4$ 37$ 7$ 16$ 19$ 37$ 79$
Tissue (2) (4) (5) 1 (10) - (1) (3) (2) (6)
Wood products (4) 20 36 17 69 20 45 64 57 186
Newsprint (5) (4) (8) 1 (16) (4) (7) (6) (6) (23)
Specialty papers 5 15 (4) 3 19 4 (7) 7 (13) (9)
Corporate and other (13) (55) (13) (44) (125) (33) (93) (33) (19) (178)
Total operating income (loss) -$ (18)$ 10$ (18)$ (26)$ (6)$ (47)$ 48$ 54$ 49$
Selling, General and Administrative Expenses
Market pulp 7$ 7$ 8$ 6$ 28$ 8$ 8$ 9$ 7$ 32$
Tissue 2 3 2 2 9 2 1 2 1 6
Wood products 5 7 6 4 22 6 7 7 6 26
Newsprint 10 9 10 8 37 10 8 10 10 38
Specialty papers 6 7 7 5 25 7 6 7 7 27
Corporate and other 8 7 4 9 28 10 7 8 18 43
Total selling, general and administrative expenses 38$ 40$ 37$ 34$ 149$ 43$ 37$ 43$ 49$ 172$
Operating Cost per Unit
Market pulp ($/mt) 547$ 579$ 597$ 579$ 575$ 575$ 583$ 595$ 583$ 584$
Tissue ($/st) (5) 1,721 1,922 2,039 1,498 1,806 1,592 1,579 1,700 1,697 1,642
Wood products ($/mbf) 317 278 263 292 286 310 299 291 318 304
Newsprint ($/mt) 505 512 532 513 515 519 525 526 540 528
Specialty papers ($/st) 666 629 681 658 658 647 673 639 703 664
Product Inventory (thousands of units)
Market pulp (mt) 94 83 100 91 91 92 94 100 89 89
Tissue (st) 5 3 4 5 5 8 8 10 13 13
Wood products (mbf) 126 129 121 124 124 147 125 122 124 124
Newsprint (mt) 104 96 105 105 105 107 114 98 78 78
Specialty papers (st) 78 88 75 92 92 100 93 86 66 66
2016 (1) 2017 (1)
43
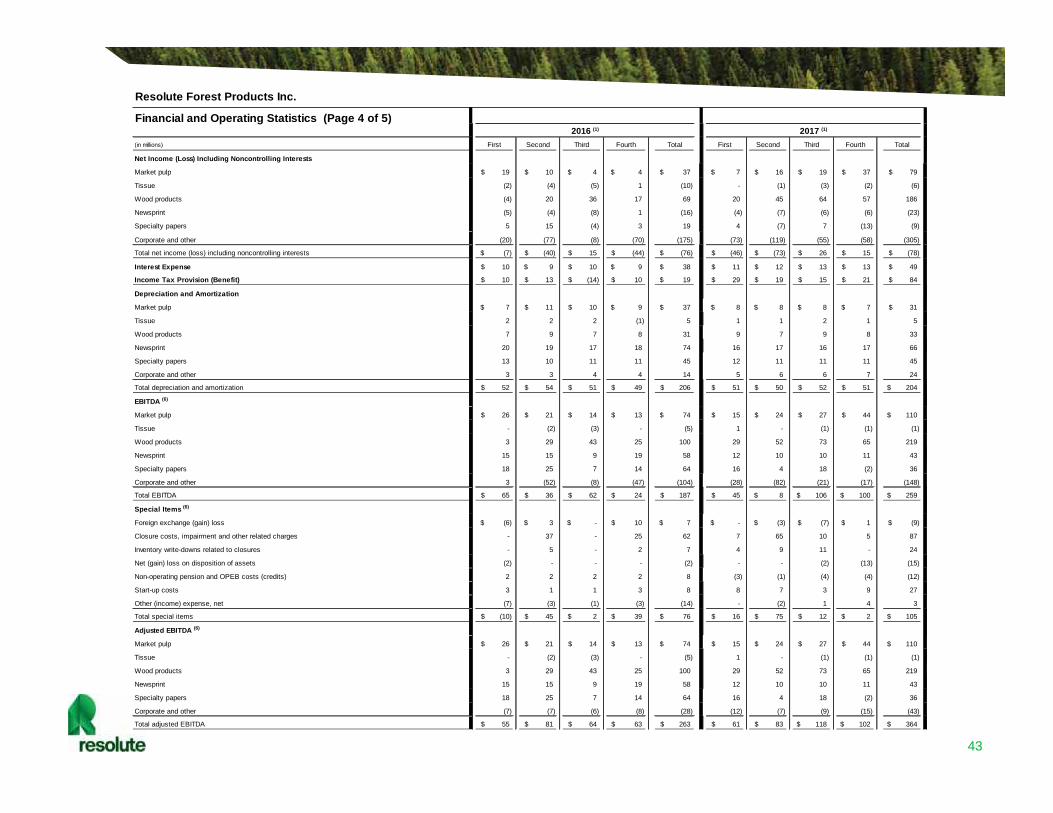
Resolute Forest Products Inc.
Financial and Operating Statistics (Page 4 of 5)
(in millions) First Second Third Fourth Total First Second Third Fourth Total
Net Income (Loss) Including Noncontrolling Interests
Market pulp 19$ 10$ 4$ 4$ 37$ 7$ 16$ 19$ 37$ 79$
Tissue (2) (4) (5) 1 (10) - (1) (3) (2) (6)
Wood products (4) 20 36 17 69 20 45 64 57 186
Newsprint (5) (4) (8) 1 (16) (4) (7) (6) (6) (23)
Specialty papers 5 15 (4) 3 19 4 (7) 7 (13) (9)
Corporate and other (20) (77) (8) (70) (175) (73) (119) (55) (58) (305)
Total net income (loss) including noncontrolling interests (7)$ (40)$ 15$ (44)$ (76)$ (46)$ (73)$ 26$ 15$ (78)$
Interest Expense 10$ 9$ 10$ 9$ 38$ 11$ 12$ 13$ 13$ 49$
Income Tax Provision (Benefit) 10$ 13$ (14)$ 10$ 19$ 29$ 19$ 15$ 21$ 84$
Depreciation and Amortization
Market pulp 7$ 11$ 10$ 9$ 37$ 8$ 8$ 8$ 7$ 31$
Tissue 2 2 2 (1) 5 1 1 2 1 5
Wood products 7 9 7 8 31 9 7 9 8 33
Newsprint 20 19 17 18 74 16 17 16 17 66
Specialty papers 13 10 11 11 45 12 11 11 11 45
Corporate and other 3 3 4 4 14 5 6 6 7 24
Total depreciation and amortization 52$ 54$ 51$ 49$ 206$ 51$ 50$ 52$ 51$ 204$
EBITDA (6)
Market pulp 26$ 21$ 14$ 13$ 74$ 15$ 24$ 27$ 44$ 110$
Tissue - (2) (3) - (5) 1 - (1) (1) (1)
Wood products 3 29 43 25 100 29 52 73 65 219
Newsprint 15 15 9 19 58 12 10 10 11 43
Specialty papers 18 25 7 14 64 16 4 18 (2) 36
Corporate and other 3 (52) (8) (47) (104) (28) (82) (21) (17) (148)
Total EBITDA 65$ 36$ 62$ 24$ 187$ 45$ 8$ 106$ 100$ 259$
Special Items (6)
Foreign exchange (gain) loss (6)$ 3$ -$ 10$ 7$ -$ (3)$ (7)$ 1$ (9)$
Closure costs, impairment and other related charges - 37 - 25 62 7 65 10 5 87
Inventory write-downs related to closures - 5 - 2 7 4 9 11 - 24
Net (gain) loss on disposition of assets (2) - - - (2) - - (2) (13) (15)
Non-operating pension and OPEB costs (credits) 2 2 2 2 8 (3) (1) (4) (4) (12)
Start-up costs 3 1 1 3 8 8 7 3 9 27
Other (income) expense, net (7) (3) (1) (3) (14) - (2) 1 4 3
Total special items (10)$ 45$ 2$ 39$ 76$ 16$ 75$ 12$ 2$ 105$
Adjusted EBITDA (6)
Market pulp 26$ 21$ 14$ 13$ 74$ 15$ 24$ 27$ 44$ 110$
Tissue - (2) (3) - (5) 1 - (1) (1) (1)
Wood products 3 29 43 25 100 29 52 73 65 219
Newsprint 15 15 9 19 58 12 10 10 11 43
Specialty papers 18 25 7 14 64 16 4 18 (2) 36
Corporate and other (7) (7) (6) (8) (28) (12) (7) (9) (15) (43)
Total adjusted EBITDA 55$ 81$ 64$ 63$ 263$ 61$ 83$ 118$ 102$ 364$
2017 (1)2016 (1)

44
Resolute Forest Products Inc.
Financial and Operating Statistics (Page 5 of 5)Notes
We believe that using these non-GAAP measures is useful because they are consistent with the indicators management uses internally to measure the Company’s performance, and it allows the reader to more easily compare our ongoing operationsand financial performance from period to period. EBITDA and adjusted EBITDA are internal measures, and therefore may not be comparable to those of other companies. These non-GAAP measures should not be viewed as substitutes to financialmeasures determined under GAAP in our consolidated statements of operations in our filings with the SEC.
6 EBITDA by reportable segment is calculated as net income (loss) including noncontrolling interests from the consolidated statements of operations, allocated to each of our reportable segments (market pulp, tissue, wood products, newsprint andspecialty papers) in accordance with FASB ASC 290, “Segment Reporting,” adjusted for depreciation and amortization. EBITDA for corporate and other is calculated as net income (loss) including noncontrolling interests from the consolidated statementsof operations, after the allocation to reportable segments, adjusted for interest expense, income taxes, and depreciation and amortization.
Adjusted EBITDA means EBITDA, excluding special items, such as foreign exchange gains and losses, closure costs, impairment and other related charges, inventory write-downs related to closures, start-up costs, gains and losses on disposition ofassets, non-operating pension and OPEB costs and credits and other charges or credits. Special items are allocated to corporate and other.
1 In the first quarter of 2017, we changed our presentation of segment operating income to reallocate the amortization of prior service credits component of pension and other postretirement benefit (or “OPEB”) costs from the reportable segments tocorporate and other. Current service costs will continue to be allocated to the reportable segments. We now also treat the amortization of prior service credits component of pension and OPEB costs as a special item to be adjusted for purposes ofestablishing our non-GAAP performance measures, listed below, together with our non-operating pension and OPEB costs and credits. This approach is consistent with the indicators management uses internally to evaluate performance. Prior periodamounts have been reclassified to conform to the 2017 presentation.
2 We define working capital as current assets less current liabilities excluding cash and cash equivalents and debt.
3 We define net debt as total debt less cash and cash equivalents.
5 Tissue converted products, which are measured in cases, are converted in short tons using a revised ratio. Prior period figures have been adjusted for comparative purposes.
4 We define liquidity as cash and cash equivalents and availability under our credit facilities.

RESOLUTE FORESTPRODUCTSRBC CAPITAL MARKETS FORESTPRODUCTS CONFERENCE
April 3, 2018