resistivity and time domain reflectometry sensors for assessing in situ
TRANSCRIPT

RESISTIVITY AND TIME DOMAIN REFLECTOMETRY SENSORS FOR
ASSESSING IN SITU MOISTURE CONTENT IN A BIOREACTOR LANDFILL
By
SREERAM JONNALAGADDA
A THESIS PRESENTED TO THE GRADUATE SCHOOL OF THE UNIVERSITY OF FLORIDA IN PARTIAL FULFILLMENT
OF THE REQUIREMENTS FOR THE DEGREE OF MASTER OF ENGINEERING
UNIVERSITY OF FLORIDA
2004

ii
ACKNOWLEDGMENTS
I would like to thank my committee members for their review and comments on
this thesis. I would like to especially thank Dr. Timothy G. Townsend for his continued
support and for providing an opportunity to work on the bioreactor landfill demonstration
project. The research presented in this thesis was supported by the Florida Department of
Environmental Protection, the Florida Center for Solid and Hazardous Waste
Management and the Urban Waste Management Center at the University of New
Orleans. I would also like to thank my fellow graduate students for their assistance with
my work. Special thanks are extended to Nitin Gawande (UCF), Matt Farfour (UF) and
Pradeep Jain (UF) for their help in this study. Greatest thanks go to my family for
emotional support and constant encouragement throughout the period of this study.

iii
TABLE OF CONTENTS page ACKNOWLEDGMENTS .................................................................................................. ii
LIST OF TABLES............................................................................................................. vi
LIST OF FIGURES .......................................................................................................... vii
ABSTRACT....................................................................................................................... ix
CHAPTER
1 INTRODUCTION ........................................................................................................1
1.1 Background and Problem Statement ......................................................................1 1.2 Research Objectives................................................................................................3 1.3 Research Approach.................................................................................................4 1.4 Organization of Thesis............................................................................................5
2 LITERATURE REVIEW .............................................................................................6
2.1 Moisture Content ....................................................................................................7 2.2 Capacitance Probe Technology ..............................................................................9 2.3 Neutron Probe Technology...................................................................................12 2.4 Electrical Resistance Technology.........................................................................17
2.4.1 Principles of Operation...............................................................................18 2.4.2 Development of Granular Matrix Sensor ...................................................20 2.4.3 Criteria for Selection of Granular Media Particle Size ..............................22 2.4.4 Calibration Experiments .............................................................................22
2.5 Time Domain Reflectometry (TDR) ....................................................................23 2.5.1 Principles of Operation...............................................................................23 2.5.2 Production and Analysis of TDR Wave Forms..........................................28 2.5.3 Calibration of TDR Sensors for Moisture Measurement ...........................30
2.6 Summary of the Advantages and Disadvantages of each Technology.................31
3 FIELD EVALUATION OF RESISTIVITY SENSORS FOR IN SITU MOISTURE MEASUREMENT IN A BIOREACTOR LANDFILL..............................................33
3.1 Introduction and Background ...............................................................................33

iv
3.2 Methods and Materials .........................................................................................35 3.2.1 Site Description ..........................................................................................35 3.2.2 Sensor Description......................................................................................36 3.2.3 Installation of MTG Sensors ......................................................................39 3.2.4 Field Measurements and Field Trials .........................................................40 3.2.5 Conversion of Resistance to Moisture Content ..........................................41 3.2.5 Estimation of Spatial Average of the Moisture Content of the Landfill ....43
3.3 Results and Discussion .........................................................................................44 3.3.1 Sensor Output and Performance.................................................................44 3.3.2 Estimation of Moisture Content .................................................................45 3.3.3 Assessment of Sensor for Monitoring Leachate Recirculation ..................50 3.3.4 Conclusions ................................................................................................51
4 COMPARISON OF RESISTIVITY AND TIME DOMAIN REFLECTOMETRY SENSORS FOR ASSESSING MOISTURE CONTENT IN BIOREACTOR LANDFILLS...............................................................................................................56
4.1 Introduction...........................................................................................................56 4.2 Background...........................................................................................................57
4.2.1 Time Domain Reflectometry (TDR) ..........................................................57 4.2.2 Electrical Resistance Technology...............................................................58
4.3 Methods ................................................................................................................59 4.3.1 TDR Sensors...............................................................................................59 4.3.2. Resistance-Based Sensors .........................................................................63 4.3.4 Site Description ..........................................................................................64 4.3.4 Installation of Sensors ................................................................................66 4.3.5 Field Measurements and Trials ..................................................................67
4.4 Results and Discussion .........................................................................................69 4.4.1 Discussion of Performance of TDR and MTG Sensors .............................69 4.4.2 Estimation of Moisture Content .................................................................70 4.4.3 Assessment of TDR and MTG Sensors for Leachate Recirculation ..........72 4.4.4 Advantages and Disadvantages of Each Probe ..........................................76 4.4.5 Summary and Conclusions .........................................................................77
5 SUMMARY AND CONCLUSIONS.........................................................................79
APPENDIX
A SUPPLEMENTAL FIGURES....................................................................................81
B RESISTIVITY SENSOR DATA................................................................................84
C TDR PROBE DATA ................................................................................................133

v
D EXAMPLE CALCULATION OF CONVERSION TO MOISTURE CONTENT FROM OBSERVED RESISTANCE AND TEMPERATURE AND CALIBRATION CURVES...................................................................................................................143
E CALCULATION FOR THE AVERAGE MOISTURE CONTENT IN THE LANDFILL AND TABLE ON TIMES OF TRAVEL OF MOISTURE TO REACH THE SENSOR ..........................................................................................................145
F SCHEMATIC OF THE TDR WAVEFORM AND CALIBRATION GRAPHS AS PROVIDED BY ZIRCON INC................................................................................148
LITERATURE CITED ....................................................................................................150
BIOGRAPHICAL SKETCH ...........................................................................................155

vi
LIST OF TABLES
Table page 2-1 Reported field capacity of MSW................................................................................9
2-2 Capture cross section for thermal neutrons of common soil elements ....................16
2-3 Advantages and disadvantages of various moisture measurement techniques ........32
3-1 Volume of leachate injected in different wells.........................................................42
3-2 Average conductivity measured at NRRL ...............................................................48
C-1 Calibration coefficients for the twelve probes .......................................................133
C-2 Dry density of waste material around each probe ..................................................133
C-3 Characteristics of waveform obtained from TDR probe........................................134
C-4 Characteristics of waveform obtained from TDR probe........................................135
C-5 Characteristics of waveform obtained from TDR probe........................................136
C-6 Characteristics of waveform obtained from TDR probe .......................................137
C-7 Characteristics of waveform obtained from TDR probe........................................138
C-8 Characteristics of waveform obtained from TDR probe........................................139
C-9 Characteristics of waveform obtained from TDR probe........................................140
C-10 Characteristics of waveform obtained from TDR probe........................................141
C-11 Characteristics of waveform obtained from TDR probe .......................................142

vii
LIST OF FIGURES
Figure page 2-1 Phase diagram of solid waste containment unit .........................................................8
2-2 Schematic of capacitance probe and frequency reader ............................................12
2-3 Effect of bound hydrogen on calibration curve........................................................14
2-4 Effect of neutron capture on the calibration curve. ..................................................16
2-5 Watermark 200 Granular Matrix Sensor. .................................................................19
2-6 Schematic of AC-half bridge circuit ........................................................................21
2-7 Schematic illustration of the time domain reflectometry principles. .......................25
2-8 Schematic representations of the transmitted and reflected voltage pulse...............26
2-9 Schematic diagram of the TDR system using parallel wave guide..........................29
3-1 Overview plan of the bioreactor...............................................................................37
3-2 Plan view of the well field........................................................................................38
3-3 Cross section along CC’ of figure 3-2......................................................................39
3-4 Schematic cross section of injection and monitoring clusters..................................40
3-5 Response of resistivity sensors at cluster L6W to leachate recirculation ................46
3-6 Response of resistivity sensors at cluster MM3E to leachate recirculation .............47
3-7 Calculated moisture content from cluster MM3E ....................................................49
3-8 Moisture contours at different levels........................................................................52
3-9 Monitoring wells surrounding injection cluster CM3 ..............................................53
3-10 Cumulative volume of leachate injected through CM3 ...........................................53
3-11 Response of monitoring clusters surrounding CM3.................................................54

viii
4-1 Observed TDR waveform from sensor at bioreactor landfill...................................61
4-2 Plan view of the bioreactor.......................................................................................65
4-3 Plan view of the MTG and TDR sensor locations ...................................................66
4-4 Schematic cross section of cluster E ........................................................................68
4-5 Response of sensors to leachate recirculation ..........................................................71
4-6 Change in moisture content of TDR and MTG sensor.............................................72
4-7 Cumulative volume of leachate injected through CI5..............................................73
4-8 Cumulative volume of leachate injected through CF6.............................................73
4-9 Response of TDR and MTG sensors located at clusters C and D............................74
4-10 Response of TDR and MTG sensors located at clusters A, B and E .......................75
4-11 Comparison of moisture contents from TDR and MTG sensors .............................77

ix
Abstract of Thesis Presented to the Graduate School
of the University of Florida in Partial Fulfillment of the Requirements for the Master of Engineering
RESISTIVITY AND TIME DOMAIN REFLECTOMETRY SENSORS FOR ASSESSING IN SITU MOISTURE CONTENT IN A BIOREACTOR LANDFILL
By
Sreeram Jonnalagadda
May 2004
Chair: Timothy G. Townsend Major Department: Environmental Engineering Sciences
The presence and movement of moisture in landfilled solid waste play a major role
in the rate of landfill stabilization. Instruments that can monitor the in situ moisture
content of landfilled waste would be of great benefit to landfill operators, especially those
at bioreactors. Two potential technologies were examined in this research: resistance-
based and time domain reflectometry (TDR) sensors. One hundred and thirty five
resistance-based sensors and 12 TDR sensors were installed in a leachate recirculation
well field at a bioreactor in Florida. The resistance-based sensors were found to respond
to an increase in moisture resulting from leachate recirculation. The initial spatial average
moisture content determined by the sensor readings (using a laboratory-derived
calibration) was 42% compared to 23% from gravimetric readings. This was attributed to
the greater leachate conductivity values encountered in the landfill compared to that used
in the calibration, and the potential for the sensors to intercept leachate flow from
preferential paths. The TDR sensors were also found to respond to leachate recirculation.

x
The moisture contents from the TDR sensors (obtained using laboratory-derived
calibration) were compared to the moisture contents from the resistance-based sensors.
The results showed that both technologies predicted transient moisture changes in the
landfill. The heterogeneous nature of landfilled waste and its variable leachate electrical
conductivity were observed to affect the calibration equations for both moisture
measurement technologies. Moisture measurement devices have advantages over
gravimetric moisture measurement techniques because of their cheaper manufacturing
costs, ease in automation and ability to predict the transient moisture changes with time.

1
CHAPTER 1 INTRODUCTION
1.1 Background and Problem Statement
Municipal solid waste (MSW) management has evolved into an important issue in
the past few decades. Approximately 231.9 million tons of MSW were generated in the
United States in 2000 for a per capita generation rate of 4.5 pounds per person per day
(US Environmental Protection Agency 2002). Landfills represent the primary method of
managing this waste. Environmental risks posed by past landfilling practices have
included contamination of ground water and the release of flammable and toxic gases.
Modern sanitary landfills are constructed with engineered leachate collection and landfill
gas extraction systems to address these concerns.
When a landfill is closed, a cap is constructed to prevent external moisture entering
the waste; this is performed to minimize leachate generation. Minimizing waste moisture
content, however, has consequences. Research has demonstrated that biodegradation
rates, and hence methane production rates, of landfilled wastes rise with an increase in
moisture content (Eliasen 1942, DeWalle et al. 1978, Rees 1980, and Pohland 1988). The
movement of the moisture also plays an important role, as it promotes the exchange of
substrates and nutrients, the dilution of inhibitors, and the distribution of microorganisms
within the landfill environment (Tittlebaum 1982, Pohland 1988). Considering these
advantages, some landfill practitioners and researchers have proposed to increase the
waste’s moisture content by recirculating leachate or adding water to landfills in an effort
to enhance waste degradation and stabilization.

2
The Solid Waste Association of North America (SWANA) has defined a bioreactor
landfill as “any permitted Subtitle D landfill or landfill cell where liquid or air is injected
in a controlled fashion into the waste mass in order to accelerate or enhance
biostabilization of the waste” (US EPA, 2002). Recirculation of leachate is the primary
tool for creating bioreactor conditions. Other methods to enhance biostabilization include
waste shredding, addition of nutrients and sludge, pH neutralization, and temperature
control (Pohland 1975, Tittlebaum 1982, Miller et al. 1991). Advantages that enhanced
biostabilization provides include quicker waste stabilization times, faster rates of landfill
gas production, effective management of leachate generated from the landfill, and
accelerated waste settlement to gain more air space.
The critical role of moisture in bioreactor operations suggests that an ability to
measure and track moisture levels in a landfill would be of great value to bioreactor
landfill operators. Moisture content can be measured by collecting waste samples
followed by gravimetric measurement. This technique is disruptive and costly, and
cannot be effectively used for routine monitoring. Various moisture measuring devices
have been developed to measure the in situ moisture content of soils. Examples include
neutron probes, capacitance probes, time domain reflectometry probes and electrical
resistance sensors; these devices were originally developed to measure the moisture
contents of soils for irrigation (McCann et al. 1992, Noborio et al. 1994, Chanasyk and
Naeth 1996, Chanzy et al. 1998). Each moisture measuring technology has specific
advantages and disadvantages. The application of these technologies to in situ
measurement in landfilled waste is a natural extension. While some work has been
conducted on in situ moisture monitoring of landfills (Holmes 1984, Rosqvist et al. 1997,
3
Yuen et al. 2000), experience and data are limited and there is no one agreed upon
technology. More work, especially at the operating field scale, is needed.
Gawande et al. (2003) studied the ability of a prototype resistance-based sensor to
measure moisture content of solid waste. This prototype sensor was operated in tap water
and saline conditions and also tested in soil, paper and compost to simulate its operation
under landfill conditions. The study indicated that resistivity sensors show potential for
responding to changes of moisture contents within a landfill. It also suggested that a
single calibration curve obtained at a specified electrical conductivity of the leachate
could be used to calculate the moisture content values from corresponding resistivity
measurements. Such laboratory calibrations were performed and calibration curves were
provided for two conductivities. As a follow up to this work, a large number of the
resistance-based sensors were installed at the New River Regional Landfill (NRRL)
bioreactor in North Central Florida for tracking the in situ moisture content of the
landfilled waste. A major focus of this thesis is an evaluation of these sensors and how
they responded to leachate recirculation. In addition to the resistance sensors, several
time domain reflectometry (TDR) sensors were installed at the NRRL for comparison
purposes. A second focus of this thesis is a comparison of the two sensor technologies in
a side-by-side application.
1.2 Research Objectives
The objectives of the research presented in this thesis were to
• Evaluate the effectiveness of the electrical resistance-based sensors for the in situ measurement of moisture in the NRRL bioreactor.
• Compare the performance of electrical-resistance-based sensors with time domain reflectometry sensors with respect to measuring the in situ moisture content in the landfilled solid waste.

4
1.3 Research Approach
A total of 135 electrical resistance-based moisture sensors in 48 different clustered
locations were installed at the NRRL. Each cluster consisted of either two or three
resistivity sensors placed at different depths (approximately 15 ft, 30 ft and 50 ft). These
sensors were developed and lab-tested before installation (Gawande et al., 2003). They
work on the principle that an estimate of moisture present in the medium between two
concentric electrodes can be obtained from their measured resistance, and that the
moisture content of the medium would be representative of the surrounding waste. Data
from the sensors were collected using a datalogger at a frequency of twice per day.
A total of 12 TDR sensors were installed at five different clustered locations at
depths of approximately 6ft, 15ft and 30 ft, also at the NRRL. TDR sensors work on the
principle that the time taken for an electromagnetic pulse to travel through a wet medium
can be used to measure the relative dielectric constant of the medium. Since the dielectric
constant changes as a function of moisture content, it can be used to estimate the moisture
content of the medium using an appropriate calibration curve. The TDR cluster locations
contained resistivity sensors installed at approximately the same depths as the TDR
sensors. Two of the five cluster locations contained three TDR sensors per location; the
resistivity sensors were placed in adjacent holes at approximately the same depths as the
TDR sensors. In the remaining three locations the TDR and resistivity sensors were
placed next to each other in the same hole. A datalogger with a laptop was used to
capture the reflected waveform from the TDR sensors. The captured waveforms were
used to calculate the relative dielectric constant of waste surrounding the TDR sensors (at
least once a week).

5
A vertical leachate injection well recirculation system was used to recirculate
leachate at the NRRL. In order to efficiently wet the waste, injection wells were installed
in clusters of different depths. Each injection cluster contained three vertical injection
wells with depths averaging 20ft, 40ft and 60ft. Leachate recirculation was initiated on
May 30, 2003. The background data from both resistance as well as TDR sensors were
collected before recirculation of leachate. These data were used as a baseline for
comparison with data acquired after the beginning of recirculation.
1.4 Organization of Thesis
Chapter 2 of this thesis presents background information and a literature review
pertaining to devices used to measure moisture in landfills. The results of the field study
evaluating the use of electrical resistance sensors for tracking in situ moisture content in
landfills are described in chapter 3. Comparison of resistivity and TDR sensors for
assessing moisture content in landfills is made in chapter 4. The thesis ends with a
summary and conclusions in chapter 5. Appendices with tables and information on the
calibration curves and supplemental figures, which include data from all the resistance-
based sensors, are presented at the end.

6
CHAPTER 2 LITERATURE REVIEW
This chapter provides a brief overview of the various technologies available and
currently used to monitor the in situ moisture content in soils. The potential for
application of these technologies in bioreactor landfills, including their advantages and
disadvantages is discussed.
Bioreactor landfill operators must provide conditions that facilitate higher rates of
degradation of the landfilled waste. This is typically achieved by the addition of moisture
of up to a target of 60% by weight. Previous studies indicated that the availability of
moisture content of about 25 to 60% has shown to exponentially increase methane gas
production. In situ moisture measuring devices could be helpful to regulate the moisture
and control leachate recirculation in the landfill and without them the operators could not
understand the travel patterns of the pumped moisture. Conventional moisture
measurement (gravimetric measurement) is the most reliable technique to find the in situ
moisture contents. In this method waste is excavated from the required depth inside the
landfill and the wet weight of the excavated sample is measured. The sample is oven
dried and its dry weight is calculated. The difference between the wet weight and the dry
weight is the amount of water retained by the sample. However, it is extremely difficult
to measure moisture content using this technique because the waste must be excavated to
measure the in situ moisture content, an expensive and time consuming prospect. These
difficulties were the impetus for developing more sophisticated in situ moisture
measurement technologies.

7
The technologies discussed in this chapter are reported to have variable degrees of
success in the agricultural sector to provide in situ moisture measurement for irrigation of
farmlands. Landfills provide some unique challenges in the application of these
technologies, when compared to soils. A few more prominent challenges are the extreme
heterogeneity of waste and varying electrical conductivity of leachate. This chapter
discusses the theory associated with each technology and the advantages and
disadvantages involved in the field application of the devices associated with the
technology. The following sections in this chapter give the definition of moisture content,
types of moisture contents commonly reported in literature, typical values of the moisture
content present in MSW and discussions about various moisture measurement
technologies.
2.1 Moisture Content
The amount of water that is present in the waste can be given by its moisture
content value. The moisture content is expressed as follows (Tchobanoglous et al. 1993),
100*
−
=w
dwM
where M is the moisture content (%) and w is the initial weight of sample as delivered,
lb(kg) and d is weight of sample after drying at 105oC, lb(kg). For most MSW in the US,
the moisture content will vary from 15-40% by weight depending on the composition of
the wastes, the season of the year, and the humidity and weather conditions
(Tchobanoglous et al. 1993). However, in soil science, moisture content is typically
expressed as the volume of water filling the pore space in the soils. This is also known as
volumetric moisture content. A phase diagram is useful to define the various engineering
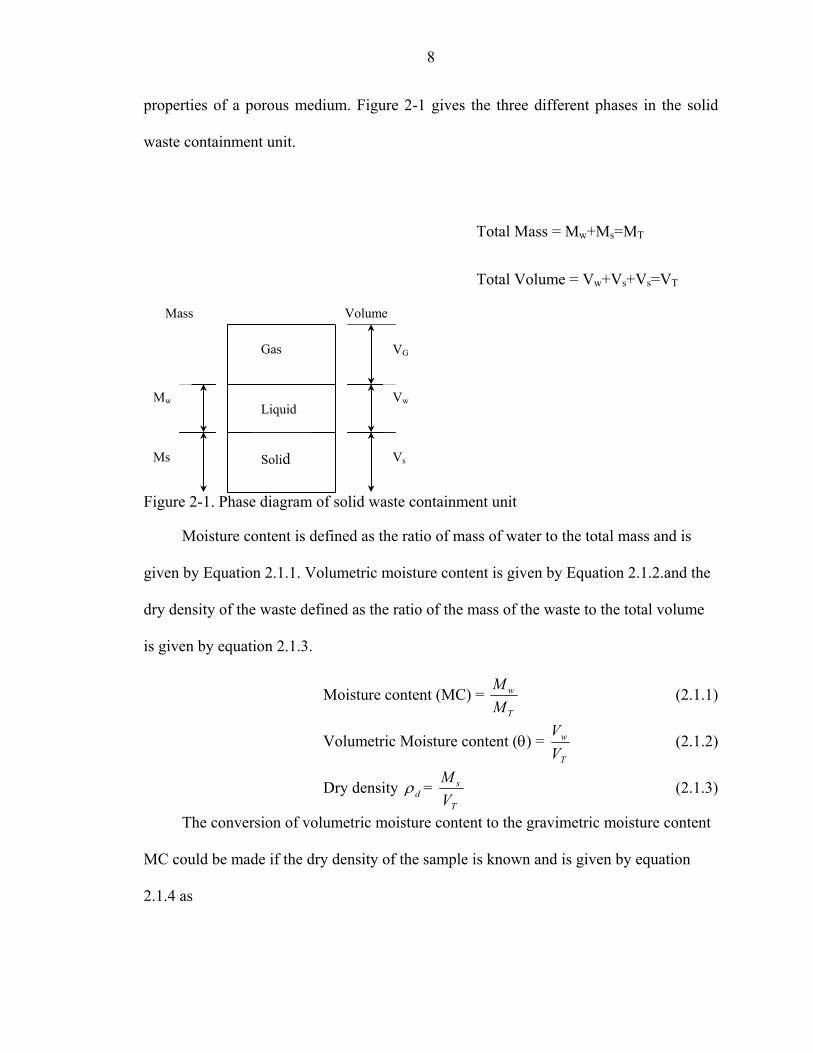
8
properties of a porous medium. Figure 2-1 gives the three different phases in the solid
waste containment unit.
Solid
Liquid
Gas
Mass Volume
VG
Vw
Vs
Mw
Ms
Figure 2-1. Phase diagram of solid waste containment unit
Moisture content is defined as the ratio of mass of water to the total mass and is
given by Equation 2.1.1. Volumetric moisture content is given by Equation 2.1.2.and the
dry density of the waste defined as the ratio of the mass of the waste to the total volume
is given by equation 2.1.3.
Moisture content (MC) = T
w
MM
(2.1.1)
Volumetric Moisture content (θ) = T
w
VV
(2.1.2)
Dry density dρ = T
s
VM
(2.1.3)
The conversion of volumetric moisture content to the gravimetric moisture content
MC could be made if the dry density of the sample is known and is given by equation
2.1.4 as
Total Volume = Vw+Vs+Vs=VT
Total Mass = Mw+Ms=MT
9
θρρθρ
wD
wMC+
= (2.1.4)
The porosity of the waste is defined as
T
v
VV
nPorosity =)( (2.1.5)
where Vv is the total void space and VT is the total volume. Field capacity is the moisture
content of the porous material at which water no longer drains under gravity and is
defined as the volumetric water content at a soil water suction of 0.33 bars or remaining
after a prolonged period of gravity drainage without additional water supply. The
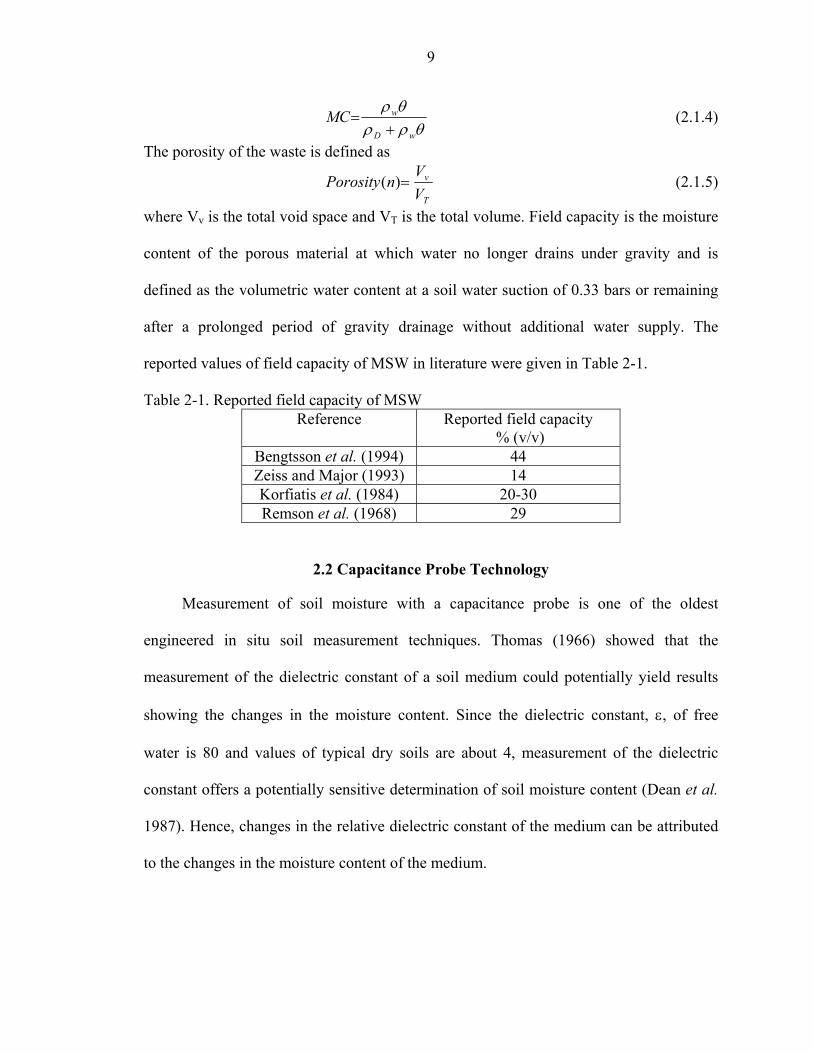
reported values of field capacity of MSW in literature were given in Table 2-1.
Table 2-1. Reported field capacity of MSW Reference Reported field capacity
% (v/v) Bengtsson et al. (1994) 44 Zeiss and Major (1993) 14 Korfiatis et al. (1984) 20-30 Remson et al. (1968) 29
2.2 Capacitance Probe Technology
Measurement of soil moisture with a capacitance probe is one of the oldest
engineered in situ soil measurement techniques. Thomas (1966) showed that the
measurement of the dielectric constant of a soil medium could potentially yield results
showing the changes in the moisture content. Since the dielectric constant, ε, of free
water is 80 and values of typical dry soils are about 4, measurement of the dielectric
constant offers a potentially sensitive determination of soil moisture content (Dean et al.
1987). Hence, changes in the relative dielectric constant of the medium can be attributed
to the changes in the moisture content of the medium.

10
2.2.1 Principles Of Operation
Dean et al. (1987) described a typical capacitance probe soil moisture measurement
device. This probe consists of two electrodes (upper and lower) separated by a plastic
dielectric. The electrodes and the dielectric are placed in a plastic cylindrical container
known as access tube. For in situ measurements, the access tubes are installed in the field
and care is taken to eliminate the air gaps between the access tube and the soil and
minimize the overall disturbance in the soil. The sensor measures the resonant frequency
of the LC (L = inductance, C = Capacitance) circuit formed by the soil matrix in the
immediate vicinity of the access tube, the access tube itself, plus the air space between
the sensor and the access tube (together referred to as the soil-access tube system). Any
changes in the soil access tube system will result in a change of the resonant frequency.
The capacitance of the soil access tube system is measured and is given by Equation 2.2.1
εgC = (2.2.1) where C = Capacitance (Farads)
ε = the dielectric constant (dimensionless)
g = a geometrical constant depending on the configuration of the system (Farads).
Increase in the soil moisture content results in an increase in capacitance of the soil-
access tube system. Changes in temperature, bulk density and the porosity of the soil
effects the capacitance of the soil-access tube system (Evett 1998). The geometric
parameter g in equation 2.2.1 can be related to the classical equation for a simple two
electrode plate as given by equation 2.2.2 (Evett 1998):
daKC a0ε= (2.2.2)
where ε0= the permittivity of free space (8.9 X 10⁻¹² Fm-1 Farad per meter)
a = the overlapping area (m2) of the plates

11
d = the thickness (m) of the dielectric separating the plates
Ka = relative dielectric constant
C = capacitance (Farads)
Equation 2.2.2 only applies if the plates are parallel and the dielectric material
separating the plates is uniform. In this case the value of g in equation 2.2.1 is da
0ε . The
dielectric between the two electrodes for the soil access tube system is much more
complex and a relationship has not been established for computing g and thus C in
equation 2.2.1 for this geometry. The schematic of a typical sensor is shown in the Figure
2-2. This sensor, unlike the simple plate capacitor, has plates in the form of two surfaces
of a cylinder that are separated by an insulator, and placed in an access tube with soil
outside the plates. Due to this setup, the electric field permeating the soil forms an
elliptical shape originating in one plate and ending in the other. In general, the surface
area of the plates of the capacitance probe electrodes can be easily found but the degree
to which the elliptical electric field lines permeate into the soil is not known. Thus it is
hard to evaluate a term equivalent to d, in Equation 2.2.2, since the shape of the electric
field in the soil access tube system may be influenced by the soil heterogeneity including
the gaps between the tube wall and soil during the time of installation. The capacitance
probes need to be calibrated before installation in the field. Topp et al. (1980) empirically
established relationship between dielectric constant ε and volumetric water content θ for
the soils. This relationship depends on soil properties like texture, dry density and the
soil’s temperature. Chanzy et al. (1998) performed field scale evaluation of the
capacitance probes for soil moisture monitoring. The presence of heavy metals and high
salinity of landfills has influence on dielectric constant measurement and hence limits the

12
application of this technology for in situ moisture content measurements in MSW
landfills.
Access Tube
Frequency reader
Figure 2-2. Schematic of capacitance probe and frequency reader (Dean et al. 1987)
2.3 Neutron Probe Technology
Neutron probe technology, also known as a neutron scattering method, is an
indirect method of measuring soil moisture content. A radioactive source emits neutrons
through the media and its moisture content is measured by the thermal or slow neutron
density at the collector (Schmugge et al. 1980). Garner and Kirkham (1952) first defined
the principles of the neutron scattering method. The neutron probe has found wide use in
agricultural, hydrological and civil engineering applications (Williams et al 1981).
Smaller and safer radioactive sources have evolved as a result of technological
advancements in neutron probe technology (Evett, 1998). Application of neutron probe
technology is not feasible for certain moisture-measuring situations due to high
regulatory standards for use of radioactive materials. These requirements result in costly
licensing and training for both the companies and the operators, and storage of the
13
equipment and disposal of the probe with its radioactive source is also expensive and
highly regulated (Evett, 1998).
2.3.1 Principles Of Operation
Neutron probes consist of a probe and an electronic counting scale, which are
connected together by an electric cable. In order to measure the moisture content of a
medium at a desired depth, the probe is lowered down an access tube to the required
depth. Access tubes are made of materials that do not slow the neutrons emitted by the
source.
The principles of neutron probe operation given below were discussed in Gardner
and Kirkham (1952) and are documented by Chanasyk and Naeth (1996), Evett (1998),
Schmugge et al (1980). Neutrons with high energy are emitted by a radioactive source
into the soil and are slowed down by elastic collisions with nuclei of atoms and become
thermalized. The average energy loss is much greater when neutrons collide with atoms
of low atomic weight than collisions with heavier atoms. The hydrogen atom with its low
atomic weight can slow down neutrons more effectively than other elements. The density
of the resultant cloud of slowed neutrons (which are detected by the counter) is taken to
be proportional to the total number of hydrogen atoms per unit volume of the soil (Yuen
et al 2000). The volumetric moisture content can then be determined by an established
calibration curve, assuming that these hydrogen atoms have direct correlation with soil
moisture.
Thomas (2001) documented some of the problems of the neutron probe that
include:
14
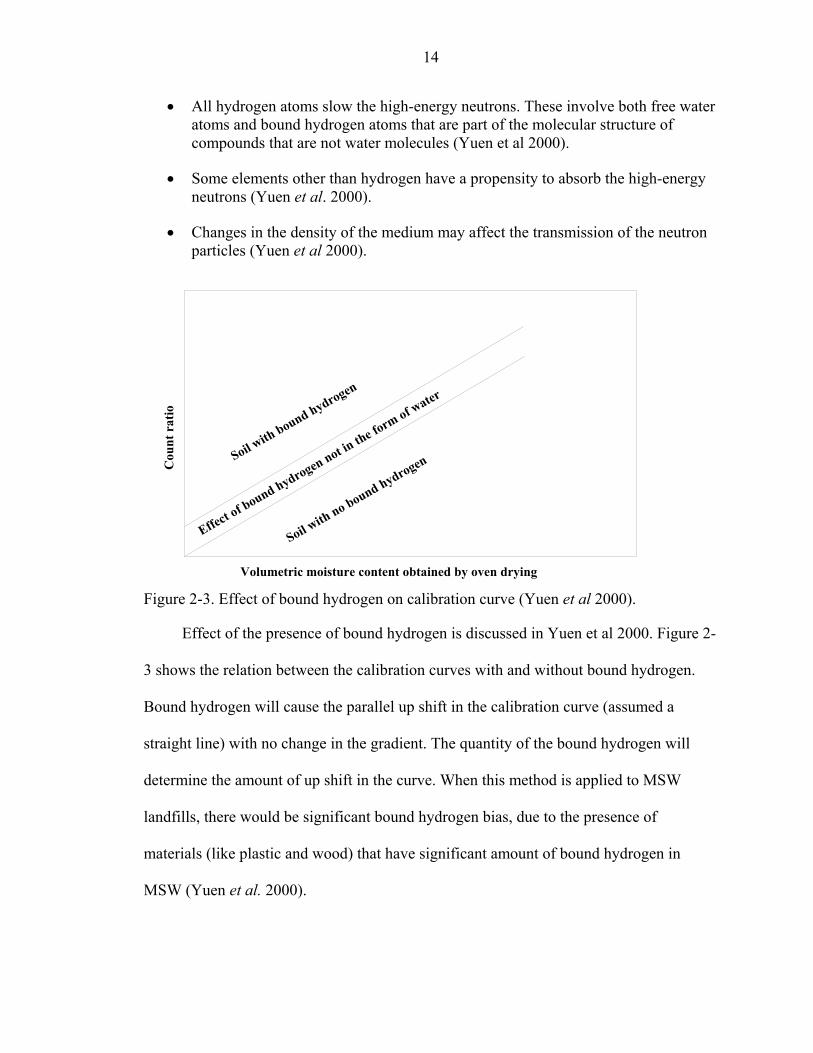
• All hydrogen atoms slow the high-energy neutrons. These involve both free water atoms and bound hydrogen atoms that are part of the molecular structure of compounds that are not water molecules (Yuen et al 2000).
• Some elements other than hydrogen have a propensity to absorb the high-energy neutrons (Yuen et al. 2000).
• Changes in the density of the medium may affect the transmission of the neutron particles (Yuen et al 2000).
Effect of bound hydrogen not in the form of water
Soil with no bound hydrogenSoil w
ith bound hydrogen
Volumetric moisture content obtained by oven drying
Cou
nt r
atio
Figure 2-3. Effect of bound hydrogen on calibration curve (Yuen et al 2000).
Effect of the presence of bound hydrogen is discussed in Yuen et al 2000. Figure 2-
3 shows the relation between the calibration curves with and without bound hydrogen.
Bound hydrogen will cause the parallel up shift in the calibration curve (assumed a
straight line) with no change in the gradient. The quantity of the bound hydrogen will
determine the amount of up shift in the curve. When this method is applied to MSW
landfills, there would be significant bound hydrogen bias, due to the presence of
materials (like plastic and wood) that have significant amount of bound hydrogen in
MSW (Yuen et al. 2000).

15
From Figure 2-3, it can be clearly seen that the calibration curve shifted vertically
as a result of the presence of bound hydrogen. Landfills have significant amounts of
organic matter containing bound hydrogen. These bound hydrogen atoms should be taken
into account to get reasonably accurate results for the application of this technology in
landfills. A standard calibration curve using sand as a datum can be used with reasonable
accuracy when relative (and not absolute) water content is measured (Yuen, 1999). This
calibration curve is limited to organic content of the waste that is not extremely
excessive.
Neutron probe technology assumes that hydrogen atoms from the water molecules
thermalize the neutrons. This technology cannot measure accurate moisture content, if
atoms of any other element are involved in thermalizing the neutrons. When the neutrons
are slowed, some of them are captured by various elements that have the affinity towards
the neutrons. Dickey (1990) suggested that this neutron capture effect could be reflected
graphically as shown in Figure 2-4 (Yuen et al. 2000).
Neutron absorption elements decrease the number of thermalized neutrons and this
reduction is proportional to the moisture content. As shown in the Figure 2-4, neutron
capture effect decreases the gradient of the calibration curve. Table 2-2 lists different
elements and their absorption capacities (Dickey 1990).
Yuen et al. (2000) indicated that iron, potassium and chlorine are common in MSW
landfills and hence a certain degree of neutron absorption bias is expected when this
technology is applied to landfills. Apart from bound hydrogen and neutron capture
effects, the changes in the density of the medium also effect the thermalization of the
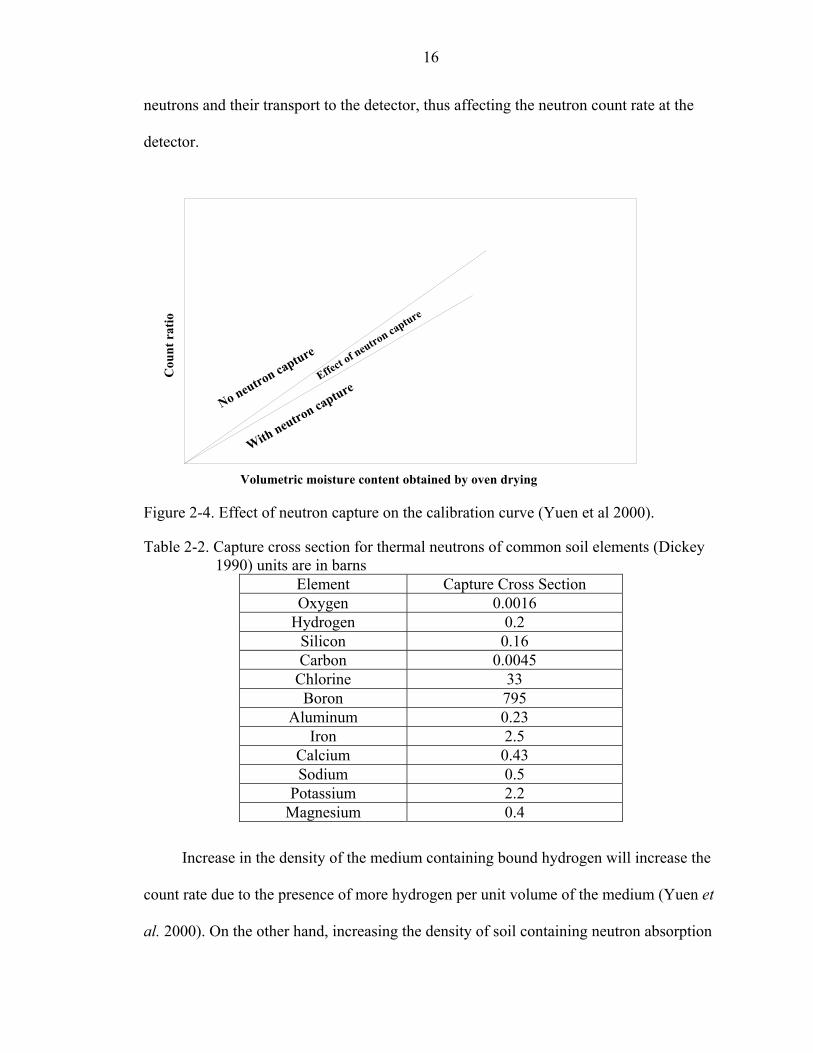
16
neutrons and their transport to the detector, thus affecting the neutron count rate at the
detector.
Volumetric moisture content obtained by oven drying
With neutron capture
Cou
nt r
atio
No neutron capture
Effect of neutron capture
Figure 2-4. Effect of neutron capture on the calibration curve (Yuen et al 2000).
Table 2-2. Capture cross section for thermal neutrons of common soil elements (Dickey 1990) units are in barns
Element Capture Cross Section Oxygen 0.0016
Hydrogen 0.2 Silicon 0.16 Carbon 0.0045
Chlorine 33 Boron 795
Aluminum 0.23 Iron 2.5
Calcium 0.43 Sodium 0.5
Potassium 2.2 Magnesium 0.4
Increase in the density of the medium containing bound hydrogen will increase the
count rate due to the presence of more hydrogen per unit volume of the medium (Yuen et
al. 2000). On the other hand, increasing the density of soil containing neutron absorption

17
elements would decrease the count rate due to more neutron capture per unit volume of
the medium Yuen et al. (2000).
Yuen et al. (2000) recommended the following field application procedure for
implementation of neutron probe technology in landfills:
• Install access tube
• Collect MSW samples from drilling during installation to determine gravimetric moisture content and waste composition
• Convert gravimetric to volumetric moisture content
• Plot initial volumetric moisture content against depth
• Plot subsequent moisture change (use the standard sand curve to calculate the moisture change from the change in neutron count ratio)
Yuen et al. (2000) installed the laboratory calibrated neutron probes in a full-scale
operating landfill and their observations for the application of neutron probe technology
in landfills are given below:
• Due to the heterogeneous nature of MSW, neutron probe technology cannot be used to measure the absolute moisture content
• Neutron probe technology can be used to measure moisture change with acceptable errors, provided the presence of neutron capture elements is not excessive
• The use of the standard sand calibration curve tends to underestimate moisture change slightly
• If density is not known and has to be estimated, errors may result in the conversion of initial gravimetric to volumetric moisture content
2.4 Electrical Resistance Technology
The moisture content of a medium can be determined from the value of the
electrical resistance obtained between the electrodes inserted in the medium. This
technology had been applied for soil moisture measurements using gypsum block sensors

18
and granular matrix sensors. Electrical resistance of the moisture present in the sensor’s
granular media can be obtained when equilibrium is attained between the moisture
present in the sensor media and the external moisture. By using a calibration curve, this
resistance value can be converted into the corresponding moisture content of the media.
2.4.1 Principles of Operation
A pair of electrodes inserted into a porous matrix comprises an electrical resistance
soil moisture sensor. Two main types are used, gypsum blocks and granular matrix
sensors. For the soil moisture measurement, the matrix in these sensors consists of a
highly soluble calcium sulfate salt that serves to boost conductivity and insulate the
sensor from the fluctuations in the salinity of the external environment (McCann et al.
1992). However, when used in landfills, it is not essential to add the soluble salt to boost
conductivity as landfills contain highly conductive leachate. When inserted into the
medium the sensors come into hydraulic contact with the soil solution and equilibrium is
attained between the sensor and the medium and the resistance between the electrodes is
measured. To prevent the polarization between the electrodes, measurements are taken
using an alternating current, AC (McCann et al. 1992).
Gypsum block sensors consist of two electrodes encased in a porous block of
gypsum. This block is placed in a medium where the moisture content is to be measured.
The block absorbs moisture from the surrounding media thus making a saturated solution
of calcium sulfate from gypsum. This solution helps in maintaining uniform conductivity
of the medium between the electrodes and makes the electrodes independent of the
variations in conductivity of the surrounding media. Under saturated conditions the
resistance of the sensor is minimum. During drying, the pores of the block are emptied
(larger pores emptied first) making the transmission of electric current progressively

19
difficult and resulting in an increase in sensor resistance (Thomas, 2001). Since the
relationship between the soil moisture content and the measured electrical resistance is
constant irrespective of the media, a single calibration curve is required (Skinner et al.
1997). The gypsum block sensors are low maintenance and low cost pieces of equipment
but they are inaccurate in 0-100 kPa range (McCann et al. 1992). In order to incorporate
these difficulties a granular sensor was developed.
Figure 2-5. Watermark 200 Granular Matrix Sensor (McCann et al. 1992).
McCann et al. (1992) described a granular matrix sensor matrix as a uniformly
distributed sand material, unlike the gypsum block sensors in which the entire porous
matrix is gypsum. Figure 2-5 shows the typical example of a granular matrix sensor.
There are two different sections in the granular matrix sensor shown in Figure 2-5, the
transmission section and the measurement section. The transmission section has holes in

20
it and a permeable synthetic membrane is used to hold the sand material in place. The
measurement section is sealed externally and has the gypsum block to insulate the sensor
from the changes in the external salinity. For measurement to be detected a finite amount
of moisture must traverse the transmission section and enter the measurement section. In
crossing the gypsum block a saturated solution of calcium sulfate is formed and the
electrodes measure the conductivity of this liquid, which is proportional to the soil water
content (McCann et al. 1992). Rosqvist et al. (1997) conducted a study to measure the
moisture content variation in a pilot-scale landfill using gypsum block sensors. Gypsum
block sensors were placed at 36 points located at three depths in the landfill to measure
moisture content throughout waste mass. However no information about calibration was
reported.
2.4.2 Development of Granular Matrix Sensor
Gawande et al. (2003) developed a unique electrical resistance based granular
matrix sensor that would facilitate the measurement of moisture content in MSW
landfills. The present section gives the background work and operating principles of this
technology. This sensor was designed to measure the electrical resistance occurring
between two electrodes embedded in an insoluble granular media. Resistance is inversely
proportional to the electrical conductivity, which can be correlated to moisture content.
When placed in the landfill, moisture from the surrounding waste enters the sensor matrix
through the capillary action provided by the glass fiber wicks attached to the sensor body.
Change in the moisture content of the sensor granular media changes the measured
resistance. The relationship between sensor resistance and the external moisture content
were developed assuming that equilibrium exists between the granular media moisture
content and moisture content of surrounding waste. Supplemental (figure A-3) gives the

21
cross section of this sensor. The sensor body is 20-cm long and 5-cm diameter well
screen made of PVC. Two 1.6-cm thick and 5-cm diameter solid PVC plugs were placed
at the top and bottom of the well screen. Two drainage holes were drilled at the bottom
plug to allow the drainage of moisture from the sensor. The two electrodes in the sensor
comprise of a center electrode, which is 19.6-cm long and placed at the center of the top
plug and wire mesh electrode which is wrapped on the inside of the sensor body.
Granular sand of 1-mm diameter was selected to be the media between the electrodes and
the packing density was 1.65g/cm3. Resistance measurement using this sensor is shown in
the schematic given in figure 2-6. An alternating current AC-half bridge with 1-kΩ
bridge resistor was used to measure the resistance across the sensor electrodes. The AC-
half bridge output x
s
VV
is used to calculate the sensor resistance by the equation below:
−=
XXRRs 11 ; where
x
s
VV
X = (2.3.1)
where Rs is the sensor resistance and R1 is the bridge resistance with an applied excitation
voltage Vx and Vs is the sensor voltage.
Vx VS
R1
Rs
Figure 2-6. Schematic of AC-half bridge circuit

22
Since landfill leachate is highly conductive, the granular media in this sensor did
not contain soluble salt to boost conductivity.
2.4.3 Criteria for Selection of Granular Media Particle Size
Granular media was selected based on the sensitivity, which is defined as the ratio
of the change in the fraction of saturation of the media with change in the electrical
resistance. Gawande et al. (2003) selected granular media of different average particle
sizes and performed experiments to observe the relationship between saturation fraction
and measured resistance and found that the granular media of particle size of 1-mm
provided good fit. Hence a granular media of particle size 1-mm was selected.
2.4.4 Calibration Experiments
Gawande et al. (2003) performed laboratory experiments using a dry synthetic
solid waste and measured the resistance values after wetting the waste by adding known
volumes of moisture to it. The calibration experiments were conducted twice with
conductivity of the added moisture being 4mS/cm and 8mS/cm. Two distinct calibration
curves were reported. The changes in the temperature of the moisture in the granular
matrix and its electrical conductivity were observed to influence the resistance
measurement. Apart from measuring moisture content, this sensor had the ability to
measure temperature and collect the gas sample and was named the MTG sensor
(Gawande et al. 2003).
A total of 138 MTG sensors were installed at an operating bioreactor landfill in
Florida. The field evaluation of these sensors for moisture measurement had been made
in the present study.

23
2.5 Time Domain Reflectometry (TDR)
Time domain reflectometry (TDR) is one of the accepted techniques in measuring
the in situ moisture content of soils (Topp et al. 1988, Dalton and Van Genuchten 1986,
Topp and Davis, 1985, Topp et al. 1980). The application of this technology involves the
use of a finite transmission lines (coaxial or parallel). An electromagnetic pulse is
transmitted through these lines and its reflection is analyzed to obtain the complete
dielectric frequency spectrum. This technology was first applied by Fellner-Feldegg four
decades ago. Li and Zeiss (2001) reported the moisture content measurement for MSW
materials using TDR technology.
2.5.1 Principles of Operation
TDR technology is similar to the concept that the physical characteristic of the
medium in which an electromagnetic signal is emitted can be found by analysis of the
reflection of this signal. In TDR technology, the physical characteristic of the medium
that is analyzed by the propagated electromagnetic wave is the relative permittivity or the
dielectric constant of the medium. TDR theory states that the time for a transmitted
electromagnetic pulse to be reflected is dependent on the relative permittivity or dielectric
constant of the medium (Thomas, 2001). A basic capacitor theory can be used to explain
the concept of relative permittivity. Dalton and Van Genuchten (1986), Topp et al. 1988,
Noborio et al. 1994, Nadler et al. 1991, Li and Zeiss (2001) and Thomas (2001) have
documented the concept of relative permittivity and the TDR theory. The theory
described below is referred from the aforementioned articles.
A capacitor is a device that can be used to store electrical charge (Q) when a
voltage (V) is applied across its terminals. For an air filled parallel plate capacitor, the
equation between the stored charge and the applied voltage is:

24
VCQ 0= (2.5.1)
where CO is the capacitance of the capacitor (the constant relating the charge to the
applied voltage). If an insulating material is placed between the plates of the capacitor the
electric charge generated is seen to increase with the same voltage applied across the
terminals. The parameter used to describe this change of the capacitance of the insulating
medium is the dielectric constant. TDR is able to detect the changes in this constant and
ultimately allows its use in measuring the moisture content. The dielectric constant is
defined in terms of capacitance in the equation given below
εεε
oCCC ==0
'
0 (2.5.2)
where ε’ and ε0 refer to the dielectric constant of the medium and the air, respectively.
The term ε is the relative dielectric constant and is also known as relative permittivity.
The relative permittivity of water is approximately 80 while that of air and soil are
approximately 1 and 2 respectively. It is this large difference in the values of water versus
soil and air that time domain reflectometry ultimately measures to generate a value of
volumetric water content. A concise description of the application of TDR technology
taken from Dalton and Van Genuchten (1986) is given in the following paragraph. Figure
2-7 gives the schematic of a TDR setup given by Dalton (1992).
The TDR instrument consists of a voltage source and a coaxial cable that is
attached to parallel probes at its end. The probes are inserted into the media in which
moisture content is to be determined. The voltage source produces a fast rise step voltage
pulse (V). This voltage pulse propagates through a coaxial cable and part of this voltage
pulse is transmitted (VT) as an electromagnetic wave along the parallel electrodes that are
inserted into the test medium (Topp, 1988).

25
V
VT
VR
Switch
Parallel electrodes
Voltage generator
Air soil interface
Figure 2-7. Schematic illustration of the time domain reflectometry principles showing
the launching of voltage pulse V with the transmitted and reflected components VT and VR.
The voltage source produces a fast rise step voltage pulse (V). This voltage pulse
propagates through a coaxial cable and part of this voltage pulse is transmitted (VT) as an
electromagnetic wave along the parallel electrodes that are inserted into the test medium
(Topp, 1988). If during propagation the electromagnetic wave passes an interface of
changing impedance (when the voltage leaves the coaxial cable and enters the parallel
probes), a portion of the signal is transmitted through the interface and a portion is
reflected. The first change of impedance is at the beginning of the parallel probes when a
portion (VT) is transmitted. At the end of the parallel probes part of the transmitted pulse
(VT) is reflected by the waste (again due to a change of impedance) and is shown as VR.
If the medium is a perfect insulator, the reflected voltage will be of the same intensity as
the transmitted voltage but if the medium is conductive, the reflected electromagnetic
wave will be attenuated. This is shown in Figure 2-8. The attenuation of the reflected
wave has been researched in some studies conducted to determine the effectiveness of the
TDR technology in measuring the electrical conductivity of soil solutions (Dalton et al.

26
1984, Dalton and Van Genuchten 1986, Zegelin et al. 1989, Topp et al. 1988, Bonnell et
al. 1991). The examination of the TDR attenuation is, however, very complex as all of
the reflections between the TDR source and the main reflection of interest have to be
measured (Bonnell et al. 1991). The production and analysis of the TDR waveforms is
discussed in section 2.4.2. The effect of this waveform attenuation on the ability to
determine the moisture content of the medium will be discussed next.
Transmission in nonconductive medium
Note that the transmitted VTand reflected VR are of equal intensity.
Note the attenuation of both the transmitted VT and reflected VR as they pass through the media.
Reflection plane
Transmission in nonconductive medium
Figure 2-8. Schematic representations of the transmitted and reflected voltage pulses in non-conducting and conducting media (Dalton and Van Genuchten. 1986).
Topp et al. (1980) found that the pulse time, which is nothing but the total time
taken for the voltage pulse to be transmitted and reflected, is proportional to the dielectric
constant of the material. This was obtained by equating the pulse velocity equations
derived from electrodynamics and mechanics theory. From electrodynamics the pulse
velocity can be expressed in terms of relative dielectric constant ε and the velocity of
light in free space c as shown in equation 2.5.3 below.

27
εCV = (2.5.3)
From mechanics the pulse velocity is given by:
tLV 2
= (2.5.4)
where L is the length of one of the parallel electrodes and t is the time taken for the pulse
to be transmitted and reflected. The path length of the voltage pulse is twice the length of
the parallel rods as this is the total distance traversed during the transmittal and the
reflection of the signal. Equating 2.5.3 and 2.5.4 and rearranging we may solve for the
dielectric constant as a function of transmittal time:
2
2
=
LCtε (2.5.5)
An empirical equation relating the relative dielectric constant and the volumetric
water content of the soil medium was proposed by Topp et al. 1980. This relation is
shown in equation 2.4.6.
( )10000
043.05.5292530 32 εεεθ +−+−= (2.5.6)
where θ is the soil volumetric water content. The above equation is valid for wetted
media whose liquid has conductance less than 8 mS/cm (Dalton 1992). The conductivity
of the medium will factor in the equation 2.5.6 if the conductivity of the medium exceeds
this value. This is due to the attenuation of both the transmitted and reflected voltage
resulting from the leakage of current occurring as a result of the increase in conductance
of the medium. This is one of the limiting factors for the application of this technology in
landfills as the leachate can achieve high values of electrical conductivity. The
production and analysis of TDR waveforms is given in section 2.5.2.

28
2.5.2 Production and Analysis of TDR Wave Forms
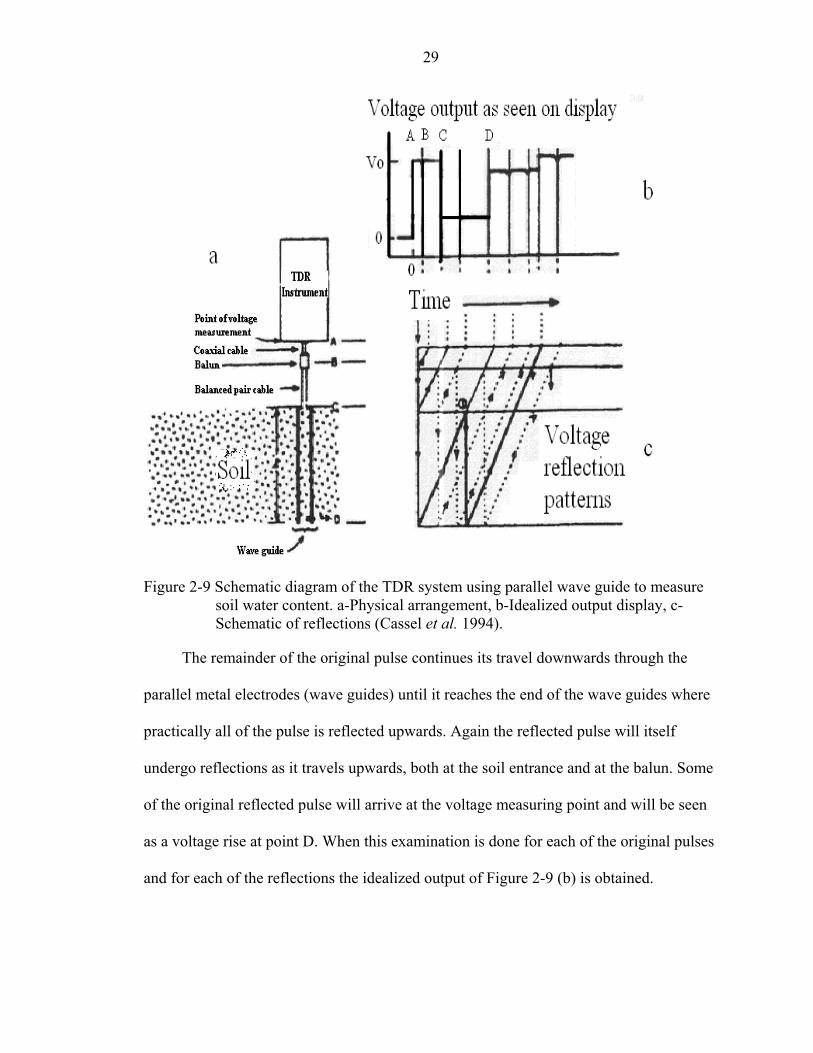
The basic components for the production of a TDR waveform and an idealized
output display are shown in Figure 2-9. These include a cable tester (labeled TDR
instrument in the figure), a balun (balanced-unbalanced) transformer, a shielded balanced
pair transmission line, and two parallel metal rods that serve as a wave guide (Cassel et
al.1994). These rods are inserted into the soil to be tested.
The voltage source that emits the electromagnetic pulse is the TDR instrument
shown in Figure 2-9. As stated earlier, whenever the propagating electromagnetic pulse
encounters a region of changing impedance a portion of the pulse is reflected and a
portion is transmitted. In Figure 2-9(c) the returning reflections are shown arbitrarily at
30o to the vertical to enable them to be related to the time and voltage display. In the
instrumentation the points of changing impedance are labeled B, C, and D. These
correspond to the pulse entering and leaving both the balun and the soil and the end of the
two parallel metal rods (wave guides).
The TDR instrument emits a voltage pulse Vo at point A. As the voltage pulse
travels downward it comes in contact with the balun and encounters a change in
impedance. Due to this change in impedance part of the voltage pulse is reflected
upwards. The small deflection at point B in Figure 2-9(b) represents this reflection. Most
of the pulse travels downward along the shielded balanced pair transmission line until it
encounters the soil at C. Here a large portion of the pulse is reflected upwards. When the
reflected pulse itself encounters the balun on its travel upwards, part of it will be reflected
downwards and the remaining portion will arrive at the voltage measuring device and
will be seen as a drop in voltage as shown by point C in Figure 2 9(b).
29
Figure 2-9 Schematic diagram of the TDR system using parallel wave guide to measure
soil water content. a-Physical arrangement, b-Idealized output display, c-Schematic of reflections (Cassel et al. 1994).
The remainder of the original pulse continues its travel downwards through the
parallel metal electrodes (wave guides) until it reaches the end of the wave guides where
practically all of the pulse is reflected upwards. Again the reflected pulse will itself
undergo reflections as it travels upwards, both at the soil entrance and at the balun. Some
of the original reflected pulse will arrive at the voltage measuring point and will be seen
as a voltage rise at point D. When this examination is done for each of the original pulses
and for each of the reflections the idealized output of Figure 2-9 (b) is obtained.

30
2.5.3 Calibration of TDR Sensors for Moisture Measurement
Li and Zeiss (2001) developed analytical procedures to measure the in situ moisture
content in MSW materials. Similar to Topp et al. (1980), this study aimed at developing
most appropriate calibration equations for the range of solid waste materials. A fourth
degree polynomial equation was chosen to fit the experimental data and the relationship
between relative dielectric constant of the medium and its moisture content is given by
the Equation 2.4.7.
432 εεεεθ edcba ++++= (2.5.7) where θ is the volumetric moisture content and ε is the bulk dielectric constant and a, b,
c, d and e are the parameters to be determined.
The apparent dielectric constant ε of the air-water-solid medium can be given by the
equation 2.4.8
solidwaterair VVV εεεε 321 ++= (2.5.8)
where V1, V2, V3 are the volume ratios of air, water and solid and the ranges of εair, εwater
and εsolid are approximately 1, 3 to 5 and 80 respectively. Hence, small change in the
moisture content would cause a large change in the bulk dielectric constant of the
medium. The following factors were reported to have effects on TDR moisture
measurement technique:
Porosity: It is measured by the ratio of the volume of the voids to the total volume of the
waste. The higher the porosity of the waste material, the higher the value of bulk
dielectric constant as there would be more volume available to hold water (equation
2.5.8).

31
Electrical conductivity: Increase in electrical conductivity of medium increases
the measurement of bulk dielectric constant. Dalton (1992), reported that TDR
overestimates the value of moisture content for conductivities greater that 8mS/cm. In a
landfill, the typical conductivity of leachate varies from 2-18 mS/cm (Reinhart and
Townsend, 1998). Another disadvantage is the TDR signal attenuation in the conductive
medium, as reported by Dalton and Van Genuchten (1986). Li and Zeiss (2001) observed
that by coating the TDR probes with plastic, the signal attenuation could be reduced.
Apart from these, the ferrous metals content in the landfill were also reported to influence
the TDR measurements.
Twelve different probes along with resistance based MTG sensors were installed
at 5 clustered locations at New River Regional Landfill. The probes were initially packed
with MSW material with dry densities as given by table C-1 (appendix-C) and the
equation of the form 2.5.7 was derived. Table C-2 gives the coefficients of equation 2.5.7
for the 12 probes. A comparison will be made in this study between these TDR probes
and MTG sensors for calculating the moisture content at these locations.
2.6 Summary of the Advantages and Disadvantages of each Technology
The summary of the advantages and disadvantages of different moisture
measurement technologies as reported in literature is given in table 2-3. This chapter
gives a brief overview of the existing technologies to determine the in situ moisture
contents. Several innovative techniques are currently being explored that may have
application to bioreactor landfills. Some of them include, gas tracer method, electrical
sounding, electrical 2-D imaging, electromagnetic mapping, and radar profiling. Research
continues to evaluate the use of these techniques at bioreactor landfills.

32
Table 2-3.Advantages and disadvantages of various moisture measurement techniques Moisture measurement
technique Advantages Disadvantges
Capacitance probe
Instantaneous measurement possible with no random error. Instrument is relatively inexpensive.
Exhibits sensitivity to variations in media bulk density and texture. Changes in electrical conductivity and temperature effect the sensor operations.
Neutron probe
Average moisture content over depths can be determined. Sudden or seasonal changes in the soil moisture can be determined. Offers large radius of influence.
Absolute moisture content cannot be determined. Health risks are associates due to radiation hazard. Automation is difficult. Density variations in landfill have effect on moisture content measurement.
Electrical resistance probe
Sensors are relatively inexpensive. Technology is non hazardous. Sensor installation is easy. Automation is possible. Density does not affect readings.
Affected by changes in electrical conductivity and temperature. Inconsistent readings at low moisture contents Results affected by electrical conductivity and porosity of the media. Presence of metals in landfills affects the moisture content measurement.
Time domain reflectometry Automation possible Unaffected by organic content changes Non hazardous and results are repeatable
Results affected by electrical conductivity and porosity of the media. Presence of metals in landfills affects the moisture content measurement.
The next two chapters in this thesis examine two different technologies (Electrical
resistance technology and Time domain Reflectometry technology) for field application
to determine the in situ moisture content in a bioreactor landfill located in north central
Florida.
33
CHAPTER 3 FIELD EVALUATION OF RESISTIVITY SENSORS FOR IN SITU MOISTURE
MEASUREMENT IN A BIOREACTOR LANDFILL
3.1 Introduction and Background
Moisture content plays a vital role in the solid waste biodegradation process and
thus is a key parameter of interest for operators of bioreactor landfills (Rees, 1980;
Pohland, 1980; Reinhart and Townsend, 1997). The ability to measure moisture content
of the landfilled waste would be beneficial to operators as they try to evenly and
efficiently wet the waste. Gravimetric measurement is one method for determining
moisture content that involves the collection of waste samples followed by a laboratory
measurement. This process can be expensive and time consuming and is not a practical
method for routine moisture content determination. An ideal moisture measurement
technique would be one that allows measurement in situ over time as leachate
recirculation progresses. Many in situ moisture measuring devices have been developed
for use in soil systems. These include neutron probes, capacitance probes, time domain
reflectometry sensors (TDR), and resistance-based sensors. Several researchers have
proposed the use of such probes for tracking in situ moisture content in landfills. Holmes
(1984) evaluated neutron probe technology for determining the in situ moisture content of
waste; while it could not predict the absolute value of moisture content, the change in
moisture could be assessed. Yuen et al. (2000) evaluated the use of laboratory calibrated
neutron probes at a full-scale landfill. This study suggested that neutron probe technology
was a practical tool to monitor moisture change in the landfill. A potentially significant
34
disadvantage associated with this technology is the radiation hazard. Li and Zeiss (2001)
developed empirical procedures to measure in situ moisture content of MSW materials
with TDR probes. They found that a fourth degree polynomial equation provided an
excellent fit for the determination of moisture content (θ) from the measured apparent
dielectric constant (Ka). The equation coefficients depended on the material type.
However, the porosity of the waste material and electrical conductivity of the medium
was found to affect the Ka-θ relationship.
Another type of in situ moisture measurement technology is electrical resistance-
based, which was developed more than 40 years ago. Resistivity measurement devices
included traditional gypsum blocks and granular soil matrix resistivity devices. Both
types work on the principal that the moisture content of the medium can be obtained from
the resistance between the pair of electrodes embedded in gypsum or granular soil.
Rosqvist et al. (1997) used gypsum block sensors at thirty-six points and three depths to
measure the moisture content variation in a pilot-scale landfill. Because gypsum block
devices had operational difficulties in the field, granular soil matrix resistivity devices
were developed McCann et al. (1992). Gawande et al. (2003) developed a granular soil
matrix resistance sensor for in situ moisture content measurement in landfills. Tests were
conducted to select the optimum granular media particle size to evaluate sensor
sensitivity and responsiveness, and to assess the effect of liquid temperature and
conductivity on resistance measurement. Calibration curves relating the measured
resistance to gravimetric water content were developed. A thermocouple and 0.25-inch
tubing were attached to this device for measurement of temperature and collection of gas
samples respectively. As this sensor could be used for in situ measurement of moisture,

35
temperature, and gas composition, it was referred to as MTG sensor. A total of 135
sensors have been installed in waste at a bioreactor landfill in North Central Florida. The
paper reports the results from before and after the start of leachate recirculation and
evaluates the effectiveness of the sensor for in situ moisture measurement.
3.2 Methods and Materials
3.2.1 Site Description
The New River Regional Landfill (NRRL) is located in north central Florida, US,
and consists of several distinct landfill cells (see supplemental figure A-1 for a plan view
of the entire site). The area designated for the bioreactor consisted of parts of two cells
covering an area of approximately 10 acres and containing approximately 0.61 million
tons of waste. The bioreactor area is distinguished from the rest of the landfill by the
presence of recirculation devices and an exposed geomembrane cap. Figure 3-1 presents
a plan view of the portion of the landfill site that includes the bioreactor. The area
distinguished as the “bioreactor well field” represents the section where leachate
recirculation was concentrated and this area will be used in upcoming graphical
presentations of the data. Leachate recirculation is performed at the site by means vertical
injection wells. A series of vertical injection well cluster of different depths are
distributed throughout the landfill. The injection wells connect to a leachate recirculation
manifold. The MTG probes were also installed in clusters. Rows of MTG clusters were
installed in between rows of injection clusters. Figure 3-2 provides a detailed view of the
well field including the relative locations of the sensors, the injection wells, and the data
logging station. Injection wells and MTG clusters that are specifically discussed later in
the text have labels provided (see supplemental figure A-2 for a map showing all labeled
clusters). Figure 3-3 presents a cross section of the landfill along section C-C’ (from
36
figure 3-2.). The height of the landfill as seen from this figure is approximately 70 ft.
Leachate recirculation cluster wells are shown. A safety zone of approximately 10 ft was
left from the deepest injection well to the bottom of the landfill where the liner was
placed. Leachate generated from the landfill gravity drains to the saw-tooth liner and is
collected through the extraction pipes. The extraction pipes were 100 ft apart and the
leachate from each extraction pipe flows into a header pipe that drains leachate into a wet
well where it is pumped to storage ponds.
3.2.2 Sensor Description
The resistance-based sensor used in this study works on the principal that the
moisture content of the granular sand matrix between two concentric electrodes can be
related to the resistance between them. A general description of the sensor is presented
here; for a more detailed description, see Gawande et al. (2003) (see supplemental figure
A-3 for schematic cross section of this sensor). The electrode pair comprises a center
electrode made of #6 stainless steel and a surrounding stainless steel wire mesh electrode.
The media between the electrodes is granular sand with a 1-mm grain size. An external
slotted PVC casing surrounds the sensors and the sand matrix. When placed in the
landfill, external moisture enters the granular sand matrix through the slotted PVC pipe
and equilibrium is assumed to exist between the moisture in the granular media and the
surrounding waste. Glass fiber wicks were placed on the sensor body to enhance time to
reach equilibrium (see supplemental figure A-3). An excitation voltage (AC voltage)
applied between the electrodes yields a resistance that depends on the electrical
conductivity and temperature of the liquid in the granular media. Section 3.2.3 gives the
overview of the installation of the MTG sensors.

37
Figure 3-1. Overview plan of the bioreactor

38
Figure 3-2. Plan view of the well field

39
100 ft
10 ft
2 ft thick bottom liner
Boundary of bioreactor area
Safety zone
Landfill Surface
Injection well cluster
2 ft bottom liner
Figure 3-3. Cross section along CC’ of figure 3-2.
3.2.3 Installation of MTG Sensors
A total of 134 vertical injection wells were installed at forty-five different
locations, with most locations consisting of three injection wells at depths averaging 20
ft, 40 ft, and 60 ft. A total of 135 resistance-based MTG sensors were placed at 48
monitoring clusters with depths averaging 15 ft, 30 ft, and 50 ft. Moisture monitoring
clusters were installed in between rows of injection clusters. Safety zone of
approximately 10 ft was left between the liner system and the bottom of the deep wells.
The holes used for sensor placement were excavated using a 4-inch truck-mounted power
flight auger. The sensor was lowered into the borehole by temporarily attaching it to a 2-
inch diameter PVC pipe and lowering the pipe into the newly excavated hole. When the
sensor reached the required depth, the pipe was detached. Sand was added first, followed
by the addition of bentonite pellets. The purpose of the sand was to bridge the gap

40
between the sensor and surrounding waste, while the clay was added to hydraulically
isolate the sensor before backfilling with waste. The locations of the clusters were
presented in plan view previously in Figure 3-2. Figure 3-4 presents a representative
schematic of the relative locations of a MTG cluster to an injection well cluster. It is
noted that 51 waste samples were collected during the installation of the injection wells
and sensors and analyzed for moisture content gravimetrically.
Figure 3-4. Schematic cross section of injection and monitoring clusters
3.2.4 Field Measurements and Field Trials
The injection wells and the MTG clusters were installed over a six week period in
the spring of 2001. The construction of the rest of the bioreactor, which included the
installation of the exposed geomembrane cap and the leachate recirculation piping was
not completed until the fall of 2002. During this time period, the MTG sensor readings

41
were collected manually approximately every two weeks. The sensors were connected to
the datalogger during the spring of 2003. Three Campbell Scientific CR10X data loggers
installed at various locations on the landfill, as shown by Figure 3-2, were programmed to
collect data at a frequency of twice per day. Since the readings did not change
substantially during the period after construction through the start of leachate
recirculation, only the data-logged values are reported in this thesis. For purposes of
discussion and presentation, January 1, 2003 was defined as day 1 of the experiment.
Leachate recirculation began on May 30 2003 (day 150), in injection cluster location at
CG3 (Figure 3-2.). Leachate recirculation continued over the following months in a total
of 29 wells in 10 clusters. The cumulative volumes of leachate injected into each
recirculation well are presented in shown in Table 3-1. The reporting period for this
thesis goes through November 18, 2003 (day 322). A total of 762,326 gallons of leachate
were recirculated through the end of the reporting period. Flow meters were used at each
injection well to measure flow through each well. A flow meter at the head of the
leachate injection header pipe measures the cumulative flow of the leachate pumped from
the storage ponds to the landfill.
3.2.5 Conversion of Resistance to Moisture Content
Gawande et al. (2003) previously presented equations to convert measured
resistance values to moisture content. For the sensors used here, the equations were
determined by measuring the resistance of the sensor, that was inserted into laboratory-
prepared synthetic waste, as a function of measured moisture content, and determining a
best-fit relationship. The equations developed are as follows:
At 4.0 mS/cm: ( )RMC
0142.0exp785.01795.14
−−= (3.1)
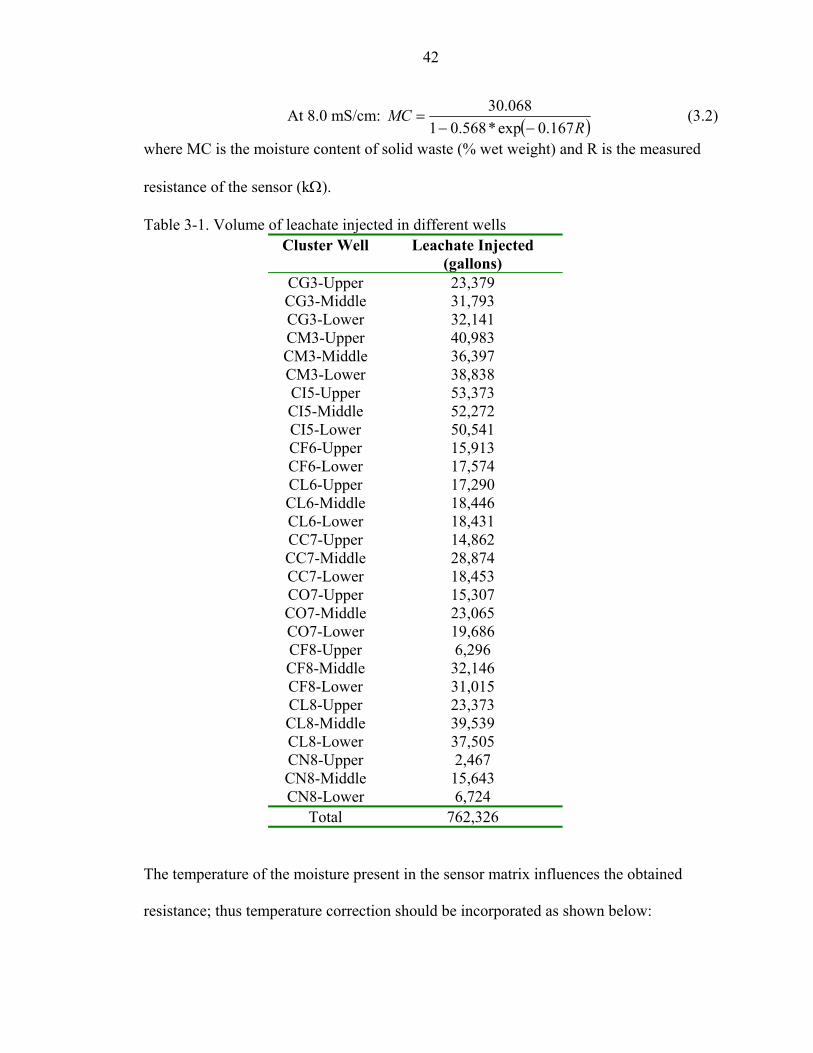
42
At 8.0 mS/cm: ( )RMC
167.0exp*568.01068.30
−−= (3.2)
where MC is the moisture content of solid waste (% wet weight) and R is the measured
resistance of the sensor (kΩ).
Table 3-1. Volume of leachate injected in different wells Cluster Well Leachate Injected
(gallons) CG3-Upper 23,379 CG3-Middle 31,793 CG3-Lower 32,141 CM3-Upper 40,983 CM3-Middle 36,397 CM3-Lower 38,838 CI5-Upper 53,373 CI5-Middle 52,272 CI5-Lower 50,541 CF6-Upper 15,913 CF6-Lower 17,574 CL6-Upper 17,290 CL6-Middle 18,446 CL6-Lower 18,431 CC7-Upper 14,862 CC7-Middle 28,874 CC7-Lower 18,453 CO7-Upper 15,307 CO7-Middle 23,065 CO7-Lower 19,686 CF8-Upper 6,296 CF8-Middle 32,146 CF8-Lower 31,015 CL8-Upper 23,373 CL8-Middle 39,539 CL8-Lower 37,505 CN8-Upper 2,467 CN8-Middle 15,643 CN8-Lower 6,724
Total 762,326
The temperature of the moisture present in the sensor matrix influences the obtained
resistance; thus temperature correction should be incorporated as shown below:

43
( )( )
−+−+
=2502.012502.01
1
221 t
tRR (3.3)
where R1 and R2 are the measured resistance of the sensor at temperatures t1and t2
respectively (See Appendix-D for calibration curve and example calculation for the
conversion to moisture content from measured resistance a known temperature). As the
conductivity of the leachate was known to influence the resistance measured from the
sensor, leachate conductivity measurements routinely made on site were used. Leachate
samples were collected from the manholes on a weekly basis and conductivity was
measured. On one occasion after the start of leachate recirculation, leachate was collected
from the injection wells specifically to measure its conductivity.
3.2.5 Estimation of Spatial Average of the Moisture Content of the Landfill
The resistivity-based moisture sensors were spatially distributed inside the landfill
at depths averaging 15ft, 30ft and 50ft. To provide a graphical representation of changes
in moisture content, distinct moisture contour profiles were computed for each depth. The
bioreactor well field boundary shown in Figure 3-2 was used as the boundary of a control
volume for determining spatial average moisture content of the landfill. A conceptual 3-D
GIS model was used to determine the spatial average. The first step in determining the
spatial average was to distribute the known moisture content values in the landfill into
three identical moisture grids. Arc view GIS 3.2 was used to create the grids with the
known moisture content values obtained from the sensors at each layer by an
interpolation process using an inverse distance algorithm. Then, a series of algebraic
operations were performed on the interpolated layers to create an average grid. Finally,
the mean of the average grid was determined which is the representative spatial average
of the gravimetric moisture content in the control volume of the landfill.

44
3.3 Results and Discussion
3.3.1 Sensor Output and Performance
A total of 135 resistance-based moisture sensors were installed at three different
depths in the landfill. Leachate recirculation started on day 150 and the thesis reports data
collected until day 322. Both the resistance values in kΩ and the temperature values in
degree centigrade were recorded. During the experimental period, 133 out of 135
installed sensors had resistance values ranging from 0.005 kΩ to 466.7 kΩ, which
indicated that these sensors functioned within the output range expected for conditions
within the landfill. The resistance values measured from the remaining two sensors
indicated that these sensors had failed (they measured 6999 kΩ). Resistance
measurements from the period prior to leachate recirculation ranged from a minimum
resistivity of 0.005kΩ (indicative of wet conditions) to a maximum resistivity of 466.7
kΩ (indicative of dry conditions). The temperature obtained from the MTG sensors
ranged from 26.9 to 57.6 oC with the average temperature of 48.6oC. The optimum
temperature for anaerobic waste decomposition reported in the literature is in the range of
34 to 38oC (Mata Alvarez and Martina-Verdure, 1986), but temperatures as high as 55oC
occur in large landfills. In general, the temperatures in deeper levels in the landfill were
greater than temperatures at upper levels closer to the surface (see Appendix-B for the
temperature data). The waste placed in deeper levels was older and more compacted than
upper levels; it was thus more insulated from ambient temperatures and was likely more
biologically active. Gawande et al. (2003) reported that a resistance value of 0.05 kΩ or
less indicates saturated conditions. The pre-leachate recirculation baseline data found 18
sensors to have measured resistivity values less than 0.05 kΩ, indicating that the granular

45
media in these sensors was saturated before recirculation. There were no changes in the
resistivity of these 18 sensors even after the start of recirculation. Half of them are
located at the west corner of the landfill and the temperature range at these sensors was
50-55oC. Sixty other sensors responded to a passing moisture front after recirculation
during the course of this study.
Figures 3-5 and 3-6 present the typical response of the sensors to leachate
recirculation. The figures show both the changes in resistance and temperature. Leachate
recirculation started on day 150. The three distinct curves in Figures 3-6 and 3-7
correspond to the sensors located at three different levels present at the monitoring
clusters L6W and M3E (see Figure 3-2). A noticeable decline in the resistance is
observed, apparently as a result of the leachate recirculation activity. As stated before, in
certain areas of the landfill where the background resistance was lower than 0.05 kΩ,
sensors did not show any appreciable change in resistance with leachate recirculation (see
supplemental figures given in Appendix-B for the response from all sensors). In general,
temperatures also showed a slight response, most noticeably for wells that were not as
wet to begin with. The deeper wells that were already wetted and had higher temperatures
did not show dramatic temperature variations. When leachate recirculation was
temporarily stopped, the resistance and temperature measurements from the sensors
gradually increased, thus indicating the drainage of moisture from the sensor granular
media.
3.3.2 Estimation of Moisture Content
As described previously, equations were developed to convert the resistivity
readings to moisture content. The two parameters impacting this conversion were

46
100 150 200 250 300 3500.001
0.01
0.1
1
10
100
1000
L6W-LowerL6W-UpperL6W-Middle
100 150 200 250 300 35030
35
40
45
50
55
60
L6W-UpperL6W-LowerL6W-Middle
Days
Tem
pera
ture
(Deg
C)
Days
Res
ista
nce
(KO
HM
S)
Start of Leachate Recirculation
Start of Leachate Recirculation
Figure 3-5. Response of resistivity sensors at cluster L6W to leachate recirculation (Day
1 = 01/01/2003)

47
100 150 200 250 3000.001
0.01
0.1
1
10
100
1000
M3E-LowerM3E-Middle M3E-Upper
100 150 200 250 30030
35
40
45
50
55
60
M3E-LowerM3E-Middle M3E-Upper
Days
Tem
pera
ture
(Deg
C)
Days
Res
ista
nce
(KO
HM
S)
Start of Leachate Recirculation
Start of Leachate Recirculation
Figure 3-6. Response of resistivity sensors at cluster MM3E to leachate recirculation
(Day 1 = 01/01/2003)

48
temperature and electrical conductance of leachate. Since the sensors also recorded the
temperatures, their impact was addressed using equation 3.3. Leachate conductivity, on
the other hand, could not be measured directly for each location. Leachate conductivity
was routinely measured at the site and the values ranged from 2.5 mS/cm to 25.5 mS/cm.
The average conductivity of leachate at NRRL for a time period of 16 months (measured
from the weekly samples that were collected from manholes) was 11.8 mS/cm. The
average conductivity of leachate sampled from 10 injection wells at the northwest corner
of the landfill was observed to be 27.7mS/cm. The nearest leachate collection manholes
from these sampled locations were manholes 3 and 4. The leachate collected from
manholes 3 and 4 had higher average conductivities than leachate from other manholes.
Table 3-2 gives the average measured conductivities from different manholes as well as
from the injection wells.
Table 3-2. Average conductivity measured at NRRL Sampling Location Conductivity (mS/cm)
Manhole 1 7.58 Manhole 2 8.75 Manhole 3 21.62 Manhole 4 20.24 Manhole 5 15.29 Manhole 6 9.89 CF2-upper 27.9 CF2-middle 27.9 CH2-lower 28.2 CH2-middle 30.4 CE3-middle 20.3 CG3-lower 26.4 CG3-middle 5.35 CI3-upper 29.7 CF4-lower 20.3 CH4-upper 46.9

49
Figure 3-7 presents the predicted moisture content over time for cluster M3E (the
resistivity values for this sensor were presented in figure 3-6). The deep sensor was wet
to begin with, with a predicted moisture content of 69 %. The upper and the middle
sensors started lower, in the range of 34 % to 36 % and increased to approximately 69%
after leachate recirculation was initiated.
100 150 200 250 30030
40
50
60
70
M3E-LowerM3E-MiddleM3E-Upper
Days
% M
C
Start of Leachate Recirculation
Figure 3-7. Calculated moisture content from cluster MM3E
The spatial average moisture content was calculated using the method described
earlier (see section 3.2.5). The initial average moisture content (Day 150) was calculated
to be 42% and the final average moisture content (Day 319) was calculated to be 48% by
weight. The typical range of initial moisture content in the landfills has been observed to
be 15-35 % by weight and reported values of field capacity of MSW are 55-70 % by
weight (Remsen et al. 1968, Wigh, 1979, Walsh and Kinman, 1982 Bengtsson et al.
1994, Gawande et al 2003). The initial gravimetric moisture content measured from the
51 samples analyzed was 23%. The pre-recirculated values obtained using the resistance

50
probes were thus greater than expected from the literature and the field analysis. A total
of 762, 300 gallons of leachate were recirculated from day 150 to day 322. The predicted
value of the moisture content based on this recirculated volume (initial gravimetric plus
that added by recirculation) was calculated to be 24% (see Appendix-E for the
calculation). This was observed to be lower that the predicted final moisture content
(48%) using the spatial interpolation. The background data from the sensors suggested
that there were a few locally saturated areas in the landfill and the number of these locally
saturated zones increased with recirculation. The final spatial average of moisture content
was calculated using the moisture contents obtained from the sensors after start of
leachate recirculation. Since some sensors in the landfill were already saturated (before
leachate recirculation), and few more sensors got wet in the course of recirculation, the
calculation of a spatial average from these values could lead to an over estimation.
Three distinct moisture contours were plotted with the obtained moisture values
from the sensors corresponding to the three levels. Figure 3-8 shows these moisture
contours, with the darker zones indicating the higher moisture contents. Again, moisture
content was determined using the 8.0 ms/cm conversion. As shown in the figure, the
background data before recirculation shows the deeper areas in the landfill with the
higher initial moisture contents. After the start of recirculation, the moisture contours of
the middle and upper levels became darker indicating the inflow of moisture to these
areas.
3.3.3 Assessment of Sensor for Monitoring Leachate Recirculation
The data presented in this paper represent only the beginning phases of leachate
recirculation at the site; leachate recirculation should continue several more years in the
area. A complete evaluation of the utility of these sensors for tracking moisture flow in

51
bioreactor landfill therefore is beyond the scope of this work. Some initial observations,
however can be made. To illustrate the response of sensors surrounding an injection well,
one specific area is examined in detail. Figure 3-9 provides a plan view of the area
surrounding the injection cluster CM3 including the surrounding monitoring clusters. A
total of 116,218 gallons of leachate was injected through the three injection wells in this
cluster. The cumulative volume of leachate recirculated through the wells is presented in
Figure 3-10. Figures 3-11 show the changes in the moisture content of the MTG sensors
surrounding this injection cluster. As a result of leachate injection, the moisture content is
observed to increase as shown by Figure 3-11. The cumulative leachate flow shown by
Figure 3-10 is constant from days 217 to 251 indicating that there was no leachate
pumped through the injection cluster in this time. The moisture levels dropped during this
period indicating the drainage of water from the sensor media. This drying cycle is
clearly seen in Figures 3-11. The typical time of travel for the moisture to reach the
sensors depended upon the relative location of the sensor to the injection well. The time
taken to reach the nearest sensor from injection cluster was 2-3 days (see relative location
of M3E or M3W from CM3 in Figure 3-9). In general, the deeper sensors first
encountered the injected leachate (see table given in Appendix-E for time of travel for the
moisture to reach the sensors).
3.3.4 Conclusions
The field evaluation of electrical resistance based sensors for in situ moisture
content determination in a bioreactor landfill was studied. A total of 135 electrical
resistance-based MTG sensors were installed in the landfill for moisture content
determination of the landfilled waste. Moisture contents were measured before and after

52
Figure 3-8. Moisture contours at different levels
15’
30’
50’
Day 304
Day 272Day 150
Lower moisture
Higher moisture
30
40
50
60
65
66
67
68.5 69.25 69.625 70

53
Figure 3-9 Monitoring wells surrounding injection cluster CM3
200 220 240 260 280 300
10000
20000
30000
40000
50000
LOWER UPPER MIDDLE
Days
Cum
ulat
ive
Vol
ume
Rec
ircu
late
d (g
allo
ns)
Figure 3-10. Cumulative volume of leachate injected through CM3

54
140 160 180 200 220 240 260 280 30030
40
50
60
70
MO5-LowerMO5-MiddleMO5-Upper
Days
% M
C
Start of Leachate Recirculation
100 150 200 250 30030
40
50
60
70
ML3-LowerML3-Upper
Days
% M
C
Start of Leachate Recirculation
100 150 200 250 30030
40
50
60
70
M3W-LowerM3W-MiddleM3W-Upper
Days
% M
C
Start of Leachate Recirculation
100 150 200 250 300
30
40
50
60
70
ML4-LowerML4-MiddleML4-Upper
Days
% M
C
Start of Leachate Recirculation
100 150 200 250 30030
40
50
60
70
M3E-LowerM3E-MiddleM3E-Upper
Days
% M
C
Start of Leachate Recirculation
Figure 3-11. Response of monitoring clusters surrounding CM3. (A) M3E (B) M3W (C)
ML3 (D) ML4 (E) MO5

55
leachate recirculation. It was observed that 98% of sensors worked initial moisture
content measurements found that some areas of the landfill were wet as indicated by
resistance values of less than 0.05 kΩ. The initial moisture content of the landfill
estimated from the sensors was 42%, which was higher than the values reported in the
literature and the values obtained from collected waste samples. Sixty sensors showed
response to leachate recirculation. The Spatial average moisture content after 762,300
gallons of leachate recirculated was observed to be 48%. This was higher than the
expected average moisture content based on the amount of leachate recirculated.
The resistance-based MTG sensors show the potential moisture levels in bioreactor
landfills. The sensors were able to track the changes in the moisture contents and detect
the wetting and drying cycles on field. The magnitude of the moisture contents measured,
however, appear to overestimate the true conditions. An estimate of electrical
conductivity of the leachate could yield more accurate results. The calibration equation
developed for the 8.0 mS/cm leachate was used for the conversions in this thesis. Based
on the measured landfill leachate conductivities which were greater than 8 mS/cm, the
sensors likely over-predict absolute moisture content values. Future work should involve
continuous monitoring of the data from the sensors and should consider calibrating the
sensors for electrical conductivities greater than 8mS/cm. The ability of MTG sensors to
measure various in situ parameters, its low manufacturing costs, and the convenience in
automating the data collection process make it an attractive prospect for its potential use
in the bioreactor landfills.

56
CHAPTER 4 COMPARISON OF RESISTIVITY AND TIME DOMAIN REFLECTOMETRY
SENSORS FOR ASSESSING MOISTURE CONTENT IN BIOREACTOR LANDFILLS
4.1 Introduction
Landfill bioreactors are designed and operated to enhance the biodegradation
process by increasing moisture levels within the landfill (Pohland, 1975; Rees, 1980;
Reinhart and Townsend, 1997). Moisture levels in a bioreactor landfill can be increased
by adding water or by recirculating the leachate extracted from the landfill. However, it is
a challenge to understand the distribution of recirculated moisture in a landfill because of
the extreme heterogeneity of the landfilled waste. Gravimetric moisture content can be
measured by collecting a waste sample through excavating the waste. This method is not
usually feasible for collection of routine samples. A measure of in situ moisture content
would provide landfill operators very valuable information about the effectiveness of
their leachate recirculation systems. The installation of in situ moisture measuring
devices in landfills may be feasible since they are commonly applied to soil systems.
Several previous studies (Holmes 1984, Rosqvist et al. 1997, Yuen et al. 2000) have
evaluated instrumentation for measuring moisture content in landfilled waste. Two of the
most common devices for measuring in situ moisture content are time domain
reflectometry (TDR) probes and resistance-based moisture sensors.
Time domain reflectometry (TDR) works on the principal that a change in the in
situ moisture content can be determined by analyzing the changes in the reflected
electromagnetic waveform that is emitted by the TDR source. The resistivity sensors

57
calculate the electrical resistance of the moisture present in the granular media between
the two concentric electrodes. Increase in the moisture surrounding the waste would
increase the moisture content in the granular media, resulting in the decrease of the
electrical resistance between the electrodes. Resistivity based MTG sensors developed by
Gawande et al. (2003) and modified TDR probes developed with the help of Zircon Inc
were installed on a side-by-side basis at selected locations in a full scale operating
bioreactor landfill in north central Florida. The objective of this study is to make a
comparison of the moisture contents from the resistivity and TDR sensors installed at
these locations.
4.2 Background
Historically, in situ moisture measurement devices have been used to measure the
moisture content of soils for irrigation. These technologies can also be applied to
landfilled solid waste but this application does pose certain challenges, the most common
being the heterogeneous nature of the waste materials. Previous studies reported time
domain reflectometry, neutron probe technology, electrical resistance technology to have
varying degrees of success when applied to monitor in situ moisture contents in landfills
(Holmes 1984, Rosqvist et al. 1997, Yuen et al. 2000). TDR and resistivity technologies
were used in the study reported in this paper and are thus discussed in greater detail.
4.2.1 Time Domain Reflectometry (TDR)
TDR relies on the concept that the physical characteristics of a medium in which an
electromagnetic signal is emitted can be related to the signals reflection. In TDR
technology, the physical characteristic that is analyzed by a propagated electromagnetic
wave is the relative permittivity or the dielectric constant of the medium. Topp et al.
(1980) first used TDR technology for measurement of moisture content of soils. They

58
found that the total time taken for the transmitted electromagnetic pulse to get reflected
was dependent on the relative permittivity or dielectric constant of the medium. The
calculated moisture content and the observed dielectric constant followed a fourth degree
polynomial approximation. Li and Zeiss (2001) studied the relationship between the
moisture content and the bulk dielectric constant of various solid waste materials. They
performed series of laboratory experiments with different waste materials and mixtures
with varying conductivities. Similar to Topp et al. (1980), a fourth degree polynomial
provided a satisfactory fit for the determination of moisture content of the solid waste
from the measured apparent dielectric constant. The coefficients of the equation
depended on material type. Some of the advantages of TDR technology are that it is non-
hazardous, when used on field are it has the ability to reproduce the results and is inert to
organic carbon content changes.
4.2.2 Electrical Resistance Technology
The moisture content of the medium can be estimated from the electrical resistance
measured between the electrodes inserted in it. Two types of electrical resistance sensors
that have been used to estimate soil moisture content are gypsum block and granular
matrix sensors. A typical gypsum block sensor consists of electrodes embedded in a
gypsum block and the blocks are installed in the soil for which moisture content is to be
determined. When the soils are wet, the external moisture enters the gypsum block and a
soluble calcium sulfate solution is formed as the uniformly conductive media between the
electrodes and the resistance is measured between them. Gypsum block sensors had some
operational difficulties on field such as their inability to show the transient wetting and
drying cycles and to address these operational difficulties, McCann et al. (1992)
developed a granular matrix sensor. A granular matrix sensor consists of a uniformly

59
distributed material, for e.g. sand that serves as the media between the two electrodes.
Gawande et al. (2003) developed a granular soil matrix resistance sensor for in situ
moisture content measurement in landfill. Tests were conducted to select the optimum
granular media particle size, evaluation of sensor sensitivity, responsiveness and
assessment of the effect of liquid temperature and conductivity on resistance
measurement. Calibration curves relating the measured resistance to gravimetric water
content developed by Gawande et al. (2003) will be used in this study. The field-
evaluation of this sensor for in situ moisture content measurement in a bioreactor landfill
is reported in chapter 3. The positive aspects of using resistance-based sensors are the
cheaper manufacturing and installation costs and the ability to collect and store the data
automatically.
4.3 Methods
Two different types of sensors (TDR probes and resistance-based sensors) were
installed in the landfill on a side-by-side basis. The experimental methods focus on
measuring the surrounding waste moisture content using both sensor types, and
comparing the two different technologies.
4.3.1 TDR Sensors
TDR probes used in this study were laboratory calibrated and obtained from the
manufacturer (Zircon Inc). The manufacturer used Campbell Scientific TDR probes for
the calibration experiments. All the information regarding the probe type, its geometry
can be found in the Campbell Scientific instruction manual (TDR 100 instruction manual,
2002). The components of TDR included the pulse generator, a coaxial cable and the
parallel probes. The pulse generator generates voltage pulse (250 mV) that is propagated
through a coaxial cable and is transmitted through parallel probes located at its end. The

60
propagating voltage pulse will encounter a change in impedance, when it leaves the cable
and enter the probes and this results in the reflection of the voltage pulse to the cable
tester. The reflected energy is observed as a waveform that is used to calculate the
reflection travel time of the voltage pulse. The dielectric constant of the medium can be
found by using the reflection travel time and known length of the probes with the
equation given below,
2
2
∆
=Ltcε (4.1)
where ε is the unknown bulk dielectric constant to be calculated and c is the velocity of
electromagnetic signal in free space and ∆t is reflection travel time as measured from the
waveform and L is the known length of the probes.
The figure in (Appendix-F) shows the schematic of the waveform and Figure 4-1 is
an example of the actual waveform observed from one of the TDR sensors in NRRL. The
first discontinuity in Figure 4-1 is observed when the propagating voltage pulse leaves
the coaxial cable and enters the parallel probes and the second discontinuity is due to the
reflection from the end of the parallel probes. The difference in the travel times is shown
in the form of apparent length displayed on screen as shown by Figure 4-1. Equation 4.1
can be modified in the form of apparent length of the waveform observed on screen and
given by equation 4.2,
2
=LaL
ε (4.2)
where La is the apparent length measured on the screen. The relationship between the
bulk dielectric constant to the moisture content as described by Li and Zeiss (2001) was
used in this study. This is given by equation 4.3,

61
432 εεεεθ edcba ++++= (4.3) where θ is the volumetric water content and ε is the bulk dielectric constant. The
coefficients of the equation 4.3 depend on the solid waste material type, the porosity of
the material and the electrical conductivity of the liquid.
Figure 4-1. Observed TDR waveform from sensor at bioreactor landfill in north central
Florida
As shown by Figure 4-1, the distance L1 interprets the difference between the time
taken for the voltage pulse to enter the wave-guide and exit it and L is the total waveform
length. The selection of the total waveform length depends on the length of the probes.
The apparent length as given by TDR 100 manual calculations are shown below 4.4,
Apparent length
=
p
pa ActualV
SelectedVmL
LL 10*1 (4.4)
where Vp is the cable propagation velocity and depends on the dielectric constant of
the insulating material between the coaxial cable center conductor and the outer shield
and L1 is the length of the measured waveform and L is the total length of the screen as
shown by Figure 4-1. More details regarding the cable propagation velocity can be found
0.2
0.1
0
0.1
0.2
0.3
0.4
0.5
0.6
0.7
55 65 5957 61 63
L1
L

62
in Campbell Scientific TDR instruction manual. The selected Vp and the actual Vp in this
case are 1.0 and 0.99 respectively. A probe offset factor occurred due to the presence of
probe head that binds the probe rods to the coaxial cable must be included while
calculating the apparent length. Campbell Scientific suggests a value of 0.08 for the
apparent length correction due to the presence of probe head and the equation for
correction is given below:
)(08.0)( factoroffsetprobeLcorrectedL aa −= (4.5) The bulk dielectric constant of the medium can be found by combining equations
4.2 and 4.4 and 4.5. The calibration equation to convert the obtained bulk dielectric
constant to water content of the waste media surrounding the TDR probes is given by 4.3.
The coefficients of this equation depend on the composition of the waste surrounding the
probes and its density. Each probe has been independently packed with the waste that
was excavated from the landfill and calibrated by the vendor to get the coefficients of
equation 4.3. The densities of the excavated waste surrounding each probe and the
corresponding calibration equation coefficients are given in (appendix-C). A total of
twelve each of TDR probes along with the excavated waste surrounding them and
electrical resistance-based MTG sensors were installed at specific locations in an
operating bioreactor landfill in north central Florida. A comparison of moisture content
obtained from both MTG and TDR sensors will be made in this study. Note that equation
4-3 calculates the volumetric moisture content (see supplemental figure in Appendix-F
for the calibration curve), for comparison purposes a conversion is made from volumetric
moisture content to gravimetric moisture content using the dry densities of the waste
surrounding each TDR probe (see Appendix-C for values of dry densities) and is given
by equation 4.6

63
+
=θρρ
θρ
wd
wMC (4.6)
where θ and MC are the volumetric and gravimetric moisture contents of waste and ρd is
the dry density of the waste surrounding the probe and ρw is the density of the water.
4.3.2. Resistance-Based Sensors
Gawande et al. (2003) developed a resistance-based moisture sensor that would
facilitate the in situ measurement of moisture content, temperature and gas composition.
This resistivity sensor was designed to measure the electrical resistance of the moisture
present in the granular media between two electrodes. Increase in the moisture content of
the granular media results in decrease in the observed resistance. This sensor was named
MTG as it has the ability to measure the in situ moisture content, temperature and gas
composition. Details pertaining to the field evaluation of MTG sensors are reported in
chapter 3. The calibration equations for the conversion of measured resistance at certain
temperature to moisture content were given by 4.7-4.9 (an example calculation is shown
in appendix-D),
At 4.0 mS/cm: ( )RMC
0142.0exp785.01795.14
−−= (4.7)
At 8.0 mS/cm: ( )RMC
167.0exp1068.30
−−= (4.8)
where MC is the moisture content of solid waste (% wet weight) and R is the measured
resistance from the sensor (kΩ). Temperature correction equation is given below by
equation 4.9,
( )( )
−+−+
=2502.012502.01
1
221 t
tRR (4.9)
where R1 and R2 are the resistance measured at temperatures t1 and t2 respectively.

64
4.3.4 Site Description
The New River Regional Landfill (NRRL) is located in north central Florida, US,
and consists of several distinct landfill cells (see supplemental figure A-1 for a plan view
of the entire site). The area designated for the bioreactor consisted of parts of two cells
covering an area of approximately 10 acres and containing approximately 0.61 million
tons of waste. The bioreactor area is distinguished from the rest of the landfill by the
presence of recirculation devices and an exposed geomembrane cap. Figure 4-2 presents
a plan view of the portion of the landfill site that includes the bioreactor. The area
distinguished as the “bioreactor well field” represents the section where leachate
recirculation was concentrated. The area where both TDR and MTG sensors have been
installed together is marked as “MTG and TDR sensor locations” and this area will be
concentrated in upcoming graphical presentations of the data. Leachate recirculation is
performed at the site by means vertical injection wells. A series of vertical injection well
cluster of different depths are distributed throughout the landfill. The injection wells
connect to a leachate recirculation manifold. Figure 4-3 provides a detailed view of the
MTG and TDR sensor locations and the relative locations of the injection wells. The five
different places on the landfill, where both the types of sensors were installed are
indicated as clusters A through E in this figure. Injection wells and the sensors that are
discussed later in the text have labels provided (see supplemental figure A-2 for a map
showing all labeled clusters). Clusters A, B and E have four (two MTG and two TDR)
sensors located side-by-side in the same hole, and clusters C and D have six (three MTG
and three TDR sensors) located in different holes next to each other, at approximately
same depths.

65
Figure 4-2. Plan view of the bioreactor

66
Figure 4-3. Plan view of the MTG and TDR sensor locations
4.3.4 Installation of Sensors
A total of 24 (12 TDR and 12 MTG) moisture content measuring sensors were
installed at five different cluster locations on the landfill. Modified CS610 TDR probes
were used in this study. A hole was drilled into the waste using a 4-inch truck-mounted
power flight auger and a 4-inch PVC pipe was placed in the hole. TDR probes were
67
dropped down until they reached required depth, adjacent to this probe, a MTG sensor
was placed. Sand was added first followed by bentonite pellets. The purpose of the sand
was to bridge the gap between the sensors and surrounding waste, while the clay was
added to hydraulically isolate the sensors before backfilling with waste. The locations of
the clusters were presented in plan view previously in Figure 4-3. Figure 4-4 presents a
representative schematic of the relative locations of a MTG sensor and TDR sensors.
Only clusters D and E are shown, the remaining clusters A, B have similar configuration
as cluster E and C has similar configuration as cluster D. Note that the depths of sensors
installed in each cluster were exactly not the same. Cluster-E was chosen to represent an
example of both MTG and TDR sensors located in the same hole and cluster-D to
represent an example of sensors in adjacent holes.
4.3.5 Field Measurements and Trials
The injection wells, the MTG and TDR sensors were installed over a six-week
period in the spring of 2001. The construction of the rest of the bioreactor, which
included the installation of the exposed geomembrane cap and the leachate recirculation
piping was not completed until the fall of 2002. The TDR data collection started from
spring of 2003. A TDR 100 instrument was taken manually to each TDR location. A step
voltage was applied by this instrument and the reflected voltage is captured as a
waveform on laptop screen. The waveforms were obtained from each sensor and were
stored at a frequency of at least once a week. The details of data collection of MTG
sensors were given in chapter 3. Three Campbell Scientific CR10X data loggers installed
at various locations on the landfill, as shown by Figure 3-2, were programmed to collect
data from MTG locations at a frequency of twice a day. For purposes of discussion and
presentation, January 1, 2003 was defined as day 1 of the experiment. Leachate

68
recirculation first started on day 150. Injection clusters CI5 and CF6 were used to
recirculate leachate in the area where both the TDR and MTG sensors were installed as
shown by Figure 4-3. A total of 33,487 gallons of leachate were injected in cluster CF6
from day 203 to 217 and 156,186 gallons of leachate were pumped through CI5 from day
218 to day 322, which is the end of the reporting period for this thesis.
Figure 4-4 Schematic cross section of cluster E (sensors placed in same hole) and cluster
D (sensors placed in different holes)

69
4.4 Results and Discussion
4.4.1 Discussion of Performance of TDR and MTG Sensors
A total of twenty-four sensors, twelve each of the TDR and the resistance-based
MTG sensors were installed at a particular area in the landfill as shown by Figure 4-2.
The background data were collected from January 2003. The data collection continued
after recirculating leachate until November 18, 2003. The typical output of the TDR
probes was the reflected voltage, and was recorded as a waveform. The waveforms were
used to calculate the apparent dielectric constant of the surrounding waste media. The
output of the MTG sensors was the resistance of the granular media in kΩ and the
temperature in degree centigrade (0C). The background data suggested that all twelve of
the installed resistance-based sensors were functional, but only 9 of the twelve TDR
sensors were able to generate a waveform. The reason for the apparent malfunction of the
3 sensors was thought to be damage to the probes during installation. Initial conditions
showed that the minimum and maximum measured resistivity and temperature readings
from the MTG sensors were 0.44 kΩ, 18.87 kΩ and 31oC and 51.5oC respectively. The
ranges of temperatures measured in this study were similar to typically observed
temperatures in landfills. The minimum and maximum values of the relative dielectric
constants calculated from the waveforms obtained from the TDR sensors were 5.5 and
25.5 (Appendix-C).
Out of the nine locations where the TDR and resistance-based sensors both
functioned, four TDR sensors and five resistance based sensors responded to the leachate
recirculation through day 322. Figure 4-5 gives the typical response of both the types of
sensors to leachate recirculation. Figure 4-5(a) shows the typical response of the TDR

70
probe before and after recirculation. An increase in apparent length of the waveform (as
indicated by La in the figure) means an increase in the relative dielectric constant of the
medium, which indicates the increase in the moisture content of the medium (Equation
4.3 and Appendix-C). Figure 4-5 (a) clearly shows the increase in the apparent length of
the waveform with recirculation. Figure 4-5(b) shows a sharp decline in resistance
between the electrodes, which indicates the increase in the moisture content of the media
surrounding this sensor.
4.4.2 Estimation of Moisture Content
The interpretation of the TDR waveform is explained in section 4.3.1. Equations
4.2-5 were used to obtain the moisture content from the collected waveform. The
moisture content predicted by the MTG sensors was obtained by converting the resistance
of the sensor at a particular temperature exposed to leachate at a particular conductivity to
the moisture content of the surrounding waste using equations 4.7-9. Moisture content
measurements using both MTG and TDR sensors are influenced by conductivity of
leachate The average conductivity of leachate present in this area of the landfill as
collected from manhole for a period of 16 months was found to be 15.29mS/cm. TDR
probes used in this study were coated with plastic. Li and Zeiss (2001) mentioned that
coating the probes could reduce the attenuation of the electromagnetic signal that is
caused by increase in the electrical conductivity. The calibration equation developed for
the 8.0 mS/cm leachate (Equation 4-8) was used for the conversion of obtained MTG
sensor resistance to moisture content. Based on the measured landfill leachate
conductivities, the MTG sensors will likely over-predict the absolute moisture contents.
Figure 4-6 shows the changes in the moisture contents with time as shown by both the
TDR and MTG sensors located at Cluster-E of Figure 4-3. Note that the sensors at this

71
cluster are adjacent to each other and placed in a same hole. As shown by this figure,
before recirculation the moisture contents of the sensor were observed to be 35-45 %.
Apparent length on screen
Ref
lect
ion
Coe
ffic
ient
-0.4
-0.2
0.0
0.2
0.4
Pre wetting (Day 146)Post wetting (Day 276)
A
150 200 250 3000.001
0.01
0.1
1
10
100
1000
MI5-Middle
Days
Res
ista
nce
(KO
HM
S)
B
Figure 4-5. Response of sensors to leachate recirculation. A) TDR B) MTG

72
However, after the start of recirculation, the moisture content from the sensors went up to
68 %. It can be seen that there was a simultaneous increase in the obtained moisture
contents from both the sensors. This is expected as the sensors are next to each other. As
the recirculation continued in CI5 until day 322 (the last day of reported data) there was
no decrease in the moisture around the sensors.
Days 150 200 250 300
(%) G
ravi
met
ric
Moi
stur
e C
onte
nt
20
30
40
50
60
70
80
TDR 11MI5-Middle
Start of leachate recirculation
Figure 4-6. Change in moisture content of TDR and MTG sensor
4.4.3 Assessment of TDR and MTG Sensors for Leachate Recirculation
The injection clusters CI5 and CF6 were primarily used to wet the area surrounding
the TDR and MTG probes as shown in Figure 4-3. A total of 189,673 gallons of leachate
was injected through these clusters. The cumulative flow distributions through the
different injection wells at these clusters are given in Figures 4-7 and 4-8. The response

73
of the MTG and TDR sensors to the leachate recirculation is shown in Figure 4-9 and 4-
10.
240 250 260 270 280 290 300
10000
20000
30000
40000
50000
LOWERMIDDLEUPPER
Days
Cum
ulat
ive
Vol
ume
Rec
ircu
late
d (G
allo
ns)
Figure 4-7. Cumulative volume of leachate injected through CI5
204 206 208 210 212 214 216
2000
4000
6000
8000
10000
12000
14000
16000
18000
LOWERUPPER
Days
Cum
ulat
ive
Vol
ume
Rec
ircu
late
d (G
allo
ns)
Figure 4-8. Cumulative volume of leachate injected through CF6
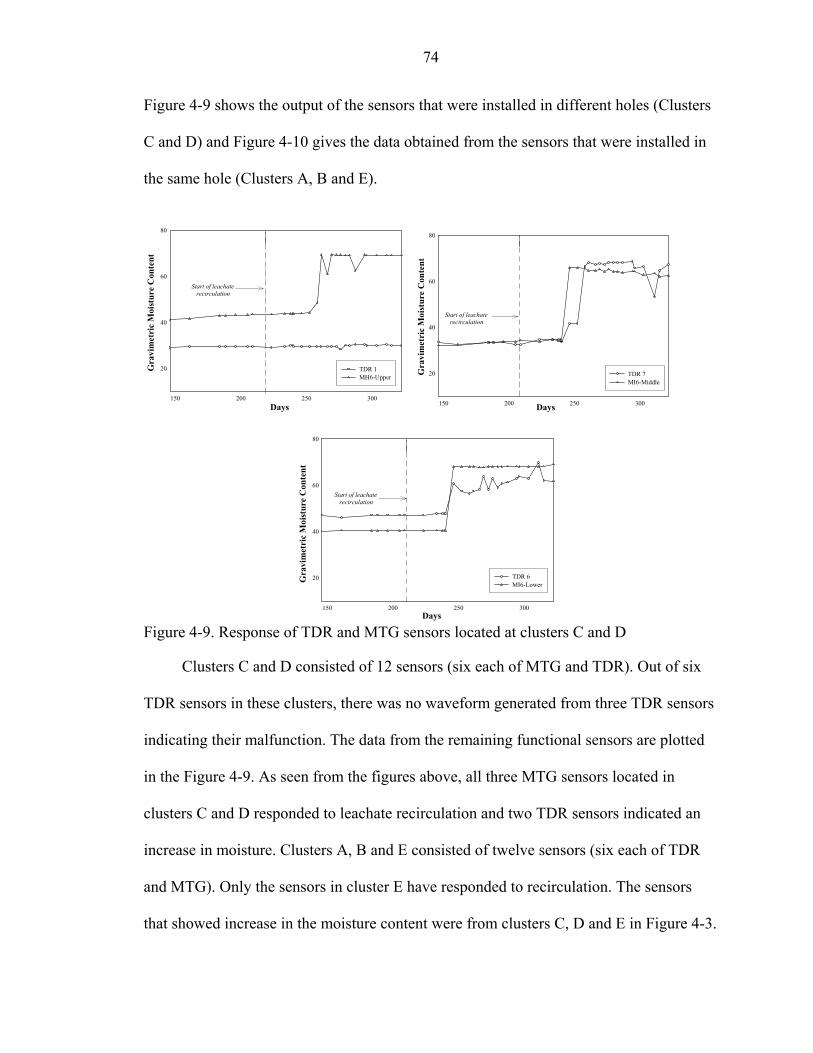
74
Figure 4-9 shows the output of the sensors that were installed in different holes (Clusters
C and D) and Figure 4-10 gives the data obtained from the sensors that were installed in
the same hole (Clusters A, B and E).
Days 150 200 250 300
Gra
vim
etri
c M
oist
ure
Con
tent
20
40
60
80
TDR 1MH6-Upper
Start of leachate recirculation
Days 150 200 250 300
Gra
vim
etri
c M
oist
ure
Con
tent
20
40
60
80
TDR 7MI6-Middle
Start of leachate recirculation
Days 150 200 250 300
Gra
vim
etri
c M
oist
ure
Con
tent
20
40
60
80
TDR 6MI6-Lower
Start of leachate recirculation
Figure 4-9. Response of TDR and MTG sensors located at clusters C and D
Clusters C and D consisted of 12 sensors (six each of MTG and TDR). Out of six
TDR sensors in these clusters, there was no waveform generated from three TDR sensors
indicating their malfunction. The data from the remaining functional sensors are plotted
in the Figure 4-9. As seen from the figures above, all three MTG sensors located in
clusters C and D responded to leachate recirculation and two TDR sensors indicated an
increase in moisture. Clusters A, B and E consisted of twelve sensors (six each of TDR
and MTG). Only the sensors in cluster E have responded to recirculation. The sensors
that showed increase in the moisture content were from clusters C, D and E in Figure 4-3.

75
Days 150 200 250 300
Gra
vim
etri
c M
oist
ure
Con
tent
20
40
60
80
TDR 2MI7-Upper
Start of leachate recirculation
Days 150 200 250 300
Gra
vim
etri
c M
oist
ure
Con
tent
20
40
60
80
TDR 5MI5-Upper
Start of leachate recirculation
Days 150 200 250 300
Gra
vim
etri
c M
oist
ure
Con
tent
20
30
40
50
60
70
80
TDR 9MG7-Upper
Start of leachate recirculation
Days 150 200 250 300
Gra
vim
etri
c M
oist
ure
Con
tent
20
30
40
50
60
70
80
TDR 10MI7-Middle
Start of leachate recirculation
Days 150 200 250 300
Gra
vim
etri
c M
oist
ure
Con
tent
20
30
40
50
60
70
80
TDR 12MG7-Middle
Start of leachate recirculation
Days 150 200 250 300
(%) G
ravi
met
ric
Moi
stur
e C
onte
nt
20
30
40
50
60
70
80
TDR 11MI5-Middle
Start of leachate recirculation
Figure 4-10. Response of TDR and MTG sensors located at clusters A, B and E
As these sensors were nearer to injection well CI5 than sensors in Clusters A and B, there
is a greater possibility of the leachate recirculated through CI5 to pass through them first
before reaching sensors in clusters A and B. Figure 4-10 gives the response of both types
of sensors to leachate recirculation. As shown by this figure, though the initial moisture

76
contents of the waste predicted by both TDR and MTG sensors were not equal, the
sensors showed simultaneous increase in the moisture contents. The sensors did not show
any drying due to the continuous leachate injection through CI5 (the injection cluster that
primarily wet all the sensors in the area) from day 218 till day 322, which was the last
day of the reported data in this thesis. However, data need to be collected to investigate
the drying cycle. Figure 4-11 gives the plot of moisture contents predicted by the
calibration equations for both the sensor types. Each point shown in this figure represent
the moisture content value as predicted by resistance-based as well as TDR sensors that
were installed adjacent to each other. All the values were chosen from Figures 4-9 and 4-
10. Two values of moisture content (one each from MTG and TDR sensors before and
after recirculation) were selected from the sensors that became wetter after recirculation
and one value was selected from the sensors that did not predict any change in moisture
after recirculation. Note from Figure 4-9 that MTG sensor (MH6-upper) responded to
leachate recirculation where as the corresponding TDR sensor (TDR 1) did not show any
change and the outlier in Figure 4-11 represents this value. A best-fit line was plotted
using all the points except the outlier.
4.4.4 Advantages and Disadvantages of Each Probe
As seen in this section, both MTG and TDR sensors were able to predict the
increase in the moisture content of the medium. However it is difficult to measure exact
moisture contents due to the heterogeneity of the waste. The manufacturing costs of MTG
sensors were much cheaper than the TDR sensors (approximately $25 per MTG and $500
per TDR sensor); hence multiple MTG sensors could be placed in the landfill at the same
manufacturing cost as a TDR sensor.

77
MTG Moisture content (%) 20 30 40 50 60 70 80
TD
R M
oist
ure
cont
ent (
%)
20
30
40
50
60
70
80
r2=0.75
Figure 4-11. Comparison of moisture contents from TDR and MTG sensors
The conductivity of the medium affects the operation of both sensors. While the
effect of conductivity can be reduced by coating the TDR probes, the MTG sensors need
to be calibrated for various conductivity ranges in the landfill. The variation in density of
the landfill affects the moisture measurement using TDR sensors; the density variation
had negligible effect, however, on resistance measurements from MTG sensors. All 12
MTG sensors worked (100 % success in operation) but only nine out of 12 TDR sensors
worked (75% success in operation). Though the installation procedure was similar for
both the sensors, care needs to be taken in the installation of TDR sensors to avoid any
damages to the probes during installation.
4.4.5 Summary and Conclusions
TDR is one of the widely used technologies for in situ soil moisture measurements.
When applied to landfills, the porosity of the waste and the electrical conductivity of the

78
leachate had significant effect on the moisture content determination. A total of 12 each
of TDR and resistance-based MTG sensors were installed at a section of the landfill to
measure the in situ moisture content of landfilled waste. This study indicated that TDR
could be used as one of the moisture measurement techniques in the landfills. The
simultaneous increase in the moisture contents of the TDR and MTG sensors in some
clustered locations give an indication that both technologies were capable of estimating
the transient moisture changes in the landfill. However, the values of the obtained
moisture content indicated that there is some degree of error between the two
measurement technologies while predicting the absolute moisture content. As the
leachate electrical conductivity has an effect on both these measurement technologies,
knowledge of this parameter could be beneficial in calculating the moisture content. Due
to the high cost of manufacturing of TDR sensors, this technology could be limited in its
application to bioreactor landfills where there is a need to measure moisture contents at
multiple locations. Further data need to be collected to investigate the drying cycle.
Future work should aim at simultaneous measurement of moisture content and electrical
conductivity of the landfill leachate with the TDR probes.

79
CHAPTER 5 SUMMARY AND CONCLUSIONS
Knowledge of the in situ moisture content of the waste in a landfill would be
extremely helpful to bioreactor landfill operators. The present study evaluated the field
application of moisture measurement devices for assessing in situ moisture content of
waste in a bioreactor landfill. A total of 135 electrical resistance-based and 12 time
domain reflectometry (TDR) sensors were installed in a bioreactor landfill in north
central Florida. In situ moisture contents of the waste were measured using these two
different technologies with laboratory-derived calibration equations.
It was observed that 98% of the resistance-based sensors performed as expected.
The initial moisture content measurements determined that some areas of the landfill
were wet, as indicated by a resistance value of less than 0.05 kΩ. The resistance values
obtained in this study ranged from a minimum of 0.005 kΩ to a maximum of 466.7 kΩ.
The temperatures obtained from the MTG sensors ranged from 26.9 to 57.7oC with an
average temperature of 48.6oC. The initial moisture content of the landfill estimated from
the sensors was 42%, which was higher than values reported in the literature and values
obtained from collected waste samples. Sixty sensors showed a response to leachate
recirculation. The MTG sensors were observed to respond somewhat to drying cycles.
The spatial average of moisture content after 762,300 gallons of leachate recirculated was
estimated to be 48%. This was higher than the expected average moisture content based
on the amount of leachate recirculated. This was attributed to the greater leachate
conductivity values encountered in the landfill compared to that used in calibration

80
curves and that leachate flow through preferential paths might have intercepted the
sensors.
A total of nine out of the 12 installed TDR probes functioned. The data from the
TDR sensors showed that this technology was also able to track changes in moisture
content in the landfill. The simultaneous increase in moisture contents measured by the
TDR and MTG sensors in some clustered locations gave an indication that both the
technologies were compatible for predicting the transient moisture changes in the landfill.
However, the values of the obtained moisture contents indicated that some difference
between the two measurement technologies do exist in predicting absolute moisture
content.
The extreme heterogeneity of the landfilled waste and the varying electrical
conductivity of the leachate were factors that were observed to influence both moisture
measurement technologies. The manufacturing costs of the MTG sensors were less than
the TDR sensors (approximately $25 per MTG and $500 per TDR sensor). The TDR
sensors required a larger borehole, and installation costs were also more expensive
relative to the MTG sensors. The use of multiple TDR locations is thus expensive relative
to the MTG sensors. It was observed that only 75% of TDR sensors functioned as
compared to a high performance rate of 98% for the resistance-based sensors.
Future work should focus on continuing monitoring of the sensors and calibrating
the MTG sensors for higher leachate conductivities. The TDR sensors need to be
investigated for the drying cycle in the field. Data from the sensors should be used to
estimate the leachate recirculation travel times. The ability of the sensors to predict the
absolute moisture content should be explored further.

81
APPENDIX A SUPPLEMENTAL FIGURES
Bioreactor Area
Figure A-1. Plan view of the New River Regional Landfill

82
Figure A-2. Plan view of injection and monitoring clusters
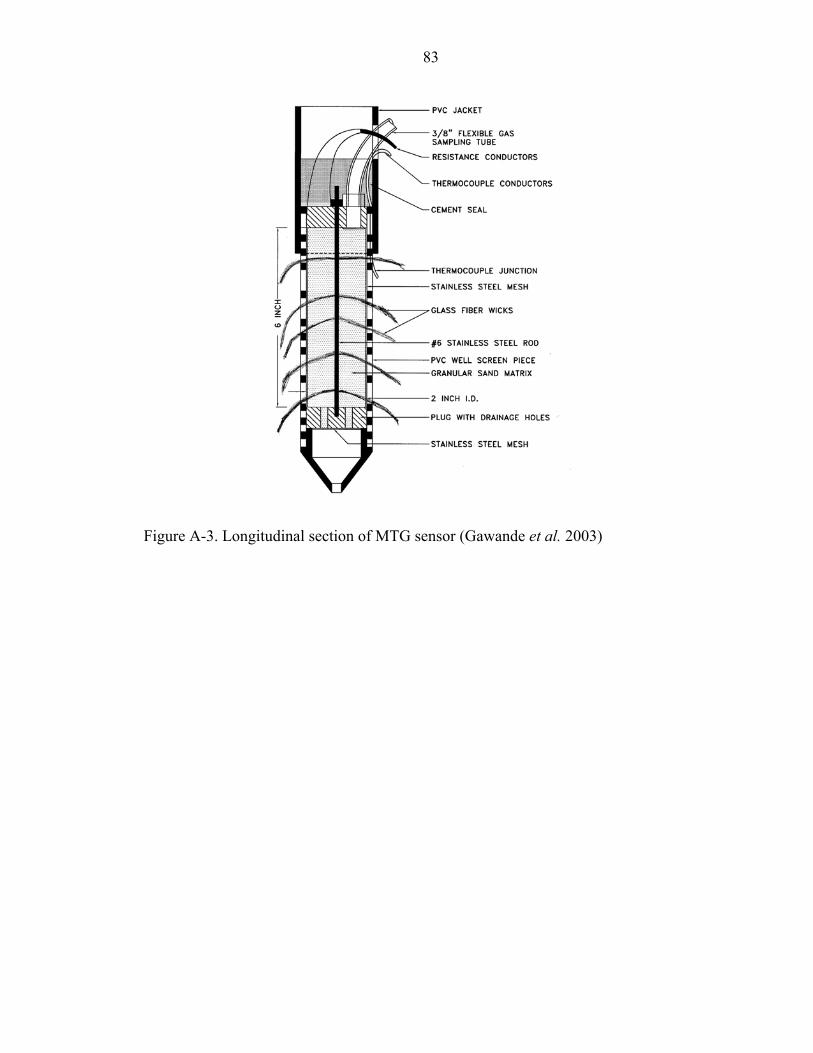
83
Figure A-3. Longitudinal section of MTG sensor (Gawande et al. 2003)

84
APPENDIX B RESISTIVITY SENSOR DATA
This appendix presents graphs of the data collected from all the resistance-based
sensors present in the landfill. The results cover a period from March 2003 to December
2003.

85
Days100 150 200 250 300 350
Tem
pera
ture
(Deg
C)
30
35
40
45
50
55
60
D3R D3Y D3G
Days100 150 200 250 300 350
Res
ista
nce
(KO
HM
S)
0.001
0.01
0.1
1
10
100
1000
MD3G MD3Y MD3R
Start of Leachate Recirculation
Start of Leachate Recirculation
Figure B-1 Response of resistivity sensors at cluster location MD3 (Day 1 = 01/01/03)
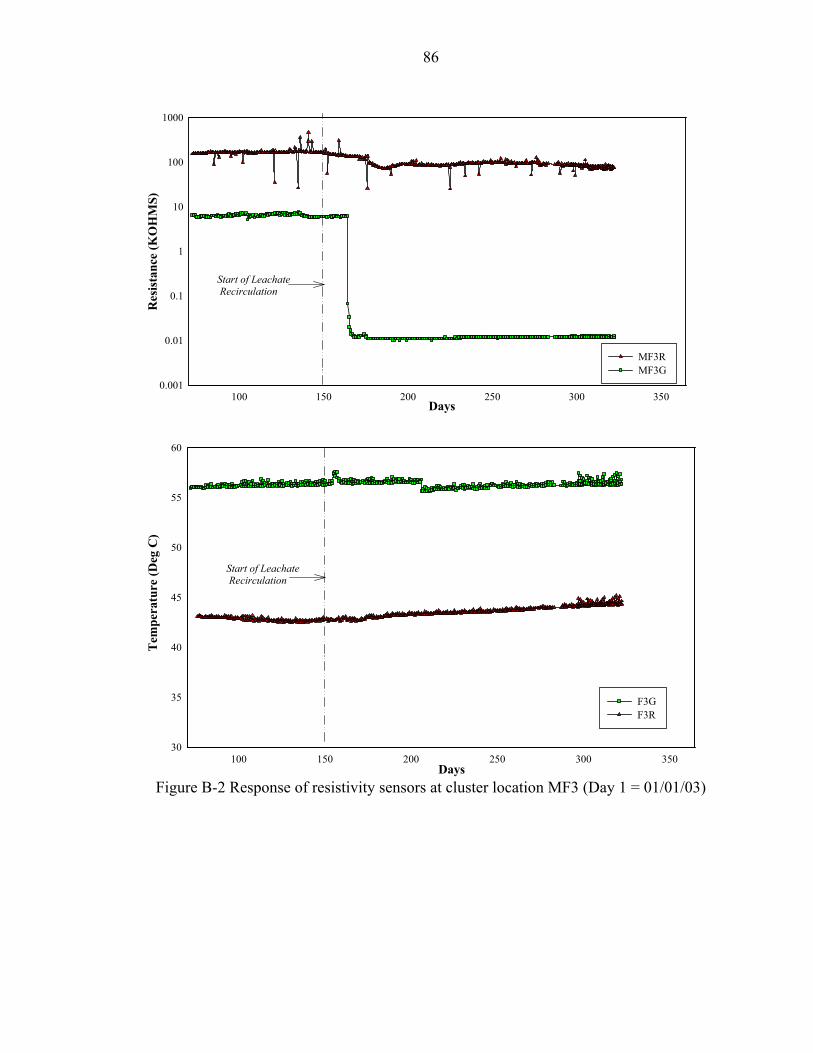
86
100 150 200 250 300 35030
35
40
45
50
55
60
F3G F3R
100 150 200 250 300 3500.001
0.01
0.1
1
10
100
1000
MF3R MF3G
Tem
pera
ture
(Deg
C)
Days
Res
ista
nce
(KO
HM
S)
Start of Leachate Recirculation
Days
Start of Leachate Recirculation
Figure B-2 Response of resistivity sensors at cluster location MF3 (Day 1 = 01/01/03)

87
100 150 200 250 300 35030
35
40
45
50
55
60
G3WG G3WY
100 150 200 250 300 3500.001
0.01
0.1
1
10
100
1000
MG3WY MG3WG
Tem
pera
ture
(Deg
C)
Res
ista
nce
(KO
HM
S)
Start of Leachate Recirculation
Days
Days
Start of Leachate Recirculation
Figure B-3 Response of resistivity sensors at cluster location MG3W (Day 1 = 01/01/03)

88
100 150 200 250 3000.001
0.01
0.1
1
10
100
1000
MG3EG MG3EY MG3ER
100 150 200 250 30030
35
40
45
50
55
60
G3EG G3EY G3ER
Tem
pera
ture
(Deg
C)
Res
ista
nce
(KO
HM
S)
Start of Leachate Recirculation
Days
Days
Start of Leachate Recirculation
Figure B-4 Response of resistivity sensors at cluster location MG3E (Day 1 = 01/01/03)

89
100 150 200 250 300 3500.001
0.01
0.1
1
10
100
1000
MH3Y MH3R MH3G
100 150 200 250 300 35030
35
40
45
50
55
60
H3Y H3R
Tem
pera
ture
(Deg
C)
Res
ista
nce
(KO
HM
S)
Days
Start of Leachate Recirculation
Start of Leachate Recirculation
DaysFigure B-5 Response of resistivity sensors at cluster location MH3 (Day 1 = 01/01/03)

90
100 150 200 250 300 35030
35
40
45
50
55
60
J3R J3Y
100 150 200 250 300 3500.001
0.01
0.1
1
10
100
1000
MJ3G MJ3Y MJ3R
Days
Tem
pera
ture
(Deg
C)
Days
Res
ista
nce
(KO
HM
S)
Start of Leachate Recirculation
Start of Leachate Recirculation
Figure B-6 Response of resistivity sensors at cluster location MJ3 (Day 1 = 01/01/03)

91
100 150 200 250 300 3500.001
0.01
0.1
1
10
100
1000
ML3G ML3R
100 150 200 250 300 35030
35
40
45
50
55
60
L3G L3R
Days
Tem
pera
ture
(Deg
C)
Days
Res
ista
nce
(KO
HM
S)
Start of Leachate Recirculation
Start of Leachate Recirculation
Figure B-7 Response of resistivity sensors at cluster location ML3 (Day 1 = 01/01/03)
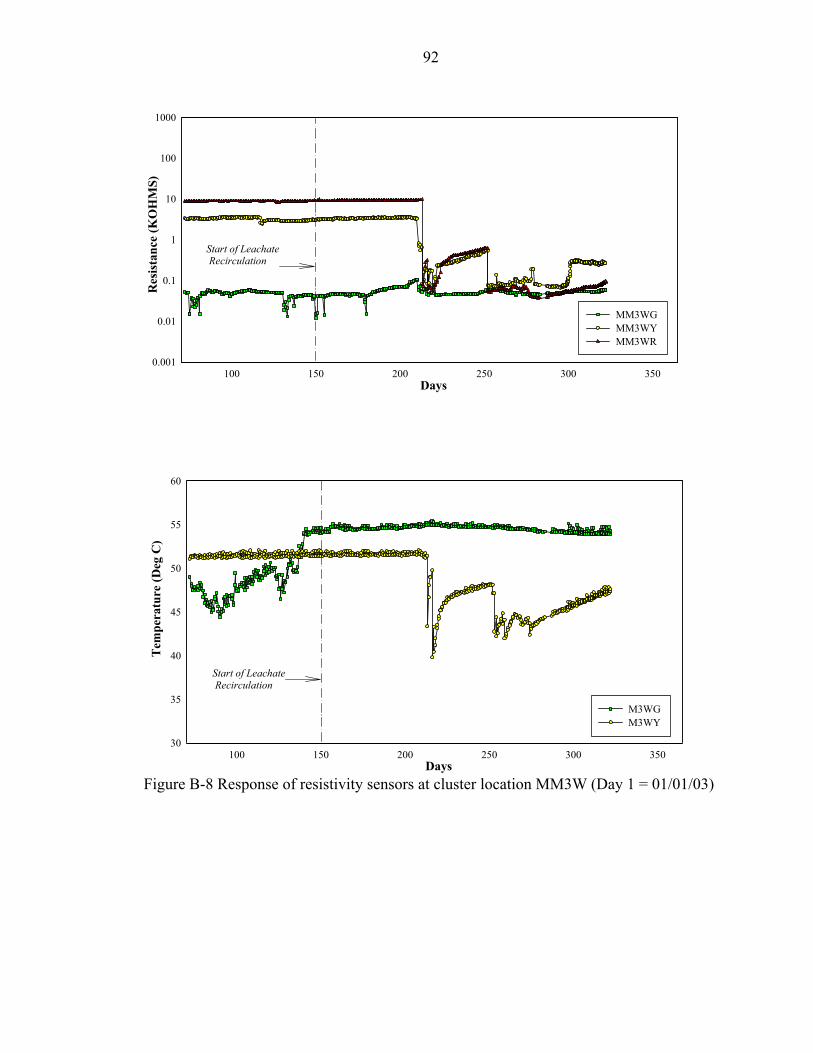
92
100 150 200 250 300 35030
35
40
45
50
55
60
M3WG M3WY
100 150 200 250 300 3500.001
0.01
0.1
1
10
100
1000
MM3WG MM3WY MM3WR
Days
Tem
pera
ture
(Deg
C)
Days
Res
ista
nce
(KO
HM
S)
Start of Leachate Recirculation
Start of Leachate Recirculation
Figure B-8 Response of resistivity sensors at cluster location MM3W (Day 1 = 01/01/03)

93
100 150 200 250 3000.001
0.01
0.1
1
10
100
1000
MM3EG MM3EY MM3ER
100 150 200 250 30030
35
40
45
50
55
60
M3EG M3EY M3ER
Days
Tem
pera
ture
(Deg
C)
Days
Res
ista
nce
(KO
HM
S)
Start of Leachate Recirculation
Start of Leachate Recirculation
Figure B-9 Response of resistivity sensors at cluster location MM3E (Day 1 = 01/01/03)

94
100 150 200 250 300 3500.001
0.01
0.1
1
10
100
1000
MO3G MO3Y MO3R
100 150 200 250 300 35030
35
40
45
50
55
60
O3G O3Y
Days
Tem
pera
ture
(Deg
C)
Days
Res
ista
nce
(KO
HM
S)
Start of Leachate Recirculation
Start of Leachate Recirculation
Figure B-10 Response of resistivity sensors at cluster location MO3 (Day 1 = 01/01/03)

95
100 150 200 250 300 35030
35
40
45
50
55
60
D4R D4Y D4G
100 150 200 250 300 3500.001
0.01
0.1
1
10
100
1000
MD4G MD4Y MD4R
Days
Tem
pera
ture
(Deg
C)
Days
Res
ista
nce
(KO
HM
S)
Start of Leachate Recirculation
Start of Leachate Recirculation
Figure B-11 Response of resistivity sensors at cluster location MD4 (Day 1 = 01/01/03)

96
100 150 200 250 300 3500.001
0.01
0.1
1
10
100
1000
MF4Y MF4R
100 150 200 250 300 350
30
35
40
45
50
55
60
F4G F4R F4Y
Tem
pera
ture
(Deg
C)
Days
Res
ista
nce
(KO
HM
S)
Start of Leachate Recirculation
Days
Start of Leachate Recirculation
Figure B-12 Response of resistivity sensors at cluster location MF4 (Day 1 = 01/01/03)

97
100 150 200 250 300 3500.001
0.01
0.1
1
10
100
1000
MH4Y MH4R MH4G
100 150 200 250 300 35030
35
40
45
50
55
60
H4Y H4R
Tem
pera
ture
(Deg
C)
Days
Res
ista
nce
(KO
HM
S)
Start of Leachate Recirculation
Days
Start of Leachate Recirculation
Figure B-13 Response of resistivity sensors at cluster location MH4 (Day 1 = 01/01/03)
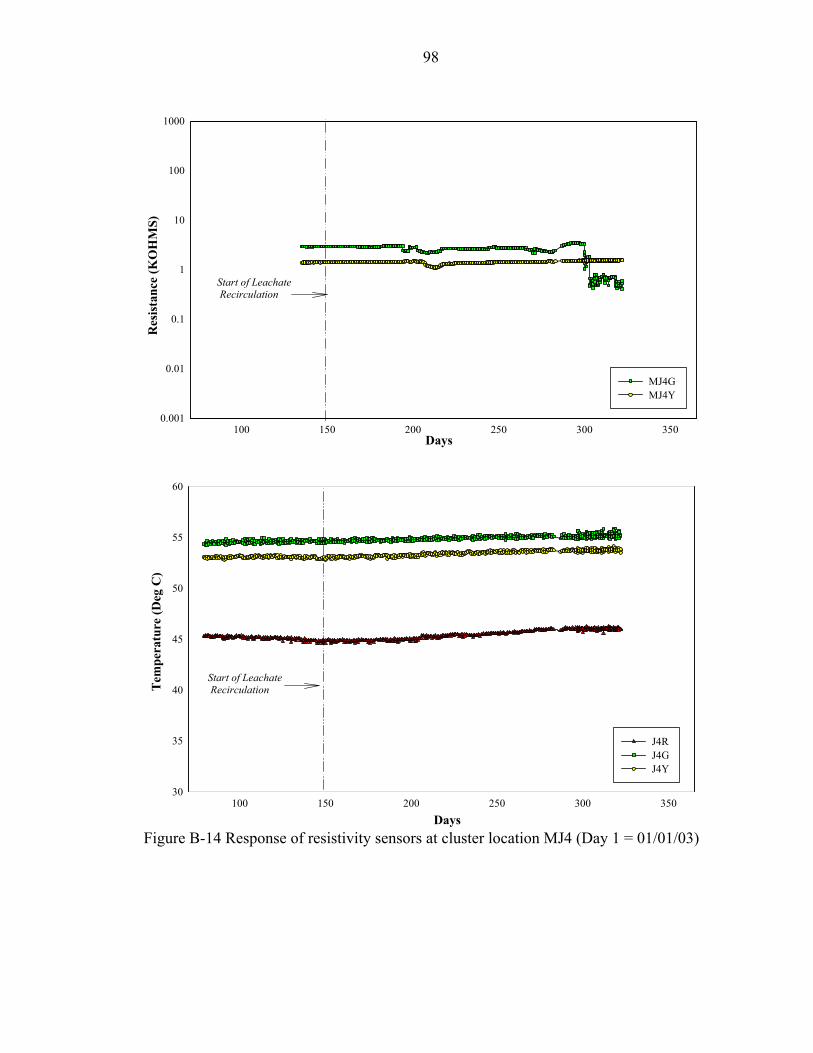
98
100 150 200 250 300 35030
35
40
45
50
55
60
J4R J4G J4Y
100 150 200 250 300 3500.001
0.01
0.1
1
10
100
1000
MJ4G MJ4Y
Days
Tem
pera
ture
(Deg
C)
Days
Res
ista
nce
(KO
HM
S)
Start of Leachate Recirculation
Start of Leachate Recirculation
Figure B-14 Response of resistivity sensors at cluster location MJ4 (Day 1 = 01/01/03)
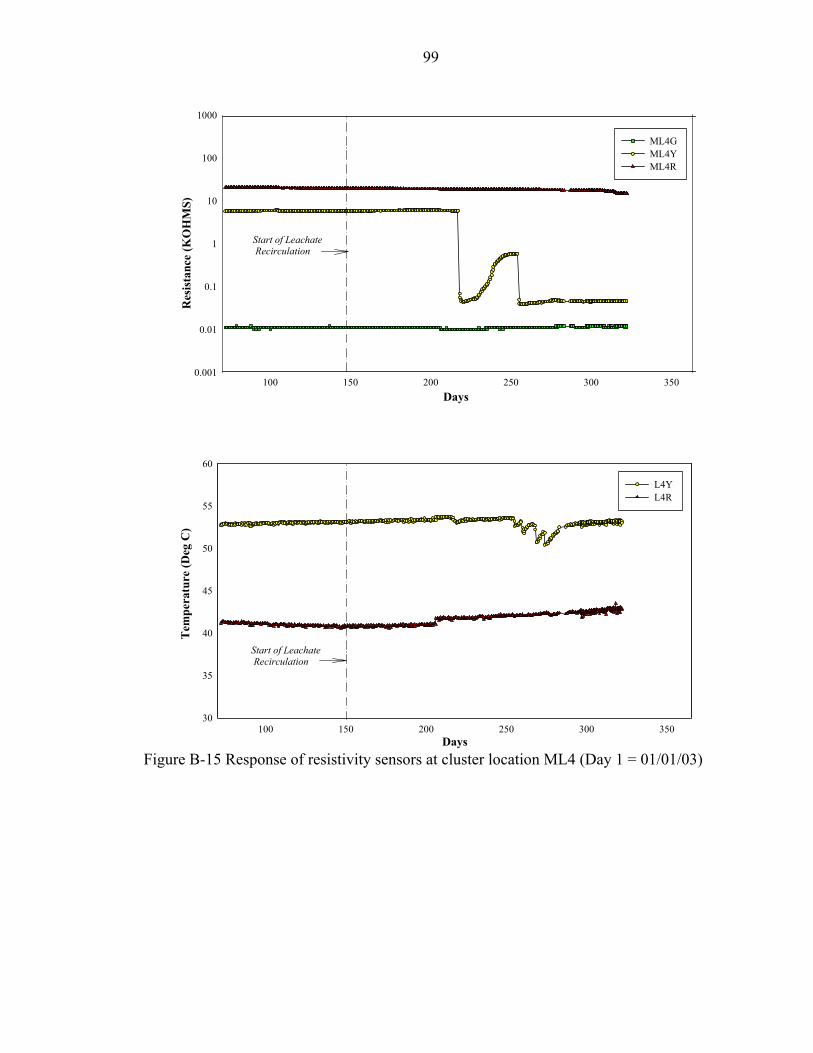
99
100 150 200 250 300 3500.001
0.01
0.1
1
10
100
1000
ML4G ML4Y ML4R
100 150 200 250 300 35030
35
40
45
50
55
60
L4Y L4R
Days
Tem
pera
ture
(Deg
C)
Days
Res
ista
nce
(KO
HM
S)
Start of Leachate Recirculation
Start of Leachate Recirculation
Figure B-15 Response of resistivity sensors at cluster location ML4 (Day 1 = 01/01/03)

100
100 150 200 250 300 3500.001
0.01
0.1
1
10
100
1000
MN4G MN4Y MN4R
100 150 200 250 300 35030
35
40
45
50
55
60
N4G N4R N4Y
Days
Tem
pera
ture
(Deg
C)
Days
Res
ista
nce
(KO
HM
S)
Start of Leachate Recirculation
Start of Leachate Recirculation
Figure B-16 Response of resistivity sensors at cluster location MN4 (Day 1 = 01/01/03)
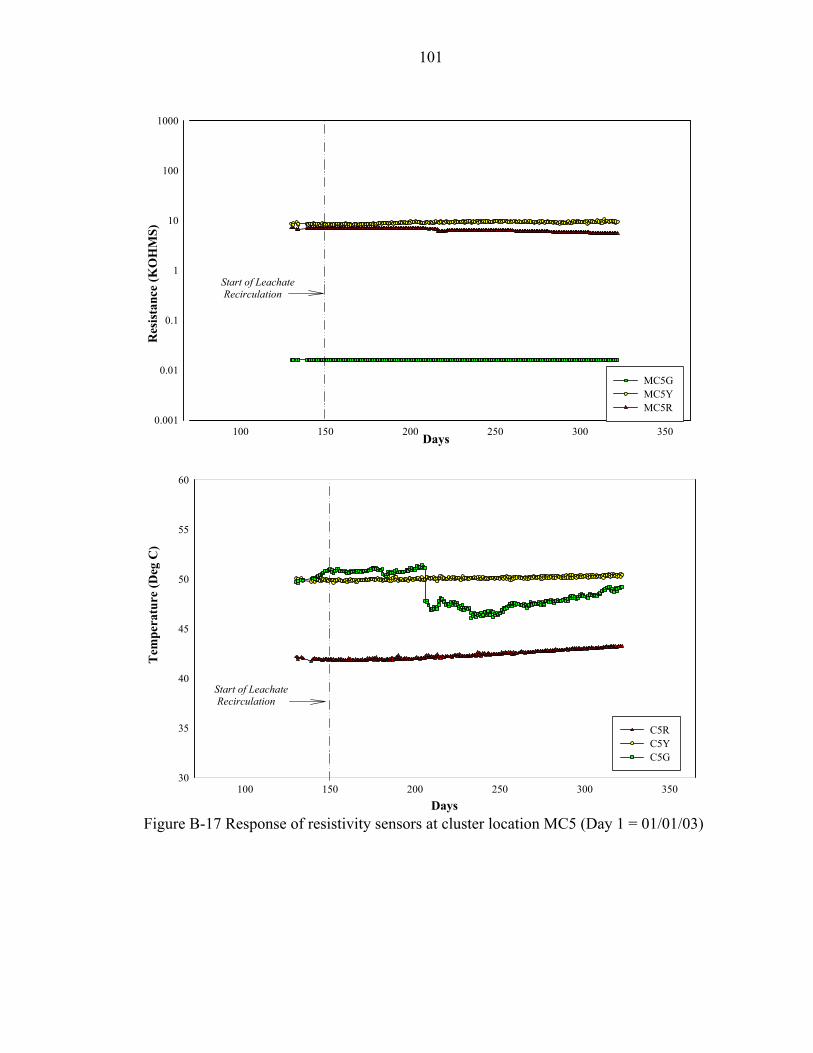
101
100 150 200 250 300 35030
35
40
45
50
55
60
C5R C5Y C5G
100 150 200 250 300 3500.001
0.01
0.1
1
10
100
1000
MC5G MC5Y MC5R
Days
Res
ista
nce
(KO
HM
S)
Start of Leachate Recirculation
Days
Tem
pera
ture
(Deg
C)
Start of Leachate Recirculation
Figure B-17 Response of resistivity sensors at cluster location MC5 (Day 1 = 01/01/03)

102
100 150 200 250 300 35030
35
40
45
50
55
60
E5R E5Y E5G
100 150 200 250 300 3500.001
0.01
0.1
1
10
100
1000
ME5G ME5Y ME5R
Tem
pera
ture
(Deg
C)
Days
Res
ista
nce
(KO
HM
S)
Start of Leachate Recirculation
Start of Leachate Recirculation
Figure B-18 Response of resistivity sensors at cluster location ME5 (Day 1 = 01/01/03)

103
100 150 200 250 300 3500.001
0.01
0.1
1
10
100
1000
MG5G MG5Y MG5R
100 150 200 250 300 35030
35
40
45
50
55
60
G5G G5Y G5R
Days
Tem
pera
ture
(Deg
C)
Days
Res
ista
nce
(KO
HM
S)
Start of Leachate Recirculation
Start of Leachate Recirculation
Figure B-19 Response of resistivity sensors at cluster location MG5 (Day 1 = 01/01/03)

104
100 150 200 250 300 3500.001
0.01
0.1
1
10
100
1000
MI5Y MI5R
100 150 200 250 300 35030
35
40
45
50
55
60
I5Y I5R
Days
Tem
pera
ture
(Deg
C)
Days
Res
ista
nce
(KO
HM
S)
Start of Leachate Recirculation
Start of Leachate Recirculation
Figure B-20 Response of resistivity sensors at cluster location MI5 (Day 1 = 01/01/03)

105
100 150 200 250 300 35030
35
40
45
50
55
60
K5R K5Y K5G
100 150 200 250 300 3500.001
0.01
0.1
1
10
100
1000
MK5G MK5Y MK5R
Days
Tem
pera
ture
(Deg
C)
Days
Res
ista
nce
(KO
HM
S)
Start of Leachate Recirculation
Start of Leachate Recirculation
Figure B-21 Response of resistivity sensors at cluster location MK5 (Day 1 = 01/01/03)

106
100 150 200 250 300 35030
35
40
45
50
55
60
L5R L5G L5Y
100 150 200 250 300 3500.001
0.01
0.1
1
10
100
1000
ML5G ML5Y ML5R
Days
Tem
pera
ture
(Deg
C)
Days
Res
ista
nce
(KO
HM
S)
Start of Leachate Recirculation
Start of Leachate Recirculation
Figure B-22 Response of resistivity sensors at cluster location ML5 (Day 1 = 01/01/03)

107
100 150 200 250 300 35030
35
40
45
50
55
60
O5R O5Y O5G
100 150 200 250 300 3500.001
0.01
0.1
1
10
100
1000
MO5G MO5Y MO5R
Days
Res
ista
nce
(KO
HM
S)
Start of Leachate Recirculation
Days
Tem
pera
ture
(Deg
C)
Start of Leachate Recirculation
Figure B-23 Response of resistivity sensors at cluster location MO5 (Day 1 = 01/01/03)

108
100 150 200 250 300 35030
35
40
45
50
55
60
D6R D6Y D6G
100 150 200 250 300 3500.001
0.01
0.1
1
10
100
1000
MD6G MD6Y MD6R
Days
Tem
pera
ture
(Deg
C)
Days
Res
ista
nce
(KO
HM
S)
Start of Leachate Recirculation
Start of Leachate Recirculation
Figure B-24 Response of resistivity sensors at cluster location MD6 (Day 1 = 01/01/03)

109
100 150 200 250 300 35030
35
40
45
50
55
60
F6R F6Y
100 150 200 250 300 3500.001
0.01
0.1
1
10
100
1000
MF6R MF6Y
Days
Tem
pera
ture
(Deg
C)
Days
Res
ista
nce
(KO
HM
S)
Start of Leachate Recirculation
Start of Leachate Recirculation
Figure B-25 Response of resistivity sensors at cluster location MF6 (Day 1 = 01/01/03)
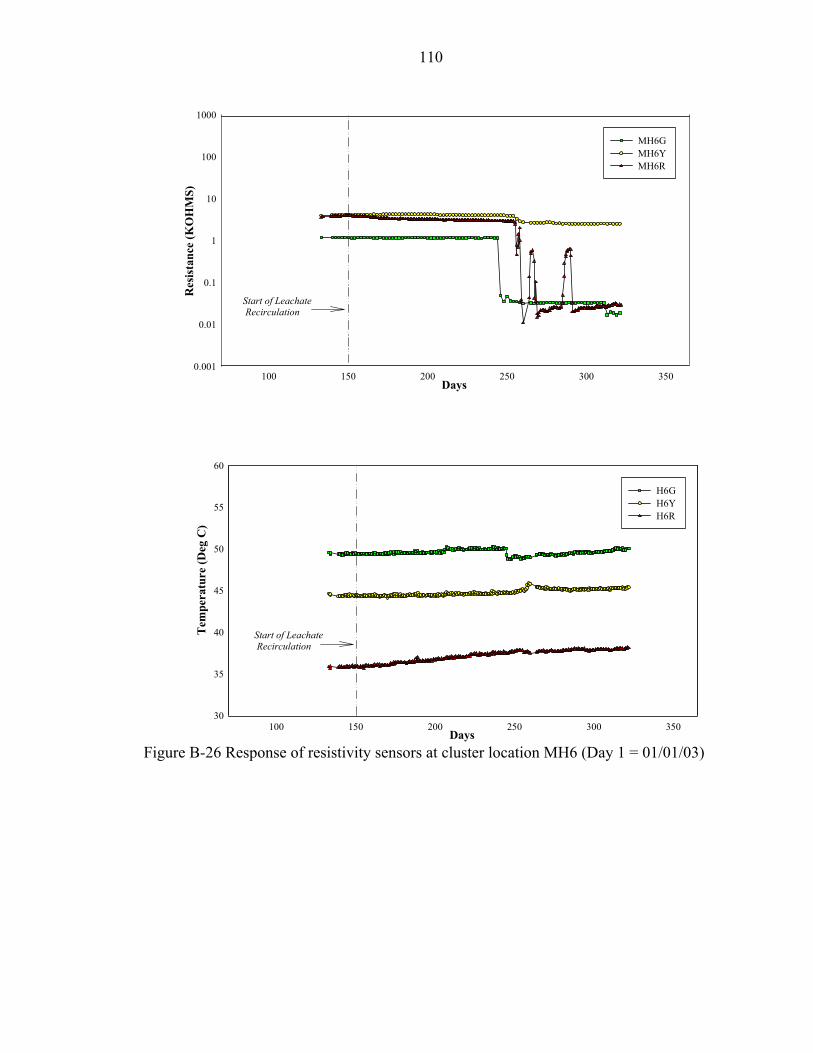
110
100 150 200 250 300 3500.001
0.01
0.1
1
10
100
1000
MH6G MH6Y MH6R
100 150 200 250 300 35030
35
40
45
50
55
60
H6G H6Y H6R
Days
Tem
pera
ture
(Deg
C)
Days
Res
ista
nce
(KO
HM
S)
Start of Leachate Recirculation
Start of Leachate Recirculation
Figure B-26 Response of resistivity sensors at cluster location MH6 (Day 1 = 01/01/03)
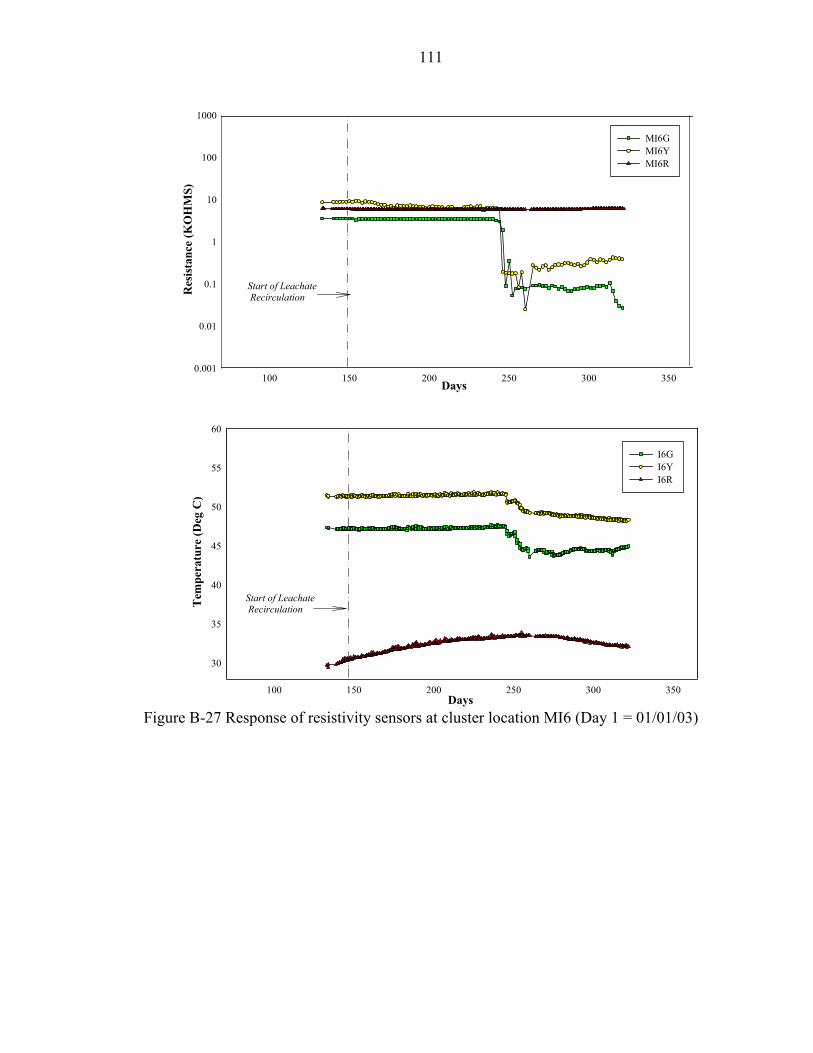
111
100 150 200 250 300 3500.001
0.01
0.1
1
10
100
1000
MI6G MI6Y MI6R
100 150 200 250 300 350
30
35
40
45
50
55
60
I6G I6Y I6R
Days
Tem
pera
ture
(Deg
C)
Days
Res
ista
nce
(KO
HM
S)
Start of Leachate Recirculation
Start of Leachate Recirculation
Figure B-27 Response of resistivity sensors at cluster location MI6 (Day 1 = 01/01/03)

112
100 150 200 250 300 35030
35
40
45
50
55
60
K6R K6G K6Y
100 150 200 250 300 3500.001
0.01
0.1
1
10
100
1000
MK6R MK6G MK6Y
Days
Tem
pera
ture
(Deg
C)
Days
Res
ista
nce
(KO
HM
S)
Start of Leachate Recirculation
Start of Leachate Recirculation
Figure B-28 Response of resistivity sensors at cluster location MK6 (Day 1 = 01/01/03)
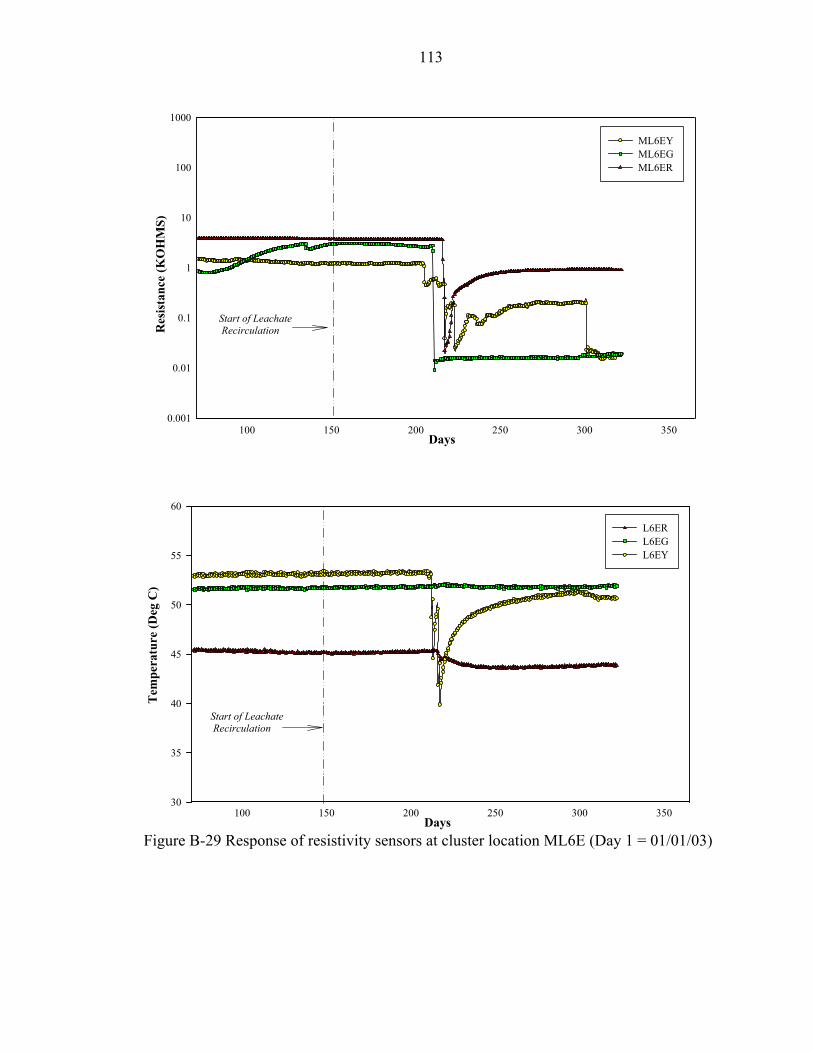
113
100 150 200 250 300 35030
35
40
45
50
55
60
L6ER L6EG L6EY
100 150 200 250 300 3500.001
0.01
0.1
1
10
100
1000
ML6EY ML6EG ML6ER
Days
Tem
pera
ture
(Deg
C)
Days
Res
ista
nce
(KO
HM
S)
Start of Leachate Recirculation
Start of Leachate Recirculation
Figure B-29 Response of resistivity sensors at cluster location ML6E (Day 1 = 01/01/03)

114
100 150 200 250 300 3500.001
0.01
0.1
1
10
100
1000
ML6WG ML6WR ML6WY
100 150 200 250 300 35030
35
40
45
50
55
60
L6WR L6WG L6WY
Days
Tem
pera
ture
(Deg
C)
Days
Res
ista
nce
(KO
HM
S)
Start of Leachate Recirculation
Start of Leachate Recirculation
Figure B-30 Response of resistivity sensors at cluster location ML6W (Day 1 = 01/01/03)
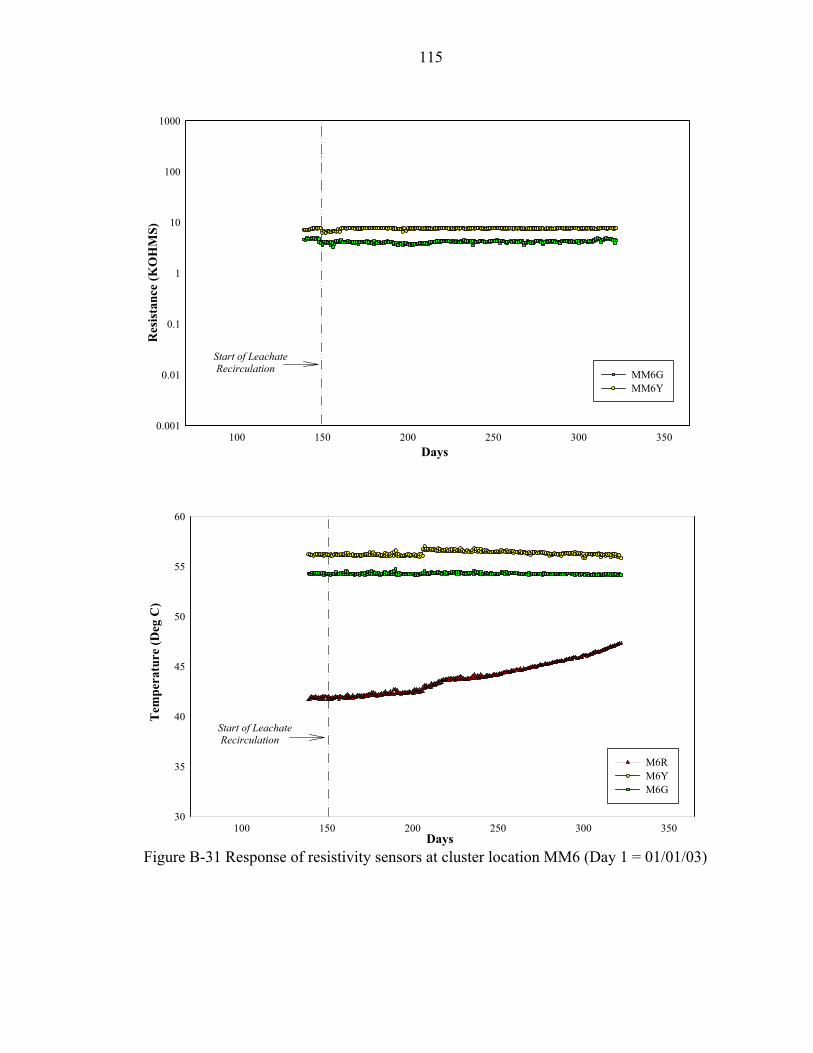
115
100 150 200 250 300 35030
35
40
45
50
55
60
M6R M6Y M6G
100 150 200 250 300 3500.001
0.01
0.1
1
10
100
1000
MM6G MM6Y
Days
Tem
pera
ture
(Deg
C)
Days
Res
ista
nce
(KO
HM
S)
Start of Leachate Recirculation
Start of Leachate Recirculation
Figure B-31 Response of resistivity sensors at cluster location MM6 (Day 1 = 01/01/03)

116
100 150 200 250 300 35030
35
40
45
50
55
60
O6Y O6G
100 150 200 250 300 3500.001
0.01
0.1
1
10
100
1000
MO6G MO6R
Days
Tem
pera
ture
(Deg
C)
Days
Res
ista
nce
(KO
HM
S)
Start of Leachate Recirculation
Start of Leachate Recirculation
Figure B-32 Response of resistivity sensors at cluster location MO6 (Day 1 = 01/01/03)

117
100 150 200 250 300 35030
35
40
45
50
55
60
C7R C7Y C7G
100 150 200 250 300 3500.001
0.01
0.1
1
10
100
1000
MC7G MC7Y MC7R
Days
Tem
pera
ture
(Deg
C)
Days
Res
ista
nce
(KO
HM
S)
Start of Leachate Recirculation
Figure B-33 Response of resistivity sensors at cluster location MC7 (Day 1 = 01/01/03)

118
100 150 200 250 300 35030
35
40
45
50
55
60
E7R E7G E7Y
100 150 200 250 300 3500.001
0.01
0.1
1
10
100
1000
ME7G ME7Y ME7R
Days
Tem
pera
ture
(Deg
C)
Days
Res
ista
nce
(KO
HM
S)
Start of Leachate Recirculation
Start of Leachate Recirculation
Figure B-34 Response of resistivity sensors at cluster location ME7 (Day 1 = 01/01/03)

119
100 150 200 250 300 35030
35
40
45
50
55
60
G7R G7Y
100 150 200 250 300 3500.001
0.01
0.1
1
10
100
1000
MG7Y MG7R
Days
Tem
pera
ture
(Deg
C)
Days
Res
ista
nce
(KO
HM
S)
Start of Leachate Recirculation
Start of Leachate Recirculation
Figure B-35 Response of resistivity sensors at cluster location MG7 (Day 1 = 01/01/03)

120
100 150 200 250 300 35030
35
40
45
50
55
60
I7R I7Y
100 150 200 250 300 3500.001
0.01
0.1
1
10
100
1000
MI7Y MI7R
Days
Tem
pera
ture
(Deg
C)
Days
Res
ista
nce
(KO
HM
S)
Start of Leachate Recirculation
Start of Leachate Recirculation
Figure B-36 Response of resistivity sensors at cluster location MI7 (Day 1 = 01/01/03)

121
100 150 200 250 300 35030
35
40
45
50
55
60
K7R K7Y
100 150 200 250 300 3500.001
0.01
0.1
1
10
100
1000
MK7G MK7Y MK7R
Days
Tem
pera
ture
(Deg
C)
Days
Res
ista
nce
(KO
HM
S)
Start of Leachate Recirculation
Start of Leachate Recirculation
Figure B-37 Response of resistivity sensors at cluster location MK7 (Day 1 = 01/01/03)

122
100 150 200 250 300 35030
35
40
45
50
55
60
M7R M7Y M7G
100 150 200 250 300 3500.001
0.01
0.1
1
10
100
1000
MM7G MM7Y MM7R
Days
Tem
pera
ture
(Deg
C)
Days
Res
ista
nce
(KO
HM
S)
Start of Leachate Recirculation
Start of Leachate Recirculation
Figure B-38 Response of resistivity sensors at cluster location MM7 (Day 1 = 01/01/03)
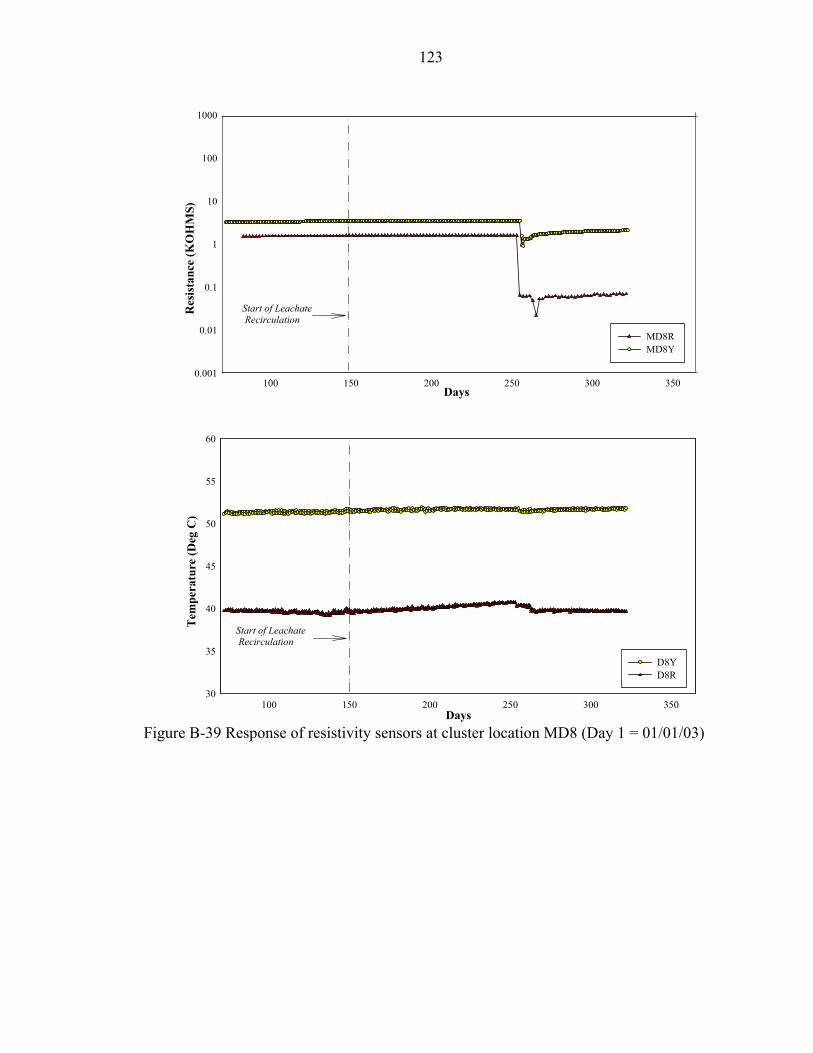
123
100 150 200 250 300 3500.001
0.01
0.1
1
10
100
1000
MD8R MD8Y
100 150 200 250 300 35030
35
40
45
50
55
60
D8Y D8R
Days
Tem
pera
ture
(Deg
C)
Res
ista
nce
(KO
HM
S)
Start of Leachate Recirculation
Start of Leachate Recirculation
Days
Figure B-39 Response of resistivity sensors at cluster location MD8 (Day 1 = 01/01/03)

124
100 150 200 250 300 3500.001
0.01
0.1
1
10
100
1000
MF8G MF8Y MF8R
100 150 200 250 300 35030
35
40
45
50
55
60
F8G F8Y F8R
Days
Tem
pera
ture
(Deg
C)
Res
ista
nce
(KO
HM
S)
Start of Leachate Recirculation
Start of Leachate Recirculation
Days
Figure B-40 Response of resistivity sensors at cluster location MF8 (Day 1 = 01/01/03)

125
100 150 200 250 300 35030
35
40
45
50
55
60
H8Y H8R H8G
100 150 200 250 300 3500.001
0.01
0.1
1
10
100
1000
MH8Y MH8G
Days
Tem
pera
ture
(Deg
C)
Days
Res
ista
nce
(KO
HM
S)
Start of Leachate Recirculation
Start of Leachate Recirculation
Figure B-41 Response of resistivity sensors at cluster location MH8 (Day 1 = 01/01/03)

126
100 150 200 250 300 3500.001
0.01
0.1
1
10
100
1000
MJ8G MJ8Y MJ8R
100 150 200 250 300 35030
35
40
45
50
55
60
J8G J8Y
Days
Tem
pera
ture
(Deg
C)
Days
Res
ista
nce
(KO
HM
S)
Start of Leachate Recirculation
Start of Leachate Recirculation
Figure B-42 Response of resistivity sensors at cluster location MJ8 (Day 1 = 01/01/03)

127
100 150 200 250 300 3500.001
0.01
0.1
1
10
100
1000
ML8G ML8Y ML8R
100 150 200 250 300 35030
35
40
45
50
55
60
L8G L8Y L8R
Days
Tem
pera
ture
(Deg
C)
Days
Res
ista
nce
(KO
HM
S)
Start of Leachate Recirculation
Start of Leachate Recirculation
Figure B-43 Response of resistivity sensors at cluster location ML8 (Day 1 = 01/01/03)

128
100 150 200 250 300 35030
35
40
45
50
55
60
N8R N8Y N8G
100 150 200 250 300 3500.001
0.01
0.1
1
10
100
1000
MN8G MN8Y MN8R
Days
Tem
pera
ture
(Deg
C)
Days
Res
ista
nce
(KO
HM
S)
Start of Leachate Recirculation
Start of Leachate Recirculation
Figure B-44 Response of resistivity sensors at cluster location MN8 (Day 1 = 01/01/03)

129
100 150 200 250 300 35030
35
40
45
50
55
60
C9R C9Y
100 150 200 250 300 3500.001
0.01
0.1
1
10
100
1000
MC9Y MC9R
Days
Tem
pera
ture
(Deg
C)
Days
Res
ista
nce
(KO
HM
S)
Start of Leachate Recirculation
Start of Leachate Recirculation
Figure B-45 Response of resistivity sensors at cluster location MC9 (Day 1 = 01/01/03)

130
100 150 200 250 300 3500.0001
0.001
0.01
0.1
1
10
100
1000
MF9G MF9Y MF9R
100 150 200 250 300 35030
35
40
45
50
55
60
F9G F9Y F9R
Days
Tem
pera
ture
(Deg
C)
Res
ista
nce
(KO
HM
S)
Start of Leachate Recirculation
Start of Leachate Recirculation
Days
Figure B-46 Response of resistivity sensors at cluster location MF9 (Day 1 = 01/01/03)

131
100 150 200 250 300 35030
35
40
45
50
55
60
I9R I9Y
100 150 200 250 300 3500.001
0.01
0.1
1
10
100
1000
MI9G MI9Y MI9R
Days
Tem
pera
ture
(Deg
C)
Days
Res
ista
nce
(KO
HM
S)
Start of Leachate Recirculation
Start of Leachate Recirculation
Figure B-47 Response of resistivity sensors at cluster location MI9 (Day 1 = 01/01/03)

132
100 150 200 250 300 3500.001
0.01
0.1
1
10
100
1000
MM9G MM9Y MM9R
100 150 200 250 300 35030
35
40
45
50
55
60
M9G M9Y M9R
Days
Tem
pera
ture
(Deg
C)
Days
Res
ista
nce
(KO
HM
S)
Start of Leachate Recirculation
Start of Leachate Recirculation
Figure B-48 Response of resistivity sensors at cluster location MM9 (Day 1 = 01/01/03)

133
APPENDIX C TDR PROBE DATA
Table C-1. Calibration coefficients for the twelve probes 5432)( εεεεθ edcbaContentWater ++++=
Probe a b c d e 1 2.25 5.73 -0.84 0.07 -0.002 2 -0.85 -2.12 1.34 -0.11 0.003 3 9.77 1.08 0.07 0.0008 -6.579 4 -6.12 5.12 -0.03 -0.0018 2.66 5 4.43 4.00 0.034 -0.005 0.0001 6 -0.92 6.28 -0.0015 -0.011 0.0003 7 1.08 2.49 -0.16 0.037 -0.001 8 2.26 10.9 -1.95 0.15 -0.004 9 1.52 4.29 -0.28 0.016 -0.0003 10 1.88 5.85 -0.51 0.024 -0.0003 11 0.73 2.15 0.03 0.0013 -5.99 12 -2.36 8.07 -0.93 0.052 -0.0009
Table C-2. Dry density of waste material around each probe
Probe Dry Density (kg/m3)
1 489.9 2 506.3 3 375.6 4 294.6 5 456.8 6 410.5 7 370 8 620.3 9 431.2 10 422.8 11 320.3 12 405.4

134
Table C-3. Characteristics of waveform obtained from TDR probe located near the upper
resistivity sensor at instrumentation cluster MH6 Date Apparent length La (m) Relative dielectric
constant (Ka) Gravimetric moisture
content 01/07/03 2.755 7.128 29.21 03/18/03 2.816 7.459 29.77 04/15/03 2.755 7.128 29.21 05/01/03 2.803 7.388 29.65 05/15/03 2.803 7.388 29.65 05/26/03 2.755 7.128 29.21 06/10/03 2.803 7.388 29.65 07/03/03 2.803 7.388 29.65 07/07/03 2.803 7.388 29.65 07/15/03 2.803 7.388 29.65 07/24/03 2.803 7.388 29.65 07/29/03 2.803 7.388 29.65 08/11/03 2.755 7.128 29.21 08/21/03 2.790 7.316 29.53 08/26/03 2.838 7.578 29.98 08/27/03 2.851 7.653 30.11 08/28/03 2.790 7.316 29.53 09/03/03 2.803 7.388 29.65 09/09/03 2.790 7.316 29.53 09/15/03 2.803 7.388 29.65 09/18/03 2.803 7.388 29.65 09/23/03 2.790 7.316 29.53 09/26/03 2.803 7.388 29.65 09/30/03 2.803 7.388 29.65 10/03/03 2.658 6.621 28.38 10/07/03 2.851 7.653 30.11 10/10/03 2.850 7.649 30.10 10/14/03 2.860 7.726 30.24 10/21/03 2.867 7.744 30.27 10/23/03 2.843 7.611 30.04 10/31/03 2.832 7.548 29.93 11/07/03 2.875 7.787 30.35 11/11/03 2.842 7.603 30.02 11/18/03 2.844 7.616 30.04

135
Table C-4. Characteristics of waveform obtained from TDR probe located near the upper resistivity sensor at instrumentation cluster MI7
Date Apparent length La (m) Relative dielectric constant (Ka)
Gravimetric moisture content
01/07/03 2.785 7.292 28.07 03/18/03 2.785 7.292 28.07 04/15/03 2.755 7.128 27.35 05/01/03 2.755 7.128 27.35 05/15/03 2.755 7.128 27.35 05/26/03 2.755 7.128 27.35 06/10/03 2.803 7.388 28.48 07/03/03 2.803 7.388 28.48 07/07/03 2.803 7.388 28.48 07/15/03 2.803 7.388 28.48 07/24/03 2.755 7.128 27.35 07/29/03 2.755 7.128 27.35 08/11/03 2.755 7.128 27.35 08/21/03 2.790 7.316 28.17 08/26/03 2.803 7.388 28.48 08/27/03 2.803 7.388 28.48 08/28/03 2.779 7.258 27.92 09/03/03 2.779 7.258 27.92 09/09/03 2.755 7.128 27.35 09/15/03 2.803 7.388 28.48 09/18/03 2.755 7.128 27.35 09/23/03 2.790 7.316 28.17 09/26/03 2.755 7.128 27.35 09/30/03 2.755 7.128 27.35 10/03/03 2.851 7.653 29.58 10/07/03 2.851 7.653 29.58 10/10/03 2.843 7.610 29.41 10/14/03 2.811 7.433 28.67 10/21/03 2.866 7.739 29.93 10/23/03 2.824 7.502 28.96 10/31/03 2.832 7.549 29.16 11/07/03 2.830 7.537 29.11 11/11/03 2.838 7.581 29.29 11/18/03 2.844 7.616 29.43

136
Table C-5. Characteristics of waveform obtained from TDR probe located near the middle resistivity sensor at instrumentation cluster MI7
Date Apparent length La (m) Relative dielectric constant (Ka)
Gravimetric moisture content
01/07/03 3.528 11.85 43.56 03/18/03 3.52 11.80 43.49 04/15/03 3.528 11.85 43.56 05/01/03 3.625 12.53 44.34 05/15/03 3.576 12.19 43.94 05/26/03 3.673 12.87 44.74 06/10/03 3.528 11.85 43.56 07/03/03 3.576 12.19 43.94 07/07/03 3.576 12.19 43.94 07/15/03 3.576 12.19 43.94 07/24/03 3.576 12.19 43.94 07/29/03 3.576 12.19 43.94 08/11/03 3.576 12.19 43.94 08/21/03 3.608 12.41 44.19 08/26/03 3.608 12.41 44.19 08/27/03 3.583 12.24 44.00 08/28/03 3.559 12.07 43.81 09/03/03 3.721 13.22 45.15 09/09/03 3.721 13.22 45.15 09/15/03 3.625 12.53 44.34 09/18/03 3.625 12.53 44.34 09/23/03 3.625 12.53 44.34 09/26/03 3.608 12.41 44.19 09/30/03 3.608 12.41 44.19 10/03/03 3.673 12.87 44.74 10/07/03 3.656 12.75 44.59 10/10/03 3.732 13.30 45.25 10/14/03 3.661 12.78 44.64 10/21/03 3.699 13.06 44.96 10/23/03 3.722 13.23 45.16 10/31/03 3.624 12.53 44.34 11/07/03 3.655 12.75 44.33 11/11/03 3.690 13.00 44.89 11/18/03 3.708 13.13 45.04

137
Table C-6. Characteristics of waveform obtained from TDR probe located near the upper resistivity sensor at instrumentation cluster MI5
Date Apparent length La (m) Relative dielectric constant (Ka)
Gravimetric moisture content
01/07/03 2.479 5.733 37.61 03/18/03 2.571 6.181 39.07 04/15/03 2.610 6.375 39.67 05/01/03 2.720 6.941 41.35 05/15/03 2.720 6.941 41.35 05/26/03 2.768 7.199 42.08 06/10/03 3.528 8.561 45.56 07/03/03 2.684 6.754 40.81 07/07/03 2.781 7.271 42.28 07/15/03 2.684 6.754 40.81 07/24/03 2.781 7.271 42.28 07/29/03 2.733 7.010 41.55 08/11/03 2.928 8.082 44.40 08/21/03 2.768 7.199 42.08 08/26/03 2.768 7.199 42.08 08/27/03 2.768 7.199 42.08 08/28/03 2.817 7.462 42.80 09/03/03 2.768 7.199 42.08 09/09/03 2.792 7.331 42.44 09/15/03 3.497 11.638 51.61 09/18/03 3.934 14.811 55.98 09/23/03 3.836 14.073 55.10 09/26/03 4.704 21.334 61.56 09/30/03 4.478 19.301 60.15 10/03/03 4.704 21.334 61.56 10/07/03 4.128 16.334 57.62 10/10/03 4.157 16.583 57.85 10/14/03 4.080 15.966 57.24 10/21/03 4.28 17.602 58.78 10/23/03 4.49 19.407 60.23 10/31/03 4.637 20.724 61.16 11/07/03 4.582 20.229 61.15 11/11/03 4.608 20.464 60.97 11/18/03 4.325 17.978 59.10

138
Table C-7. Characteristics of waveform obtained from TDR probe located near the middle resistivity sensor at instrumentation cluster MI5
Date Apparent length La (m) Relative dielectric constant (Ka)
Gravimetric moisture content
01/07/03 3.367 10.772 47.10 03/18/03 3.306 10.373 46.04 04/15/03 3.335 10.561 46.55 05/01/03 3.383 10.878 47.38 05/15/03 3.335 10.561 46.55 05/26/03 3.335 10.561 46.55 06/10/03 3.770 13.577 53.74 07/03/03 3.335 10.561 46.55 07/07/03 3.383 10.878 47.38 07/15/03 3.383 10.878 47.38 07/24/03 3.335 10.561 46.55 07/29/03 3.335 10.561 46.55 08/11/03 3.383 10.878 47.38 08/21/03 3.431 11.199 48.21 08/26/03 3.383 10.878 47.38 08/27/03 3.383 10.878 47.38 08/28/03 3.383 10.878 47.38 09/03/03 3.383 10.878 47.38 09/09/03 3.351 10.666 46.83 09/15/03 4.640 20.745 65.24 09/18/03 4.736 21.635 66.23 09/23/03 4.688 21.188 65.74 09/26/03 4.736 21.635 66.23 09/30/03 4.736 21.635 66.23 10/03/03 5.026 24.417 68.81 10/07/03 4.810 22.326 66.94 10/10/03 4.849 22.701 67.31 10/14/03 4.864 22.844 67.44 10/21/03 4.998 24.141 68.59 10/23/03 5.041 24.567 68.93 10/31/03 4.962 23.792 68.30 11/07/03 5.072 24.874 68.29 11/11/03 4.964 23.803 68.30 11/18/03 4.937 23.542 68.07

139
Table C-8. Characteristics of waveform obtained from TDR probe located near the lower resistivity sensor at instrumentation cluster MI6
Date Apparent length La (m) Relative dielectric constant (Ka)
Gravimetric moisture content
01/07/03 2.449 5.587 44.10 03/18/03 2.571 6.181 46.40 04/15/03 2.562 6.133 46.22 05/01/03 2.562 6.133 46.22 05/15/03 2.562 6.133 46.22 05/26/03 2.610 6.375 47.09 06/10/03 2.562 6.133 46.22 07/03/03 2.610 6.375 47.09 07/07/03 2.610 6.375 47.09 07/15/03 2.610 6.375 47.09 07/24/03 2.610 6.375 47.09 07/29/03 2.610 6.375 47.09 08/11/03 2.610 6.375 47.09 08/21/03 2.658 6.621 47.94 08/26/03 2.658 6.621 47.94 08/27/03 2.658 6.621 47.94 08/28/03 2.658 6.621 47.94 09/03/03 3.646 12.682 60.58 09/09/03 3.334 10.558 57.48 09/15/03 3.236 9.930 56.35 09/18/03 3.334 10.558 57.48 09/23/03 3.383 10.879 58.01 09/26/03 4.040 15.645 63.66 09/30/03 3.383 10.879 58.01 10/03/03 3.923 14.728 62.82 10/07/03 3.481 11.536 59.03 10/10/03 3.675 12.894 60.84 10/14/03 3.734 13.322 61.35 10/21/03 3.919 14.701 62.79 10/23/03 4.029 15.562 63.59 10/31/03 3.931 14.795 62.88 11/07/03 4.922 23.398 69.87 11/11/03 3.817 13.929 62.01 11/18/03 3.786 13.702 61.77
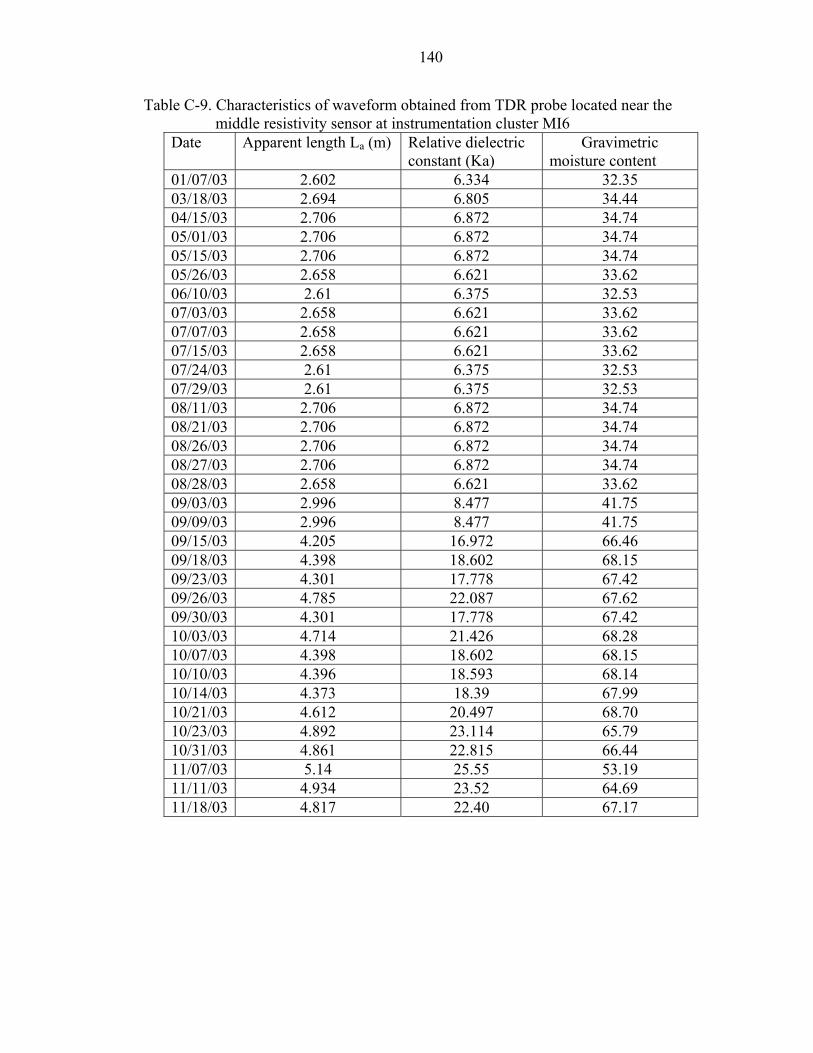
140
Table C-9. Characteristics of waveform obtained from TDR probe located near the middle resistivity sensor at instrumentation cluster MI6
Date Apparent length La (m) Relative dielectric constant (Ka)
Gravimetric moisture content
01/07/03 2.602 6.334 32.35 03/18/03 2.694 6.805 34.44 04/15/03 2.706 6.872 34.74 05/01/03 2.706 6.872 34.74 05/15/03 2.706 6.872 34.74 05/26/03 2.658 6.621 33.62 06/10/03 2.61 6.375 32.53 07/03/03 2.658 6.621 33.62 07/07/03 2.658 6.621 33.62 07/15/03 2.658 6.621 33.62 07/24/03 2.61 6.375 32.53 07/29/03 2.61 6.375 32.53 08/11/03 2.706 6.872 34.74 08/21/03 2.706 6.872 34.74 08/26/03 2.706 6.872 34.74 08/27/03 2.706 6.872 34.74 08/28/03 2.658 6.621 33.62 09/03/03 2.996 8.477 41.75 09/09/03 2.996 8.477 41.75 09/15/03 4.205 16.972 66.46 09/18/03 4.398 18.602 68.15 09/23/03 4.301 17.778 67.42 09/26/03 4.785 22.087 67.62 09/30/03 4.301 17.778 67.42 10/03/03 4.714 21.426 68.28 10/07/03 4.398 18.602 68.15 10/10/03 4.396 18.593 68.14 10/14/03 4.373 18.39 67.99 10/21/03 4.612 20.497 68.70 10/23/03 4.892 23.114 65.79 10/31/03 4.861 22.815 66.44 11/07/03 5.14 25.55 53.19 11/11/03 4.934 23.52 64.69 11/18/03 4.817 22.40 67.17

141
Table C-10. Characteristics of waveform obtained from TDR probe located near the upper resistivity sensor at instrumentation cluster MG7
Date Apparent length La (m) Relative dielectric constant (Ka)
Gravimetric moisture content
01/07/03 2.921 8.045 36.43 03/18/03 2.694 7.797 35.91 04/15/03 2.803 7.388 35.04 05/01/03 2.851 7.653 35.61 05/15/03 2.851 7.653 35.61 05/26/03 2.803 7.388 35.04 06/10/03 2.851 7.653 35.61 07/03/03 2.851 7.653 35.61 07/07/03 2.851 7.653 35.61 07/15/03 2.9 7.923 36.18 07/24/03 2.851 7.653 35.61 07/29/03 2.851 7.653 35.61 08/11/03 2.851 7.653 35.61 08/21/03 2.9 7.923 36.18 08/26/03 2.934 8.117 36.58 08/27/03 2.9 7.923 36.18 08/28/03 2.9 7.923 36.18 09/03/03 2.924 8.06 36.47 09/09/03 2.9 7.923 36.18 09/15/03 2.9 7.923 36.18 09/18/03 2.9 7.923 36.18 09/23/03 2.851 7.653 35.61 09/26/03 2.886 7.846 36.02 09/30/03 2.851 7.653 35.61 10/03/03 2.996 8.477 37.32 10/07/03 2.851 7.653 35.61 10/10/03 2.959 8.263 36.88 10/14/03 2.985 8.416 37.19 10/21/03 2.985 8.412 37.19 10/23/03 2.937 8.135 36.62 10/31/03 2.962 8.277 36.91 11/07/03 2.938 8.142 36.63 11/11/03 2.947 8.192 36.74 11/18/03 2.941 8.161 36.67

142
Table C-11. Characteristics of waveform obtained from TDR probe located near the middle resistivity sensor at instrumentation cluster MG7
Date Apparent length La (m) Relative dielectric constant (Ka)
Gravimetric moisture content
01/07/03 2.851 7.653 38.44 03/18/03 2.938 8.142 39.07 04/15/03 2.9 7.923 38.79 05/01/03 2.9 7.923 38.79 05/15/03 2.948 8.198 39.13 05/26/03 2.9 7.923 38.79 06/10/03 2.928 8.082 38.99 07/03/03 2.928 8.082 38.99 07/07/03 2.928 8.082 38.99 07/15/03 2.977 8.362 39.34 07/24/03 2.977 8.362 39.34 07/29/03 2.928 8.082 38.99 08/11/03 2.977 8.362 39.34 08/21/03 2.977 8.362 39.34 08/26/03 3.025 8.646 39.68 08/27/03 3.011 8.561 39.58 08/28/03 2.962 8.279 39.23 09/03/03 3.011 8.561 39.58 09/09/03 2.962 8.279 39.23 09/15/03 3.025 8.646 39.68 09/18/03 2.977 8.362 39.34 09/23/03 3.001 8.503 39.51 09/26/03 2.914 8.002 38.89 09/30/03 3.011 8.561 39.58 10/03/03 3.025 8.646 39.68 10/07/03 3.059 8.847 39.93 10/10/03 3.04 8.736 39.79 10/14/03 3.019 8.609 39.64 10/21/03 3.023 8.636 39.67 10/23/03 2.997 8.483 39.49 10/31/03 3.009 8.555 39.57 11/07/03 3.006 8.535 39.55 11/11/03 3.020 8.614 39.64 11/18/03 3.020 8.615 39.64

143
APPENDIX D EXAMPLE CALCULATION OF CONVERSION TO MOISTURE CONTENT FROM OBSERVED RESISTANCE AND TEMPERATURE AND CALIBRATION CURVES
The equations used for calculating the moisture content (wet weight basis) have
been described Gawande et al. (2003). They are as follows:
At 4.0 mS/cm: ( )RMC
0142.0exp785.01795.14
−−= (1)
At 8.0 mS/cm: ( )RMC
167.0exp*568.01068.30
−−= (2)
where MC is the moisture content of solid waste (% wet weight) R is the resistance value
measured from the sensor (kΩ). The 4 mS/cm and 8mS/cm refer to the electrical
conductivity of the solution used to wet the waste samples during calibration.
To incorporate the effect of temperature, a temperature correction was suggested is
shown as follows:
( )( )
−+−+
=2502.012502.01
1
221 t
tRR (3)
where R1is the resistance at temperature t1 and R2 is the resistance at temperature t2.
Equations 2 and 3 are used for the conversion of the measured resistance value at a
certain temperature to the corresponding gravimetric moisture content. For example, if an
MTG sensor in the landfill outputs a resistance value of 1kΩ at in situ temperature of
44oC, then the moisture content at a conductivity 8 mS/cm was calculated by the
following steps.
Given that R2 = 1 kΩ and t2 = 44oC,

144
Apply the temperature correction using equation 3 and the measured resistance
value at a calibration temperature of 22oC.
R1 = 1 kΩ( )( )
−+−+
252202.01254402.01
R1 = 1.468 kΩ
Then convert to moisture content at a leachate electric conductivity 8 mS/cm by
equation (2)
( )468.1*167.0exp568.01068.30
−−=MC
MC = 54.16 % by weight
Laboratory experiments were conducted to obtain the relationship between the
measured resistance and moisture content for conductivities of 4 mS/cm and 8 mS/cm.
This relationship is shown by the calibration curves give below.
Figure D-1 Calibration curves for MTG sensors for varying moisture conductivities (Gawande et al. 2003)
0
25
50
75
100
0 5 10 15 20 25Resistance (k Ohms)
Wet
Moi
stur
e C
onte
nt (%
)
4.0 mS/cm
8.0 mS/cm
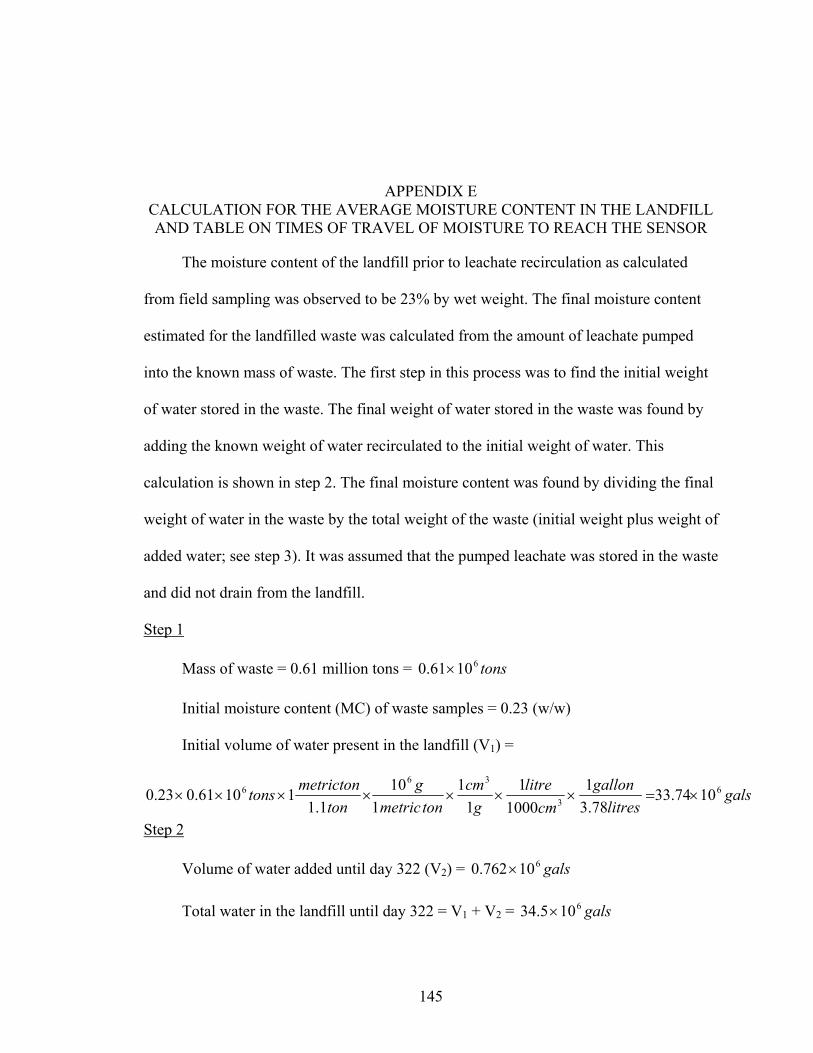
145
APPENDIX E CALCULATION FOR THE AVERAGE MOISTURE CONTENT IN THE LANDFILL AND TABLE ON TIMES OF TRAVEL OF MOISTURE TO REACH THE SENSOR
The moisture content of the landfill prior to leachate recirculation as calculated
from field sampling was observed to be 23% by wet weight. The final moisture content
estimated for the landfilled waste was calculated from the amount of leachate pumped
into the known mass of waste. The first step in this process was to find the initial weight
of water stored in the waste. The final weight of water stored in the waste was found by
adding the known weight of water recirculated to the initial weight of water. This
calculation is shown in step 2. The final moisture content was found by dividing the final
weight of water in the waste by the total weight of the waste (initial weight plus weight of
added water; see step 3). It was assumed that the pumped leachate was stored in the waste
and did not drain from the landfill.
Step 1
Mass of waste = 0.61 million tons = tons61061.0 ×
Initial moisture content (MC) of waste samples = 0.23 (w/w)
Initial volume of water present in the landfill (V1) =
galslitres
galloncm
litreg
cmtonmetric
gton
metrictontons 63
366 1074.33
78.31
10001
11
110
1.111061.023.0 ×=×××××××
Step 2
Volume of water added until day 322 (V2) = gals610762.0 ×
Total water in the landfill until day 322 = V1 + V2 = gals6105.34 ×
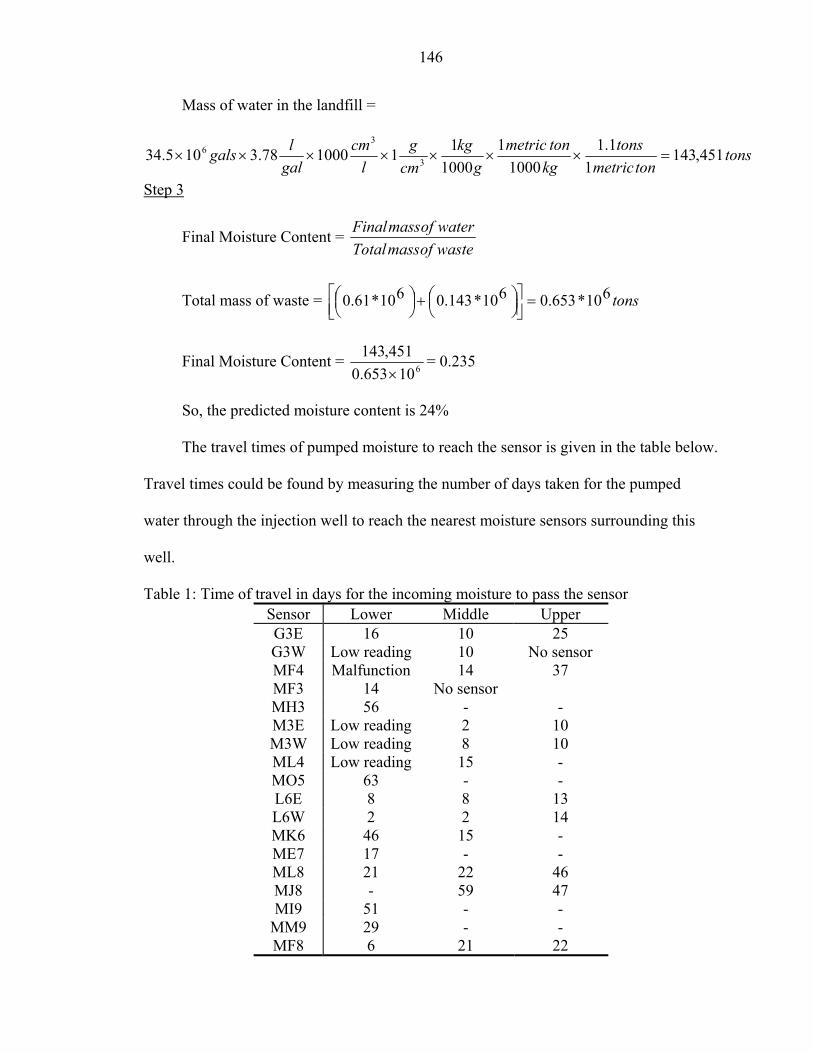
146
Mass of water in the landfill =
tonstonmetric
tonskgtonmetric
gkg
cmg
lcm
gallgals 451,143
11.1
10001
100011100078.3105.34 3
36 =×××××××
Step 3
Final Moisture Content = wasteofmassTotalwaterofmassFinal
Total mass of waste = tons610*653.0610*143.0610*61.0 =
+
Final Moisture Content = 610653.0451,143×
= 0.235
So, the predicted moisture content is 24%
The travel times of pumped moisture to reach the sensor is given in the table below.
Travel times could be found by measuring the number of days taken for the pumped
water through the injection well to reach the nearest moisture sensors surrounding this
well.
Table 1: Time of travel in days for the incoming moisture to pass the sensor Sensor Lower Middle Upper G3E 16 10 25 G3W Low reading 10 No sensor MF4 Malfunction 14 37 MF3 14 No sensor MH3 56 - - M3E Low reading 2 10 M3W Low reading 8 10 ML4 Low reading 15 - MO5 63 - - L6E 8 8 13 L6W 2 2 14 MK6 46 15 - ME7 17 - - ML8 21 22 46 MJ8 - 59 47 MI9 51 - -
MM9 29 - - MF8 6 21 22
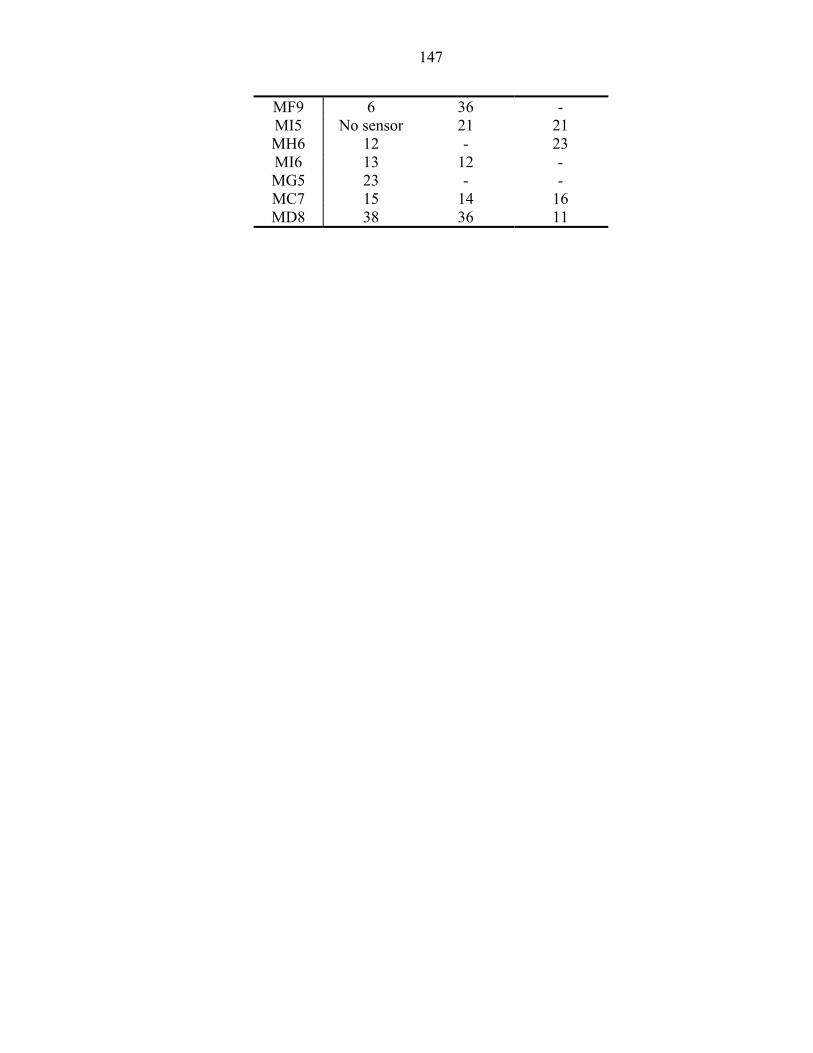
147
MF9 6 36 - MI5 No sensor 21 21 MH6 12 - 23 MI6 13 12 - MG5 23 - - MC7 15 14 16 MD8 38 36 11

148
APPENDIX F SCHEMATIC OF THE TDR WAVEFORM AND CALIBRATION GRAPHS AS
PROVIDED BY ZIRCON INC
TDR waveform provided by the manufacturer (Zircon inc) could be shown by the
schematic given below.
Figure F-1 Schematic sketch of the TDR wave form

149
The relationship between the volumetric moisture content and the measured
dielectric constant obtained from the waveform from the TDR sensors is shown in the
figure below. As mentioned in the text, 12 TDR probes (numbered from 1 to 12) were
installed in the landfill. These probes were calibrated on site with the excavated waste by
the vendor (Zircon Inc). The calibration equations were developed by increasing the
moisture content (by adding water or leachate with conductivities 0.7 S/m or 1.4 S/m to
the waste samples) and measure the relative dielectric constant from the observed
waveform. The details of the conductivities of liquid used for calibrating twelve different
TDR probes are given by the legend shown in the figure below.
Dielectric constant versus actual water content for different MSW
010
20304050
607080
90100
0 5 10 15 20 25 30Dielectric constant
Vol
umet
ric
wat
er c
onte
nt
No.1-1.4S/m No. 2-water No.3-water No.4-water
No.5-1.4S/m No.6-water No.7-water No.8-water
No.9-0.7s/m No.10-0.7S/m No.11-0.7S/m No.12-1.4S/m
Figure F-2 Calibration graphs for different probes (Zircon Inc)
150
LITERATURE CITED
Bengtsson, L., D. Bendz, W. Hogland, and H. Rosqvist (1994). “Water balance for landfills of different age.” Journal of Hydrology, 158, 203-217.
Bonnell, R. B., R. S. Broughton, and P. Enright (1991). “The measurement of soil-moisture and bulk-salinity using time domain reflectometry.” Canadian Agricultural Engineering, 33(2), 225-229.
Cassel, D. K., R. G. Kachanoski, and G. C. Topp (1994). “Practical considerations for using a TDR cable tester.” Soil Tech, 7(2), 113-126.
Chanasyk, D. S., and M. A. Naeth (1996). “Field measurement of soil moisture using neutron probes.” Canandian Journal of Soil Science, 76, 317-323
Chanzy, A., J. Chadoeuf, J. C. Gaudu, D. Mohrath, G. Richard, and L. Bruckler (1998). “Soil moisture monitoring at the field scale using automatic capacitance probes.” European Journal of Soil Science, 49, 637-648.
Dalton, F. N., W. N. Herkelrath, D. S. Rawlins, and J. D. Rhoades (1984). “Time domain reflectometry: Simultaneous measurement of soil water content and electrical conductivity with a single probe.” Science, 224, 989-990.
Dalton, F. N., and M. Th. Van Genuchten (1986). “The time domain reflectometry method for measuring soil water content and salinity.” Geoderma, 1986, 38, 237-250.
Dalton, F. N. (1992). “Development of time domain reflectometry for measuring soil water content and bulk soil electrical conductivity.” Soil Science Society of America, SSSA Spec. Publ, 30, 143-167
Dean, T. J., J. P. Bell, and A. J. B. Baty (1987). “Soil moisture measurement by an improved capacitance technique, Part I. Sensor design and performance.” Journal of Hydrology, 93, 67-78.
DeWalle, F. B., E. S. K. Chian, and E. Hammerberg (1978). “Gas production from solid waste in landfill.” Journal of the Environmental Engineering Division, ASCE, 104, 415.
Dickey, G. L. (1990). “Factors affecting neutron gauge calibration”, In Irrigation and Drainage Proceeding of the National Conference of ASCE, Irrigation and Drainage Division, Durango, CO, July 11-13, ASCE, New York, 192-201.

151
Eliassen, R. (1942). “Decomposition of Landfills.” American Journal of Public Health. 32, 1029.
Evett, S. R. (1998). “Some aspects of the time domain reflectometry (TDR), neutron scattering and capacitance methods of soil water content measurement.” IAEA- Tecdoc-1137, 5-49.
Fungaroli, A. A., and R. L. Steiner (1979). “Investigation of sanitary landfill behavior.” 1979; EPA-600/2-79-053a. US Environmental Protection Agency, Cincinnati, OH.
Gardner, W., and D. Kirkham (1952). “Determination of soil moisture by neutron scattering.” Soil Science, 73, 391-401.
Gawande, N. A., D. R. Reinhart, P. A. Thomas, P. T. Mccreanor, and T. G. Townsend (2003). “Municipal solid waste in situ moisture measurement using an electrical resistance sensor.” Waste Management, 23, 667-674.
Holmes, R. (1984). “Comparison of different methods of estimating infiltration at a landfill site in south Essex with implications for leachate management control.” Quarterly Journal of Engineering Geology, London, 17, 9-18.
Korfiatis, G. P., A. C. Demetracopoulos, E. L. Bourodimos, and E. G. Nawy (1984). “Moisture transport in a solid waste column.” Journal of Environmental Engineering, ASCE, 110(4), 780-796.
Li, R. S., and C. Zeiss (2001). “In situ moisture content measurement in MSW landfills with TDR.” Environmental Engineering Science, 18(1), 53-66.
Mata-Alvarez, J., and A. Martina-Verdure (1986). “Laboratory simulation of muncipal solid waste fermentation with leachate recycle.” Journal of Chemical Technology, 36, 547-556.
McCann, I. R., D. C. Kincaid, and D. Wang (1992). “Operational characteristics of the watermark model-200 soil water potential sensor for irrigation management.” Applied Engineering in Agriculture, 1992, 8(5), 603-609.
Miller, L. W., J. F. K. Earle, T. G. Townsend, C. W. Bartlett, and H. Lee (1991). “Leachate recycle and the augmentation of biological decomposition at MSW landfills.” Report No. 91-3, University of Florida, College of Engineering, Gainesville, FL.
Nadler, A., S. Dasberg, and I. Lapid (1991). “Time domain reflectometry measurements of water content and electrical conductivity of layered soil columns.” Soil Society of America Journal, 55, 938-943.
Nixon, P. R., and G. P. Lawless (1960). “Detection of deeply penetrating rainwater with neutron scattering moisture meter.” American Society of Agricultural Engineering, 3, 5-6.

152
Noborio, K., K. J. McInnes, and J. L. Heilman (1994). “Field measurements of soil electrical conductivity and water content by TDR.” Computers and Electronics in Agriculture, 11, 131-142.
Pohland, F. G. (1975). “Sanitary landfill stabilisation with leachate recycle and residual treatment.” EPA-600/2-75-043. US Environmental Protection Agency, Cincinnati, OH.
Pohland, F. G. (1988). “Leachate recycle as landfill management option.” Journal of the Environmental Engineering Division, ASCE, 106, 1057
Pohland, F. G., and S. R. Harper (1980). “Critical Review and Summary of Leachate and Gas Production from Landfills.” EPA/600/2-86/073. US Environmental Protection Agency, Cincinnati, OH.
Rees, J. F. (1980). “Optimisation of methane production and refuse decomposition in landfills by temperature control.” Journal of Chemical Technology and Biotechnology, 30, 458.
Reinhart, D. R., and T. G. Townnsend (1997). Landfill bioreactor design and operation. Lewis publishers, Boca Raton, FL.
Remson, I., and A. Fungaroli (1968). “Water movement in an unsaturated sanitary landfill.” Journal of the Sanitary Engineering Division, 94, SA2, 307-317.
Rosqvist, H., D. Bendz, C. Oman, and J. E. Meije (1997). “Water flow in a pilot-scale landfill.” Proceedings of Sardinia. 6th Internatonal Landfill Symposium. CISA, Caligari, Italy.
Rovers, F. A., and G. J. Farquhar (1973). “Infiltration and landfill behavior.” Journal of the Environmental Engineering Division, ASCE, 99, 671.
Schmugge, T. J., T. J. Jackson, and H. L. McKim (1980). “Survey methods for soil moisture determination.” Water Resources Research,16(6), 961-979.
Skinner, A., C. Hignett, and J. Dearden (1997). “Resurrecting the gypsum block for soil moisture measurement.” Australian Viticulture, 13-19.
Tchobanoglous, G., H. Theisen, and S. Vigil (1993). Integrated Solid Waste Management. McGraw-Hill, New York.
TDR 100 Instruction Manual (2002). Campbell Scientific Inc, Alberta.
Thomas, A. M. (1966). “In situ measurement of moisture in soil and similar substances by 'fringe’ capacitance.” Journal of Science Instruments, 43, 21-27.
Thomas, P. A. (2001). “The testing and evaluation of a prototype sensor for the measurement of moisture content in bioreactor landfills.” MS thesis, College of Engineering and Computer Sciences, University of Central Florida, Orlando, Florida.

153
Thomson, S. J., and C. F. Armstrong (1987). “Calibration of watermark model 200 soil moisture sensor.” Applied Engineering in Agriculture, 3(2), 186-189.
Tittlebaum, M. E. (1982). “Organic carbon content stabilization through landfill leachate recirculation.” Journal of Water Pollution Control Federation, 54(5), 428.
Topp, G. C., J. L. Davis, and A. P. Annan (1980). “Electromagnetic determination of soil water content: measurements in coaxial transmission lines.” Water Resources Research, 16, 574-582.
Topp, G. C., and J. L. Davis. (1985). Comment on “Monitoring the unfrozen water content of soil and snow using the Time Domain Reflectometry” by Jean Stein and Douglas L. Kane, Water Resources Research. 21:1059-1060.
Topp, G. C., M. Yanuka, W. D. Zebchuk, and S. Zegelin (1988). “Determination of electrical conductivity using time domain reflectometry: soil and water experiments in coaxial lines.” Water Resources Research, 24(7), 945-952.
US Environmental Protection Agency (2002). “Municipal solid waste in the United States: 2000 Facts and Figures.” Office of solid waste and emergency response (5305W). EPA530-R-02-001. US Environmental Protection Agency, Cincinnati, OH.
Walsh, J. J., and R. N. Kinman (1982). “Leachate and gas production under controlled moisture conditions”. EPA-600-9-82-002. US Environmental Protection Agency, Cincinnati, OH.
Warith, M. A. (2002). “Bioreactor landfills: experimental and field results.” Waste Management, 22, 7-17.
Warith, M. A., and R. Sharma (1998). “Review of methods to enhance biological degradation in sanitary landfills.” Water Quality Research Journal of Canada, 33(3), 417-437.
Wigh, R. J. (1979). “Boone County Field study Interim Report.” EPA-600-2-79-058. U. S. Environmental Protection Agency, Cincinnati, OH.
Williams, J., B. G. Williams, J. W. Holmes, and R. E. Winkworth. (1981). “Application in agriculture, forestry, and environmental science.” Soil water assessment by the neutron method, E. L. Greacen, ed., Commonwealth Scientific and Industrial Research Organization, Australia.
Yuen, S. T. S. (1999). “Bioreactor landfills promoted by leachate recirculation-A full-scale study.” Doctor of Philosophy thesis, Dept of Civil and Environmental Engineering, University of Melbourne, Melbourne.
Yuen, S. T. S., McMohan, T. A, and J. R. Styles (2000). “Monitoring in situ moisture content of MSW landfills.” Journal of Environmental Engineering, 1088-1095.

154
Zegelin, S. J., I. White, and D. R. Jenkins (1989). “Improved field probes for soil water content and electrical conductivity measurement using time domain reflectometry.” Water Resources Research, 25, 2367-2376.
Zeiss, C., and W. Major (1993). “Moisture Flow Through Municipal Solid Waste: Pattern and Characteristics.” Journal of Environmental Systems, 22(3), 211-232.
155
BIOGRAPHICAL SKETCH
Sreeram Jonnalagadda was born on July 14, 1978, in Warangal, India. He opted to
study mathematics, physics and chemistry as his major subjects in high school and
graduated from high school in August 1996. He enrolled in the Indian Institute of
Technology, Bombay, in August 1997, and graduated with a Bachelor of Technology
degree in civil engineering in May 2001.
In June 2001, he enrolled in graduate school in the Environmental Engineering
Sciences Department at the University of Florida to study solid and hazardous waste.