resilience.io wash prototype debut workshop - gama
TRANSCRIPT
Resilience.IO WASH Prototype
Rembrandt Koppelaar, Xiaonan Wang,
Department of Chemical Engineering, Imperial College London, UKIIER – Institute for Integrated Economic Research
Accra - June 2016
Resilience.IO platform
Resilience.IO Overview
2

We need realistic insights to understand which investment and policy decisions in reality can work to achieve our plans
To evaluate the result of decision options
Expectations, Goals, Plans
Investment and policy decisions
2015 2020 2025Option A
Option B
Option C
Decision choice
?
Situation todayAims for this decadeFuture changes Environmental, Economic, Social Needs

n A data-driven simulation model of a synthetic population
n To experiment with different scenarios by generating demand profiles, and to find supply from a description of technologies and networks using optimisation with key performance metrics
n A fully open-source approach at ‘laptop’ scale
The approach: Resilience.IO Model
4
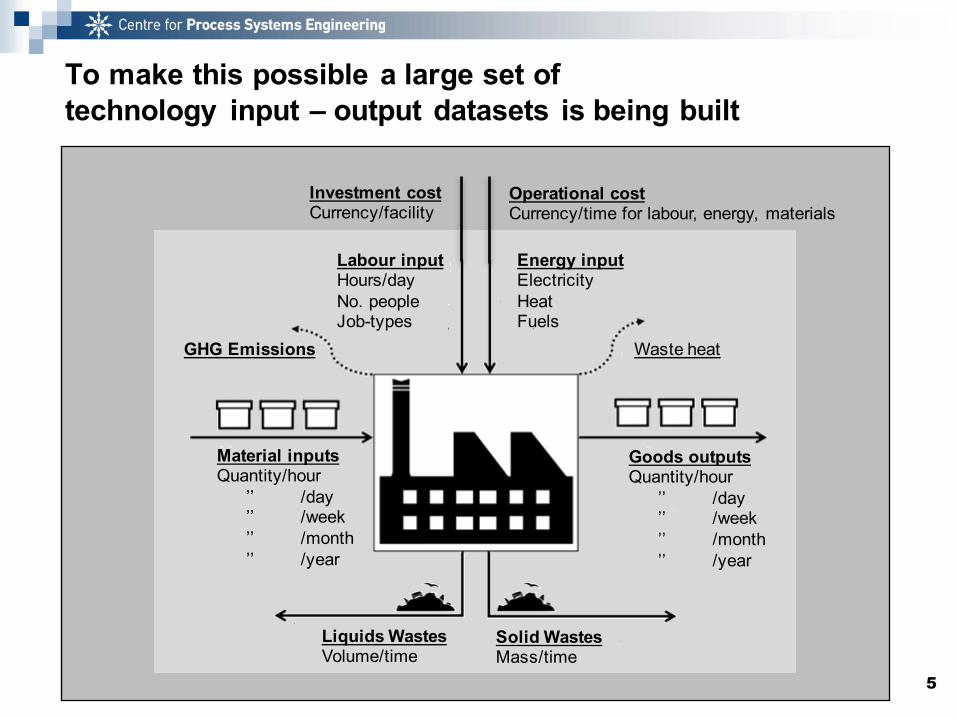
To make this possible a large set of technology input – output datasets is being built
5
Labour inputHours/dayNo. peopleJob-types
Waste heat
Material inputsQuantity/hour
’’ /day’’ /week’’ /month’’ /year
Goods outputsQuantity/hour
’’ /day’’ /week’’ /month’’ /year
Energy inputElectricityHeatFuels
Liquids WastesVolume/time
Solid WastesMass/time
GHG Emissions
Operational costCurrency/time for labour, energy, materials
Investment costCurrency/facility

6
Technology example – Sachet Water Facility
Sachet Bag ProductionFacility
Labour hours – 4 hours per m3
HDPE sachet bags – 7.7 kg/m3
HDPE container bags – 0.6 kg/m3
Electricity – 15.1 MJ/m3
Jobs – 3 jobs per 1100 m3
Sachet – 1 m3
2000 x 500 mlGasoline – 19.4 MJ/m3
Carbon dioxide – 1.39 kg/m3
Water vapour – 0.64 kg/m3
Nitrogen emissions – 5.85 kg/m3
Plastic Waste – 8.3 kg/m3

7
Technology example – Sachet Water Facility
Sachet Bag ProductionFacility
Labour hours – 4 hours per m3
HDPE sachet bags – 7.7 kg/m3
HDPE container bags – 0.6 kg/m3
Electricity – 15.1 MJ/m3
Jobs – 3 jobs per 1100 m3
Sachet – 1 m3
2000 x 500 mlGasoline – 19.4 MJ/m3
Carbon dioxide – 1.39 kg/m3
Water vapour – 0.64 kg/m3
Nitrogen emissions – 5.85 kg/m3
Plastic Waste – 8.3 kg/m3
Example: the estimated sachet water in 2015 used is 1015 m3 per day (+- 2 million sachet bags of 500 ml) à 8.4 tons of HDPE plastic waste
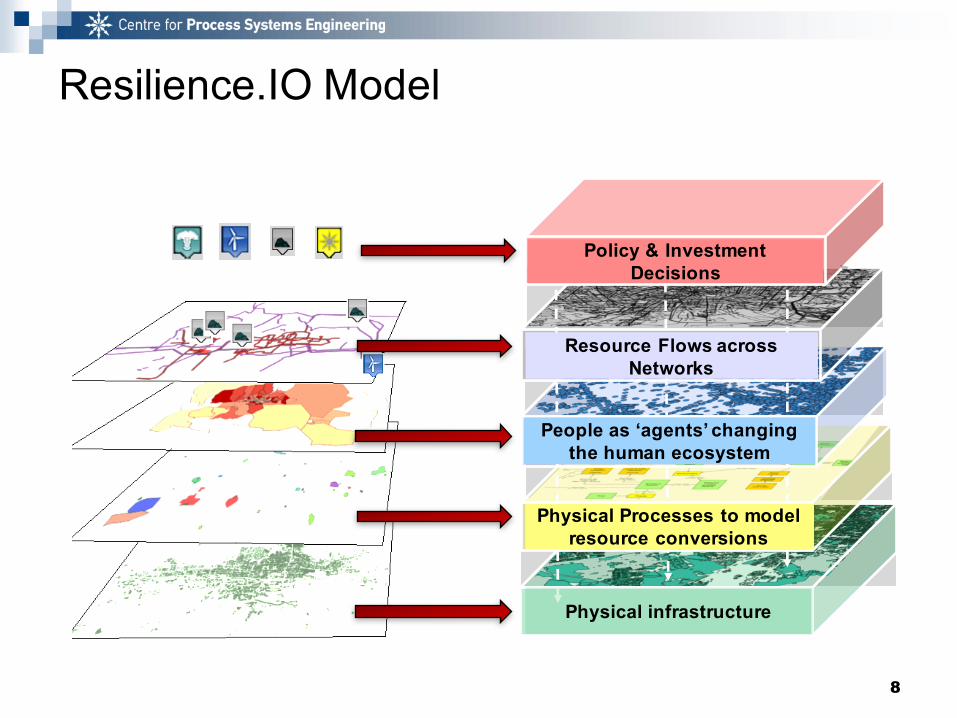
Resilience.IO Model
8
Physical infrastructure
Physical Processes to modelresource conversions
People as ‘agents’ changing the human ecosystem
Resource Flows across Networks
Policy & Investment Decisions

Application: WASH in GAMA
9
n Explore per district water and wastewater relatedoutcomes for the Greater Accra Metropolitan Area:
n Socio-economic scenariosn Source water treatmentn Potable water distributionn Water demands and usagen Toilet usen Waste water collectionn Waste water treatment

Simulating water and sanitation demands
10

Population characteristics
11
Agent

Data-driven Synthetic populationn A population “in the computer” is generated based on
real data collected for GAMA, leading to a representative synthetic population (~0.1% of real population)
n Socio-economic data inputs¨ Gender (male or female)¨ Age (0-14 years or 15+)¨ Work force status (Employed / Not active or unemployed)¨ Income status (Low income / Medium income / High income)
n Spatial data inputs¨ Home location (point in district)¨ Work location, based on distance from home
12

Calculation method (simplified)
13
n The population characteristics sets the water demands for each individual (e.g. lower income à lower water demands)
n The water use is evaluated for every 5 minutes based on a time dependent mathematical function.
n Multiply output to aggregate total water demands of the whole population

Similar approach for toilet usagen Total toilet use profile per MMDA over 24 hours
14
Use Times
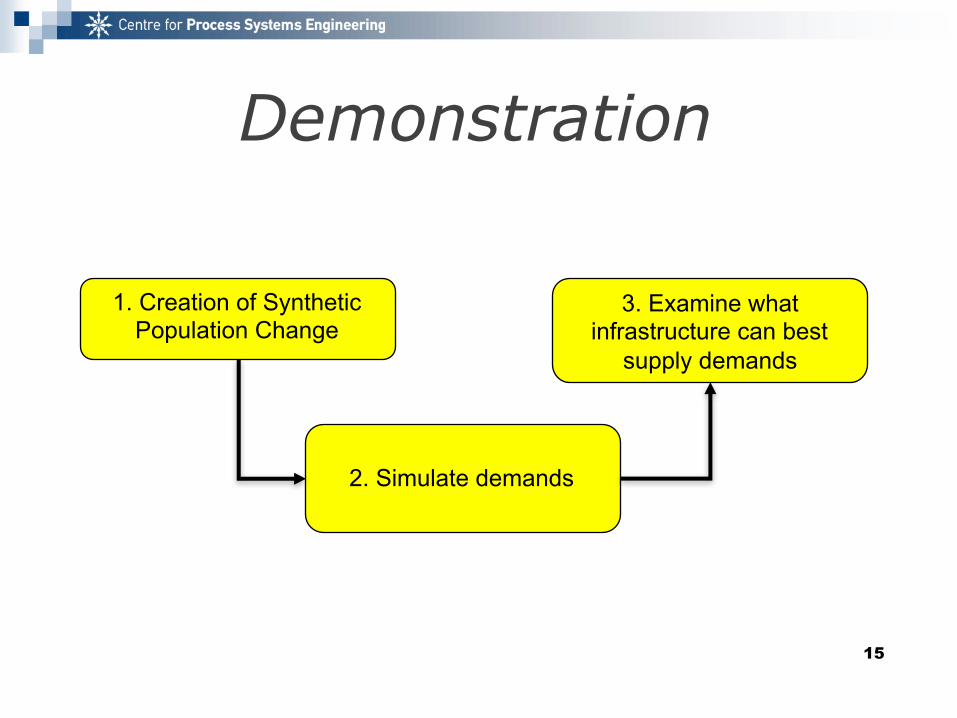
Demonstration
15
1. Creation of Synthetic Population Change
2. Simulate demands
3. Examine what infrastructure can best
supply demands

What happens? Calculation (simplified)
Various settings:
n Initialize model with demands (set by user or from simulation)
n Set initial infrastructure (facilities, pipes, their technology, capacity),and capital and operational cost values.
n Set desired objectives for calculation: a) to meet % demands forpotable water and b) to achieve % wastewater treatment,
Model calculates how to meet these targets by optimisation, set in oursimulation to find the lowest cost and GHG emissions, taking intoaccount all the additional settings.
16
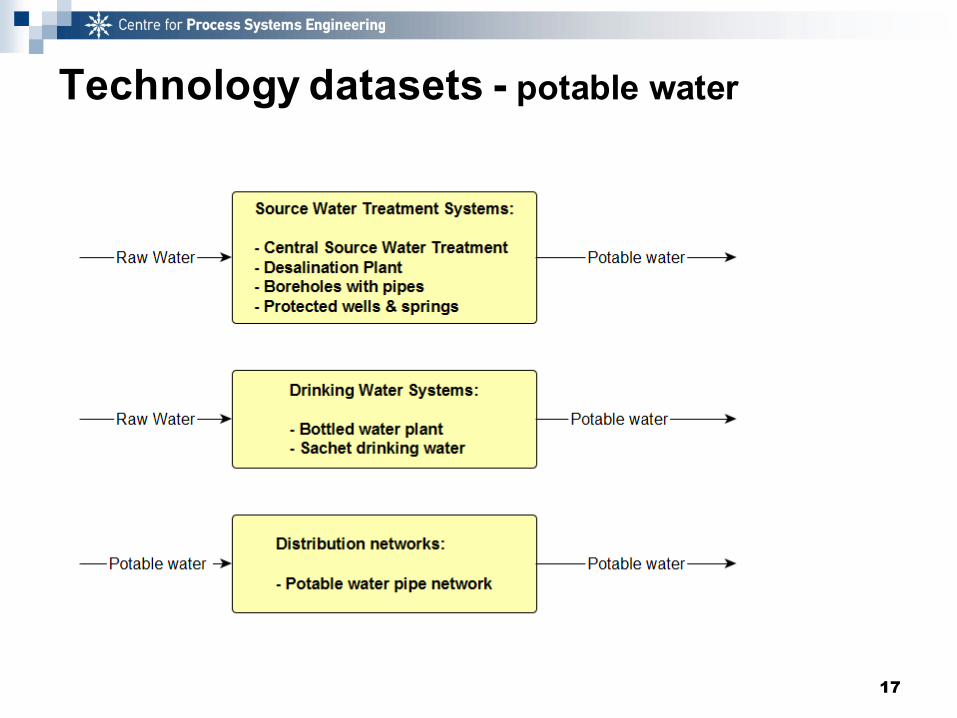
Technology datasets - potable water
17

Technology datasets - wastewater
18

Many additional settings in prototype
19
Simulated or user set demands
Inputs – outputs- Materials - Energy - Labour
Demands
Capacity & load
Technology facility
Facility Investment
Operational Cost
Networks
Pipe leakage %
Already available facilities
Already available connections
Newly allowed connections
Water use per population characteristic
Birth / Deathratesand Migration
Finance
Tarriffs for water, wastewater, and toilet usage
Energy cost per MJ / kWh and labour cost per hour

Use Cases
20

Use Cases to demonstrate the Model
21
n Three use cases were selected by the GAMA TechnicalGroup in Accra, and developed to demonstrate thefunctionality of the model from a user perspective:
¨ Use Case 1 – Assess outcomes of ongoing WASH projects andgaps towards meeting macro-level targets for planning
¨ Use Case 2 – Examine possibilities and costs to increasehousehold access to improved potable water sources
¨ Use Case 3 – Analyse the availability of clean, accessible andaffordable toilet infrastructure

Which use case / scenarios to dive into?
22
Use Case 3
Toilets & Waste-water
Use Case 1:
Water & Waste-water
Baseline
Use Case 2
Water supply
Baseline
City-Wide
Decentralised districts
Low pipe leakage variants
Local Pipe Source
Central Pipe Source
High immigration variants
Baseline
Public toilet and local district treatment
Sustainable Development Goal targets
Private toilets and central GAMA treatment

Use Case 1 Results
23

Use Case 1 “On-going projects”
24
n Baseline Scenario A) - assess water and waste-watersituation from 2010 to 2030 including on-going projectsunderway since 2010 (investment already secured)
n Assess how to meet 100% improved water and waste-water demands via scenario “B) City-Wide Systems”and scenario “C) Decentralised Districts”
n Additional scenario’s of B) and C) with “Leakagereduction” where a 10% reduction in pipe leakagefrom 27% to 17% is set.
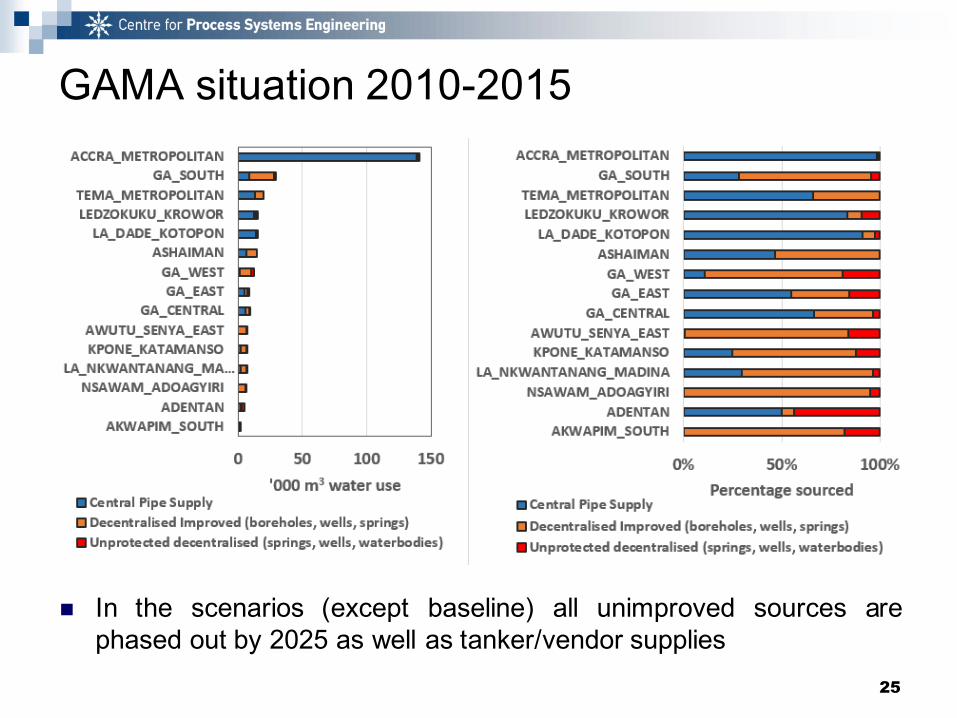
GAMA situation 2010-2015
25
n In the scenarios (except baseline) all unimproved sources arephased out by 2025 as well as tanker/vendor supplies

Baseline Scenario included projects for potable water
26
n On-going / completed projects 2010 - 2025:¨ Kpone China Gezhouba (186,000 m3/day)¨ Kpone Tahal (28,000 m3/day)¨ Teshie Desalination plant (60,000 m3/day)¨ GAMA additional boreholes (21,000 m3/day)
n Not included – already planned:¨ Asutuare project at Volta River (200,000 m3/day)

Results – Use Case 1 “Baseline Scenario”
27
Simulated Values 2015 2025Population 4.39 million 5.68 million
Water Net Demand (no leaks) 391 thousand m3/day 509 thousand m3/day
Water Losses (27% leaks) 226 thousand m3/day 270 thousand m3/dayTotal Gross Demand (incl. leaks) 617 thousand m3/day 779 thousand m3/day
Total Potable Water Production 501 thousand m3/day 652 thousand m3/dayImproved water % Access 70.3% 75.1%
n Values for Potable Water
n Conclusion: Additional treatment capacity needed tosatisfy growing population water demands

2015 : Existing potable water pipe connections
28
Results – Use Case 1 “Baseline Scenario”
29
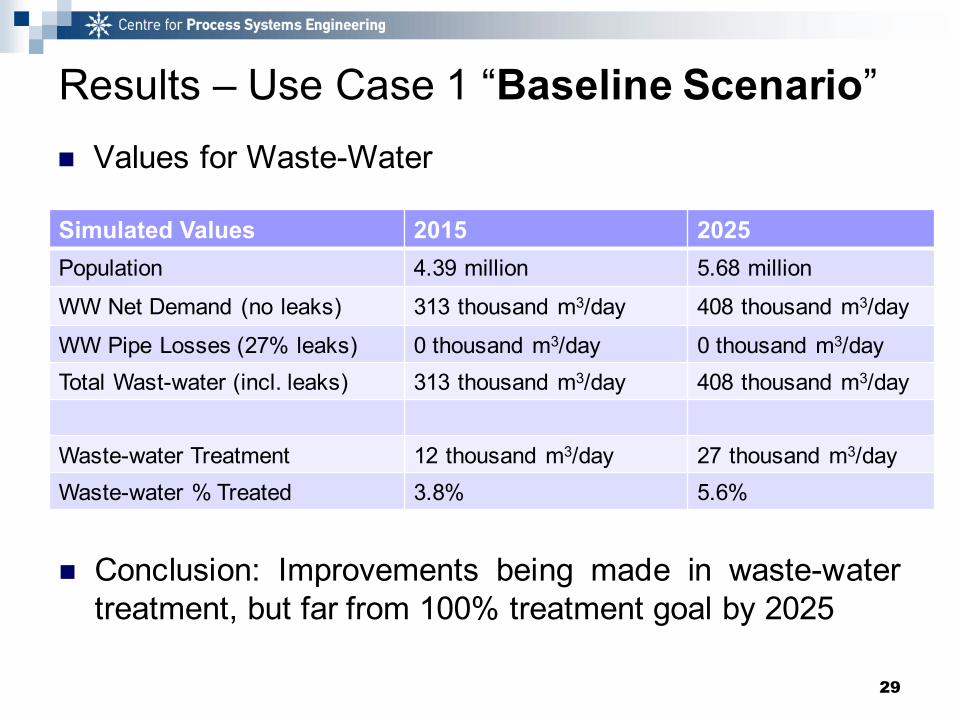
Simulated Values 2015 2025Population 4.39 million 5.68 million
WW Net Demand (no leaks) 313 thousand m3/day 408 thousand m3/day
WW Pipe Losses (27% leaks) 0 thousand m3/day 0 thousand m3/dayTotal Wast-water (incl. leaks) 313 thousand m3/day 408 thousand m3/day
Waste-water Treatment 12 thousand m3/day 27 thousand m3/dayWaste-water % Treated 3.8% 5.6%
n Values for Waste-Water
n Conclusion: Improvements being made in waste-watertreatment, but far from 100% treatment goal by 2025

Results – Use Case 1 “Baseline Scenario”
30
Water Demand and Waste-water profile for 2025 for Baseline Scenario

Results – Use Case 1 “Baseline Scenario”
31
Water Demand and Production per District 2025 - % water demand met?
§ VOLTA RIVER provides an additional 388 thousand m3/day supply oftreated water.

Results – Use Case 1 “Baseline Scenario”
32
Electricity use per District 2025
n Conclusion: Electricity use for potable water increasedsubstantially due to new 60,000 m3/day desalinationplant

Results – Use Case 1 “Baseline Scenario”
33
Operational cost values per district in 2025

Results –“City-Wide Scenario”
34
Simulated Values Potable 2015 2025Population 4.39 million 5.68 million
Water Net Demand (no leaks) 391 thousand m3/day 509 thousand m3/day
Water Losses (27% leaks) 226 thousand m3/day 280 thousand m3/dayTotal Gross Demand (incl. leaks) 617 thousand m3/day 789 thousand m3/dayTotal Potable Water Production 501 thousand m3/day 789 thousand m3/dayImproved water % Access 70.4% 100%
Simulated Values Waste-Water 2015 2025WW Net Demand (no leaks) 313 thousand m3/day 407 thousand m3/dayWW Pipe Losses (27% leaks) 0 thousand m3/day 30 thousand m3/dayTotal Waste-water (incl. leaks) 313 thousand m3/day 437 thousand m3/day
Waste-water Treatment 12 thousand m3/day 437 thousand m3/dayWaste-water % treated 3.8% 100%

Results –“City-Wide Scenario”
35
Potable Water Investment 2015 2025Conventional Water Treatment n/a 559 thousand m3/day
Total Capital Costs 2015-2025 0.99 billion USDWaste-Water InvestmentCentral Waste-Water Treatment n/a 259 thousand m3/dayAerated Lagoon Systems n/a 419 thousand m3/dayDecentralised activated sludge n/a 63 thousand m3/dayTotal Capital Costs 2015-2025 1.0 billion USDPipeline expansionsPotable Trunks 2015-2025 n/a 11Cost of pipe expansion n/a 0.23 billion USD
n Conclusion: Additional 200 million USD per year neededto meet 100% access and treatment goals by 2025

Results –“City-Wide Scenario” – Potable + waste
36
Operational situation 2015 (million USD) 2025 (million USD)Total Operational Costs per year 105 136
Of which costs for electricity 2.5 18.2Of which costs for labour 15.1 21.2
Revenues from water sales* 62.6 100.3Revenues from sewerage 0.3 35.1
Costs per Citizen (USD) 23.9 24.0
n Conclusion: Revenues sufficient to meet operationalcosts under central expansion - if NRW reduced
*If all water users paid at 2016 tariffs!

Results –“City-Wide Scenario” – Potable + waste
37
Operational situation 2015 (million USD) 2025 (million USD)GHG emissions in kg per m3 6.7 60.7Total electricity use in million kWh 35.7 174.9Electricity use in kWh per m3 69.5 204.4
Total jobs for Water and WW 3081 4328Labour hours per m3 12.4 7.1
n Conclusion: Substantial expansion in electricity use,GHG emissions due to waste-water treatment, and jobsin meeting 100% targets by 2025

2025 : New pipes suggested to meet 100%improved water demands
38

2025 : Potable water flows simulated with newinfrastructure in m3 per day (excludes leaks)
39

Results – Use Case 1 “City-Wide Scenario”
40
Operational cost values per district in 2025

Results –“Decentralised Districts Scenario”
41
Simulated Values Potable 2015 2025Population 4.39 million 5.68 million
Water Net Demand (no leaks) 391 thousand m3/day 509 thousand m3/day
Water Losses (27% leaks) 226 thousand m3/day 430 thousand m3/dayTotal Gross Demand (incl. leaks) 617 thousand m3/day 939 thousand m3/dayTotal Potable Water Production 501 thousand m3/day 939 thousand m3/dayImproved water % Access 70.4% 100%
Simulated Values Waste-Water 2015 2025WW Net Demand (no leaks) 313 thousand m3/day 407 thousand m3/dayWW Pipe Losses (27% leaks) 0 thousand m3/day 0 thousand m3/dayTotal Waste-water (incl. leaks) 313 thousand m3/day 407 thousand m3/day
Waste-water Treatment 12 thousand m3/day 407 thousand m3/dayWaste-water % treated 3.8% 100%
Results –“Decentralised Scenario”
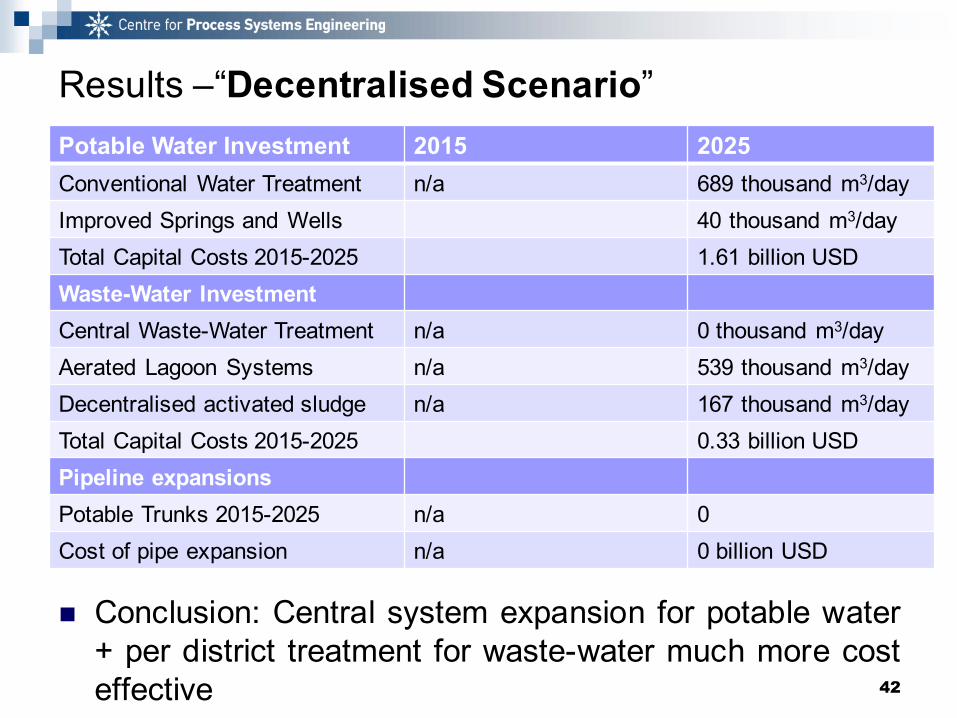
42
Potable Water Investment 2015 2025Conventional Water Treatment n/a 689 thousand m3/dayImproved Springs and Wells 40 thousand m3/dayTotal Capital Costs 2015-2025 1.61 billion USDWaste-Water InvestmentCentral Waste-Water Treatment n/a 0 thousand m3/dayAerated Lagoon Systems n/a 539 thousand m3/dayDecentralised activated sludge n/a 167 thousand m3/dayTotal Capital Costs 2015-2025 0.33 billion USDPipeline expansionsPotable Trunks 2015-2025 n/a 0Cost of pipe expansion n/a 0 billion USD
n Conclusion: Central system expansion for potable water+ per district treatment for waste-water much more costeffective

2025 : Potable pipe flows within existinginfrastructure in m3 per day (excludes leaks)
43

Results – Use Case 1 “Decentralised”
44
District by district capacity for aerated lagoon treatment in 2025

Results – Use Case 1 “Decentralised”
45
District by district capacity for activated sludge treatment in 2025

Results – Use Case 1 “Decentralised”
46
District by district waste-water investment expenditure

Results – Leakage Costs
47
Simulated Values City-wide 27% leakage - 2025 17% leakage - 2025Potable Water Leakage m3/day 280 thousand
m3/day180 thousand
m3/day
Gross Water Treatment needs (including leaks) 802 thousand
m3/day 702 thousand
m3/day
Additional investment cost 2015 – 2025 for 100% improved potable water access
999 million USD 680 million USD
Total System Operational costs per year 136 million USD 126 million USD
n Conclusion: A 10% reduction in pipe water leakageresults in 300 million USD lower investment needs and a10 million USD per year operational cost reduction

Use Case 2 Results
48

Use Case 2 “Improved Potable Water Sources ”
49
n Baseline Scenario A) - assess water and waste-watersituation from 2010 to 2030 including on-going projectsunderway since 2010 (investment already secured)
n Assess how to meet 100% improved water demands viascenario “B) Local Pipe Source” and scenario“C) Central Pipe Source only”
n Additional scenario’s of A), B) and C) with “HighImmigration” where the population immigration rate is50% higher then in the baseline

Results Comparison –“Central Pipe Immigration”
50
Central Pipe 2015 2025Population 4.39 million 5.68 million
Water Net Demand (no leaks) 391 thousand m3/day 509 thousand m3/day
Water Losses (27% leaks) 226 thousand m3/day 281 thousand m3/dayTotal Gross Demand (incl. leaks) 617 thousand m3/day 790 thousand m3/dayTotal Potable Water Production 501 thousand m3/day 790 thousand m3/dayImproved water % Access 70.3% 100%
Central Pipe w. high Immigration 2015 2025Population 4.70 million 7.02 millionWater Net Demand (no leaks) 417 thousand m3/day 629 thousand m3/dayWater Losses (27% leaks) 229 thousand m3/day 309 thousand m3/dayTotal Gross Demand (incl. leaks) 646 thousand m3/day 938 thousand m3/dayTotal Potable Water Production 513 thousand m3/day 938 thousand m3/dayImproved water % Access 68.0% 100%

Results - Central Pipe Immigration”
51
Central Pipe 2015 2025Conventional Water Treatment n/a 663 thousand m3/dayPotable Trunks 2015-2025 n/a 6Total Capital Costs 2015-2025 1.18 billion USD
Central Pipe w. High ImmigrationConventional Water Treatment n/a 893 thousand m3/dayPotable Trunks 2015-2025 n/a 7
Total Capital Costs 2015-2025 1.65 billion USD
n Conclusion: About 230,000 m3/day of capacity isrequired to meet 100% improved water access by 2025for high immigration, with an additional cost of 470million USD

Results –“Central Pipe + Immigration”
52
Operational situation 2025 (baseline)(million USD)
2025 (Central Pipe)(million USD)
2025 (Central Pipe)(million USD)
Population as per baseline
High immigration
Total Operational Costs per year 166 81 94Of which costs for electricity 12.6 9.1 9.9
Of which costs for labour 18.6 1.8 2.1
Revenues from water sales* 100.4 100.3 123.9
Costs per Citizen (USD) 29.2 14.3 13.4
n Conclusion: Replacing local boreholes, spring, and wellsystems with central conventional water treatmentsubstantially reduces system-wide operational costs

Use Case 3 Results
53

Use Case 3 “Availability of clean, accessible, and affordable Toilet infrastructure”
54
n A) Baseline Scenario - assess waste-water andsanitation situation from 2010 to 2030 including on-goingprojects underway since 2010 (investment alreadysecured)
n B) Public toilet & decentralised treatment – toiletdemands are met by public infrastructure with localdistrict treatment options (no pipe flows)
n C) Private toilet & centralised treatment - toiletdemands are met by private infrastructure with centralfaecal sludge treatment via a central waste-waternetwork

Results – “Private Central System”
55
Population and Demands 2015 2025Population 4.39 million 5.68 million
Faecal Sludge Generation 6,651 m3/day 8,708 m3/dayWaste-Water Treatment Needs 243 thousand m3/day 325 thousand m3/dayPrivate Toilet Centralised 2010-2015 2015-2025Private Toilets Built 103 thousand 309 thousandCentral Waste Water Treatment 0 thousand m3/day 856 thousand m3/dayAerated Lagoon Treatment 0 thousand m3/day 0 thousand m3/dayDecentralised Activated Sludge 0 thousand m3/day 0 thousand m3/dayFaecal Sludge Separation & Drying 8.4 thousand m3/day 3.6 thousand m3/dayFaecal Septage Plant UASB 0 thousand m3/day 0 thousand m3/day

Results – Use Case 3
56
District by district Faecal Sludge Production in 2025
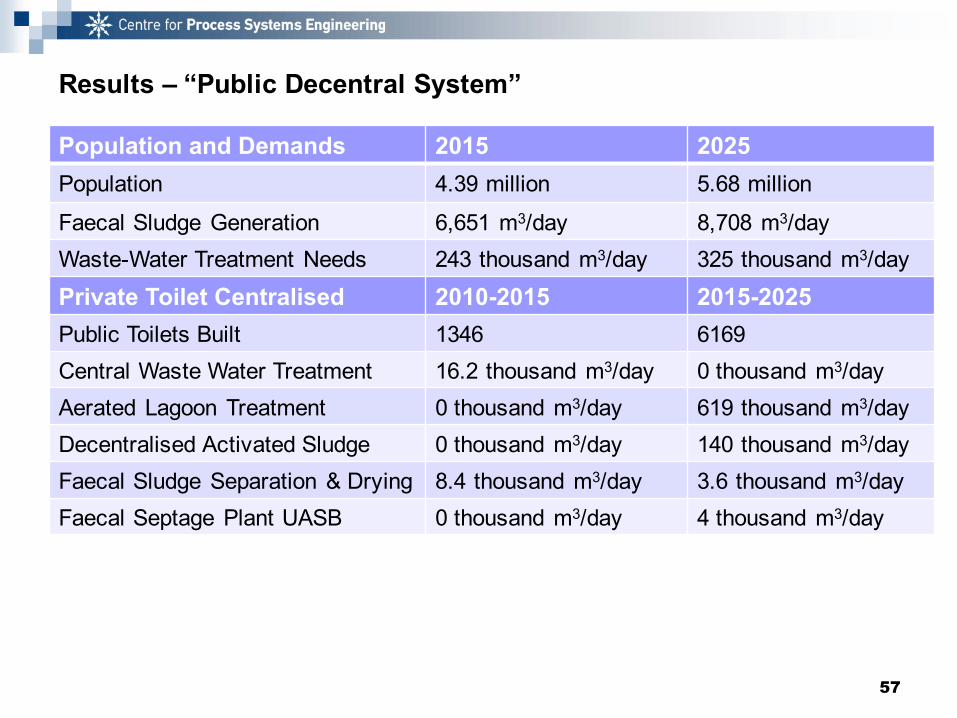
Results – “Public Decentral System”
57
Population and Demands 2015 2025Population 4.39 million 5.68 million
Faecal Sludge Generation 6,651 m3/day 8,708 m3/dayWaste-Water Treatment Needs 243 thousand m3/day 325 thousand m3/dayPrivate Toilet Centralised 2010-2015 2015-2025Public Toilets Built 1346 6169Central Waste Water Treatment 16.2 thousand m3/day 0 thousand m3/dayAerated Lagoon Treatment 0 thousand m3/day 619 thousand m3/dayDecentralised Activated Sludge 0 thousand m3/day 140 thousand m3/dayFaecal Sludge Separation & Drying 8.4 thousand m3/day 3.6 thousand m3/dayFaecal Septage Plant UASB 0 thousand m3/day 4 thousand m3/day

Results – “Public Decentral” vs “Private Central”
58
Private Central (billion USD) 2010-2015 2015-2025Capital expenditure for treatment 0.02 2.79Capital expenditure for private toilets* 0.025 0.099Total Capital Costs 0.045 2.89
Public Decentralised (billion USD) 2010-2015 2015-2025Capital expenditure for treatment 0.09 0.26Capital expenditure for public toilets* 0.042 0.192
Total Capital Costs 0.132 0.352
n Conclusion: the decentralised local treatment of waste-water and faecal sludge, in combination with public toiletsystems would be much more cost effective
*Based on a 244 USD cost for a private toilet, and a 31 thousand USD cost for a public toilet** Private toilets with a central treatment system become economically favourable when the cost to build one public toilet increases to more than 678.4 thousand USD

Results – Use Case 3 - “Private Centralised”
59
District by district Private Toilet Needs in 2025

Results – Use Case 3 - “Private Centralised”
60
District by district Central Waste Water Treatment in 2025

Results – Use Case 3 - “Private Centralised”
61
Waste-water + faecal sludge pipe flow map for 2025

Results – Use Case 3 - “Public Decentralised”
62
District by district Public Toilet Use Times per day (every 5 minutes)
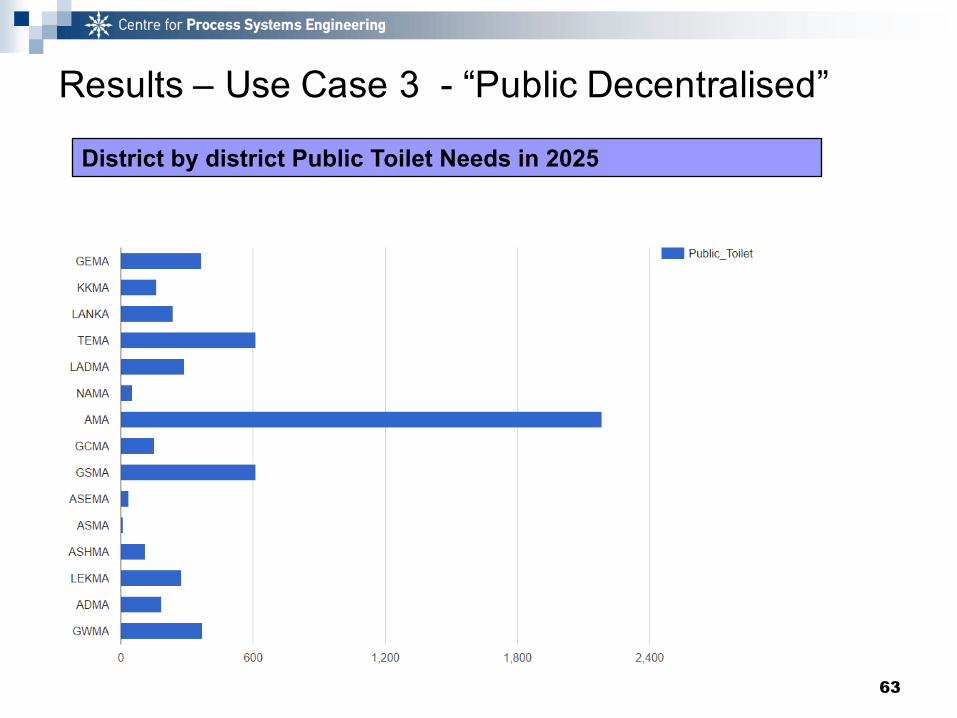
Results – Use Case 3 - “Public Decentralised”
63
District by district Public Toilet Needs in 2025

Results – Use Case 3 - “Public Decentralised”
64
District by district Aerated Lagoon Capacity in 2025
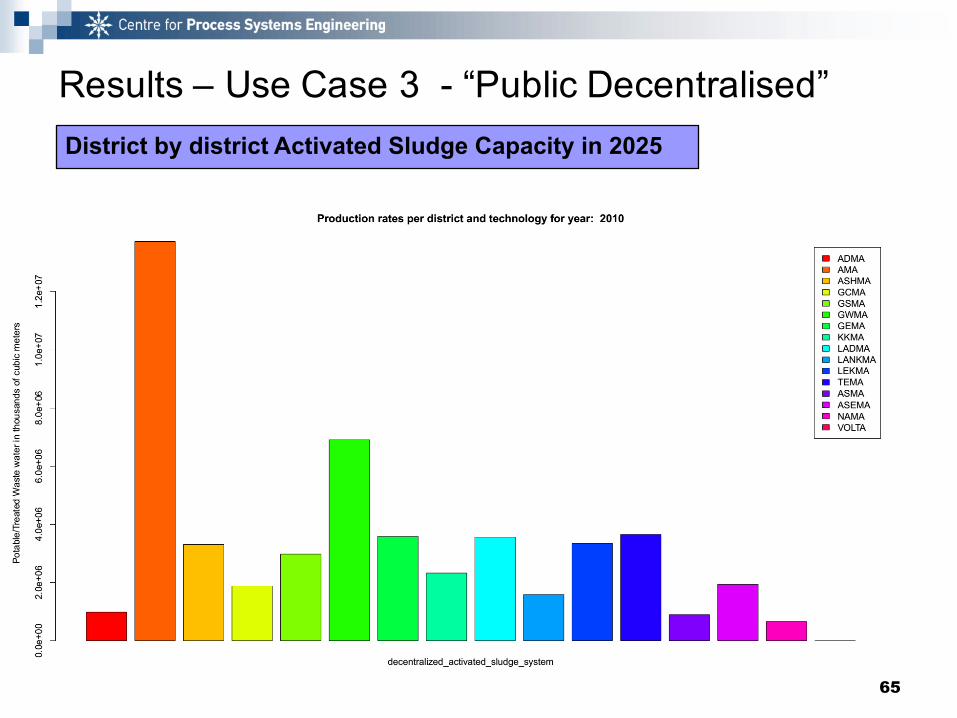
Results – Use Case 3 - “Public Decentralised”
65
District by district Activated Sludge Capacity in 2025

Results – Use Case 3 - “Public Decentralised”
66
District by district Faecal Sludge Separation & Drying in 2025

Q & A / Interactive
67

Many additional settings in prototype
68
Simulated or user set demands
Inputs – outputs- Materials - Energy - Labour
Demands
Capacity & load
Technology facility
Facility Investment
Operational Cost
Networks
Pipe leakage %
Already available facilities
Already available connections
Newly allowed connections
Water use per population characteristic
Birth / Deathratesand Migration
Finance
Tarriffs for water, wastewater, and toilet usage
Energy cost per MJ / kWh and labour cost per hour

Next phase(s) of the project
n Construction of user friendly GIS graphical interface, toupload data, run the model, and see results.
n Multi-sector model¨ water-energy-food nexus integrated modelling
¨ entire urban economy (15 sectors)
n Domain use expansions¨ Socio-economic dynamics
¨ Happiness and health metrics
¨ Climate scenarios and flooding
69