residual strength and crack propagation ......i nasacontractor report ur h 0 cv m u i residual...
TRANSCRIPT

I
N A S A C O N T R A C T O R
R E P O R T
ur h 0 cv M u
I
RESIDUAL STRENGTH AND CRACK PROPAGATION TESTS O N C-130 AIRPLANE CENTER WINGS WITH SERVICE-IMPOSED FATIGUE DAMAGE
N A T I O N A L A E R O N A U T I C S A N D S P A C E A D M I N I S T R A T I O N W A S H I N G T O N , D . C. JULY 1972
I
https://ntrs.nasa.gov/search.jsp?R=19720021249 2020-04-25T08:03:09+00:00Z

r T
1. Report No. 2. Government Accession No.
NASA CR-2075 4. Title and Subtitle
RES~IUAL STRENGTH AND CRACK PROPAGATION TESTS ON 0130 mm CENTER WINGS WITH sERvI%IMPOSED FATIGUE DAMAGE
9. Performing Organization Name and Address
Fockheed4korgia Campany Marietta, Ga. 3060
2. Sponsoring Agency Name and Address
National Aeronautics and Space Administration Washington, D.C. 20546
5. Supplementary Notes
Supplementary information available in NASA CR I22008
3. Recipient's C a t a l o g No.
5. Repoh Date JULv 1972
6. Performing Organization Code
8. Performing Organization Report No. ER u178
10. Work Unit No.
12&14-1541
11. Contract or Grant No.
NAS 14485 .
13. Type of Report and Period Covered
Contractor Report
14. Sponsoring Agency Code
6. Abstract
Fourteen C l 3 O airplane center wings, each containing service-imposed fatigue damage resu l t ing from 4000 t o 13000 accumulated f l i g h t hours, were tes ted to determine their fa t igue crack propagation and static residual strength characterist ics. Eight wings were subjected
t o a tw-tep c o n s t a 1 w l i t u d e f a t i g u e test pr ior to s ta t ic t es t ing . Cracks up t o 30 inches long were generated in these tes ts . Residual s ta t ic s t rengths of these wings ranged from 56 t o 87 percent of limit load. The remaining s i x wings containing cracks up t o 4 inches long
were s t a t i ca l ly t e s t ed as received from field service. Residual static strengths of these
wings ranged from 98 t o 117 percent of limit load. Damage to le ran t s t ruc tura l &sim features such as fastener holes, stringers, doublers around door cutouts, and spanwise panel splices
proved t o be very effective in retarding crack propagation.
7. Key Words (Suggerted by Authoris) j 18. Distribution Statement Fdl-cca le a i rc raf t wings Fatigue crack propagation Unclassified - Unlimited
Static residual strength
"_ 9. Security 4 Uanif. (of this report) 20. Security Classif. (of this page)
Unclassified Unclassified $3.00 ' 67
For sale by the National Technical Information Service, Springfield, Virginia 22151

RESIDUAL STRENGTH AND CRACK PROPAGATION TESTS
ON C-130 AIRPLANE CENTER WINGS
WITH SERVICE-IMPOSED FATIGUE DAMAGE
H. Lawrence Snider, Franklin L. Reeder, and William Dirkin
Lockheed-Georgia Company
SUMMARY
Fourteen C-130 airplane center wings with 4,000 to 13,000 flight hours and associated
fatigue damage were tested to destruction. Six wings were tested for static residual
strength as received from field service. The other eight wings were tested i n crack
propagation cyclic testing at a prescribed stress level for 10,000 cycles, or less. Then
the stress level was reduced, and testing to a maximum of 20,000 total cycles was
conducted. Testing was performed with constant-amplitude stress at a stress ratio of 0.1 . Maximum cyclic stresses were approximately 18,000 psi. At the conclusion of cyclic
testing, a static residual strength test was conducted.
Static residual strength of the specimens as received (without prior test cycling) ranged
from 98 percent to 117 percent limit load. Some of these specimens had init ial crack
lengths of 4.0 inches or more. The theoretical (Miner's expression) fatigue damage
experienced by these wings during flight service ranged from .61 to 1.26; there was no
evident correlation between service-imposed fatigue damage and static residual strength.
The static residual strength of the wings which had been subjected to up to 20,000
crack propagation test cycles ranged from 56 percent to 87 percent l im i t load. Some
specimens had cracks greater than 30 inches at the conclusion of cyclic testing. Theo-
retical calculations (Miner's expression) of fatigue damage imposed by test cycling
ranged as high as 7.
Several damage tolerant structural design features proved to be effective in retarding
crack propagation. The fastener holes i n the skin occasioned by the "built-up" type

of wing construction were quite effective, as there were many instances of fatigue
cracks entering into, and then residing in, fastener holes or stopdrilled holes for
thousands of load cycles. Reinforcements such as stringers and doublers around door
cutouts consistently arrested the growth of skin cracks by redistribution of stresses
near the crack tips, even when corner cracks had init ial lengths greater than 4.0
inches. The spanwise splices associated with the use of multiple spanwise skin panels
repeatedly arrested or retarded crack propagation.
The number of instances in which the largest ini t ial cracks failed to propagate appre-
ciably under cyclic testing, with eventual failure occurring elsewhere, was unexpec-
tedly high.
Most fatigue cracks started at fastener holes near major structural discontinuities,
including termination of reinforcement of corners of cutouts, and r ib attachments to
skin.
INTRODUCTION
Detailed information i s needed concerning the effect of actual service conditions,
particularly service-imposed fatigue damage, on the strength of representative types
of aircraft wing structures. As an aircraft i s used i t accumulates fatigue damage, often
at an increasing rate. As fatigue cracks in the aircraft grow longer, generally their
rate of propagation and the associated risk of catastrophic fatigue failure increases,
thereby requiring more frequent and thorough inspections and repairs so that the air-
plane's safety and rel iabi l i ty are maintained. A definite need exists for experimental
strength data for typical airframe construction which has been subjected to prior
service-imposed fatigue damage, and to obtain these data under realistic test condi-
tions. This program was directed to achieve these objectives by generating experimental
data which include both residual strength and crack propagation behavior from tests
performed on fourteen C-130 wing boxes which have been subjected to service operation
Center wing boxes became available for these tests consequent to a wing modification
program being conducted on C-13OB and E series aircraft in which the original service-
2

damaged center wing boxes were replaced with an improved version. The availability
of these old center wing sections, which have experienced substantial service-imposed
fatigue damage, provides a unique opportunity to conduct crack propagation and
residual strength tests to evaluate strength and fatigue performance in terms of service
history, location and length of cracks, construction details, damage tolerant design
features, load levels, rates of crack propagation under cyclic or increasing static
loading, and other relevant parameters.
Detailed records of the service and environmental experiences of each aircraft, along
with visual inspection of the structure, comprised the basis for selection of test speci-
mens and for correlation with test results. The hundreds of center wing boxes removed
from the aircraft during the current C-130 wing modification program provided a wide
range of selection of test specimens which had varied types of fatigue damage.
The following tests were conducted:
(a) Three upbending tests for static residual strength evaluation (without prior test cycling) .
(b) Four upbending tests for crack propagation cyclic testing at a maximum of 10,000 cycles at one load level, followed by testing at a reduced load level to a maximum total of 20,000 cycles. Static residual strength tests were conducted at the conclusion of cyclic testing.
(c) Three downbending tests for static residual strength evaluation (without prior test cycling).
(d) Four downbending tests for crack propagation cyclic testing at a maximum of 10,000 cycles at one load level, followed by a maximum of 10,000 cycles at a reduced load level. Static residual strength tests were conducted at the conclusion of cyclic testing.
All cyclic testing was conducted with constant amplitude stress at a stress ratio of
R = 0.1. Maximum cyclic loading applied was 50 percent of l imit load, which
results i n nominal tensile stresses of approximately 18,000 psi over a large portion
of the wing surface.
The principal data gathered from the static residual strength tests involve initial crack
length, growth of cracks with increasing load levels, the effect of local construction
3

details on crack growth, and residual strength level. Additional information was
collected from the cyclic tests. Data on relationships among crack propagation; load
level, and number of cycles were gathered. The location and extent of initial damage,
major fatigue test damage, and residual static strength level were recorded. The
effectiveness of several types of damage tolerant design features in retarding crack
growth was observed, including fastener or stopdrilled holes, reinforcing doublers and
stringer flanges, and spanwise panel splices.
Service utilization history of the test specimens has been compiled from fl ight monitor-
ing programs, and enables correlation among airplane usage, ini t ial damage, and
experimental cyclic and static test results. The total information gathered from this
program i s expected to contribute substantailly to the formulation of a method for
estimating the remaining service l i fe and residual strength of fatigue damaged structure.
The very large quantity of test data gathered is included in Reference 1, along with
details of flight service history of the airplanes from which the center wing box test
specimens were removed.
An 18 minute, narrated, color motion picture f i lm was made of the test program.
Several terms which are used repeatedly throughout the text are defined in the Appendix.
TECHNICAL APPROACH
Description of Wing Structure
The structural configuration of the C-130 center wing box is illustrated in Figures 1,
2, 3, and 4 . Gross dimensions of the center wing box are 440 inches span, 80 inches
chord, and 32 inches depth. Each wing box weighs approximately 3800 Ibs.
The upper surface of the wing box i s composed of four panels. Each panel i s approx-
imately 440 inches in span and 20 inches in chord, and is fabricated from machined
7178-T6 aluminum extrusions which have six integral risers spaced at 3.3 inch intervals.
4

Each of these panels i s further stiffened by the installation o f three spanwise stringers
made from 7178-T6 extruded hat sections spaced at 6.6 inch intervals and installed
with riveted attachments except at the spanwise splices. The spanwise splices are butt
joints with an extended leg of a hat section stiffener forming a splice plate and fastened
with steel lockbolts. Basic upper surface skin thickness of the machined panel i s 0.100
inch for the entire span of the center wing. The principal structural discontinuities,
which are illustrated i n Figure 3, occur approximately symmetrically i n both wings, and
are at the transition structure immediately inboard o f the W. S. 220 production joint;
' a t the W. S. 180 access door cutout; the W. S. 120.5 fuel f i l ler cap opening, and at
the inboard (W. S . 105) and outboard (W. S. 135.5) ends of i t s reinforcement doubler;
at the W. S. 61 . 5 wing-fuselage support rib; and at the dry bay access door cutout at
W. S . 1 . 5 and the ends of i t s reinforcing doubler at W. S . 34.5/37.5. These are the
locations where most of the upper surface fatigue cracks originated during service.
The lower surface i s composed of three panels. Each panel i s approximately 440 inches
in span and 26.7 inches i n chord, and i s fabricated from chem-milled 7075-T6 plate
with extruded 7075-T6 hat section stiffeners located at 5.70 inch spacing. The span-
wise splices and attachments for the lower surface are similar to those for the upper
surface. Lower surface skin thickness of the machined panel i s 0.155 inches in the center
region between W. S. 68L and W. S 68R, tapers from 0.155 inches at W. S . 68 (both
wings) to 0.092 inches at W. S. 179, and'remains at 0.072 inches to W. S. 220. The
principal structural discontinuities, which are illustrated in Figure 4 and which occur
approximately symmetrically i n both wings, are in the transition structure immediately
inboard of the W. S. 220 p1od:lction joint; at the W. S . 120.5 fuel bag access door; and
at the ends of the reinforcing I-bcrrm (W. S . 181/176 and W. S. 58) and doubler (W. S. 168 and 73.0) which extend past both sides of the W. S. 120.5 fuel bag access opening.
Wing cross-section geometry i s shown in Figure 2. The front and rear spars are composed
of 7075-T6 aluminum extruded caps with 7075-T6 webs; except in the areas of the nacelle
the webs are 301 Full Hard, 17-7PH, or A M 350 stainless steel (dependent on specific
aircraft serialization).
5

Applied Loads and Stresses
Loads were applied as illustrated in Figure 5. Shear and bending moments are applied
a t both ends of the beam (W. S. 220R and 220L) and reacted by balancing forces at
W. S 61L and 61R. Torsion is generated by applying the resultant shear forces at
prescribed chordwise locations at W . S. 220L and 220R. Magnitudes of a l l three
applied loading conditions are listed in Table 1. Further details are given in Reference
1.
Applied loading conditions for crack propagation test cycling were nearly identical
to the conditions applied in the C-130E TAC Wing Fatigue Test, which was a fu l l -
scale airplane fatigue test program conducted earlier on the C-130 Project. For
upbending, the shape of the bending moment diagram for the C-130E TAC Wing
Fatigue Test i s nearly identical to that for allowable static ultimate strength, so this
loading condition was used for a l l upbending testing both cyclic and static. For down-
bending, the shapes of the bending moment diagrams for the C-130E TAC Wing Test and
for allowable static ultimate strength are different, so separate test loading conditions
were used for static and cyclic testing to represent the appropriate airplane loading
conditions. Condition D-1 was used for a l l downbending cyclic tests and for the
residual strength test of Specimen #6. Condition D-2 was used for the residual strength
tests of Specimens #7, #8, #9, #lo, #11, and #12. Reference 1 provides complete
details on the applied loading conditions.
Approximate wing skin stresses (spanwise) on the tension surface for each of the three
test loading conditions are shown in Figure 6 for 150 percent Limit Load (ultimate
design load) and 50 percent Limit Load. All cyclic crack propagation testing was
conducted at 50 percent Limit Load or less. The stresses shown are nominal values
at each span station, and do not reflect some chordwise variation in stress due to small
changes in wing depth or the effects of local structural discontinuities or stress concen-
trations.
6

Cyclic Test Load Levels
Fracture mechanics calculations for cracked plates shown in Table 2 were used to
establish init ial cyclic load levels for each test. Very l i t t le crack propagation resulted
when these calculated load levels were applied to the first few specimens. In order to
obtain meaningful crack propagation data, init ial cyclic load levels on subsequent tests
were adjusted on the basis of the crack propagation behavior of proceeding specimens.
Obviously the simplified fracture mechanics calculations did not account for the many
structural design features which effectively resist crack growth.
FI ight Service Experience
The flight hours accumulated on each center wing box are shown in Tables 3 and 4 .
The twelve military aircraft were flown on nine types of missions. The number of
flight hours for each type of mission for each airplane; a definition of each mission i n
terms of f l ight time versus altitude, airspeed, fuel, and cargo; and other related flight
service experience details and fatigue damage information are given in Reference 1 . A
description of the utilization of the two commercial airplanes from which wing boxes
613 and #14 were removed is also given. From this background information a theoretical
comparison of the severity of fatigue damage caused by flight service versus the fatigue
damage caused by test cycling was made for the eight specimens which were test cycled,
as shown in Figure 7.
The results from these tests can be used to show that the e l y l ~ l wing box specimens
tested in the crack propagation tests could have been used in service considerably
longer than they were actually used while maintaining at least the residual strength
levels achieved in subsequent static tests and listed in Tables 3 and 4 .
Strain Survey
A local strain survey of the internal load distribution resulting from the external loads
applied to the wing through the W . 5 . 220 joints at the ends of the test spcimen was
conducted on Specimen #14. Strains were read immediately inboard of the W . S. 220
7

joint for each of the three test loading conditions and for four load conditions of the
C-130E Fatigue Test Program (for which a full-length wing test specimen was used).
The good correlation among these strains and those from the full-length wing indicates
the test loading fixture intmduces realistic airplane-type stress-strain distribution at the
ends of the specimen at W. S . 220L and 'N. S . 220R and therefore accurately simulates
the stresses throughout the entire wing box.
TEST APPARATUS
DESCRIPTION AND VIEWS OF TEST SYSTEM
Specimen Preparation and Test Procedure
Center wing boxes were tentatively selected for testing based on Air Force f ield
inspection reports of fatigue cracking, and followed by visual inspection to verify or
further define the extent of fatigue or cracking i n service.
Some wings had repair patches with a surface area of several square feet. These were
removed to the extent necessary to obtain meaningful crack propagation data, and the
wing restored as nearly as possible to i t s earlier condition of unrepaired damage. X-ray
inspection for the detection of fatigue cracks under repair patches was found to be
helpful, but not always conclusive.
Init ial ly the elastomeric surface coating was removed only in local regions believed to
be fatigue sensitive. For Specimens #7, # lo , # 1 1 , #12, #13, and #14, the entire
tension surface of the wing was stripped to permit unrestricted observation of crack
propagation during testing. Cracks as small as 0.1 inch length could be detected with-
out difficulty by visual inspection of critical regions of the stripped surface; prior
knowledge of prcbable crack-prone locations wos found to be highly important i n the
prompt detection of these s m a l l fatigue cracks. Al l ini t ial crack lengths and their
locations were tabulated prior to the start of testing.
Static residual strength testing was conducted by loading the specimen in successive
increments of 10 percent Limit Load until a major failure occurred across the wing
8

cross section tension surface. Loading was stopped whenever any appreciable sonic
reports were heard, the load was reduced to 20 percent Limit Load for safety during
inspection, crack growths were measured and recorded, then testing was resumed.
Normally the sonic reports associated.with crack growth during static loading were
sharp and distinct, and the associated crack propagation was often several inches i n
length.
Fatigue test cycling was conducted at a rate ranging from two to four cycles per
minute, depending on load level, and wa; determined by the dynamic response of
the loading system. Crack propagation data were recorded at intervals of 500 cycles
or less, or whenever any sonic reports indicating crack propagation occurred. Progress
of crack propagation was marked on thetest specimens to provide visual records, and
photographs were made of many of these locations.
After completion of 20,000 cycles of fatigue testing (or less i f crack propagation
damage was so extensive as to risk failure i f fatigue testing were continued), a static
residual strength test was conducted by the same procedure used for the test specimens
which were not subjected to fatigue test cycling.
TEST RESULTS
Propagation behavior of the largest cracks i s summarized in Table 3 for upbending tests
and in Table 4 for downbending tests. The init ial crack length, crack growth after
cycling, and the final crack length at failure are noted. Failure loads achieved
during residual strength test are shown i n Figure 8 for each test specimen. Notes used
to describe crack length data throughout the report are listed i n Table 5 . The more
important numerical data on extent and location of initial cracking, formation of new
cracks, and crack propagation records are shown in Tables 6 through 15; a comprehensive
crack history for a l l 14 test specimens i s given in Reference 1 .
9

Static Residual Strength Tests
Upbending
Specimens #1, #2, and #3 were tested to evaluate wing lower surface crack propaga-
tion characteristics under increasing levels of static load. Predominant ini t ial damage
from service fatigue on al l three of these specimens was at W. S . 176, near the termin-
ation of the spanwise reinforcing beam (see Figure 4). Their residual strength failure
loads fel l within a narrow range of 114 percent to 116 percent Limit Load at W . S . 176.
Crack history i s shown in Table 6.
Test Specimen # 1 . Test failure i s shown in Figure 9 . Close-up of failure in Figure 10
shows lower surface crosssection details, including hat section stringers. Several
regions of the upper surface experienced compressiontype secondary failures.
Test Specimen #2. Initial damage at W . S . 176L i s shown in Figure 11. Test failure
at this station appean in Figure 12. Secondary upper surface compression damage was
extensive on this specimen, also.
Test Specimen #3. Initial damage at W . S . 176R in region of subsequent specimen
failure i s shown in Figures 13 and 14. Both cracks originated in the double row of
fasteners attaching the reinforcing beam to the skin. This location i s in the vicinity of
the aft end of the engine thrust attachment angle.
The four init ial cracks at the corners of the W . S. 120.5 door cutouts did not propogate.
Downbending
Specimens #6, #7, and #8 were tested to evaluate wing upper surface crack propaga-
tion characteristics under increasing levels of static load. Crack history for these
specimens appear in Table 7.
10

Test Specimen #6. A view of cracks at W. S . 34.5L through the end fasteners of the
reinforcing doubler i s shown in Figure 15. The lighter region on the specimen i s caused
by removal of the elastomeric coating from the surface in the vicinity of initial damage;
darker regions around the edges show where ti le coating remains. Note that the crack
labeled Item 2, which propagated when loading was increased from 70 percent to 80
percent Limit Load, was arrested by the panel splice at its forward terminal and a
fastener hole at i t s aft terminal. In Figure 16, the crack labeled Item 6 propagated
from the edge of the W. S. 120.5 fuel fil ler plate past the fastener hole at 80 percent
Limit Load, then jumped to the edge of the panel splice at 90 percent. This was the
most crack growth observed on any test specimen at this location, although significant
initial damage here was found on several test specimens. Primary failure occurred at
66 percent Limit Load (Condition D-1, Table 1) due to stripping of al l barrel nut
threads i n the tension surface connections at the W . S . 220 joint. Extensive secondary
failures occurred in the nearby box surface and beam structure which prevented the
replacement of barrel nuts and continuation of the test.
Test Specimen #7. This was the only C-130B model tested; a l l others were C-130E
models. Corrosion occurred during service, particularly i n the panels adjoining the
front and rear beam caps, but this had no evident relationship to the initiation or
propogation of fatigue cracking.
Figure 17 shows the small cracks which had formed at the fuel fil ler opening. Both
cracks were arrested by fastener holes.
A close-up view of the failure at W. S. 135R i s shown in Figure 18. Initial crack
lengths are indicated by Items 7, 8, and 9 . These cracks initiated and propagated
through the end fastener holes of the underlying reinforcement doubler. The "fingers"
of the doubler may be seen protruding past the skin fracture surface. This type of
failure (through end row of fastener holes) was observed repeatedly during the test
program. As may be observed in Table 7, this was not the location of maximum
ini t ia l cracking, which was at W . S. 105L.
1 1

Test Specimen #8. Principal initial damage was at the corners of the d&r cutout i n the
vicinity o f W. S. 182 and W. S . 200, i s illustrated i n Figures 19, 20 and 21 . Note that
al l of these cracks had one terminal at the edge of a cutout and the other terminal at a
fastener or stopdrilled hole. As shown in Table 7, none of these cracks propagated
appreciably.
Failure occurred at 117 percent Limit Load at W. S . 61R; no prior cracks had been
reported or observed at this location. Cracking during test cycling was not observed
at this location because the elastomeric coating had not been removed. Post-failure
examination of the fracture surfaces revealed several small fatigue cracks under the
heads of countersunk fasteners. Effective lengths of.small cracks extending on both
sides of countersunk fastener holes were sufficiently large to propagate catastrophi-
cally in the 7178 T-6 material at the stress levels associated with 117 percent Limit
Load, particularly when stress concentration effects around fastener holes are considered
A sirv;!ar type failure occurred during test 110 at W. S . 61 L . However, the elasto-
meric coating had been removed and cracks were monitored visually during the test.
On all subsequent tests (Specimens 110, # 1 1 , #12, #13, and #14) the elastomeric
coating was stripped from the entire tension surface to permit comprehensive visual
inspection for cracks originating at any point, whether cracking was present ini t ial ly
or originated during fatigue test cycling or static residual strength testing.
Cyclic Crack Propagation Test
In a number of tests the largest ini t ial cracks did not propagate appreciably, while
cracks which were in i t ia l ly small - or even non-existent so far as could be observed - began to grow during cyclic testing to the extent that they eventually became the
source of specimen failure. This behavior appeared to be substantially influenced
by the extent of local redistribution of stress into reinforcing structure and/or encounter
with a crack-arresting design feature.
12

Upbending e
Specimens #4, #5, #13, and #14 were tested at a maximum of 10,000 cycles at each
of two load levels to investigate the cyclic crack propagation behavior of the lower
surface. Crack history for these specimens appears in Tables #8, #9, #lo, and # 1 1 .
After the completion of cyclic testing, the same loading condition was applied for
the residual strength test.
Test Specimen 14. Initial damage was at the ends of the reinforcing beams (W. S . 176) and doubler ( W . 5 . 168) extending past the W. S. 120.5 door cutout, generally
through the holes for end fasteners attaching the reinforcement to the skin. After 7449 test cycles at 50 percent Limit Load, extent of cracking (see Table 8) was enough to
warrant reduction of cyclic load level to 40 percent Limit Load. After 3400 cycles at
this level, cyclic testing was halted because damage was considered sufficiently exten-
sive to risk an uncontrolled failure of the specimen. Static residual strength testing was
conducted with failure occurring at 64 percent Limit Load along an irregular line between
W. S. 176L and W. S. 168L. An overall view of the failure i s shown in Figure 22, while Figure 23 shows a close-up view of the foiIu1.e; cracks 13 and 19 are across the
end pair of fasteners attaching the reinforcing beam to the :kin.
Test Specimen #5. A 1 . 1 inch crack at tl,e mI't;er of thc door cutout at W. S . 113R was the only initial damage detected, arm' c15 s1lo.w-t i r - 1 Figure 24 (Item 1 ) , i t propagated
to only 4 inches during the entire tesl, ancl was not associated with eventual specimen
fai I ure .
Initial cyclic load level was 50 percent L i m i t Laad. Aftel. 7000 cycles, a broken node
was discovered on the left wing lower surface "rainbw f i t t ing". These are large and
complex fittings (extruded and machined) on both upper cnd lower wing surfaces which
extend for the full length of the wing box chord at W. S . 720, and trorbsfer primary
surface loads across this main wing production joint (Figure. 13, 25 and 26). At 7821 cycles, sonic reports were heurd which led to discovery o f tfl!ee additional broken
rainbow fitting nodes at Stringers #12, i6, orld fy 17 ott thc: oppcisite wing at W.S. 220R
13

Cyclic load level was immediately reduced to 30 percent Limit Load, and cycling
resumed to reach a total of 20,000 cycles. No further rainbow fitting node damage
was observed during cyclic testing. Several fatigue cracks developed through the end
row of fastener holes attaching the skin to the reinforcing doubler at W. S. 168L as shown
in Figure 27 (Items 12, 13, and 14); note also in this figure the progression of the crack
length at 60 percent, 70 percent and 80 percent Limit Load during subsequent static
residual strength testing, and the crack arrest at the aft panel splice.
In the static residual strength test, four more nodes at the right wing rainbow fitting
failed at 80 percent Limit Load, followed by total failure here at 87 percent (Figure 26).
Crack propagation records are shown in Table 9.
Test Specimen #13. This specimen was taken from a commercial airplane, and had
approximately 13,000 flight hours and extensive repairs. The large patches in the
vicinity of W. S. 58L and 58R were X-rayed to locate underlying cracks. X-ray
examination confirmed field reports of a 9.4 inch skin crack in the center panel at
W. S. 58L; most of the these two large repair patches were removed as shown in
Figures 28 and 29.
Crack growth records are shown in Table 10, and the progression of crack propagation
at W. S . 59L is shown in Figure 30. The init ial 9.4 inch crack terminated at a fastener
hole and at the edge of a panel. Another ini t ial crack of 3.4 inches existed at the
same wing station in Panel #1; both ends terminated in holes. Slowness of these two
cracks to grow i s attributed to the inhibiting effect of the terminals being in fastener
holes or at panel edges. The two hat stringers in the forward region of Panel #2 under
the large crack were found to be partially cracked at 19,000 cycles.
This specimen showed some unexpected characteristics, Detectable sonic reports and
subsequent measurements of appreciable crack propagation occurred at 42.7 percent,
44.4 percent and 52.3 percent Limit Load, as marked on Figures 28, 29, and 30. A#
this point approximately two-thirds of the central panel and one-third of the forward
14

panel were cradked (out of a total of three lower surface panels), an4 at least two hat
section stringers were cracked. At 62.3 percent Limit Load, a very large sonic report
was heard. Subsequent inspection disclosed that a l l of the forwcrd and center panels
and the reinforcing structure under these two panels were severed a1 LV. S . 58L. How-
ever, the aft panel and both the front and rear spars appeared to be completely intact,
and it was decided to continue the test. A t 20 percenl Limit Load, there was a 1/4 to
1/2 inch surface separation along the main crack at panels # 1 and #2. At 53 percent
Limit Load panel #3 failed. The subsequent inspection showed that the e1;iire lower
surface (all three panels) had completely failed. The spar caps were still intact, and
held the severed edges of the failed panels together, with l i tt le Separation along the
failure line. The maximum residual strength i s recorded as 02.3 percent Limit Load,
the Load level reached prior to the failure of h ~ e center a r d forward panels.
Test Specimen # 1 4 . This specimen was taken from a commctcial airplane, and i t also
had approximately 13,000 flight hours and extensive repairs. X-ray examination of
reported cracks under repair patches revealed a 5.3 inch crack at W. 5. 58R; most
of two large patches were removed to permit crack plopagotion along this station with-
out inhibition by repair patches. As shown in Figure 31, terminals of this 5.3 inch
crack were at the edge of a panel and in a fastener hole. A total of 30 cracks were
identified and recorded at the start of testing. Crack propagation records are shown in
Table 11.
After 6297 cycles at 45 percent Limit Load, sonic reports were heard and the cycling
halted for inspection. The cracks at W . S . 179R (marked in Figures 32 and 33) were
partially visible externally (above patch in Figure 33) at 6022 cycles, and at 6297 cycles
had reached a length of approximately 32 inches (most of which was externally obscured
by the engine thrust attachment angle). Internal inspection disclosed the full extent of
the skin crack and that hat stringers #15, 16,617, and # 18 were broken at this loca-
tion. The cyclic load level was halved to 22.5 percent Limit Load to reduce the rate
of cycl ic damage and to avoid risk of an uncontrolled failure. During the 10,000
additional cycles at 22.5 percent Limit Load, another 20 cracks were initiated, but
none of the larger cracks propagated appreciably.
15

Static failure occurred at 59 percent Limit Load at W. S . 179R. Examination of the
failed surfaces disclosed an aged crack i n a blind region between the external engine
thrust angle and Stringer #16. This init ial crack extended approximately 6 inches aft
into Panel #2 and 1 inch forward into Panel #1. It w a s located immediately to the
right of the repair patch over Stringer #16, as shown i n Figure 34.
The largest ini t ial crack detected, 5.3 inches at W . S . 58R (Figure 31), grew to 5.9
inches, terminating 'in the next fastener hole after 4500 cycles. This lack of propaga-
tion was surprising i n view of the large init ial crack length and the removal (prior to
testing) of two large steel patches over the crack to permit unrestrained propagation.
Downbending
Specimens 19, # 10, # 1 1 and # 12 were tested at a maximum of 10,000 cycles at each
of two load levels to investigate the cyclic crack propagation behavior of the -upper
surface. Crack history for these specimens appears in Tables 12, 13, 14, and 15. At
the completion of cyclic testing, a residualstatic strength test to destruction was
conducted with test load condition D-2.
Test Specimen 19. 10,000 cycles at 25 percent Limit Load were applied, followed by
10,000 cycles at 22.5 percent Limit Load. Several considerations guided the selection
of the 25 percent load. Elementary fracture mechanics analysis (see Table 2) indicated
a cyclic load value in the 25 percent to 30 percent range and upbending crack propaga-
tion test of Specimens #4 and 65 had resulted i n extensive damage from cyclic testing at
50 percent Limit Load. Also, the AI 7178 material in the upper surface had a lower
fracture toughness than the AI 7075 T-6 of the lower surface. Thus, the init ial cyclic
load for Specimen 89 was set at 25 percent Limit Load, which was the smallest ini t ial
cycl ic load used.
Al l initial cracks (Table 12) terminated at fastener or stopdrilled holes except one end
o f a 3.6 inch crack (W. S . 34.5L) which terminated under the flange of a reinforced
hat section (Figure 35).
16

Significant crack growth data were recorded (Table 12) during the static residual strength
test after sonic reports at 70 percent, 74 percent, 78 percent and 81 percent (failure)
Limit Load. A view o f the failure i s shown in Figure 36. Note that the crack in the two
forward panels passes through the fasteners at the outboard end of the "fingers" of the
reinforcing doubler around the door cutout.
Test Specimen 110. 10,000 cycles each at 40 percent Limit Load and 35 percent Limit
Load were applied. All three of the reported init ial cracks were located in the corners
of the W. S. 182.5-198.5 cutout, and a l l had one terminal at the edge of the cutout
and the other at either a stopdrilled or a fastener hole, as shown in Figures 37, 38, ahd
39. The crack-stopping effectiveness of the panel edge splice is again demonstrated
with the arrest of the large crack (Item 7) inboard and aft of the cutout (Figure.38). The
elastomeric coating was completely stripped from the tension surface, permitting visual
detection and monitoring of 12 new cracks that initiated at W. S. 6 l L during cyclic
testing. These cracks initiated at fastener holes, as shown in Figures 40 and 41 . Most
of the cracking occurred after 18,000 cycles as shown in Table 13.
During static testing a loud sonic report was heard at 76 percent Limit Load. A 13.7 inch crack was found at W. S . 165R. There was no prior indication of cracking at this
location. The crack-arrest effectiveness of the panel edge splices should again be
noted (Figure 42), where additional propagation to the other edge of the panel occurred
during subsequent testing at 88 percent Limit Load. Loading was reduced for inspection
of crack growth associated with the sonic report at 88 percent Limit Load; when loading
was resumed total chordwise failure occurred at W . S . 61L at 87 percent Limit Load,
which was 1 percent lower than had been obtained on the preceding load application.
The failure i s shown in Figure 43, and i s the culmination of the initial cracking shown in
Figures 40 and 41 .
Specimen x10 failed at the same station (opposite wing) as Specimen f8 . Even though
the elastomeric coating was stripped from the tension surface of Specimen #lo, no initia!
damage was found at this location. Most of the cracks at w. S. 61L that developed and
propagated during cyclic testing were so small i t i s unlikely they would have been
detected i f the elastomeric coating had not been removed. In contrast, the failure
17

location on Test Specimen #8 had been covered entirely by elastomeric coating, and
inspection of the fracture surfaces (after failure at 117 percent Limit Load) revealed the
prior existence of some smal I fatigue cracks around countersunk fastener holes. Thus,
failures of Specimens #8 and #lo were similar, even though Specimen X8 had not been
subjected to test cycling.
Test Specimen I1 1. Large areas of the wing upper surface were covered with repair
patches. The wing box was examined visually and by X-ray to determine which patches
should be removed. Cracks were found in the corners of the W . S . 183-199 door cut-
outs. These patches were removed to permit uninhibited growth of the cracks in the
corners of the cutouts (Figure 45).
50 percent Limit Load was applied for 10,000 cycles and followed by 40 percent Limit
Load for another 4500 cycles. Most severe fatigue damage occurred along the end row
of fasteners at W . S . 213.5R (Figure 46). After 14,500 cycles, the only structure
remaining intact in the aft region of the wing surface Was the beom cap and fitting.
Substantial skin cracking also occurred at the corresponding location on the opposite
wing. Cycling was halted, and a static residual strength test conducted. Crack
growth records are given in Table 14.
Initial cracks at the corners of the W . S . 183-199 door cutouts did not propagate exten-
sively, even though one of these cracks was 4.1 inches long (terminated at stopdrilled
hole - Figure 44). Similar behavior was observed for Specimen #lo. Corrosion damage
was observed, but was not sufficient to cause any loss of strength.
Test Specimen 612. Initial cracks on Specimen #12 were smaller than those on most of
the other specimens. There was no obvious corrosion, and no major service repairs or
reinforcements were installed. The init ial cyclic load level was 50 percent Limit Load.
After a few thousand cycles severe cracking occurred in several locations (Table 15).
Damage at the eventual failure location appears i n Figures 47 and 48. The hat sections
i n this area failed after a few thousand additional cycles because of the amount of load
transferred to them from the cracked skin. An interior view of these broken hat sections
18

at W.S. 105L i s shown in Figures 49 and 50. The progression of damage to failure
i s shown in Figure 51. Immediately prior to failure during the static test, a con-
tinuous skin crack extended over both panels #2 and #3 and across approximately
80 percent of panel #1 (out of a total of four panels), and six hot sections were
broken under panels #2 and #3. Failure occurred at 56 percent Limit Loadat W.S. 105L.
The extensive damage in Specimen 112 i s attributed to the high cyclic loads (50 percent,
then 40 percent Limit Load) and the absence of extensive fatigue-preventive repairs.
CONCLUSIONS
Crack propagation during static residual strength tests of the six specimens not subjected
to test cycling generally was localized along one or two stations on each specimen;
critical locations varied according to the prior flight history of each specimen. There was
no consistent correlation between service-imposed fatigue damage and static residual
strength.
For the eight specimens subjected to fatigue cycling prior to static residual strength
testing, crack initiation and propagation tended to occur at many different locations.
Fatigue cracks usually occurred in the vicinity of maior structural discontinuities, such
as termination of fastener patterns attaching reinforcing doublers and stiffeners to the
skin, wing rib to surface attachments, access door cutouts, fuel f i l ler openings, and drain
holes. Cracks which initiated at the terminal fasteners attaching reinforcing doublers
and stiffeners to the skin were prevalent.
The size and location of initial damage did not necessarily influence subsequent cyclic
crack propagation or residual static strength behavior. None of the cracks which had
been initiated during service or during the tests at the corners of cutouts propagated
appreciably or were at the locations of eventual static failure, even though some of
these cracks were four inches i n length. This behavior i s attributed to desigh features
such as reinforcing structure, panel splices, and stopdrilled or fastener holes that arrest
crack growth and permit redistribution of stresses i n the vicinity of a crack terminal.
19

Direct application of elementary plate fracture mechanics theory was not a suitable.
means of predicting crack growth. The presence of reinforcing structure, uncertain
stress distribution due to locally complex structural detail, crack tips in holes, and
non-idealized boundary conditions and load distributions are significant features which
are not accounted for in that theory.
The fatigue test cycling on the eight crack propagation specimens was generally much
more severe in terms of equivalent fatigue damage, than the service-imposed damage
which they had experienced. Extensive cracking occurred during cyclic testing i n most
of the specimens; in some instances more than half of the cross-sectional area of the tension
surface was cracked. For the heavily damaged specimens, there was an approximate
correlation between the amount of damage present at the end of cyclic testing and
residual static strength. Damage tolerant structural design features, notably multi-
element construction in the form of multiple spanwise wing panels and reinforcing hat
stringers, were observed to be consistently effective in arresting crack growth; this was
the predominant reason for the substantial residual strength capability demonstrated by
these wings after extensive fatigue cracking had occurred.
The following static residual strength test levels were achieved for the directions of
loading and prior fatigue experience as described.
(1) Upbending, three specimens tested as received with service-imposed fatigue
damage: 114 percent to 116 percent Limit Load. Maximum init ial crack
length on each specimen was 3.7 inches, 3.7 inches, and 2.0 inches,
respectively. All of these cracks were located along the line of eventual
wing failure.
(2) Downbending, three specimens tested as received with service-imposed fatigue
damage: 98 percent to 116 percent Limit Load. Maximum init ial crack length
on each specimen was 4.4 inches, 2.3 inches, and 1.2 inches, respectively.
None of these cracks were located along the lines of eventual wing failures.
20

(3) Upbending, four specimens tested as received with service-imposed damage and
followed by cyclic testing prior to static test: 59 percent to 86 percent Limit
Load. Maximum init ial crack length on test specimen was 2.6 inches, 1.1 inches,
9.4 inches, and 5.3 inches. Wing failure subsequently occurred through the 2.6
inch and 9.4 inch cracks, but not through the 1.1 inch and 5.3 inch cracks.
Post-failure examination of the specimen which did not fail through the 5.3 inch
crack ( W. S. 59R) revealed an aged crack of approximately 6 inches length had
existed in a blind region between an internal hat section stringer and an external
engine thrust angle; failure occurred at W . S. 179R.
(4) Downbending, four specimens tested as received with service-imposed damage
a d followed by cyclic testing prior to static test: 56 percent to 81 percent Limit
Load. Maximum init ial crack length on each specimen was 3.6 inches, 1.5 inches,
and 0.5 inches. Wing failures subsequently occurred through the 3.6 inch crack,
but not through any of the others.
The greatest asset in crack detection was found to be a prior knowledge of fatigue-prone
locations, which suggests the importance of prompt dissemination of information on the
discovery of cracks to all operators of that model aircraft. Detection of cracks covered
by the thick elastomeric surface coating was difficult, but after the coating was stripped
from the surface, experienced inspecton consistently detected (by visual inspection)
cracks as small as 0.1 inch i n length. X-ray examination was helpful in detecting cracks
in blind areas, but was not always reliable.
Reference
1. Reeder, Franklin L., Dirkin, William, and Snider, H. Lawrence: Results
of C-130 Center Wing Residual Strength and Crack Propagation Test Program,
NASA CR 1 12008, October, 1971 .
21

APPENDIX
Beam runout: End of a reinforcing beam used to stiffen the lower surface access door
cutout; there are two beams forward and two beams aft of each cutout. Inboard
location i s W. 5 . 58; outboard location i s W. S . 176-182.
Initial damage: Service-imposed fatigue damage existing when the specimen was
removed from the airplane for this test program.
Wing joint bolt node - One of the 13 upper surface or 15 lower surface center wing to
outer wing main attachment bolt locations (W. S . 220).
Rainbow fitting - W. S . 220 upper or lower surface joint f i tt ing which mates with the
center wing and receives loads from the outer wing.
SYMBOLS
C
F.S.
KC
L L.L.
R
t
W.S.
xP
one-half of crack length, inches
fuselage station, inches
critical stress intensity factor, ksi &. left wing
Limit Load, Lbs
right wing or stress ratio - a min omax )
thickness, inches
wing station, inches
chordwise location of applied loading at ends of test specimen, inches
axial stress, Ibs ./in. 2
axial stress at ultimate load, Ibs/in. 2
test load cycles
center I ine
22

TABLE 1
TEST LOADS 100% LIMIT LOAD
WING STATION . . . . . . - . . .
0 . . ~
61.6 220
Moment 32,437,800 in.Ibs. 32,437,800 in.lbs. 21,349,800 in.Ibs.
.E Shear 0)
0 70,000 Ibs . 70,000 Ibs,
37 .34% chord F . S . 554.13
Moment -26,542,494 in.Ibs. -26,542,494 in.Ibs. -17,566,600 in.Ibs. m c % Shear 0 -56,666 I bs . -56,666 I bs . c e X of Shear 40% chord B P n
27 F . S . 559.24
Moment -27,077,361 in.!&. -27,077,361 in.lbs. -13,033,300 in.lbs.
C 0)
C n a l ( v
A I
S Shear 0 -88,662 I bs -88,662 Ibs.
c e X of Shear 37.4Ph chord
n B P F . S . 554.42
23
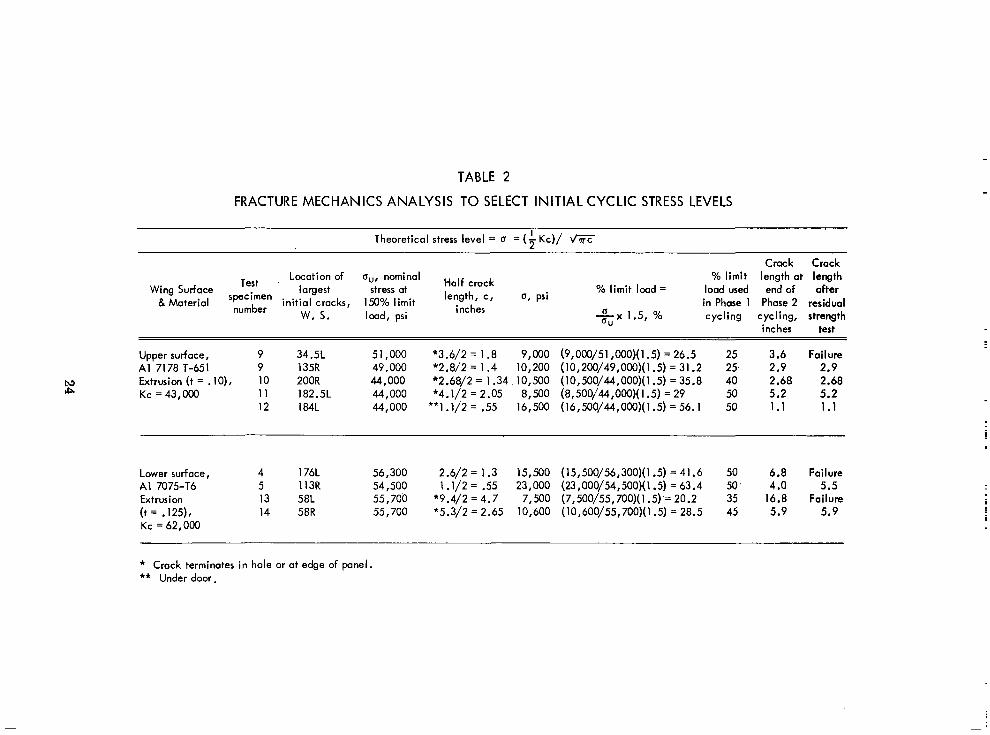
TABLE 2
FRACTURE MECHANICS ANALYSIS TO SELECT INITIAL CYCLIC STRESS LEVELS
Theoretical stress level = 0 = (3 Kc)/ V T E
Crack Crack
Half crack % limit length at length Wing Surface specimen largest stress at % limit load = load used end of after length, c, IJ, psi
i nc hes in Phase 1 Phase 2 residual
Test
number
Location of uu, nominal
8. Material ini t ial cracks, 150% limit w. s. load, psi *x 1.5, % cycling cycling, strength
inches test
Upper surface, 9 34.5L 51,000 *3.6/2 = 1.8 9,000 (9,000/51,000)(1.5) = 26.5 25 3.6 Failure A1 71 78 T-651 9 135R 49,000 *2.8/2 = 1.4 10,200 (10,2OO/49,000)(1.5) = 31.2 25. 2.9 2.9 Extrusion (t = .IO), 10 200R 44,000 *2.68/2 = i .34,10,500 (10,500/44,000)(1.5) = 35.8 40 2.68 2.68 Kc = 43,000 1 1 182.5L 44,000 *4.1/2 = 2.05 8,500 (8,500/44,000)(1.5) = 29 50 5.2 5.2
12 ItML 44,000 **1.1/2= .55 16,500 (16,500/44,000)(1.5)=56.1 50 1 . 1 1.1
Lower surface, 4 176L 56,300 2.6/2 = 1.3 15,500 (15,500/56,300)(1.5) = 41.6 50 6.8 Failure
Extrusion 13 58L 55,700 *9.4/2=4.7 7,500 (7,500/55,700)(1.5)'=20.2 35 16.8 Failure (t = .125), 14 58R 55,700 *5.3/2 = 2.65 10,600 (10,600/55,700)(1.5) = 28.5 45 5.9 5.9 Kc = 62,000
A1 7075-T6 5 113R 54,500 1.1/2 = .55 23,000 (23,000/54,500)(1.5) = 63.4 50. 4.0 5.5
I
* Crack terminates i n hole or at edge of panel. ** Under door.

TABLE 3
SUMMARY OF FATIGUE DAMAGE, FAILURE LOADS AND FLIGHT HOURS FOR UPBENDING TEST SPECIMENS
Dmr cutout corner Door CUIWI corner
5 I 6.296 1 Door cutout corner 1 Wing joint bolt node I 16.17
Initial Cmck ,
Upknding, Phose I Upbending, Phac 2 Cyclic Test, R = 0. I Cyclic T a t , R = 0. I Length After
Residurl Strength % Limit Load Wing Length, Max. Load, 96 Crack Max. Lood, % Cmck
Station, In. In. Cycles Limit Lwd Length, In. Cycles Limit Lood Length, In. ~ m t , In. at Failur.
I76.5L 3.7 1 1 %
ll(.7
0.3 1 1 3 ~ 0.3 1.7 115.7
7
Failure line 1.7
l76L
l76L I I I I76R 2.0 I I X 2.0
l76L I82L
2.6 7.450 50 6. I 3,400 40 6.8 Failure line 1.3
112.8R 4.9 Failure line
0 . 3 3.2 3.2 3.2 64.8
I Failure line 115.4
2.0 115.4
4.9
.
17 I13L 58L I 3 . 3 I I

TABLE 4
SUMMARY OF FATIGUE DAMAGE, FAILURE LOADS AND FLIGHT HOURS FOR DOWNBENDING TEST SPECIMENS Downbending I , Phase I
Cyclic Test, R = 0. I Downbending I , Phme 2
Cyclic Test, R = 0. I Init ial Crock
* Length After Residuol Strength % Limit L m d Specimen
at Failure Test, In. Length, In. Limit Load Cycler Length, In. Limit Lwd Cycler In. Stotion, In. No. of Crmk Origin Hours No. Length, Wing Crock Description of Area Fllght Mox. Load, % Crmk Mox. Load, % Crack
6 7. I 0.3 34.5L 2 7.0 4.4 34.5L I Doubler r m w t 7.374
Doubler N n w t W.S. 220 joint 96.3 Failure line 22oR 9
7 1 Fuel fil ler cutout 5,617 Doubler wnout 3
120.5L 0.3 105.5L
1.4 135.2% 9 Doubler runout 2 . 3
Fuel fil ler cutout 14 120. SR 1.7 97.7
1.6 9.6
Foilurc line
8 1 Door cutout comer 7,892 Dmr cutout comer 3 1.4 182.3R
1.2 199.8L 1.2
W.S. 61 r ibcap 61R 4
9
Doubler Nnout 2 Doubler runwt
3.6 IO, 030 22.5 3.6 Failure line 25 10,WO 3.6 34.5L I Doubler runout 11,251 34.5L 0.5 0.5 0.7
3 3 7 3 0.8 0.8 1.3 19.8 2.8 2 .8 l35R 4 Doubler runout
Failure line
10 61L 2 Door cutout comer 6 W.S. 61 r ibcap 6,603
182L 0.8 Door cutout corner 1 Door cutout corner 3
198.5L 0.8 I99R 1 .5
10,ow
1.5 1 . 1 1.9 1.4 40
I I 10,ow 213.X 9 W.S. 2W ioint 7.6643 3
4,0 3.0 182.5L 1 D w r cutout corner 1 . 1 Fwd spar cop 0.8 178.5R
50 3.6 4,500 17.3 Failure line
4.500
I 2 19.7 6 . M 50 4,034 0. I 105L 3 Dwblcr N ~ W I 5,674
1.7 IO. 3
1 2 Fuel f i l le r cutwt
Fuel fil ler cutout 0.3 120.5L
1.6 4.2
1.6 4.2 Fuel fil ler cutout
12.9 12.9 12.9 0.5 1.6 1.6 1.6
I35L Doubler runout
1.7 1.7 0.3 120.5L
1.7 30 19.7 Failure line
L I I Fuel f i l lercutout I ,! I ;;;:;; I ;:; I * Downbanding 2 condition used far 011 specimens except Number 6.

TABLE 5
NOTES USED THROUGHOUT THE REPORT ON CRACK LENGTH DATA TABLES
All length measurements are given to the neanzst 0.1 inch.
The crack terminated in edge of panel.
The crack terminated in fastener hole.
See Table 1 for loading conditions.
The crack terminated in stopdrilled hole.
A W .S. 220 rainbow fitting node cracked.
Stringers numbered 15, 16, 17 and 18 were also found to be broken.
The crack disappeared under an external repair.
This damage was discovered during an inspection after the residual strength test.
The crack appeared from the opposite side of an external repair.
On Specimen #13, at 19,000 cycles, stringers 17 and 18 were discovered to be partially broken, 17 from i t s aft flange to the centerline and stringer 18 from i t s fwd flange to i t s centerline.
On Specimen x12 broken stringen were found as follows: No. 5 after 2,870 cycles, No. 4 after 4,034 cycles, Nos. 3, 6 , 7 and 8 after 10,500 cycles.
27

TABLE 6
MAJOR CRACK LENGTHS FOR LOWER SURFACE, STATIC UPBENDING TESTS
Test pecimen
No. No'
Crack Descript ion
Wing I n i t i a l Crack 87?h l o o s b lloD/.
Sta. , Crack Locot ion Length, L imi t L imi t L imi t Fa i lureLwd Inches Inches Load Load Locd
~ ~~~ ~~~ ~ ~ ~ ~ ~~ ~~ ~~~ ~~
1 1 The crack originated i n the edge o f 176.51. 0.5" fwd 8. aft of the str inger 16 3.7(b) 3.7
~~
holes common to the W.S. 120 cutout reinforcement beom and the skin.
1 Complete Chordwire Fai lure
176.5L 0.5" fwd 8. aft of the stringer 20 7.0 at 115.PA 3 Same as crock 1
EPY! 2 1 The crock originoted in the edges o f 176L 0.5" fwd 8. aft of the str inger 16 3.7(b)
fasteners common to the W.S. 120 cutout reinforcement beom and the skin. Failure
(C ) 5.0 5.0 7
Complete Chordwire
at 114.5% 1.0 1.0 Limit Load 2 The crack originoted in o drain hole 176L 2.3" aft of the stringer 15 1 .O(b)
in the skin.
3 Same as crock I 176L 0.5" fwd 8 oit of the str inger 20 E 0.8 7.5(b) 9.5
3 I The crack originoted in the edge of 176R fastener holes common to the W.S. 120 cutout reinforcement beom and the skin.
2 Same as crock I 176R
3 Some or crack 1 177R
4 Some os crack 1 176R
7 The crock originoted in the edge of 113R on access door attachment fastener hole.
IO Same os crock 1 176L
0.5" fwd 8 a f t o f the stringer 15
0.5" fwd 8 aft of the str inger 16
0.5" fwd 8 a f t o f the stringer 20
0.5" fwd B oft of the str inger 21
0.8'' oft of the str inger 17
0.5" fwd B oft of the str inger 16
0.5
2.0
0.1
0.7
2. O(b) (C )
1.5
3.0
3.8 Complete Chordwire
at 115.4% Fai lu re
Limit Load
2.0 2.0
1 .5

TABLE 7
MAJOR CRACK LENGTHS FOR UPPER SURFACE, STATIC DOWNBENDING TESTS ~~ ~~~~ ~~ ~
Initial T a t
m c i m n Crock No. No. Dmuripfion I". Crack bco t ion Lnpth, ing 72.3% ing77.m irg Inshas Limit L o 4 Limit Load Limit L d A f t n Foilura
Wiw Crack Aftar Apply- A f t u Apply- Aft- Apply- sto.
6 1 T h crack aisimtd in t h edg. 34.5L The shingu 5 6 of o Imt fmtanr blr c-n to Ih intcrml ninforcing doubler of tlm a c c a l Q o r culout and the *in.
4,4
2 Sane m crock 1 3.5L 0.8" of1 of t h shirger4 0.3
6 The crock o r i p i m t d under the 120.5L 2.5" fwd of the shinper 6 $ circular =tam1 repoir doubler
8 S a c as c r a k 1 37.511 Sane (IS 1
9 Barrel m h attachins he qxpcirna 220R Roinbw fitting to the tnl f m c w a c s h i p p d
th. wing joint r-lting in rpccimrn failure at
7.0
7.1
0.5 4. I(b)
10.7(b)
7.1 ' 4.1
10.7
canplele C b r d w i u Foilure a t 96.3% Limit LWd.
7 2 The crock oriQimted in the edge of 105.5L 2.7' aft of the stringer 4 $ 0.7 the Imt fmtmnr ho IC c m m m to the i n t m l reinforcing doubler of the h.1 fur CVtOUt.
3 Sane m crock 2 105.51 2.T fwd of the shinger 6 $ 2.3
6 S a n c m c m k 2 1U.X 2 . 7 fwd of h e stringer 6 $ 1.4(.)
7 h e a~ crock 2 135.X 2.7' aft of the stringer 4 $ 0.7
8 Sane m cmck 2 135.31 0.8'' ah of the s1ring.r 5 6 0.5
9 Some m cmck 2 135.311 2.7' fwd of the shinWr6 6 1.4
2.7 I
I .%e)
I Crmlplete Chordrile Foilure a t 97.7% Limit
10 Sane Q. crack 2 1 3 5 . 3 2.7' fwd of the stringer 5 $ 0. I
8 1 The cmck a ig imted in he edge of 1W.8L 0.5" fwd of he shicger 5 6 1.1 a f a s l n r b l c . The hole, c m m n
one of a r w +cent to the ( I C C ~ I I
to the Qa h b l c r end skin, was
Q o r a H o c h m t fmtemn.
1.2
2 Smr as cmck I 182.3L 0.5' oft of the stringer 2 6 0.7(e) 0.7
3 S a n e m c m k 1 182.3 0.5" aft of the s t r i w r 2 $ 1.4 1.4
Caplet. C b r d w k Failure at 116.6% Limit LWd
J

!
TABLE 8
MAJOR CRACK LENGTHS FOR LOWER SURFACE, CYCLIC UPBENDING TESTS - SPECIMEN NO. 4
D.5" Id 6 011 of Ih. rhinpr 15 5
Upbndinp, P b u I I Upbndim, Pkm 2 I
0.8
3.7 4.5 4.8 5.5
0.8
6 2.5W 2.9 2.9 3.7" (4
1.2
1.3 1.4 2.2 2.7 3.2k) J.B(b) 3.0 4.2
2.3 3.2 3.2 3.5 4.0 4.3 4.P 5.8 6.9
0.0 1.1 1.P 2.3-2.3 2.4 2.6 2.6 2.8 3.0 3.2 . 6 . l k )
6.1 6.3 b . ,
1.0 1.0 1.3 1.0 2.7 3.0 J.J(s) 3.9 4.2 4.P 9.5 ' 14.5
0.2 0.2
2.7 3.2
0.3 0.3 1.2
1.7 I.P(c) 2.2(c) 2.2 8 Crnmp1.k C k d w l r F d v . 01 64.81 Llrnil
4.6 4.7 4.8 4.9(4 4.P
0.6 0.9 1.6 2.1 2.5 3 . W 3.0 3.6 3.7 4.5 4.7 5.2 5.3 5 . 5 5.7 5.9
0.2 0.8 1.0 1.0 1.9 2.7 3.1 3 3 4 3.5 3.7 3.8 4.2 4.2 4.9 5.7 6.0
0.7 1.1 2.0 2.3 2.7(4 J.l(c) 3.1 4.l(b) 4.1 4.5 4.7 5.2 5.7 5.9(s)-SP 6.0 6.0
0 3 b ) 0.3 1.0 1.3 1.5 1 . U d 1.6 2.5 2.9 3.2k)
I

TABLE 9
MAJOR CRACK LENGTHS FOR LOWER SURFACE, CYCLIC UPBENDING TESTS - SPECIMEN N 0 . 5
.I 1.6 2.2 2.b 1 2 3.2 1.) 3 . 7 3.7 1.0 4.0 -4.0 1.1
0 1 0.1 0.2 0.2
0.7 0.1 o.ll 0.v 0.9 1.1 3.1kl l.? 1.V 4.1 5.V b.6 1.1 24.4 1b.1
I Ubl 1.b 4 .V 4 . 9 S.0- 5.0 5.1 5 . 1 - 5.1 5.b 1 .6
1.5 3.6 1 Ur) 4.9 5.4 6.2 6.8 6.l V.b

w N
TABLE 10
MAJOR CRACK LENGTHS FOR LOWER SURFACE, CYCLIC UPBENDING TESTS - SPECIMEN NO. 13
0.6 0 .b 1.1
3 3 . 3 I 1 3 1 1.5 3 8 3 Vlbl 3.v
6-0.6 0 . 1 - 0 . 7 0.8-0.8 1 . 1 1.1 1 . 1 1.5 1.7 1.1 1.1
4 k l 3.. 3.5 3.Hd
$1 Ibl
1.b
3 k l 3 . 3 1.8 4.0 4.b 5.21bl 1.2 7 .b P . l l c l V .1
C..pl.l< C k l C i l
hilum
V . 4 10.8 1 I . V 12.6 1 3 5 l c l 13.8 14.0 14.YkI 15.1 lb.O 17.7 17.7 20.V 27.2 1 Jbl Id1

13
12
I 4
35
15
16
I 7
I 8
I 9
5
*
1 1
21
2 1
?7
58
!a
I71L
f
1021
5 9
li
I 7 9
10a
I 8rn
).? 0 . 2 0.1 c
0.1-0.1 0.2 -0.
1.1 0.1 0.2 0.6 0 . q
1.1-0.1 0.2 0.7 0.1
4 1.1 1.6 1 .7 1 .9 2 I
.I 0 1 0.2-0.2
.8".8 I O 1.0 I I
7 0.7 0 v
0 1 I1 6.3 19.91~1 20.4 22.71cl- 21.7 23.7
1.2-1.2 1.5 1 . 5 1 I O 1.0 I .I - 1 1
.5-1.5 2.1 2.2lbl 2.3 2.4 2.4 2.6- 2.6
' lbl ](<I
5 3 5 . 9 k i s v
5 2 . 5 2.8 7 9 3 0 3 I k l 3 I 3.3 - 3 I-
33

TABLE 12
MAJOR CRACK LENGTHS FOR UPPER SURFACE, CYCLIC DOWNBENDING TEST - SPECIMEN NO. 9
:rack Wing
Sta. No. Description In . Crack Location
I
2
I I
7
IO
3
4
I
The crack originated 34
fastener hole common i n the edge o f o lost
to the internal rein- forcing doubler of the access door cutout and the skin
Some as crack 1
Same as crack 1
Same as crack 1
L The stringer 5 5
0.5" fwd of the stringer 2 5
0.5" o f t o f the stringer 2 $
0.5" fwd of the stringer 3 5
Same as crack 1 34.5L 0.5" fwd o f the stringer 4 5
Same as crack 1 37.5R 0.5" fwd of the stringer 5
The crack originoted 135R 2.8" fwd o f the stringer 4 5
fastener hole common in the edge of a last
to the internal rein- forcing doubler of
and the skin. the fuel f i l ler hole
c Downbending 1 , Phase I Downbending I , Phase 2 Cyc l ic Test, R = 0 . 1
M a x . L w d = 25% Limit Lood
Downbending 2 Residual Strength Test
M a x . Lood = 22.5% Limit Load
load Load 13,000 14,000 17,000 19,000 19,500 20,000 0 4000 7500 8000 8500
Limit L imit L imit L imit 81% 78% 74% 70%
C y c l i c Test, R -0 .1
Number of Cycles (d) Cumulotive Number of Cycles
3.6 3.6 3.7
0.5(e) 0.5 1 : ; r 3 . 9 [ 1 0 . 4
0. %e)
0.1 0. I
2.8(b)
0.8 0.8 0.9 0 . 9 1.0 1 . 1 1 . 1 1.3 2.3
10.6 i Complete
Chardwire Failure
19.8(b) 19.8
2. 8(e) 2 . 8 2 . 9 2.9

TABLE 13
W ul
MAJOR CRACK LENGTHS FOR UPPER SURFACE, CYCLIC DOWNBENDING TEST - SPECIMEN NO. 10 I I Downbending I , Phose I
M o x . Load = 35% Limit Lmd Mar. Lmd i 40% Limit Lood
Downbending I , Phorc 2 Cycl ic Telt, R i 0. I Residual Shength lest Cyclic Test, R = 0.1
Downbending 2
Wing 76% 8% I 8B% 84% Number of C p l e s Id)
L o d Load Lod Lead 10,00011.5W 12.500 14,500 16,WO 18,000 20,oM) 0 3WO 3500 40W 4500 MOO 7500 8000 WOO hit ~ i ~ i t Limit Limit Curnulolive Number of Cycler Id) h c k SI.:
ND. I)rrsriptmn I". Crack Location
6 Originold in the edge , of a hlmr bl. C"
mon b &in ond rib
19 Smr m c m k 6
24 h e m c r o c k 6
27 b n c o r ~ k 1 7
23 h c m c m c k 6
3.8" fwd of the rlringcr 1 $
4" of1 of the rhingcr I E
2 . 7 oft of the ~ h i n g e r 2 c
1.8" oh of the stringer 3 c
1.8" fwd oi the lfringcr 4 $
1 . 1 1.1 1.3 1 .4 1 .4 1.5 1.5 1.6 1.6 2.1 2.1
1.0 - 1.0 2.4 2.4
0.1 0.1
0.2 0.2
0.2 0.2 4.0
0.2 - 0.2 1.5 2.2
0.5 0.5
0.1 0. I
G. I 0. I
0.3 0.3
0.3 0.3 0 . 4 0.4 0.5 0.5
9.8
0.9 1.c 1 . 1 1.3 1.4 1.5 1.7 1.9 2.1 2.3 3.1 3.5 3.8 5.1 10.5
13.7 13.7 19.7
9.9
20.0
10.5
19.7

TABLE 14
MAJOR CRACK LENGTHS FOR UPPER SURFACE, CYCLIC DOWNBENDING TEST - SPECIMEN NO. 1 1
Crack Wing sto.
No. Dcxcriotion I". Crock Locotion ~
16 The crock originated in the 213.5R 1 . 0 oft of the stringer5 $ d g t of D fastaner hole CommOn
roinbow fitting to the skin and the W.S. 220
I I Smc 03 crock 16 2.7" fwd of the stringer 6 $
Downbending I , Phose I Downkd ing I , Pbse 2 Cyclic Test, R =0.1
After
Mox. Lmd = MX Limit Lmd Failure
Numbs of Cycler (d) Limit Cumulative Number of Cyslcs (d)
Cyclic Test, R = 0.1 M a x . Lmd = 4096 Limit Lmd at 57.391
0 2 w o 4000 5000 mo 7000 8hx) 9ooo Lwd IO,00011,00012,00013,00014,MX)I4,2M14,MO
0. I
15 S m c as crack 16 1.B" fwd of the rhingrr 6 $ 0.1 0 . d
14 Some os crack 16 2.8" fwd of the swinger 7 $ 0.2 0.2 0.3 0.8 1.0 1 . 6 4 ~ ) 2.5(b) I 54 S m e os crack 16 2.8" oft of the stringer 6 $
57 Sane 0% crock 16 2.8" aft of the stringer 7 $
9 Sane 0% crack 16 2.7" fwd of the stringer 10 6
12 S m c 01 crock i 6 I .8" fwd of the shingar IO 6 ,
10 Sme os crack 16 213.51 2.7" oft of the stringc. \O $ /I
13 Smr 01 crack 16 214.5R 0 . S aft of the stringer 9 $
0.2 0.4(c) 3.ab) 4.46d5.9 17.3(b) I 17.3
1.7 4.2
9.0 9.0
2.2 2.5 2.6 2.7 7.9 7.9 1 3 The crock originold in the 178.5R 0.5" oft of fwd edge of
edge of 0 ksttn+r hole panel 'I 1 . 1 1.5 1.5 1.6 1.6 1.7 10.3
common to the par cap, rib md skin panel
I The crack or ig im td in
Thc hole, common to the the +e of o fmtencr hole. 182.5L 0.5' oft of the stringer 2 $
dmr doubler and the skin, was one of 0 row adjacent to the D C C ~ U dmr atloch- men1 fastenen.
31 Sme 01 crack 16 214.5L 2.8" oft of the stringer 6 $
8 Sane 0% crack I 6 214.5L 1.8" fwd of the stringer 9s
3.0 3.3 3.4 3.5 3.5 3.6 3.7 3.9 4.0-4.0 4.1 4. I
0.7(b)l.l 3.7 4.6 4.6
0. I 0.1 3.6 4.1 5.0 5.6 5.6 5.8(c) 5.8
I

TABLE 15
MAJOR CRACK LENGTHS FOR UPPER SURFACE, CYCLIC DOWNBENDING TEST - SPECIMEN NO. 12
I9.4lbl 19.7 IP.
2.6;:; 2 .6 3.0 6.3 9.1 12.6 12.6 19.1
.3 1.2 1.7ibl I . ,
0.1
D.1 0.6 0.6
1 2 . s
0.6
3icl 1.1 1.8 2.2 3 0 3.2 3.3 3.9 1.2 4 . 2
0.5 0 .5 0.6 0.9 1 .7 6 .5 11.0 1 1 . 1
0.5 0.5 0.8 0 .P 0
1 1 . 1
0.2 0.2 0.3
0.6 0.6 O S I I 1.8
0.1 0.1 0.2 0.6 0.8
0.2 - 0 . 2 3.6 A.2 5.2 I . l ( c 1
1.5 17.0
-19.7 T Com.lr,
- 1.7
- 1 . 6
" I 2 P
- 4 2
-11.1
- 7.1 7 2
37

W 03
~ ~ ___ " -
Figure 1 . - Used C-130 center wing boxes stored for testing

w W
18% FWD 0 59.9% Chord C h t p
Panel 1 -y- Pons12 y - Pans1 3 -y Panel'4 7 FS 517
68
Lower surfoc
Figure 2. - General cross-section of center wing showing
locations of stringers and skin panels.

ws 34.5
I
5 "
Stringer 4
I
c-\ "- L-
A. Hole in Doubler Finger Under Stringer
ws 0.0
. . . . . . 6. Hole in Doubler at
Access Door Corner
WS 105
Filler Cutout
Figure 3. : Typical areas identifying upper surface skin cracks originating in fastener holes.
:40

WS 178.8 W.S. 1 6 8 (Outboard)
or W.S. 72 (Inboard)
" - - - - -2-t T-""
F. Hole in Doubler
- - - -'J
2"""
A round Access Door Cutout
E. Hole in Access Door Cutout Reinforcing
WS 120.5 I
""""
_"""" I" G. Hole in Doubler
at Access Door Corners
I I '0 0 0 1 1 - 1 """- r- _"" I=-"-----= =- ""--"- ""- t""" ---L - - --
I ! I
Figure 4. - Typical areas identifying lower surface skin cracks originated from fastener holes.

Figure 5. - Test loading fixture.

60
55
50
45 - m Y
n ' 40 n w 3; 35 ?!
3 c
m
P 30 .- 3 2 25 E 0 .- x
20 2
15
10
Ultimate Load Stresses (150% Limit)
Upbending (Static &
""43-"" ""
Downbending (Fatigue: D-1)
-0, \ \
Downbending (Static: D-2)
L
/- 50% Limit (Upbending) c - ""- -0" L/ "a _"" -a"-- I""" -"""
Fatigue)
Wing Station - Inches
Figure 6. - Approximate wing skin stresses
43

7e0 r" Theoretical fatigue damage
Theoretical fatigue'damage
. . - " . . . . . -__ -. ""
due to service
due to fatigue test cycling
Wing box test specimen no.
Figure 7. - Comparison of fatigue damage: service vs. test cycling " -.
1 Up bending - no test cycling Down bending - no test cycling
0 Up bending - after 20,000 (mox.) fatigue test cycles D w n bending - ofter 20,000 (max fatigue test cycles
1 2 3 4 5 6 7 8 9 1 0 1 1 1 2 1 C-130 wing box test specimen no.
Figure 8 . - C-130 wing box residual strength.
44

!
Figure 9 .
Specimen # I . Static test, lower surface: Failure at WS 176L.
Figure 10.
Specimen # I . Static test, lower surface. Close-up of failure near aft wing spar.
45

46

Figure 13.
Specimen #3. Static test, lower surface. Initial skin cracl at WS 176R over Stringers 15 and
<ing
16.
47

Figure 15.
Specimen #6. Static test, upper surface. Final cracking ws 34.5L.
at
Figure 16.
Specimen #6. Static t st, upper surface. Final cracking a t WS 120.5 fuel fi I ler hole.
7
48

Figure 17.
Specimen #7. Static test, upper surface. Final cracking at WS 120.5R fuel filler hole.
Figure 18.
Specimen 87. Static test, upper surface. Close-up of failure at WS 135R.
49

Figure 20.
Specimen #8. Static test, upper surface. Initial crack at corner of access door, WS 200L.
50

Figure 21. Specimen #8. Static test, upper surface. Init ial crack at corner o f access door, WS 182L.
51

Figure 22.
Specimen #4. Cyclic & static testing, lower surface. Overall view of failure at WS 176L - 168L.
Figure 23.
Specimen #4. Cyclic & static testing, lower surface. Close-up view of failure near stringers 15 and 16.
52

53

Figure 26.
Specimen #5. Cyclic & static testing, lower surface. Failure at rainbow fitting, WS 220R.
Figure 27.
Specimen #5. Cyclic '& static testing, lower surface. Final crack propagation at WS 168L.
54

Figure 28. Specimen #13. Cyclic & static testing, lower surface. Repair patch removal and crack Propagation, WS 58L, forward region - final damage.
55

b
Figure 29. Specimen #13. Cyclic & static test, lower surface. Repair patch removal and crack propagation, WS 58L, aft region - final damage.
56

WS 59.0 L WS 59.0 L
Crack length, cycles
Panel 1
I Panel 2
3.5% - 35% L.L. 0 - 10,000-
I
"-7 Crack length, cycles
4.0 In. 18,500- Panel 1 5.2 In. 20,000-
1 Panel 3
3.5% - 35% L.L. 0 - 10,000-
ws 59.0 L
/&2.7% 44.4% (9.1 (7.6 I n L In. -" j " 1 3 14
" 15
-52.3%(20.. 9 In.
1 \---23
failed at . --- 22 53% limit
"_ 24
3.5% - 35% L.L. 0 - 10,000- 3.25% - 32.5% L.L. lO,-OOO - 20,000- 3.25%,- 32.5% L.L. lO,.OOO - 20,000-
Static Failure - 53% L.L. * * 62.3% was attained.previously at
which panels 1 and 2 failed.
Figure 30 - Test specimen # 13, progression of crack propagation to failure at W.S. 59L.

'L-, i ' 1 J & p f &2 ?, -1' ..;. : '
Figure 31. Specimen #14. Cyclic & static test, lower surface. Largest ini t ial crack was 5.3 inches at WS 58R.
58

Figure 32.
Specimen #14. Cyclic & static test, lower surface. Long crack along thrust angle, forward region, WS 179R - damage after test cycling.
59
I

Figure 34.
Specimen #14. Cyclic & static test, lower surface. Failure in vicinity of WS 179R, note engine thrust angle.
Figure 35. Specimen #9, Figure 36. Specimen #9. Cyclic & static test, Cyclic & static test, upper surface. upper surface. Initial crack of 3.6 Failure at WS 34.5L. inches at WS 34.5L.
60

Figure 37.
Specimen #IO. Cyclic & static test, upper surface. Final crack a t corner of access door, WS 198.5L.
Figure 39.
Specimen #IO. Cyclic & static test, upper surface. Final crack at corner of access door, WS 199R.
61

Figure 40. Specimen #IO. Cyclic & static test, upper surface. Cracking in forward region, WS 61 L - after cyclic testing.
Figure 41.
Specimen #IO. Cyclic & static upper surface. Cracking in aft region, WS 61L after cyclic tes
test,
- ting.
62

Figure 42.
Specimen #IO. Cyclic & static upper surface. Crack at WS 16 final damage.
test,
5R -
Figure 43.
Specimen #IO. Cyclic & static test, upper surface. Failure at WS 61L.
63

Figure 44. Specimen #11. Static & cyclic upper surface. Final crack at c of cutout, ws 1
Figure 46. Figure 45.
Specimen # I 1. Specimen # I 1. Static & cyclic test, Static & cyclic upper surface. upper surface.. Cracking along end Repair patches
test,
:orner 82.5L.
; test,
removed row of fasteners at WS 213.5R - after test cycling .
from corners of cutout - after test cycling.

Figure 47.
Specimen #12. Static & cyclic test, upper surface. Cracking along end row of fasteners at WS 105L, panels d l and #2 - after test cycling.
Figure 48.
Specimen #12. Static & cyclic test, upper surface. Cracking at WS 105L, panel #3 - after test cycling.
65

Figure 49.
Specimen #12. Static & cyclic test, upper surface. Interior view of stringer cracking, panels #1 and #2, WS 105L - after test cycling.
Figure 50.
Specimen #12. Static & cyclic test, upper surface. Interior view of stringer cracking, panels #2 and # #3, WS 105L - after test cycling.
66

WS 105 L
Stringer
Panel 1 2 --
4 "_
8 "I Panel 3
9 ---I l o ! Panel 4 1 1 "-1
I I WS 105 L
WS 120.5 L Crack length,cycles
6.9 In. 10500 -
6
7 "_
1 1 --- 6 5%-50%L.L 0-4034- 3% - 30% L.L. 4034 - 10500-
Crack length, cycles - r 19.7 In. 3500- 19.4 In. 3000- 17.1 In. 2700- 15.3 In. 2690- 9.5 In. 2000-
2 5 8 9 - l 2.6 In. 4034 - 3000-
I Panel 4
5 - 50% L.L. 0 - 4034-
WS 105 L WS 120.5L I
53% L. L. 50% L. L.
I I 5% - 50% L.L. 0 - 4034- 3% - 3Ph L.L. 4034 - 10500- Static Failure - 56.4% L.L.
Figure 51. - Test specimen I1 2, progression of crack propagation to failureat W.S. 105 L.
NASA-Langley, 1972 - 32 CR-2075 :67