residents in hisconsin juvenile correctional …
TRANSCRIPT

f
I
RESIDENTS IN HISCONSIN JUVENILE CORRECTIONAL INSTITUTIONS ON DECEf''tBER 3L 1983
WITH FIVE-YEAR TRENDS FOR 1979 - 1983
DEPARTMENT OF HEALTH AND SOCIAL SERVICES DIVISION OF CORRECTIONS
OFFICE OF INFORML\TION MANAGEf''lENT & OPERATIONS ~ISO~t WISCONSIN 53707
STATISTICAL BULLETIN C-58 AUGUST 1984
.-.~
If you have issues viewing or accessing this file contact us at NCJRS.gov.

57 0 If
;0 If r ...-. If Mi
0 (/) If » 2- ..-.
--; :z n 0 2j I
~ =c m 11 '- '- ........
0 ~ (/) I -< ::z: en en
~ --{ 0
~ ::z: '" 2f) en t:::J
~ C) ...... u ;0 m m ~ n --;
d --{ ~ ..... ;0 0 t:::J ::z: en 0
rR (/) m
~ ~ >--C
0 0 ::z: 65
U.S. Department of Justice National Institute of Justice
112076
This cJocumenr ha& been reproduced exactly as receIved from the person or organtzatlon onglnattng It POints of vIew or opInions stated In this Oocument are those of the authors and do not necessarily represent the off,c;al poslhon or polu::IeS of the National Inslltute of JustIce
PermISSIon to repro,. Ice thiS f;OPYf!ghted matenal has been granted Oy
Wisconsin Divisio-n of C-orl:'ections
to the National Cnmonai JustIce Reference ServIce INCJRS)
Further reproductIOn outslOe of the NCJRS system reqUIres permISsIon of the copynght owner
(/) ~ --{ --0
~ ~ J>
~ rn ~ =c rn ;0 t:::J I --;
~ ...-. .....
'- -< ::z: 0 0 ........
~ 11 ::z: (/)
~ t:::J >--C =c ..... 0 ::;:;::J ~ ;0 n :z m '" ~
..... ~ 0 < t:::J 11 .....
q] '" --t 8 N ~ c:
~ '-
~ ~ (/) ...... P1 (/)
~ ::z: q 0 ...... ;0 n en ....... m >--C ..... ;d ~ :r;! ~ ::z: ...... ~
(/) ;0 en -< (/)
~ 0 rn ;0 ~
d ....... ;0 rn
---... --,.~.
(/)
--; ,. J> --; rn ~
C>
If
::=:: >--C
(/)
n 0
:z (/)
..-. :z
..... __ .... _ .... _"""'---' __ ~1 nm· '4 -JD.-.

~~-~------~--
-1-
Residents in Wisconsin Juvenile Correctional Institutions
on December 31, 1983 With Five-Year Trends for 1979-1983
Ethan Allen School, located in Waukesha County near the community of Wales, and
Lincoln Hills School, a co-educational facility located near the town of Irma in
Lincoln County, are Wisconsin's two facilities for juvenile offenders placed in
Division of Corrections custody under provisions of the Wisconsin Children's
code (revised Noyember, 1978). The code states that juveniles may be placed in
Division of Correction's custody only if: (1) adjudged delinquent of an act
that would be punishable by a sentence of at least six months if committed by an
adult and (2) found to be a danger to the public and/or themselves and in need
of treatment in a restrictive custodial setting.
A total of 454 juveniles, 413 boys and 41 girls were in residence on December
31, 1983; a decrease of 11.9 percent over December 31, 1982, when 515 juveniles,
470 boys and 45 girls, were in residence. Tables 1 through 11 contain
descriptive data about juveniles in residence on December 31, 1983; tr.end data
for the years 1979-1983 can be found in Appendix Tables A and B.
Four hundred and thirteen boys, 276 at Ethan Allen and 137 at Lincoln Hills,
were in residence on December 31, 1983. Boys committed from Milwaukee (185),
Racine (25), Kenosha (16), Waukesha (16), and Rock (13) counties accounted for
slightly more than three-fifths (61.8 percent) of the resident population.
Slightly more than three-fourths (76.1 percent) of the residents at Ethan Allen
and almost nine-tenths (87.6 percent) of the residents at Lincoln Hills had been
received as new admissions to a juvenile correctional institution. Three boys
not institutionalized under Wisconsin statutes were in residence at Lincoln
Hills School. Boys in residence in December 31, 1983, were reported to have an
average age of 16.2 years. Slightly more than one-half (53.3 percent) of the
juvenile males in residence were reported as being from White or Hhite-Hispanic
family backgrounds. Boys from Black family backgrounds made up about two-fifths
(39.5 percent) of the resident population. Ethan Allen, which serves the
southern and southeastern area of the state, housed the majority (l5S out of
163) of Black youths in residence on December 31, 1983, while Lincoln Hills
housed 19 of the 25 boys from Native American backgrounds. Burglary, battery,

----------------------------- -----
-2-
and armed robbery were the delinquent acts most commonly reporten to have been
committed by males in residence on December 31, 1983.
Juvenile institution treatment programs have two basic goals: (1) to determine
a child's needs and (2) to provide both the assistance and opportunity to work
on meeting these needs. Infonnation about the problems and combinations of
problems with which boys in residence on December 31, 1983, were confronted can
be found in Table 5. Slightly more than one-tenth (11.1 percent) of the boys in
residence were reported as having problems that were not related to assaultive
behavior, drug/alcohol usage, or sexual behavior; less than 1 percellt with only
drug/alcohol related problems. Somewhat more than one-third (34.6 percent) of
the boys were reported to have problems with drugs and/or alcohol in combination
with other types of problems. Assaultive behavior, either by itself or in
combination with other types of problems was reported for over one-half (56.3
percent) of the boys in residence. Disabilities considered either developmental
or emotional in nature were reported for almost three-fourths (72.2 percent) of
the boys while 13 were considered to have physical as well as developmental or
emotional disabilities. Less than one-tenth (9.4 percent) were considered to be
without some type of physical, developmental, or emotional disability.
Lincoln Hills School reported 41 girls in residence On December 31, 1983; a
slight decrease from the previous year when 45 girls were in residence. The
majority (85.3 percent) were new commitments, 4 had been returned from state
aftercare supervision, and 2 were awaiting the outcome of state aftercare
revocation hearings. Commitments from Milwaukee (12), Dane (4), Racine (3), and
Rock (3) counties accounted for more than one-half (53.7 percent) of those in
residence. Almost two-thirds (63.4 percent) were reported to be from Nhite
non-Hispanic backgrounds While about one-fourth (24.4 percent) came from Black
family backgrounds. The average age was reported to be 16.0 years. The most
common delinquent acts committed by girls prior to institutionalization were
theft, battery, and burglary.
Drugs and/or alcohol, either alone or in combination with other types of
problems, were reported to present difficulties for just over one-half (51.2
percent) of the girls in residence on December 31, 1983. A somewhat larger

-3-
proportion (56.1 percent) had difficulties relatIng to assaultive behavior
either alone or in combination with drug and/or alcohol, sexual, or other
behavior problems. Developmental and/or emotional disabilities were reported as
affecting almost two-thirds (65.9 percent) of the residents.
Prepared by: Barbara Drown
7-31-22/F8
Office of Information Management and Operations Division of Corrections P.O. Box 7925 Madison, WI 53707
-

Table 1 Residents in J~venile Institutions by Institution and Sex
Type of Admission December 31, 1983
Juvenile Juvenile Ethan Allen Ty e of Admission Total Males Females School
Number 454 413 41 276
New Commi tment 365 330 35 210 Return from Aftercare 58 54 4 47
State Supervision (49) (45) ( 4) (43) County Supervision (7) ( 7) (--) ( 2) TRY Program ( 2) ( 2) (--) ( 2)
Not a Wisconsin Commitment 3 3 Temporary Hold Pending Revocation Hearing 28 26 2 19
State Supervision (27) (25) ( 2) (19) Count~ Supervision (--) (--) (--) (--) TRY Program ( 1) ( 1) (--) (--)
Percent 100.0 100.0 100.0 100.0 -- --New Commitment 80.4 79.9 85.3 76.1 Return from Aftercare 12.8 13.1 9.8 17.0
State Supervision (10.8) (10.9) ( 9.8) (15.6) County Supervision ( 1.6) (1.7) ( -- ) ( 0.7) TRY Program ( 0.4) ( 0.5) ( -- ) ( 0.7)
Not a tolisconsin Commitment 0.6 0.7 Temporary Hold Pending Revocation Hearing 6.2 6.3 4.9 6.9
State Supervision ( 6.0) (6.1) , ( 4.9) ( 6.9) County Supervision ( -- ) ( --) ( ) ( ) TRY Program ( 0.2) (0.2) ( -- ) ( -- )
L_
C-58jF8jbh
Males Females
178 137 41
155 120 35 11 7 4
( 6) ( 2) ( 4) ( 5) ( 5) (--) (--) (--) (--)
3 3 9 7 2 I
( 8) ( 6) ( 2) ~ I
(--) (--) (--) ( 1) ( 1) (--)
100.0 100.0 100.0 -- --87.1 87.6 85.3 6.2 5.1 9.8
(3.4) (1. 5) (9.8) (2.8) (3.6) ( --) ( --) ( --) ( --) 1.6 2.2 5.1 5.1 4.9
(4.5) (4.4) (4.9) ( --) ( --) ( --) (0.6) (0.7) ( --)
L--

--~-~----~~----------""'""----.~ ...... """""---....... ------~----------
Race and Ethnicity
Number
{fuite, Non-Hispanic \fuite, Hispanic Black, Non-Hispanic Black, Hispanic
Native American, Non-Hispanic Native American, Hispanic Other Hispanic No Data
Percent
White, Non-Hispanic \fuite, Hispanic Black, Non-Hispanic Black, Hispanic
Native American, Non-Hispanic Native American, Hispanic Other Hispanic No Data
C-58/FB/bh
Table 2 Residents in Juvenile Institutions by Institution and Sex
Race and Ethnicity December 31, 1983
Total rJu~:~!!e Juvenile Ethan Allen Females School
454 I 413 41 276 I I
232 i 206 26 99 14 ! 14 14
173 163 10 155
27 24 3 5 1 1 1 5 3 2 2 2 2
100.0 100.0 100.0 100.0 --- --- ---51.1 49.9 63.4 35.9 3.1 3.4 5.1
38.1 39.5 24.4 56.2
6.0 5.B 7.3 1.8 0.2 0.2 0.3 1.1 0.7 4.9 0.4 0.5 0.7
Lincoln Hills School Total I Males I Females
178 137 41
133 107 26
18 8 1D
22 19 3
5 3 2
100.0 100.0 100.0 ---74.7 78.1 63.4
10.1 5.8 24.4
12.4 13.9 7.3
2.8 2.2 4.9
1
I - ~ - _ L __ ~~ _I
I U1 I

,------------------------------------------------------------------------------------------------------------------------------------------------------------------------------------------------------------
Table 3 Residents in Juvenile Institutions, by Institution and Sex
COUNTY OF COMMITMENT December 31, 1983
County of Juvenile Juvenile Ethan Allen !
Commitment Total Males Females School
Total 454 413 41 276 178 137 ---Adams 1 1 1 1 Ashland Barron Bayfield Brown 12 12 1 11 11
Buffalo Burnett 1 1 1 1 Calumet 1 1 1 1 Chippewa 2 2 2 2 Clark I
0'> I
Columbia 1 1 1 Crawford 1 1 1 1 Dane 16 12 4 12 4 4 Dodge 3 2 1 1 2 1 1 Door
Douglas 3 3 3 3 Dunn 1 1 1 1 Eau Claire 1 1 1 1 Florence Fond du Lac 3 1 2 3 1 2
Forest Grant 2 2 2 2 Green Green Lake Iowa 1 1 1
1 ______ ---

Table 3 (continued)
County of -~-- -~1 Juven-ile 1 Juve;-Ue Ethan Allen School Commitment I_Tot~l __ ~al~s_ _E'~mCll~s __ School Females
Iron Jackson Jefferson 3 3 1 2 2 Juneau Kenosha 18 16 2 11 7 5 2
Kewaunee 1 1 1 LaCrosse 8 7 1 8 7 1 Lafayette Lang lade Lincoln
Manitowoc 3 3 3 3 Marathon 10 9 1 10 9 I
Marinette 2 2 2 2 Marquette
1
Henominee 2 2 2 2 "'-I 1
Milwaukee 197 185 12 176 21 9 12
Nonroe 7 7 4 3 3 Oconto 2 2 2 2
Oneida 3 1 2 3 1 2 Outagamie 13 11 2 13 11 2
Ozaukee 2 1 1 1 1 1
Pepin Pierce Polk I 1 1 1
Portage 5 5 5 5
Price Racine 28 25 3 10 18 15 3
Richland Rock 16 13 3 12 4 1 3
Rusk 1 1 1 1

C-58/F8/blh
Table 3 (concluded)
County of I Juvenile Juvenile I Ethan Allen Lincoln Hills School Commitment
St. Croix Sauk Sawyer Shawano Sheboygan
Taylor Trempealeau Vernon Vilas Walworth
Washburn Washington Waukesha Waupaca Waushara
Winnebago Wood
j Total Males Females School ' Total I
j -- -- -- I -- --1 1 -- i -- I 1 ! 3 3 -- I -- I 3 2 2 I - 1 1 1 7 6 1
I 7 I I --
I i I -- I -- I -- I -- --
I , I -- -- I --I -- --I I
i -- ! -- -- . -- --! i 3 3 I ! 3 ; i -- I --5 5 5
6 4 2 4 2 17 16 1 15 2
1 1 1
333 444
Not reported . 31 29 2 19! 12 ._J_~ __ l_._~___L_ ._~_ J _ J
Males
--1 3 1 6
------
3
1 1
3 4
10
I i
l 1 I
Females
--------
1
--------
2 1
2
I 00 I

--~-----, ... --...-----,,------~---------.... ---
Table 4 Residents in Juvenile Institutions by Institution and Sex
fviajor Delinquent Act Just Prior to Admission DeceI:lber 31, 1984
Najor Deliquent Act Just Prior to AdI:lission
l'lumber
Murder, degree unspe~ified Murder, attempted Negligent Honlicide Robbery, unarmed l{obbery, anted
Aggravateu oattery .Eattery Injury by conduct regardless of life Inj ury by negligent use of weapon
tlurglary, unanled Burglary, an' d Theft ALto tllett lte cei vi ng s to len pro pe rty forgery, Fraud
Sexual assault, cirst degree Sexual assault, second degree Sexual assault, third d~gree Sexual assault, fourth degree Commercial vice
Narcotic drug violacions Hallucenogenic druf, violations Other drug violations
Concealed weapons Resisting an of! icer Arson Criminal damage to prop«=rty
All otber No Data
Total
454
4 4 2
18 53
2 75
3 1
76 I:> 46 33
3 5
9 8 2 1 2
32 4
15 9
4 28
Juvenile Hales
413
4 4 2
1~
52
1 67
3 1
70 13 36 31
2 3
9 8 2 1
3L. 2
15 8
Juvenile Females
41
1
1 8
6 2
10 2 1 2
') L.
2
1
i I !
i !
3 1 I 26 2 J
Ethan Allen School
276
2 4 1
14 47
1 57
3 1
24 8
22 12
1
8 4 2
29 1
13 3
19
Lincoln Hills School Total I Hales IYer.lales
178
2
1 4 6
1 Ii>
52 7
24 21
2 5
1 4
1 2
3 3 2 6
4 ~
137
:2
, L
4 ~
10
46 )
14 1Y
1 3
1 4
1
'3 1 "
)
41
1
1 8
6 2
10 :2 1 2
" L
2
I
3 1 I 7 L 2 -L _____ _ __ _
I <D I

Table 4 (concluded)
Major Deliquent Act Juvenile Juvenile Ethan Allen Just Prior to Admission Total Males Females School Total Males Females
Percent 100.0 100.0 100.0 100.0 100.0 100.0 100.0 --- ---Murder, degree unspecified 0.9 1.0 0.7 1.1 1.5 Hurder, attemptzd 0.9 1.0 1.4 Negligent Homicide 0.4 0.5 0.4 0.6 0.7 Robbery, unarmed 4.0 4.4 5.1 2.2 2 q ./
Robbery, armed 11.7 12.6 2.4 17.0 3.4 3.7 2.4
Aggravated battery 0.4 0.2 2.4 0.4 0.6 2.4 Battery 16.5 16.2 19.5 20.7 10.1 7.3 19.5 Injury by conduct regardless of life 0.7 0.7 1.1 Injury by negligent use of weapon 0.2 I 0.2 0.4
Burglary. unarmed 16.7 17.0 14.6 8.7 29.2 33.6 14.6 Burglary, armed 3.3 3.2 4.9 2.9 3.9 3.7 4.9 Theft 10.1 8.7 24.5 8.0 13.5 10.2 24.5 Auto theft 7.3 7.5 4.9 4 .. 3 11.8 13.9 4.9 Receiving stolen property 0.7 0.5 2.4 0.4 1.1 0.7 2.4 I
-'
Forgery, Fraud 1.1 0.7 4.9 2.8 2.2 4.9 0 I
Sexual assault, first degree 2.0 i 2.2 2.9 0.6 0.7 Sexual assault, second degree 1.8 1.9 1.4 2.2 2.9 Sexual assault, third degree O. I. 0.5 0.7 Sexual assault, fourth degree 0.2 0.2 0.6 0.7 Commercial vice 0.4 4.9 1.1 4.9
Narcotic drug violations Rallucenogenic drug violations Other drug violations
Concealed weapons 7.0 7.8 10.5 1.7 2.2 Resisting an officer 0.9 0.5 4.9 0.4 1.7 0.7 4.9 Arson 3.3 3.6 4.7 1.1 1.5 Criminal damage to property 2.0 ' 1.9 2.4 1.1 3.4 3.7 2.4
All other 0.9 0.7 2.4 2.2 2.2 2.4 Unknown 6.2 6.3 4.9 6.8 5.1 5.0 4.9
C-58/F8/beh

' __ ~ __________________ ~ ____ ~ __ >-~ ______________ ~,~~ .• ~'~.~~,~,~.~~ __ -u~.-------~ '~~~~.r-----------------------
Table 5 Residents in Juvenile Institutions by Ins ti tution and Sex:
Major Problem Areas December 31, 1983
_Gotal Juvenile Juvenile Et~~~o!ilen jTJi~cI~~M~i~!S J SC~~~~!~s-=-Major Problem Areasa Males Females
I I !
Number
/
454 413 41 276 ; 178 137 41 .---
Problems not related to assaultiveness, I drugs or sex
I 49 46 3 27 22 19 3
Drug related problems only 3 3 2 1 1 Sex related problems only Drug-related and other problems 67 60 7 29 38 31 7 Drug and sex-related problems Sex and other problems 3 3 3 3 Drug, sex, and oLher problems 3 3 3 3
Assault r.elated problems only 19 18 1 15 4 3 1 Assault and drug-related problems 4 3 1 4 3 1 Assault and sex related problems 3 1 2 1 2 2 Assault and other problems 122 114 8 90 32 24 8 Assault, drug and other problems 78 71 7 46 32 25 7 Assault, sex and other problems 17 16 1 12 5 4 1 Assault, drug, and sex problems 1 1 1 1 Assault, drug, sex and other problems 11 8 3 6 5 2 3
Held pending revocation hearing 32 30 2 23 9 7 2 Not reported 42 42 25 17 17
~ These are areas in which it was determined that juvenile had or did not have problems. They do not represent delinquent acts.
f -' -'

Table 5 (concluded)
Juvenile Juvenile Ethan Allen , Lincoln Hills School Major Problem Areas Total Males Females School Total Hale-s"r--F emales--
I I
Percent 100.0 100.0 100.0 100.0 100.0 100.0 I 100.0 -- -- -1 I
7.3 I 12.4 13.9 l 7.3 10.8 1 11.1 9.8
I I 0.6 i I
0.7 I 0.7 -- 0.7 0.7 ! --I
, , -- -- -- -- ! -- I i --
14.8 I 14.5 17.1 10.5 I -- I 17.1 21.3 I 22.6 I
I ! -- I -- -- -- I -- ! -- I --I !
I
0.7 t 7.3 1. 7 I i 7.3 , -- I -- -- i
0.7 I 7.3 I I 7.3 I -- -- ! 1.7 --g, x, a ther problems
Assault related problems only 4.2 4.4 2.4 5.4 2.2 2.2 2.4 Assault and drug-related problems 0.9 0.7 2.4 2.2 2.2 2.4 I
Assault and sex related problems 0.7 0.3 4.9 0.4 1.1 4.9 -' N
Assault and other problems 26.8 27.6 19.6 32.5 18.0 17.5 19.6 I
Assault, drug and other problems 17.2 17.2 17.1 16.7 18.0 18.3 17.1 Assault, sex and other problems 3.7 3.9 2.4 4.4 2.8 2.9 2.4 Assault, drug, and sex problems 0.2 0.3 0.6 0.7 Assault, drug, sex and other problems 2.4 1.9 7.3 2.2 2.8 1.5 \ 7.3
Held pending revocation hearing 7.0 7.3 4.9 8.3 5.1 5.1 4.9 Not reported 9.2 10.1 9.1 9.5 12.4
C-58/F8/beh
•

------Current Age
Number
12 years 13 years 14 years
15 years 16 years 17 years 18 years
Percent
12 years 13 years 14 years
15 years 16 years 17 years 18 years
Nedian Age
Average (Mean) Age
C-58/F8/heh
Table 6 Residents in Juvenile Institutions by Institution and Sex
Current Age December 31, 1983
a 044::;--'
Juvenile Juvenile Ethan Alien -, - LincOln Hills School Total Nales Females School I Total I --Males r Females
454 413 41 276 178 i 137 41 J
I
I 1 1 1 i 1 7 6 1 Lf 3
, 2 1
27 24 3 13 14 11 3
66 60 6 35 31 25 6 141 127 14 80 61 47 14 175 161 14 117 58 44 14
37 35 2 27 10 8 2
100.0 100.0 100.0 100.0 100.0 : 100.0 100.0 I -- -- -- --- -' w
0.2 2.4 0.6 2.4 I
1.5 1.5 2.4 1.4 1.7 1.5 2.4 6.0 5.8 7.3 4.7 7.9 8.0 7.3
14.5 H.5 14.6 12.7 17.3 ' 18.3 14.6 31.1 30.7 34.2 29.0 34.3 34.3 34.2 38.5 39.0 34.2 42.4 32.6 32.1 34.2 8.2 8.5 4.9 9.8 5.6 i 5.8 4.9
16 16 16 17 16 16 16
16.2 16.2 16.0 16.4 16.0 16. 1 16.0

-----------------------
Table 7 Residents in Juvenile Institutions by Institution and Sex
Current Disabilities December 31, 1983
Juvenile Juvenile Ethan Allen Lincoln Hills School Current Disabilities
Number
o data
Percent
No current disabilities
Physical disabilities Developmental/emotional disabilities Physical/developmental/emotional disabilities
No data
C-58/FB/beh
Total Males Females School Total
454 413 41 I
276 178 -- -- -
I -- --
44 I 39 5 6 38 I I
I I 1 I -- I -- I .l-
325 298 27 1
222 103 15 I 13 2 2 13
69 63 6 46 23
100.0 100.0 100,0 100.0 100.0 -- --9.7 9.4 12.2 2.2 21.3
I 0.2 2.4 0.6
I 71.6 72.2 65.9 BO.4 57.9 3.3 I 3.1 4.9 0.7 7.3
I I
! I I I
I I I
! I
1
Males r 137 ! -! 33
--76 11
17
100.0
24.1
55.5 B.O
I j
! I
! ,
L 15.21 15.3 14.6 16.7 12.9 I 12.4
Females
41 -5
I 27
2
6
100.0
12.2
2.4 65.9 4.9
14.6
I --' ..p. I

~-----,-~--- ----,_.-- -;------- .
Table 8 Residents in Juvenile Institutions by Institution and Sex
Highest Grade Completed December 31, 1983
Juvenile Juvenile Ethan Allen Lincoln Hills School Highest Grade Completed Total Males Females School Total I Males I Females
Number 454 413 41 276 178 137 41 ---Ungraded Special 50 50 50 Less than fourth Fourth Fifth Sixth 6 4 2 2 4 2 2 Seventh 21 20 1 9 12 11 1 Eighth 81 74 7 42 39 32 7
Ninth 122 107 15 70 52 37 15 Tenth 49 44 5 31 18 13 5 Eleventh 10 9 1 7 3 2 1 I
Twelfth 2 2 1 1 1 ---' Ul
High School Graduate 1 1 1 1 I
HED or GED Certificate 38 34 4 23 15 11 4 No Data 74 68 6 41 33 27 6
Percent 100.0 100.0 100.0 100.0 100.0 : 100.0 100.0 -- -- --Ungraded Special 11.0 12.1 18.1 Less than fourth Fourth Fifth Sixth 1.3 1.0 4.9 0.7 2.2 1.5 4.9 Seventh 4.6 4.8 2.4 3.3 6.8 8.0 2.4 Eighth 17.9 17.9 17.1 15.2 21. 9 23.4 17.1
Ninth 26.9 25.9 36.6 25.4 29.2 27.0 36.6 Tenth 10.8 10.7 12.2 11.2 10.1 9.5 12.2 Eleventh 2.2 2.2 2.4 2.5 1.7 1.5 2.4 Twelfth 0.4 0.5 0.4 0.6 0.7 High School Graduate 0.2 0.2 0.6 0.7 HED or GED Certificate 8.4 8.2 9.8 8.3 8.4 8.0 9.8 No Data 16.3 16.5 14.6 14.9 18.5 19.7 14.6
_________ J C-58/F8/beh

-------. Intelligence Estimate
Number -
Superior and above Bright normal Normal
Dull normal Borderline Defective
No Data
Percent
Superior and above Bright normal Normal
Dull normal Borderline Defective
No Data
C-58/F8/beh
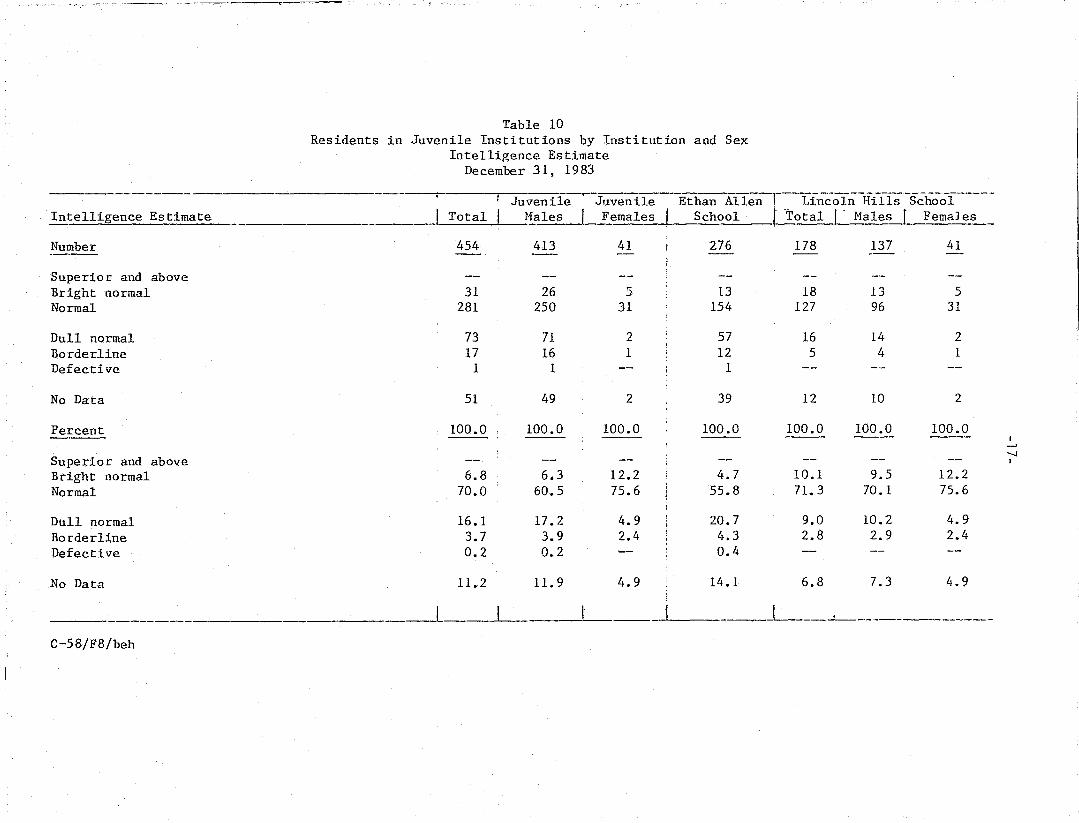
Table 10 Residents in Juvenile Institutions by Institution and Sex
Intelligence Estimate December 31, 1983
I Juvenile Juvenile -~-- ---------.-----------
Ethan Allen. Lincoln Hills School Total Males Females School rTotal I· Males r FemaJes
454 413 41 276 178 137 41
31 26 :> l3 18 13 5 281 250 31 154 127 96 31
73 71 2 57 16 14 2 17 16 1 12 5 4 1
1 1 1
51 49 2 39 12 10 2
100.0 100.0 100.0 100.0 100.0 100.0 100.0 -- --
6.8 6.3 12.2 4.7 10.1 9.5 12.2 70.0 60.5 75.6 55.8 71. 3 70.1 75.6
16.1 17.2 4.9 20.7 9.0 10.2 4.9 3.7 3.9 2.4 4.3 2.8 2.9 2.4 0.2 0.2 0.4
11.2 11. 9 4.9 14.1 6.8 7.3 4.9
----.l -L-__ , ____________
I ~
-.J I

----------------
Time in Institution
Number
Less than 3 months 3 months, less than 6 6 months, less than 9 9 months, less than 12 12 months, less than 15 15 months, less than 18 18 months and over
Percent
Less than 3 months 3 months, less than 6 6 months, less than 9 9 months, less than 12 12 months, less than 15 15 months, less than 18 18 months and over
Median Stay Average (Mean) Stay
C-58/F8/bh
Table 11 Residents in Juvenile Institutions by Institution and Sex
Time in Institution December 31, 1983
Juvenile Juvenile Ethan Allen Lincoln Hills School Total Males Females School Total
I 454
I 413 41 276 , 178 -- - -- , --I
I
184 167 17 107 I 77 I !
I 94 I 82 12 57 I 37 I
75 I 70 5 45 30
[ 50 { 45 5 33 I 17 18 17 1 12 6 , I i 17 16 1 11 6 I I 16 16 -- r 11 I 5
1 i
I 100.0 100.0 100.0 100.0 i 100.0 --- : ---I !
40.5 40.4 I 41.5 38.8 I 43.3 !
I I 20.7 19.9 29.3 20.6 I 20.8 I I , f
16.5 17.0 12.2 16.3 16.9 11.0 I 10.9 12.2 12.0 9.6 4.0 4.0 2.4 4.3 3.3 3.8 3.9 2.4 4.0 3.3
Males
137 --I 60
25 25
I 12
5 I 5 f
! 5 ! ;
! 100.0 . ---
43.8 18.3 18.3 8.8 3.6 3.6
t
I i t I
i ( j
I I 1
I I l i I , ,
Females
41 -
17 12
5 5 1 1
--
100.0
41.5 29.3 12.2 12.2 2.4 2.4
3.6 3.5 3.9 I 4.0 2.8 ---L-__ _
441 3 443
5.4 5.5 1_ 4.1 1 5.6 ___ ~._1~ 5.4
3 4.1
. -~------.----''-----
co I

-19-
APPENDIX TABLE A
Selected Characteristics of Juvenile Males
in Residence on December 31, 1979-1983
Selected Characteristics 1979 1980 1981
Boys in Residence on December 31 563 460 439
Percent ~.,ith new commitments 71.6 78.9 83.4
Percent committed from Milwaukee County 32.7 38.7 41.2
Hedian age (in years) 16.7 16.5 16.6
Median time in institution (in months) 4.8 4.5 4.7
APPENDIX TABLE B
Selected Characteristics of Juvenile Females
in Residence on December 31, 1979-1983
Selected Characteristics 1979 1980 I 1981
Girls in Residence on Decemher 31 42 35 37
Percent with new commitments 69.0 88.6 89.2
Percent committed from Milwaukee County 38.1 28.6 16.2
Hedian age (in years) 3.3 2.6 3.5
Hedian time in institution (in months) 16.3 16.1 16.4
7-3l-22/F8
1982 1983
470 413
86.B 79.9
44.9 44.8
16.8 16.0
5.0 4.0
1982 1983
45 41
86.6 85.3
20.0 29.3
2.9 4.0
16.6 16.0