residential unit density
DESCRIPTION
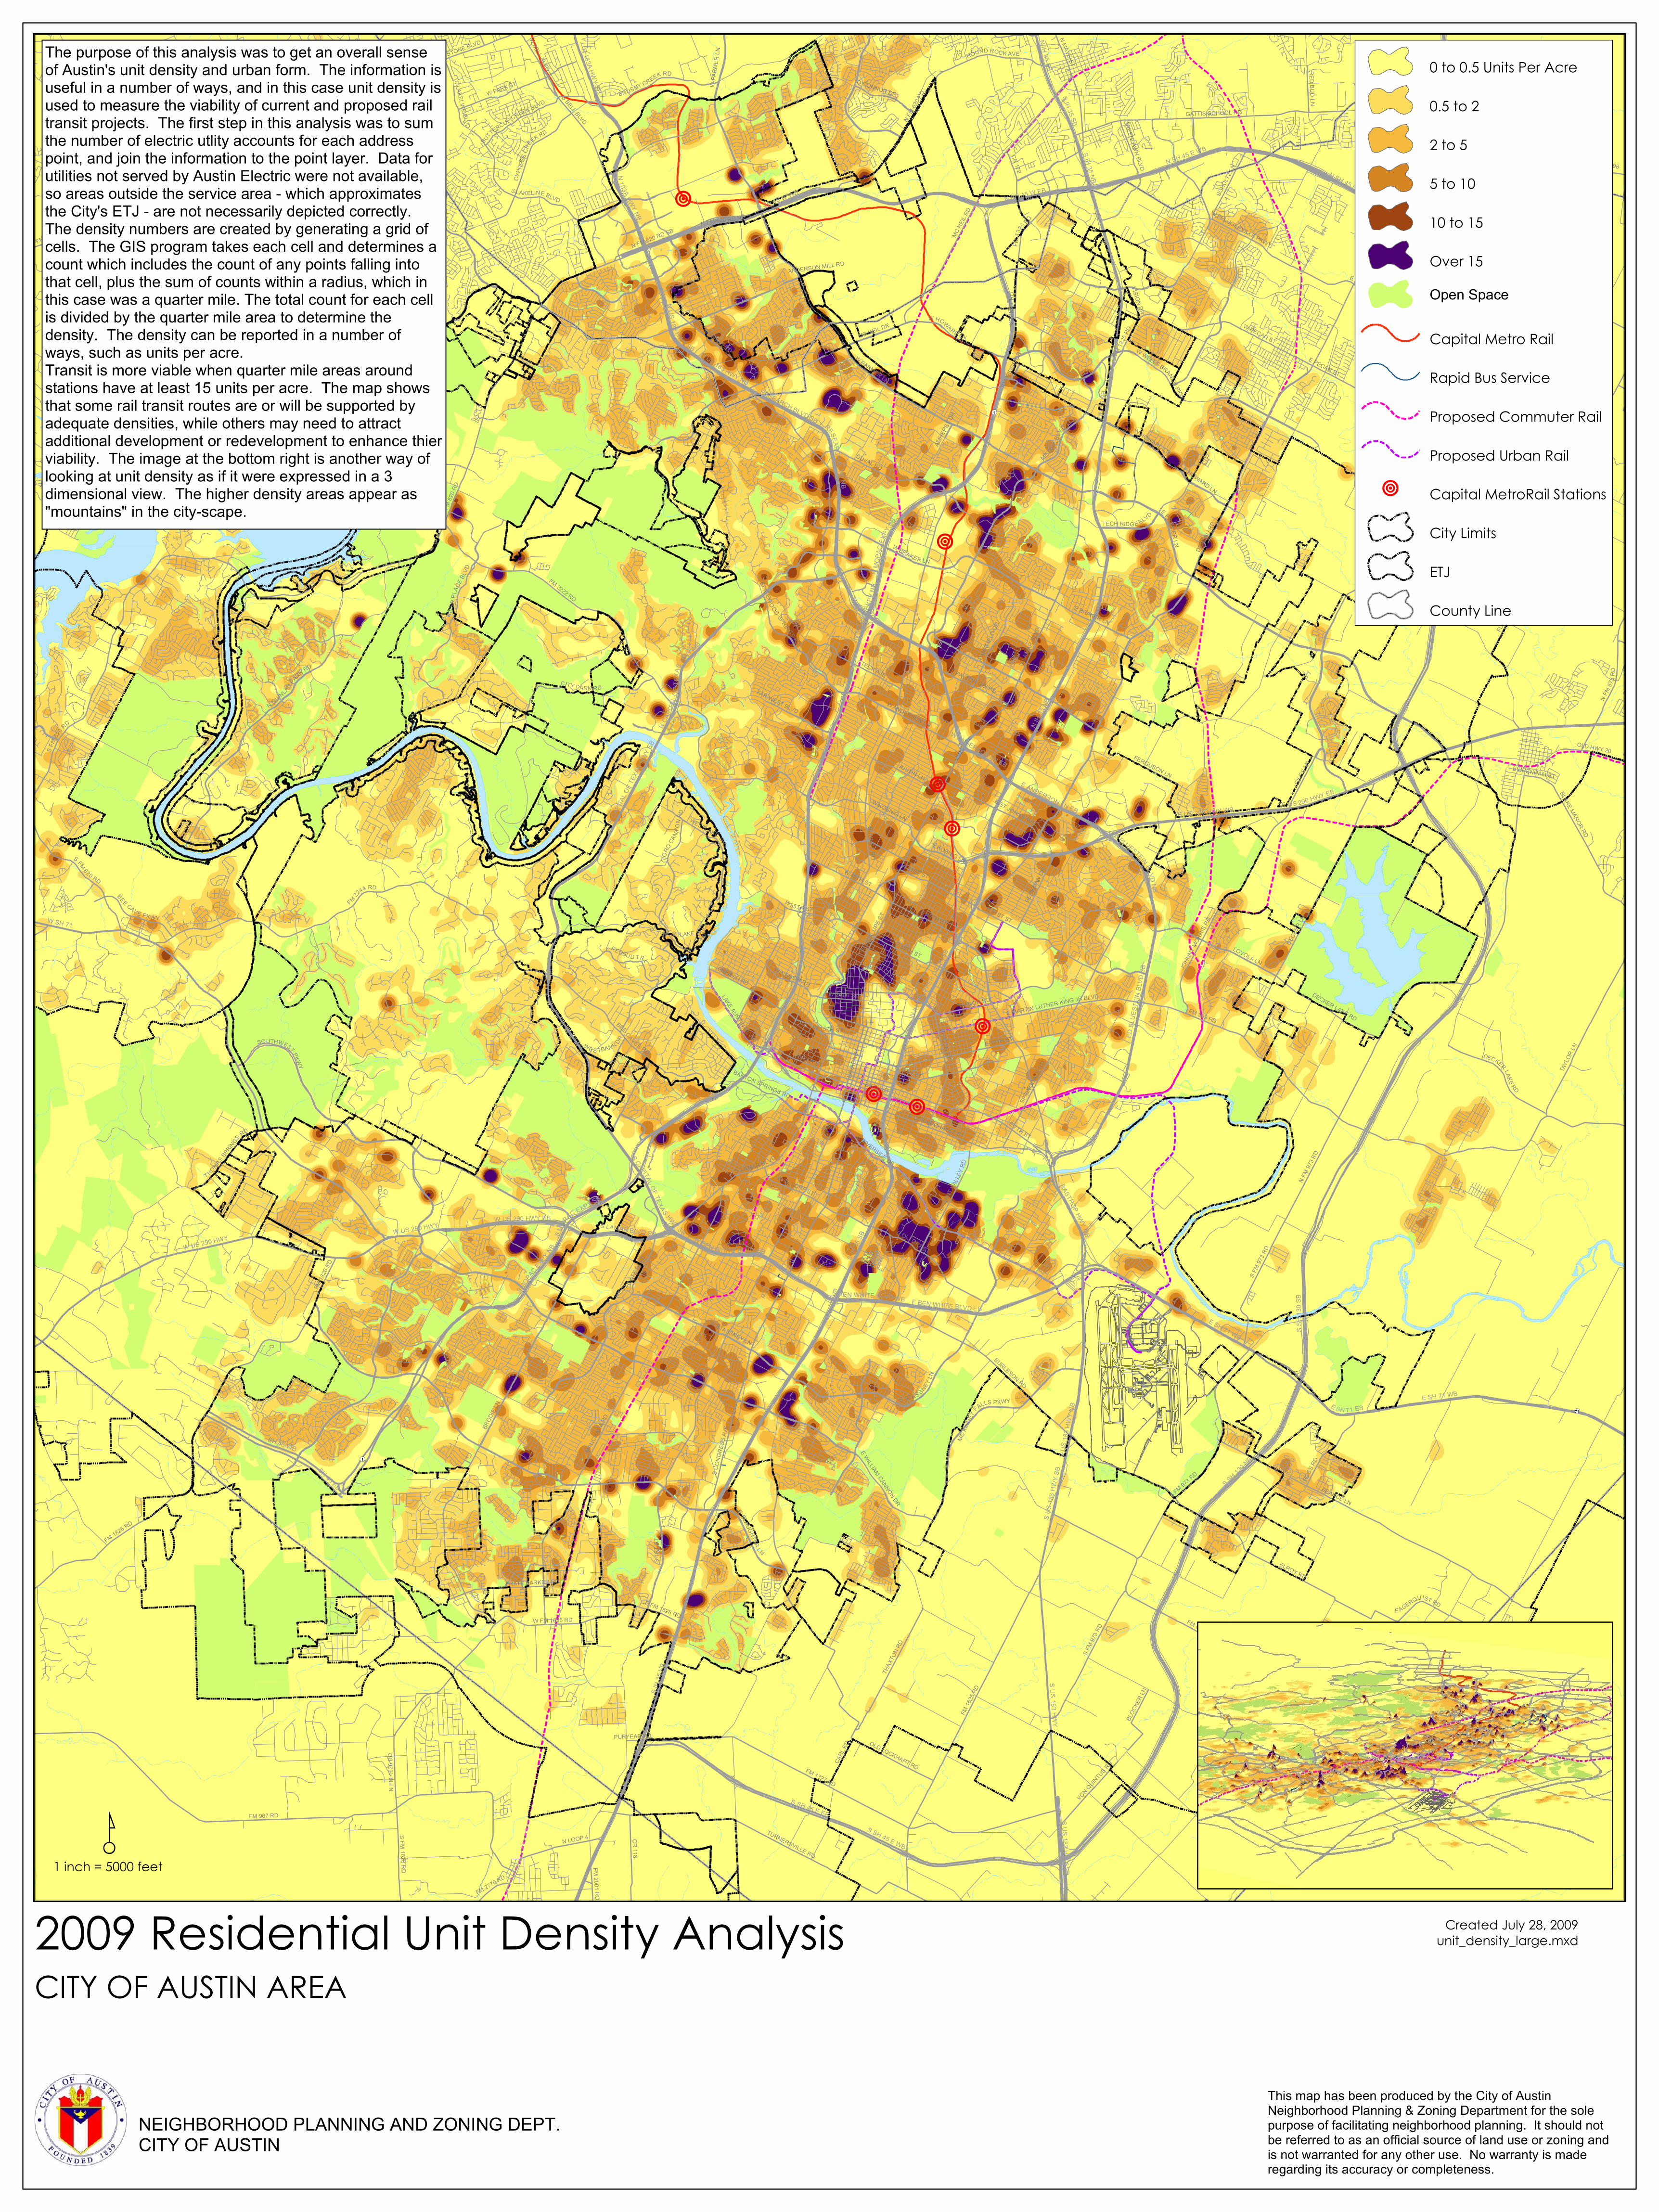
This map is based on a geographic information system (GIS) analysis of utlity and appraisal records. The density is created in GIS by generating a grid of 100x100 foot cells with a sum of units that fall in the cell, plus units of other cells within a radius, which in this case was a quarter mile. The total count for each cell is divided by the area of the cell, which provides a density. The density can be reported in a number of ways, such as units per acre. Transit is more viable when quarter mile areas around stations have at least 15 units per acre. The image at the bottom right is another way of looking at unit density as if it were expressed in a 3 dimensional view. The higher density areas appear as "mountains" in the city-scape. Data for utilities not served by Austin Electric were not available, so areas outside the service area - which approximates the City's ETJ - are not necessarily depicted correctly.TRANSCRIPT
183
130
71
290
1
1
N IH
35 SB N SH 130 SB
N IH 3
5 NB
N SH 130 NB
S IH 3
5 SB
S SH
130 S
B
S SH 130 N
B
W SH 71
E SH 71 EB
N MO
PAC
EXPY
SB
N MO
PAC E
XPY N
B
E US 290 HWY EB
E US 290 HWY WB
S SH 45 E EB
S MOPAC EXP
Y NB
S SH 45 E WB
S MOP
AC EXPY SB
N SH 45 W EB
N SH 45 W WB
W US 290 HWY
N SH 45 E EB
S US 183 HWY
N SH 45 E WB
RESEARCH BLVD SB RESEARCH BLVD NB
E SH 71 WBSH 45 EB
SH 45 WB
N CAP
ITAL O
F TEX
AS HW
Y SB
N CAP
ITAL O
F TEX
AS HWY NB
ED BL
UEST
EIN BL
VD SB
ED BLUESTEIN BLVD NB
E BEN WHITE BLVD EB
S IH 35 NB
E BEN WHITE BLVD WB
N 183A HWY SB
N 183A HWY NB
N US 18 3 HWY SBN US 183 HWY NB
S CAPITAL OF TEXAS HWY SBW US 290 HWY EB
E ANDERSON LN EB
W BEN WHITE BLVD EB
S US 183 HWY SB
S US 1
83 H
WY N
B
BASTROP HWY NB
N IH 3
5 UPP
ER DE
CK SB
S LAMAR BLVD SB
W ANDERSON LN EB
N IH 35 SB
S IH 3
5 NB
S IH 35 SB
E SH 71 WB
S US 1
83 H
WY SB
W US 290 HWY
N FM
620 R
D
FM 967 RD
FM 969 RD
FM 812 RD
N FM
973 R
D
FM 2222 RD
FM 1327 RD
FM 22
44 RD
MANC
HACA
RD
FM 16
25 RD
FM 1 431 RD
FM 68
5 RD
CAME
RON R
D
MC NE
IL RD
DECK
ER LN
PEARCE LN
FM 27 6 9 RD
S CON
GRES
S AVE
BURLESON RD
N LAM
AR BL
VD
E 7TH ST
MANOR RD
S FM 973 RD
FM 1826 RD
L IME CREEK RD
TURNERSVILLE RD
E 12TH ST
SPRIN
GDAL
E RD
CR 138
E PECAN ST
TAYL
OR LN
W FM 1626 RD
N FM 620 RD SBN FM 620 RD NB
OLD LOCKHART RD
ELROY RD
E OLTORF ST
WEISS L
N
CR 13
9
BEE CAVES RD
E 51ST ST
GUAD
ALUP
E ST
CELE RD
CR 118
W PECAN ST
S BELL BLVD
JOHN
NY M
ORRIS
RD
BURN
ET R
D
S FM 620 RD
CR 172
THAX
TON R
D
W 45TH ST
ROWE LN
E PFLUGERVILLE PKWY
CHICON ST
S LAMAR BLVD
W 6TH ST
F AGERQUIST RD
GATTIS SCHOOL RD
N FM
1626
RD
STECK AVECITY PARK RD
ROSS
RD
E CESAR CHAVEZ ST
N LOOP 4
DUVAL RD
FUCH
S GRO
VE RD
W PARK ST
WES TLAKE DR
BLAKE MANOR RD
BRUSHY CREEK RD
E MARTIN LUTHER KING JR BLVD
W WHITESTONE BLVD
BULLICK HOLLOW RD
JESSE BO HLS R D
S LAKELINE BLVD
S 1ST
ST
JUSTIN LN
ENFIELD RD
LAVA
CA ST
S FM 1626 RD
CYPR
ESS C
RE
EK RD
DECKER LAKE RD
RIVE
R PL
ACE B
LVD
PARK
FIELD
DR
N QUINLAN PA
RK RD
REDBU D TRL
CR 198
W 35TH ST
FM 13
25 RD
WEST GATE B
LVD
GILES
LN
CARL
RD
SCHU
LTZ L
N
ROUND ROCK AVE
BERK
MAN D
R
TORO
CANY
ON R
D
E ST JOHNS AVE
DESS
AU RD
W OLTORF ST
BEE CAV E PKWY
OLD HWY 20
W 24TH ST
VON QUINTUS RD
E 5TH ST
BLOC
KER L
N
E 45TH ST
E SLAUGHTER L N
LAKE AUSTIN BLVD
MC NEIL DR
ANDERSON MILL RD
PAYTON GIN RD
W PA
RMER
LN
FM 18
25 RD
E PARMER LNW BRAKER LN
LOYOLA LN
THOMAS SPR
INGS RD
FERGUSON LN
W KOENIG LN
WIN DSOR RD
POND SPRINGS RD
W ANDERSON LN
N BELL BLVD
PR IEM LN
RED BUD LN
E 38TH ST
SOUTHWEST PKWY
N MAYS ST
BUTTERCUP CREEK BLVD
VISION DRTECH RIDG E BLVD
BROD
IE LN
W STASSNEY LN
FM 2770 RD
WE S TBAN K DR
GREENLAWN BLVD
O CONNOR DR
E STA SSNEY LN
S PLE
ASAN
T VAL
LEY R
D
FM 2001 RD
E FM 1626 RD
W 51ST ST
W PFLUGERVILLE PKWY
E HOWARD LN
E WILLIAM CANNON DR
E BRAKER LN
W HOWARD LN
E 11TH ST
E RIVERSIDE DR
BARTON SPRINGS RD
MC KI
NNEY
FALLS PKWY
METR IC BL
VD
SPICEWOOD SPRINGS RD
WOODALL DR
W WELLS BRANCH PKWY
FAR WEST BLVD
W 15TH ST
IDA RI
DGE D
R
E BRENHAM ST
E KOENIG LN
AMHE
RST D
R
FRATE BARKER RD
PURYEAR RD
BURNET RD
W HOWARD LN
S 1ST
ST
ROWE LN
S LAKELINE BLVD
S FM
973 R
D
N FM
973 R
D
S FM
973 R
D
WESTLAKE DR
S FM
620 RD
N FM 62
0 RD
W PARMER LN
FM 18
26 RD
DECKER LAKE RD
NEIGHBORHOOD PLANNING AND ZONING DEPT.CITY OF AUSTIN
2009 Residential Unit Density AnalysisCITY OF AUSTIN AREA
Created July 28, 2009unit_density_large.mxd
This map has been produced by the City of AustinNeighborhood Planning & Zoning Department for the solepurpose of facilitating neighborhood planning. It should notbe referred to as an official source of land use or zoning andis not warranted for any other use. No warranty is maderegarding its accuracy or completeness.
1 inch = 5000 feet
0 to 0.5 Units Per Acre
0.5 to 2
2 to 5
5 to 10
10 to 15
Over 15Open Space
Capital Metro Rail
Rapid Bus Service
Proposed Commuter Rail
Proposed Urban Rail
Capital MetroRail Stations
City Limits
ETJ
County Line
The purpose of this analysis was to get an overall senseof Austin's unit density and urban form. The information isuseful in a number of ways, and in this case unit density isused to measure the viability of current and proposed railtransit projects. The first step in this analysis was to sumthe number of electric utlity accounts for each addresspoint, and join the information to the point layer. Data forutilities not served by Austin Electric were not available,so areas outside the service area - which approximatesthe City's ETJ - are not necessarily depicted correctly.The density numbers are created by generating a grid ofcells. The GIS program takes each cell and determines acount which includes the count of any points falling intothat cell, plus the sum of counts within a radius, which inthis case was a quarter mile. The total count for each cellis divided by the quarter mile area to determine thedensity. The density can be reported in a number ofways, such as units per acre.Transit is more viable when quarter mile areas aroundstations have at least 15 units per acre. The map showsthat some rail transit routes are or will be supported byadequate densities, while others may need to attractadditional development or redevelopment to enhance thierviability. The image at the bottom right is another way oflooking at unit density as if it were expressed in a 3dimensional view. The higher density areas appear as"mountains" in the city-scape.