residential pv - assets.kpmg · pv so as to avoid risks around technology becoming obsolete. on the...
TRANSCRIPT

Residential PV
CUSTOMER EXPERIENCES AND FUTURE DEVELOPMENTS A report for Energy Consumers Australia
December 2016

KPMG | 2
© 2016 KPMG, an Australian partnership and a member firm of the KPMG network of independent member firms affiliated with KPMG International Cooperative (“KPMG International”), a Swiss entity. All rights reserved. The KPMG name and logo are registered trademarks or trademarks of KPMG International.
Liability limited by a scheme approved under Professional Standards Legislation.
Important Notice
If you are a party other than Energy Consumers Australia, KPMG:
· owes you no duty (whether in contract or in tort or under statute or otherwise) with respect to or in connection with the attached report or any part thereof; and
· will have no liability to you for any loss or damage suffered or costs incurred by you or any other person arising out of or in connection with the provision to you of the attached report or any part thereof, however the loss or damage is caused, including, but not limited to, as a result of negligence.
If you are a party other than Energy Consumers Australia and you choose to rely upon the attached report or any part thereof, you do so entirely at your own risk.
Limitations
The responsibility for determining the adequacy or otherwise of our terms of reference is that of Energy Consumers Australia.
The services provided under our engagement letter (‘Services’) have not been undertaken in accordance with any auditing, review or assurance standards. Any reference to ‘audit’ and ‘review’, throughout this report, is not intended to convey that the Services have been conducted in accordance with any auditing, review or assurance standards. Further, as our scope of work does not constitute an audit or review in accordance with any auditing, review or assurance standards, our work will not necessarily disclose all matters that may be of interest to Energy Consumers Australia or reveal errors and irregularities, if any, in the underlying information.
In preparing this report, we have had access to information provided by other consultants engaged by the Energy Consumers Australia and publicly available information. We have relied upon the truth, accuracy and completeness of any information provided or made available to us in connection with the Services without independently verifying it. The publicly available information used in this report is current as of October 2016. We do not take any responsibility for updating this information if it becomes out of date.
This report provides a summary of KPMG’s findings during the course of the work undertaken for Energy Consumers Australia under the terms of the engagement letter.
Any findings or recommendations contained within this report are based upon our reasonable professional judgement based on the information that is available from the sources indicated. Should the project elements, external factors and assumptions change then the findings and recommendations contained in this report may no longer be appropriate. Accordingly, we do not confirm, underwrite or guarantee that the outcomes referred to in this report will be achieved.
We do not make any statement as to whether any forecasts or projections will be achieved, or whether the assumptions and data underlying any such prospective financial information are accurate, complete or reasonable. We will not warrant or guarantee the achievement of any such forecasts or projections. There will usually be differences between forecast or projected and actual results, because events and circumstances frequently do not occur as expected or predicted, and those differences may be material.

KPMG | 3
© 2016 KPMG, an Australian partnership and a member firm of the KPMG network of independent member firms affiliated with KPMG International Cooperative (“KPMG International”), a Swiss entity. All rights reserved. The KPMG name and logo are registered trademarks or trademarks of KPMG International.
Liability limited by a scheme approved under Professional Standards Legislation.
Executive summary Over the last decade there has been a rapid increase in the number of households installing solar PV systems on their rooftop. Approximately 1.5 million households now have solar panels and are generating their own electricity. However, there is limited information about the experiences of these customers and whether their investment has met their expectations. Further, there is incomplete evidence on how the residential solar PV market is contributing towards general efficiency of electricity markets.
Energy Consumers Australia has initiated a research project to conduct a stocktake of the residential solar PV market and test whether solar customers are getting the outcomes they expected from their investment in solar PV, including value for money, quality and performance of the systems. To this end, Energy Consumers Australia engaged KPMG and three other technical consultants to gather evidence and identify learnings on a range of matters relating to residential solar PV installations, including the potential integration of battery storage.
In summary, we have found that:
· Residential customers are generally satisfied with the performance of their system. However, many customers do not understand how their systems operate or how to get the most value from their systems. There is also evidence that some customers are being sold systems that are not appropriately sized for them.
· The factors affecting outcomes for both individuals and the market are influenced by multiple entities in both the solar industry and the traditional electricity industry. Incentives on these entities do not always align and policies between the two industries have historically been inconsistent. Going forward, however, incentives are becoming better aligned.
· Future uptake of solar PV will depend on a number of factors. There are limitations on the capacity of distribution networks to incorporate PV without additional investment. Barriers remain to certain customers, including the majority of apartment dwellers and renters, and those that cannot afford the upfront costs of installation. In the short term it is uncertain how battery storage will influence the uptake of solar PV, but in the long run it may strengthen uptake.
· Customers need access to the information and tools they require in order to make informed decisions. Battery storage adds an additional dimension to an already complex energy market and requires the customer to make decisions on multiple variables relating to the use of batteries and how to integrate batteries with a solar PV installation.
· Battery storage also has the potential to contribute to market efficiency provided incentives for customers are aligned with efficient market outcomes. Also the financial value will need to improve –either through reduced costs or tariff changes - before battery storage becomes cost effective for the majority of customers. The battery storage market is in its infancy and further policy work is needed on a range of matters including regulation, standards and safety.
Background and context
Energy Consumers Australia initiated a project to obtain evidence on residential customers’ experiences when they install solar PV and assess whether customers’ expectations about their solar PV are being met. To this end, the objective of this project was to gather evidence and identify learnings on a range of matters relating to residential solar PV installations. Further details on the scope and methodology for this project are set out in Chapter 1.
KPMG | 4
© 2016 KPMG, an Australian partnership and a member firm of the KPMG network of independent member firms affiliated with KPMG International Cooperative (“KPMG International”), a Swiss entity. All rights reserved. The KPMG name and logo are registered trademarks or trademarks of KPMG International.
Liability limited by a scheme approved under Professional Standards Legislation.
Energy Consumers Australia initiated this report partly in response to the rapid increase in households installing solar PV. Between 2006 and 2011 the number of installations grew rapidly. Approximately 1.5 million households now have solar PV on their rooftop.
The factors affecting outcomes for both individuals installing PV and the wider electricity market are influenced by multiple entities in both the solar industry and the traditional electricity industry. These entities include policy makers, regulators, complaint handlers as well as businesses. These entities each have their own objectives, whether it be to develop policy in a specific area, create or enforce standards, or make profit. As a result, different frameworks and approaches have not always worked in a complementary way.
The development of the market and the various influences in the solar industry, including those entities that can assist customers with certain issues relating to their solar PV system, are discussed further in Chapter 2.
There are a number of financial benefits from installing solar PV. These are derived from government incentive schemes, such as feed-in tariffs that provide a payment for generation that is exported, and savings in a customer’s electricity bill from avoiding importing electricity from the grid. Determining the savings available to a customer from installing solar PV is a complex exercise that depends on a number of factors.
Once installed, the incentives on a customer to shift their consumption to a different time of day will depend on the level and structure of their retail tariff relative to the payment they receive for exporting electricity. In principle, all new solar PV customers have a financial incentive to align their consumption patterns to the times during the day when solar PV output is maximised. However whether customers respond to this incentive will depend on the information provided, whether the customer has the ability to shift their consumption and their preference to do so.
Under current regulatory arrangements, solar PV customers are rewarded by the volume of their electricity generated and not by when during the day the electricity is generated. There are current reforms being progressed to network tariffs which result in a time of day incentive to solar PV customers. However, the effectiveness of these tariffs rely on the underlying structure of the network tariff being incorporated into retail price structures and the necessary metering technology to implement those tariffs.
The value proposition for customers installing solar PV and the impact of various tariff structures on the incentives customers face to shift their consumption is discussed in Chapter 3.
Assessing the customer experience
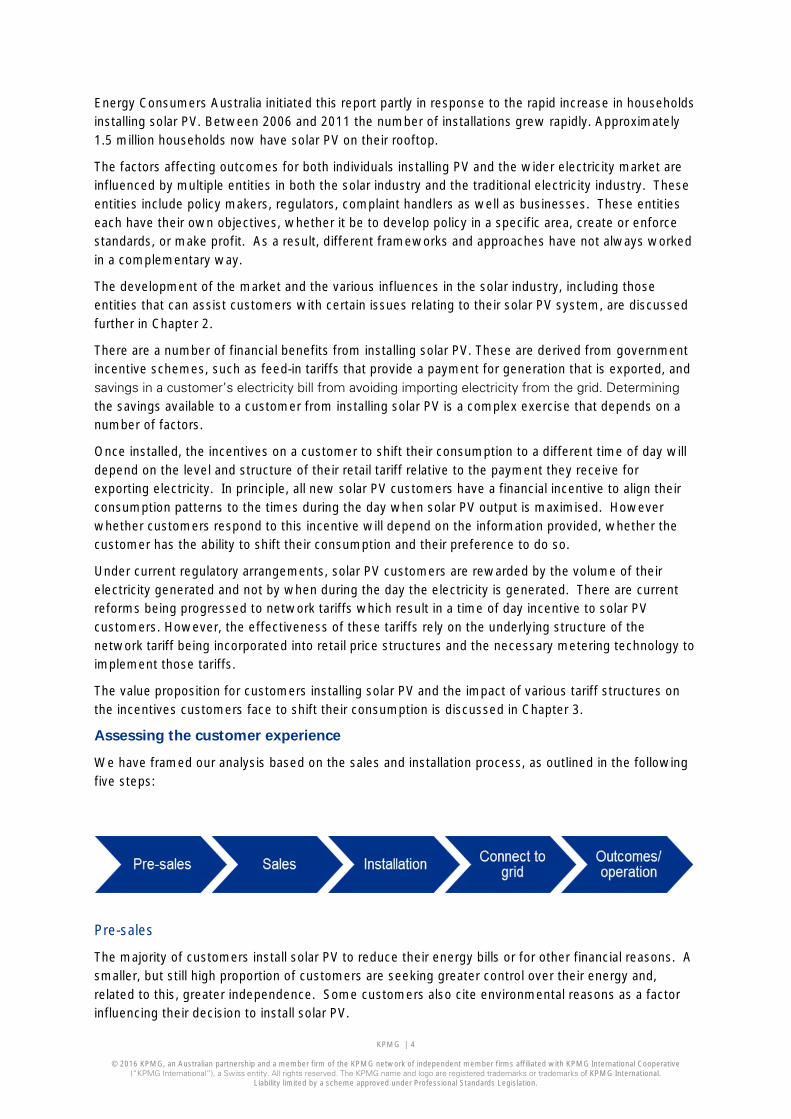
We have framed our analysis based on the sales and installation process, as outlined in the following five steps:
Pre-sales
The majority of customers install solar PV to reduce their energy bills or for other financial reasons. A smaller, but still high proportion of customers are seeking greater control over their energy and, related to this, greater independence. Some customers also cite environmental reasons as a factor influencing their decision to install solar PV.

KPMG | 5
© 2016 KPMG, an Australian partnership and a member firm of the KPMG network of independent member firms affiliated with KPMG International Cooperative (“KPMG International”), a Swiss entity. All rights reserved. The KPMG name and logo are registered trademarks or trademarks of KPMG International.
Liability limited by a scheme approved under Professional Standards Legislation.
However, many customers that have not yet installed solar PV face a number of barriers to doing so. The greatest barriers are faced by people who cannot afford the capital and installation costs, renters who must negotiate with their landlord to install solar PV, and apartment dwellers, who face issues around joint ownership of property.
Future uptake of solar PV is likely to be linked to the attractiveness of battery storage and changes to network tariffs, as well as reducing the barriers discussed above. Uptake of solar PV could be either tempered or strengthened by the introduction of battery storage. Some potential solar PV customers may choose to wait until battery storage becomes more cost effective and established to install solar PV so as to avoid risks around technology becoming obsolete. On the other hand, some customers may value the additional flexibility and independence from combining solar PV with battery storage.
The motivations for residential customers to install solar and the likely future uptake of solar PV by households are discussed further in Chapter 4.
Sales
We found that customers rely on their solar installer to obtain information. While most customers considered they had sufficient information to make decisions about their system, almost a third wished they had more information before installation.
Based on case studies undertaken by Moreland Energy Foundation, systems generally appear to have been sized and installed appropriately for individual customers. However, Moreland Energy Foundation found instances where customers have had systems installed that are larger than they need, and where the panels suffer from shading.
There is also anecdotal evidence that some customers are being sold systems that are not sized appropriately for them. First, some customers appear to not have a full understanding of how different factors influence the payback period for a system, and simply assume that larger systems will provide greater returns. Second, some customers are having systems installed that are too small for their needs as a result of the capacity threshold under which a Distribution Network Service Provider (DNSP) will automatically pre-approve a system to connect to their network. This threshold could be acting as an artificial constraint on the sizing of residential PV, creating a market distortion.
Chapter 5 sets out our more detailed findings on residential solar customers’ experience of the sales process, such as the information that they use to inform their decision and whether systems have been designed appropriately for customers, including system size and panel orientation.
Installation
Most customers appear to be satisfied with the installation process. There do not appear to be any systemic issues associated with sub-standard or unsafe installations and, based on a number of case studies, solar installers for the most part are installing the systems so as to maximise value to the customer, for example by avoiding panel shading. Our findings relating to customers’ experiences of the installation process are set out in Chapter 6.
Connect and Commission
Individual DNSP policies appear to be driving a number of outcomes for individual customers wanting to connect solar PV systems to the grid. First, the ease with which customers can obtain approval to connect to the network depends on the size of the system. This is resulting in installers advising customers to install a smaller system than would best suit them to avoid the additional cost and challenges of seeking approval for a larger system.
Second, for larger systems that require network approval, the ability to connect is effectively on a “first come, first served” basis. Some networks have had to turn down applications due to system

KPMG | 6
© 2016 KPMG, an Australian partnership and a member firm of the KPMG network of independent member firms affiliated with KPMG International Cooperative (“KPMG International”), a Swiss entity. All rights reserved. The KPMG name and logo are registered trademarks or trademarks of KPMG International.
Liability limited by a scheme approved under Professional Standards Legislation.
constraints. In some circumstances, customers that want to connect a larger system must wait until the network is augmented to install their system or pay for the network to be upgraded.
Network capacity could create an additional barrier to new solar customers. This may raise equity concerns, particularly where customers that have not yet installed solar PV have not done so because of financial barriers, or barriers due to renting or living in an apartment.
These issues are discussed further in Chapter 7.
Customer outcomes
We found that residential customers are generally satisfied with the performance of their solar PV system. The majority of customers consider their system is performing about as well as expected or better. Similarly, most customers are satisfied with the impact that their system has had on their retail electricity bills.
However, evidence suggests that many customers do not understand the detail of how their system works or how they can maximise value from their system. Knowledge of warranties is low, and some customers incur unnecessary costs to clean and maintain their systems. Instances have been identified where customers were satisfied with the performance of their system, yet inspection and testing revealed the design, and therefore system output, was sub-standard.
Close to half of customers surveyed indicated that they had taken steps to use more energy when the sun is shining and/or less when it is not. This indicates that many customers are willing to modify their behaviour to maximise the value of their system. However, it is not clear that all customers have sufficient knowledge or understanding of how to do so. This is evidenced by the survey results which suggest that more than one in five customers did not know if the tariff they paid for mains electricity changed after they installed solar and were also not sure what feed-in tariff they were being paid. Without knowing these tariffs, they would not have the information to determine how to change their consumption in order to minimise the payback period for their system.
Chapter 8 explains in more detail our findings in relation to overall customer outcomes and the extent to which their expectations about their solar PV systems are being met, as well as the impact that having a solar PV system has had on customers’ behaviour.
Market outcomes
Historically, potential network benefits have not been signalled to solar PV customers when they make decisions that influence network costs, such as the orientation of the panels and the time at which a customer is incentivised to export versus consume electricity. Rather, investment in solar PV and incentives on customers to shift their consumption to different times of day has been driven by factors other than alleviating network congestion, including the level and structure of feed-in tariffs relative to retail tariffs. Specifically, under premium net feed-in tariffs, customers have had an incentive to maximise their export throughout the day, rather than in the evening when the distribution network is most under stress.
This disconnect between the solar PV market and the electricity market means that the wider benefits of solar PV have only partially been captured. To date, on the whole, there has not been a material reduction in peak demand across distribution networks. While solar PV has resulted in a lower level of demand on some parts of some networks, this has not always resulted in lower infrastructure costs. In addition, there are costs associated with managing the network impacts of high penetration of solar PV and the level of energy being exported.
Going forward, we expect incentives are will become better aligned. Changes to feed-in tariffs through the cessation of the premium schemes are providing customers with incentives to consume, rather than export, their generation. Complementing this, DNSPs are required to better signal the

KPMG | 7
© 2016 KPMG, an Australian partnership and a member firm of the KPMG network of independent member firms affiliated with KPMG International Cooperative (“KPMG International”), a Swiss entity. All rights reserved. The KPMG name and logo are registered trademarks or trademarks of KPMG International.
Liability limited by a scheme approved under Professional Standards Legislation.
costs of using their networks, including at different times of day. The impact of these changes to network tariffs will depend on the extent to which network tariff structures are incorporated into retail price structures, the individual customer’s consumption profile relative to network usage, and the nature of the tariff structure.
Together, these signals could provide solar PV customers with a more consistent set of incentives to shift their grid consumption away from times when there is the most stress on the distribution network. This may allow DNSPs to defer expenditure that would otherwise need to occur, reducing costs to all electricity customers.
Further discussion of our findings relating to overall outcomes for the wider energy market is provided in Chapter 9.
Future developments
The combination of battery storage and solar installation at the residential level will lead to greater flexibility for customers and also increased complexity in the decisions that they face. Energy storage systems are both more technically and economically complex than solar PV systems, and customers face more decisions on how to operate battery storage.
Providing reliable and accurate information that is easy to access and understand will be important to help solar customers consider their options with respect to battery storage. This includes whether to purchase batteries, and also to help them evaluate how best to use and integrate battery storage into their decisions relating to energy. This will need to be coupled with appropriate consumer protections.
Modelling conducted by the Alternative Technology Association (ATA) found that for many solar PV customers, investing in batteries will not become cost effective until after 2020 when payback periods will be less than the assumed 10 years asset life for the battery and inverter. This applies for customers either retro-fitting battery systems or investing in new solar-battery combination systems. ATA also found that the financial viability of solar-battery combinations varies greatly across different jurisdictions and customer consumption profiles and is sensitive to how the customer intends to charge and discharge the battery.
The value proposition of installing batteries will be unique to each customer as it will depend greatly on a customer’s total consumption, the battery capability and the way the customer uses electricity over a day. Even if the price of batteries falls as anticipated over the next decade, the additional investment in batteries may never make financial sense for some consumers.
Battery storage has the potential to contribute to market efficiency. The value of solar PV installations with battery storage as a measure to reduce system peak is less reliant on individual consumers’ abilities and preferences to actively shift consumption to align with solar PV output. An integrated solar PV and battery system will automatically help to dampen the contribution of residential consumption towards system peaks.
Battery integration therefore has the potential to improve the market efficiency impacts of existing residential solar PV. To achieve this, better alignment of individual decisions with market efficiency is essential. As the network tariff structure will influence the financial value of combining batteries with solar PV current reforms to network tariffs may go some way to assisting with the efficient integration of battery storage, The effectiveness of these reforms at promoting the efficient integration of batteries will depend on a range of different factors, including the design of the network tariff structures, how well those tariff structures align with the battery management technology and preferences of customers, how retailers pass through the network tariff signal into the retail offer, and government policy.

KPMG | 8
© 2016 KPMG, an Australian partnership and a member firm of the KPMG network of independent member firms affiliated with KPMG International Cooperative (“KPMG International”), a Swiss entity. All rights reserved. The KPMG name and logo are registered trademarks or trademarks of KPMG International.
Liability limited by a scheme approved under Professional Standards Legislation.
A solar customer with a battery will have the incentive to opt for tariff structures where they can avoid the most charges that relate to the energy they use. The relative proportion of tariffs recovered through the fixed component is key as this component cannot be influenced by the operation of the solar-battery installation.
The current trends toward increasing fixed component to retail prices and having a higher fixed component to time of use/demand tariffs compared to flat consumption tariffs may impact on the viability of investing in batteries. In addition, existing customers on premium feed in tariffs will lose payments if they combine batteries with their existing solar PV installation.
Current reforms to network tariffs may not necessarily promote increased uptake of battery storage. Network businesses, retailers and policy makers may need to consider whether additional incentives are required to promote efficient uptake of battery from the market perspective.
The battery storage market is in its infancy and further policy work is needed on a range of matters including regulation, standards and safety matters. It is important that this policy work draws on the lessons learned from addressing similar issues during the emergence and development of the solar PV market. For example, difficulties that have arisen at the interface between individual customers and the grid, as observed in the solar industry, are also likely to occur in the battery storage market. There does not appear, at this stage, to be a consistent framework to guide DNSPs in developing policies for grid-connected residential battery storage nor an accreditation framework for businesses installing batteries.
Providing customers with the tools and protections they need, as well as ensuring individual decision making is aligned efficient market outcomes, relies on multiple entities working together. Policy makers and industry should draw on the experience of, and lessons learned in, the solar PV industry to ensure that benefits from battery storage are realised by both customers and the broader market.

KPMG | 9
© 2016 KPMG, an Australian partnership and a member firm of the KPMG network of independent member firms affiliated with KPMG International Cooperative (“KPMG International”), a Swiss entity. All rights reserved. The KPMG name and logo are registered trademarks or trademarks of KPMG International.
Liability limited by a scheme approved under Professional Standards Legislation.
Contents Executive summary 3
Contents 9
1 Purpose and approach 10
2 Background 15
3 Value proposition of PV 21
4 Pre-sales 36
5 Sales 46
6 Installation 53
7 Connect and commission 56
8 Customer outcomes 60
9 Market outcomes 68
10 Future developments 78
Appendix A: Glossary of terms 94
Appendix B: Code of Conduct 95
Appendix C: Feed-in Tariffs 97

KPMG | 10
© 2016 KPMG, an Australian partnership and a member firm of the KPMG network of independent member firms affiliated with KPMG International Cooperative (“KPMG International”), a Swiss entity. All rights reserved. The KPMG name and logo are registered trademarks or trademarks of KPMG International.
Liability limited by a scheme approved under Professional Standards Legislation.
1 Purpose and approach The chapter sets out the reasons why this project was initiated, and provides details on the scope and methodology for this project.
1.1 Energy Consumers Australia Energy Consumers Australia (ECA) was established on 30 January 2015 as an initiative of the Council of Australian Governments (COAG) Energy Council, in order to advocate on national energy market matters of strategic importance and material consequence for energy consumers, in particular household and small business consumers.
The objective of the ECA reflects the National Electricity Objective (NEO), the National Gas Objective (NGO) and the National Energy Retail Objective (NERO):
To promote the long term interests of consumers of energy with respect to the price, quality, safety, reliability and security of supply of energy services by providing and enabling strong, coordinated, collegiate evidence based consumer advocacy on national energy market matters of strategic importance or material consequence for energy consumers, in particular for residential and small business customers.
ECA’s objective aims to foster a greater appreciation of the issues faced by consumers amongst energy market participants and policy makers.
One of four strategic priorities identified by ECA’s Board is the area of new technologies and their disruptive effect on traditional business and impact on consumers. To this end, ECA has initiated a research project to better understand issues relating to customer and market impacts associated with the proliferation of rooftop solar PV and batteries for households.
1.2 Purpose and objective of this project ECA initiated a project to understand residential customers’ experiences when they install solar PV and assess whether customers’ expectations about their solar PV system are being met. Specifically, the project considered whether:
· residential customers are getting the outcomes they expected from their investment in solar PV, including value for money, quality and performance of the installations and an understanding of how they use their solar panels;
· existing installations are capable of integrating battery storage;
· the wider benefits to the electricity market of residential solar PV installations are being captured; and
· there are any emerging issues that might impact future solar or battery storage options for households.

KPMG | 11
© 2016 KPMG, an Australian partnership and a member firm of the KPMG network of independent member firms affiliated with KPMG International Cooperative (“KPMG International”), a Swiss entity. All rights reserved. The KPMG name and logo are registered trademarks or trademarks of KPMG International.
Liability limited by a scheme approved under Professional Standards Legislation.
The objective of this project is to gather evidence and identify learnings on a range of matters relating to residential solar PV installations. This includes:
· the process employed for installations and connections;
· the technical capability of existing installations, including quality and performance;
· how customers use their solar PV and their understanding of its capabilities; and
· expectations held by customers with solar PV and whether those expectations have been met.
ECA’s objective for this project is to improve understanding on the current operation of the various frameworks that influence solar PV installations and provide a preliminary assessment of how effective such frameworks – in terms of both provide customer outcomes and market efficiency - will be going forward with the advent of residential battery storage.
1.3 Scope of this report This project has a number of distinct technical and research components. As such, the ECA engaged several consultancies to obtain the necessary breadth of skills, including:
· UMR Research (UMR), to conduct a survey of 1,821 households with solar PV, and 630 without, to understand their experience, preferences, knowledge and intentions of these consumers with respect to solar PV and battery storage;
· Moreland Energy Foundation (MEFL), to conduct a number of desktop and/or on-site assessments of solar households (from UMR’s sample), for in-depth understanding of emerging issues by gathering stories of consumers’ experience, and independently assessing the design and performance of existing solar systems; and
· Alternative Technology Association (ATA), to conduct a detailed review and assessment of existing and emerging battery options for households in Australia, undertake technical analysis of readiness of solar PV systems (existing and future) for energy storage and model the cost effectiveness of energy storage for households in 2016, 2020, 2025 in each NEM.
The ECA engaged KPMG to synthesise these various work streams and provide this overview report, which has also incorporated additional research and analysis conducted by KPMG. Our role was to:
· research and analyse policies and processes that effect consumers’ experience with solar now and into the future.
· understand whether current energy market arrangements support households to access technology choices; and
· consider whether the sale and installation process likely to be fit for purpose in the future given market developments such as battery storage, tariff reform and more renewable generation.
KPMG also assisted the ECA with project management, including a non-technical review of outputs by the other consultancies.
This report provides an overview of the research undertaken and findings identified for this project. As such, this report incorporates aspects of the analysis and findings of each consultancy, which are set out in full in separate reports provided to the ECA. KPMG has not undertaken a technical review of these reports and is not responsible for the quality or accuracy of the final reports delivered by the above consultants, nor of the findings from their reports that are incorporated in this report. The views of UMR, MEFL and ATA stated in this report do not necessarily reflect the views of KPMG.

KPMG | 12
© 2016 KPMG, an Australian partnership and a member firm of the KPMG network of independent member firms affiliated with KPMG International Cooperative (“KPMG International”), a Swiss entity. All rights reserved. The KPMG name and logo are registered trademarks or trademarks of KPMG International.
Liability limited by a scheme approved under Professional Standards Legislation.
The scope of this report is to:
· provide an overview of the key analysis and findings from research conducted by UMR, MEFL and ATA;
· identify any market failures;
· identify customer outcomes relative to what those customers expected from their solar PV investment and the perceived satisfaction to them of that investment;
· consider whether the wider market benefits from household solar PV are likely to be able to be captured and utilised for the benefit of all electricity customers;
· identify potential implications of this research; and
· identify possible future work to extend this research.
This report does not:
· discuss experiences of solar PV customers other than residential customers;
· assess the supporting reports provided by ATA, MEFL and UMR
· provide suggestions for technical developments other than those identified by other consultants and incorporated into this report;
· consider solar hot water, electric vehicles or other technologies; or
· provide policy recommendations.
1.4 Methodology 1.4.1 Overview This project comprises a number of individual research components, summarised in Figure 1 and described in more detail below.
Figure 1: Overview of our methodology

KPMG | 13
© 2016 KPMG, an Australian partnership and a member firm of the KPMG network of independent member firms affiliated with KPMG International Cooperative (“KPMG International”), a Swiss entity. All rights reserved. The KPMG name and logo are registered trademarks or trademarks of KPMG International.
Liability limited by a scheme approved under Professional Standards Legislation.
1.4.2 Market research UMR was engaged by ECA to conduct a customer survey to understand a range of customer experiences in the solar PV market. The survey was web-based and had 2,442 respondents.1 Of these, 1,812 had solar PV on their rooftop and 630 did not have solar PV installed.2 Respondents were distributed across NSW, Victoria, Queensland, South Australia, Tasmania and the ACT.3
For further information on the methodology used by UMR, please refer to its report Usage of solar electricity in the national energy market: A quantitative study, available on the ECA’s website.
1.4.3 Case studies MEFL was engaged by ECA to conduct a number of in-depth case studies with customers that have solar PV installed. MEFL conducted telephone interviews with 74 participants and visited 29 customer premises to obtain more in-depth insights into customer experiences than could be provided via a customer survey. The site visits, conducted in NSW and Victoria, permitted greater understanding of aspects of the installation and operation of systems. The site visits also investigated the potential for batteries to be installed at the property.
1.4.4 Modelling and desktop research ATA was engaged by ECA to provide analysis and advice regarding the current and future economics and technical aspects of solar plus energy storage for residential customers in the National Electricity Market (NEM).
In particular, ATA was tasked with advising on:
· the economics of grid connected solar PV plus energy storage in the NEM, both now and into the future for residential consumers; and
· the battery ‘readiness’ of both existing and new solar homes with regards to technical aspects including system configuration, metering and grid connection.
1.4.5 KPMG analysis KPMG was engaged by ECA to analyse the impact of the proliferation of roof-top solar PV on the broader market, as well as better understand aspects of the customer experience. KPMG conducted qualitative analysis on a range of issues relating to the interface between energy market policies and residential solar PV policies and behaviour. To inform this analysis, KPMG interviewed a number of industry participants to obtain their views on issues such as the impact of solar PV on networks, the role of solar providers and the effectiveness of the Clean Energy Council (CEC) accreditation and code of conduct.
1 The margin of error for a 50% figure at the 95% confidence level for a sample of n=1,821 is ±2.3%. 2 The margin of error for a 50% figure at the 95% confidence level for a sample of n=630 is ±4.0%. 3 Note that while the survey reflects the known number of households with solar in the relevant states and territories, it may not accurately reflect the yearly profile of installations. Specifically, respondents in the survey were more likely to report a higher level of installations prior to 2011 and a lower level of installations from 2011 onwards compared to actual installations. This could either reflect either a bias in the survey towards customers who installed their systems early, or an error in reporting by respondents. It could in part reflect a the delay in updating DNSP or ORER/CER databases

KPMG | 14
© 2016 KPMG, an Australian partnership and a member firm of the KPMG network of independent member firms affiliated with KPMG International Cooperative (“KPMG International”), a Swiss entity. All rights reserved. The KPMG name and logo are registered trademarks or trademarks of KPMG International.
Liability limited by a scheme approved under Professional Standards Legislation.
1.5 Analytical framework We have framed our analysis based on the sales and installation process, as outlined in the following five steps:
Pre-sales considers issues that a customer will take into account when considering whether to install a solar PV system. This primarily relates to their motivation for installing solar PV. For customers that have not installed solar PV, it considers what barriers or reasons may prevent them from doing so.
Sales relates to the sources of information used by customers to inform their decisions on installing solar PV and design features, including the size of the system and panel orientation.
Installation primarily assesses whether customers face difficulties associated with the installation of their solar PV system. This includes, for example, delays in installation or poor installation practices.
Grid connection considers the interface between the distribution network and a customer wishing to connect their system to that network. This includes any policies that distribution network service providers may have that influence connection, and the implications for future solar PV customers.
Finally, in relation to solar PV, we consider outcomes for customers and the actual operation of their solar PV system, as well as broader market outcomes in chapters 8 and 9. For individual customers this includes discussion on issues relating to system performance and perceived impact on retail energy bills. For the broader market, it considers issues such as the impact of increased solar PV penetration on network costs.
In addition, we consider whether there are any lessons to be learned from the solar PV experience that should inform solar PV policies regarding battery storage. This includes the likely uptake of battery storage and issues that customers may face in considering their options, as well as the possible impacts on the broader market from the potential proliferation of residential battery storage.
1.6 Structure of this report The remainder of this report is structured according to the above analytical framework:
· chapter 2 sets out background information relevant to this project;
· chapter 3 explains the solar PV value proposition for residential customers;
· chapter 4 sets out our findings related to pre-sales;
· chapter 5 sets out our findings related to sales;
· chapter 6 sets out our findings related to installation;
· chapter 7 sets out our findings related to grid connection;
· chapter 8 sets out our findings related to customer outcomes;
· chapter 9 sets out our findings related to market outcomes; and
· chapter 10 discusses issues relating to battery storage.

KPMG | 15
© 2016 KPMG, an Australian partnership and a member firm of the KPMG network of independent member firms affiliated with KPMG International Cooperative (“KPMG International”), a Swiss entity. All rights reserved. The KPMG name and logo are registered trademarks or trademarks of KPMG International.
Liability limited by a scheme approved under Professional Standards Legislation.
2 Background The ECA initiated this report partly in response to the rapid increase in households installing solar PV. Between 2006 and 2011 the number of installations grew rapidly. Approximately 1.5 million households now have solar PV on their rooftop.
The factors affecting outcomes for both individuals installing PV and the wider electricity market are influenced by multiple entities in both the solar industry and the traditional electricity industry. These entities include policy makers, regulators, complaint handlers as well as businesses. These entities each have their own objectives, whether it be to develop policy in a specific area, create or enforce standards, or make profit. As a result, different frameworks and approaches have not always worked in a complementary way.
There are a number of different entities that a customer can turn to if they have an issue relating to their solar PV system. However, it may not always be clear to the customer which entity has the authority to resolve, or help resolve, their particular issue. These customer protections are governed via a number of mandatory and voluntary frameworks.
This chapter provides relevant context and background information for this report. It sets out:
· an overview how the solar PV industry has grown and where it is at today;
· a discussion of the various players in the solar PV industry and other frameworks and parties that have influenced the development of the solar PV market; and
· a summary of the customer protections that are available to solar PV customers.
2.1 Facts and figures Over the last few years there has been a rapid increase in households installing solar PV. Between 2006 and 2011, the number of installations per year grew rapidly, reaching a peak of approximately 360,000 in 2011.4 This is shown in Figure 2. Now approximately 1.5 million households have solar PV on their rooftop.
4 Australian Photovoltaic Institute, www.pv-map.apvi.org.au

KPMG | 16
© 2016 KPMG, an Australian partnership and a member firm of the KPMG network of independent member firms affiliated with KPMG International Cooperative (“KPMG International”), a Swiss entity. All rights reserved. The KPMG name and logo are registered trademarks or trademarks of KPMG International.
Liability limited by a scheme approved under Professional Standards Legislation.
Figure 2: Cumulative rooftop solar PV installations
Source: Australian Photovoltaic Institute
This rapid growth has been driven in part by generous feed-in tariffs (FiTs) offered by jurisdictional governments to encourage the adoption of solar PV, combined with the Small Renewable Energy Scheme (SRES). These schemes are discussed in the next chapter.
Uptake of solar PV has differed across jurisdictions. This is in part because of differences in solar FiTs, charges for energy consumed, and the number of sunshine hours in different locations. For example, conditions in Queensland and South Australia are more favourable for solar PV, reducing the payback period of a system compared to Victoria and Tasmania. Of the 14 suburbs across Australia than now have over 50% of households with installed solar PV, the majority are in Queensland and South Australia.
Since 2011 the rate of installations has lessened, however the average size of installations has grown over time as the cost of solar panels has decreased. In 2010, the average system size for new installations was 1.5 kW. By the end of 2015 the average system size for new residential installations (using systems under 10kW as a proxy for residential customers) had reached approximately 5.5 kW.5
The increase in the number of installations combined with the increase in the average system size installed means that overall household solar PV capacity has increased significantly. Across Australia, over 5,000 MW of rooftop solar PV generation capacity has been installed. This represents approximately 12% of total generation capacity in the NEM.6
2.2 Influences in the solar industry Figure 3 provides a snapshot of the various entities that influence the solar market.
As can be seen in the diagram, there are many different entities that have, and will continue to, influence the solar PV market.
5 APVI website data 6 https://www.aer.gov.au/wholesale-markets/wholesale-statistics/generation-capacity-and-peak-demand
-
200,000
400,000
600,000
800,000
1,000,000
1,200,000
1,400,000
1,600,000
1,800,000
Num
ber

KPMG | 17
© 2016 KPMG, an Australian partnership and a member firm of the KPMG network of independent member firms affiliated with KPMG International Cooperative (“KPMG International”), a Swiss entity. All rights reserved. The KPMG name and logo are registered trademarks or trademarks of KPMG International.
Liability limited by a scheme approved under Professional Standards Legislation.
Figure 3: Influences on solar market outcomes
First, there are the entities that have shaped renewable energy policies, including governments and jurisdictional regulators. These entities have been instrumental in driving the uptake of residential solar PV through various policies and schemes that provide solar PV customers with subsidies and other forms of incentives. The Clean Energy Regulator (CER) is responsible for administering schemes legislated by the Australian Government for measuring, managing, reducing or offsetting carbon emissions.
Customers interact directly with solar retailers, designers and installers. This market is fairly fragmented, with even the largest players only commanding a relatively small market share. The large number of businesses offering solar PV services means that there is strong competition. However, it can also make it more difficult to regulate and make sure that customers are getting a safe product that is delivering what they paid for.
A number of entities help regulate the market in this regard. First, jurisdictional safety regulators enforce safety standards and making sure electrical work is completed safely. Standards Australia specifies requirements for safety, performance, installation, maintenance and fitness for purpose, and covers solar PV and inverter installations. It has no role in enforcing those standards or certifying compliance. The CEC, as discussed in more detail below, has a role in managing and enforcing industry-based schemes.
Multiple organisations are involved in developing the required training packages, conducting the training and accrediting solar service providers. Australian Industry Standards is responsible for managing the Electrotechnology Training Package, which all solar installers must complete. Training is

KPMG | 18
© 2016 KPMG, an Australian partnership and a member firm of the KPMG network of independent member firms affiliated with KPMG International Cooperative (“KPMG International”), a Swiss entity. All rights reserved. The KPMG name and logo are registered trademarks or trademarks of KPMG International.
Liability limited by a scheme approved under Professional Standards Legislation.
conducted by Registered Training Organisations, such as TAFEs. Subject to completing the relevant training units, a solar service provider may apply to the CEC to become an accredited solar installer.
There are also multiple organisations that can help a customer resolve a dispute regarding solar PV. The nature of the dispute will determine which entity has scope to assist. This is discussed in more detail in the next section.
Solar PV has a number of important cross-overs into the traditional electricity industry. These include involvement by retailers in passing on, and in some cases determining, the value of feed-in tariffs. Further, the majority of PV systems are connected to the distribution network. Consequently, DNSPs also have an interest in the rooftop solar PV market to the extent that its network is affected, and their own policies will, in turn, influence the solar PV market.
Finally, the behaviour of electricity retailers and DNSPs is shaped to some extent by electricity market policies, rules and procedures. The Commonwealth Government, Australian Energy Market Commission (AEMC), Australian Energy Regulator (AER) and Australian Energy Market Operator (AEMO) all have a hand in shaping the policies and every day procedures that govern how retailers and DNSPs operate.
While each of these entities has an influence on the outcome and experience of solar PV customers, they have their own objectives, whether it be to make profit, create or enforce standards, or develop policy in a specific area. Consequently, different frameworks and approaches have not always worked in a complementary way. This can cause confusion for customers, particularly if they face unexpected difficulties when installing their system or they do not know who they can turn to help resolve disputes when things go wrong. It can also cause a disconnect between the solar PV market and the electricity market, meaning that the wider benefits of solar PV are only partially captured.
2.3 Customer protections As discussed above, there are a number of different entities that a customer can turn to if they have an issue relating to their solar PV system. However, it may not always be clear to the customer which entity has the authority to resolve, or help resolve, their particular issue.
In all jurisdictions except Victoria, Western Australia and the Northern Territory, the electricity industry has its own specific customer protections known as the National Energy Customer Framework (NECF) given effect through the National Energy Retail Law (NERL) and National Energy Retail Rules (NERR). The NERL requires that anyone selling energy to customers must either hold a retailer authorisation or a valid exemption, which the AER may grant. Where a valid exemption is obtained, the retailer is not subject to the full requirements of the NECF. Similar protections are provided via jurisdictional legislations where the NECF does not apply, such as the Retail Code in Victoria.
The AER has decided that a person that sells energy to customers to supplement the energy that the customer buys from a retailer, such as energy generated by rooftop solar panels under a power purchase arrangement (PPA)7, may be eligible for a retail exemption.8 As a consequence, many of the energy-specific customer protections under the NECF generally do not apply to solar customers.9 Rather, voluntary industry-based schemes overseen by the CEC, combined with general consumer
7 A power purchase arrangement is h is a financial arrangement in which a business provides, installs and maintains, at no initial cost, an electricity generation system at a customer’s premises and in exchange, the customer buys the energy generated for an agreed period. 8 AER, (Retail) Exempt Selling Guideline – version 4 – March 2016, p6. 9 Other than in their capacity as a grid-connected electricity customers that purchases electricity from the grid through an authorised retailer.

KPMG | 19
© 2016 KPMG, an Australian partnership and a member firm of the KPMG network of independent member firms affiliated with KPMG International Cooperative (“KPMG International”), a Swiss entity. All rights reserved. The KPMG name and logo are registered trademarks or trademarks of KPMG International.
Liability limited by a scheme approved under Professional Standards Legislation.
law, generally govern the protections available to customers. There are a number of exceptions, where the issue relates to an authorised energy retailer or a DNSP and is therefore governed by the NECF.
Figure 4: Customer protections for solar PV customers
2.3.1 Role of the CEC The CEC manages the industry-based schemes. It has a role to:
· approve accreditation for individual solar designers;
· approve accreditation for individual solar installers; and
· manage the Solar Retailer Code of Conduct.
All installers must be accredited by the CEC for their customers to be able to take advantage of government subsidies and schemes. Accredited installers must abide by the Accreditation Code of Conduct and, through this Code, the CEC’s System Design Guidelines. These are described in more detail in Appendix A. The intention of the Code and Guidelines is to guide the behaviour of accredited installers and designers, as well as the standards to which they design and install solar PV systems.
The CEC deals with complaints involving a breach of the Accreditation Code of Conduct as well as Australian Standards relating to solar PV system installation. Issues generally cover faulty or poor workmanship such as faulty wiring and labelling, and the use of modules and inverters that do not meet the Australian Standards. The CEC will only investigate complaints where the system has been installed within the past two years.
The Solar Retailer Code of Conduct is voluntary, and only approximately 5 per cent of solar retailers have signed up.10 The CEC will consider complaints where an Approved Solar Retailer has breached the Solar Retailer Code of Conduct. It has no jurisdiction over solar retailers that have not joined this scheme.
10 MEFL, Energy Consumers Australia – Experience of Solar Consumers, 10 October 2016, p12.
General Consumer
Law
National Electricity Customer
Framework
CEC solar accreditation
scheme
CEC Solar Retailer Code
of Conduct
Managed by jurisdictional Fair Trading Office or equivalent and Australian Competition and Consumer Commission. Applies to all companies.
Voluntary scheme
Voluntary, but required to obtain government incentives
Complaints overseen by jurisdictional Ombudsmen. Applies to all DNSPs and authorised retailers.

KPMG | 20
© 2016 KPMG, an Australian partnership and a member firm of the KPMG network of independent member firms affiliated with KPMG International Cooperative (“KPMG International”), a Swiss entity. All rights reserved. The KPMG name and logo are registered trademarks or trademarks of KPMG International.
Liability limited by a scheme approved under Professional Standards Legislation.
2.3.2 Role of jurisdictional Fair Trading Offices The jurisdictional Fair Trading Offices (or equivalent Government entity) enforce safety standards and can assist with the resolution of installation issues that are covered by warranties and guarantees. These Offices provide advice when a customer has a complaint regarding a solar product or installation of a solar product. Typically, they recommend the customer attempt to resolve the dispute with the retailer or installer first. However if no resolution is able to be reached, the Government provides an informal mediation process followed by a formal, court orientated resolution. The Office of Fair Trading (or state’s equivalent) can negotiate on a customer’s behalf and arrange mediation if required.
As an example, the Fair Trading Office of NSW provides a proactive consumer checklist to help customers avoid solar PV disputes.11
If the checklist has been followed and a dispute arises or cannot be resolved with the installation electrician or building, the customer has several options:
· First, a customer is afforded statutory protection by way of warranties and consumer guarantees. Installations are covered by statutory warranty for a period of 2 years and Consumer Law provides guarantees.
· Second, if a dispute cannot be resolved between a customer and a builder / electrician or they refuse to provide relevant certification for their work, the customer may lodge a formal complaint with the Office of Fair Trading.
· Finally, if the dispute cannot be resolved with the assistance of the Fair Trading’s dispute resolution team, then either party may lodge an application with the NSW Civil and Administrative Tribunal.
2.3.3 Role of the Ombudsman Jurisdictional Energy Ombudsmen can assist in resolving complaints that relate to an authorised electricity retailer or a DNSP. This includes issues such as connection and metering problems or the application of the feed-in tariff.
The capacity of the Ombudsman to assist is similar across all NEM jurisdictions. The Ombudsman can assist by facilitating contact between a customer and their supplier, investigating the circumstances that led to the complaint or trying to negotiate a settlement or resolution between the customer and supplier. The Ombudsman has the power to make an independent binding decision without interference to resolve matters where applicable.
Solar retailers are not captured by this scheme unless they are also an authorised retailer operating under a single entity. This has led to a number of existing authorised retailers, such as Origin Energy and AGL, setting up separate entities from which they provide solar and other energy services so they are subject to the same requirements as exempt solar retailers.
11 This includes: ensure the contractor was properly licensed to undertake the work. Details should be provided on the contract and Certificate of Compliance for the solar work completed by a builder or electrician; ensure that the solar panels comply with Australian wiring requirements. This is provided on the Certificate of Compliance for Electrical Work; engage expert advice from a qualified electrician accredited with solar panel installation training. The Clean Energy Council can provide an independent inspection by a qualified electrician; and Check whether home warranty insurance was provided. If the value of work and materials exceeds $20,000 a Home Warranty Insurance certificate should be provided.

KPMG | 21
© 2016 KPMG, an Australian partnership and a member firm of the KPMG network of independent member firms affiliated with KPMG International Cooperative (“KPMG International”), a Swiss entity. All rights reserved. The KPMG name and logo are registered trademarks or trademarks of KPMG International.
Liability limited by a scheme approved under Professional Standards Legislation.
3 Value proposition of PV There are a number of financial benefits from installing solar PV. These are derived from government incentive schemes, such as feed-in tariffs that provide a payment for generation that is exported, and savings in a customer’s electricity bill from avoiding importing electricity from the grid. Determining the savings available to a customer from installing solar PV is a complex exercise that depends on a number of factors.
Once installed, the incentives on a customer to shift their consumption to a different time of day will depend on the level and structure of their retail tariff relative to the payment they receive for exporting electricity. In principle, all new solar PV customers have a financial incentive to align their consumption patterns to the times during the day when solar PV output is maximised. However whether customers respond to this incentive will depend on the information provided, whether the customer has the ability to shift their consumption and their preference to do so.
Under current regulatory arrangements, solar PV customers are rewarded by the volume of their electricity generated and not by when during the day the electricity is generated. There are current reforms being progressed to network tariffs which may result in a time of day incentive to solar PV customers. However, the effectiveness of these tariffs rely on the underlying structure of the network tariff being incorporated in retail price structures and the necessary metering technology to implement those tariffs.
This chapter explains the financial value proposition for customers to install solar PV and the incentives governing how customers can utilise and maximise the financial value of their system. As explained in chapter 4, customers will install solar PV for a wide range of reasons, including non-financial considerations. However, the impact of solar PV on market efficiency will depend on how the policy and regulatory frameworks compensate solar PV customers for the market benefits which, in turn, influences the financial value proposition for installing PV.
3.1 Financial Value for customers 3.1.1 Financial benefits from solar PV The financial returns for residential customers will depend on a combination of different factors. The value of solar PV is often marketed, and understood by consumers, in terms of the payback period, ie, how long it takes for financial returns to pay off the initial costs of installations.12 The length of the payback period will depend on the upfront installation costs of the solar PV system, including any required grid connection and metering upgrade costs, relative to:
· the Commonwealth Government’s subsidy under the SRES, which effectively provides an upfront reduction in the cost of installation;
12 There are two possible ways to calculate payback periods – a simple approach based on the absolute values in each year or a discounted approach based on a net present value calculation. While discounted approach is more accurate, it is suspected that most customers will make decisions on the simple approach to evaluating payback.
KPMG | 22
© 2016 KPMG, an Australian partnership and a member firm of the KPMG network of independent member firms affiliated with KPMG International Cooperative (“KPMG International”), a Swiss entity. All rights reserved. The KPMG name and logo are registered trademarks or trademarks of KPMG International.
Liability limited by a scheme approved under Professional Standards Legislation.
· FiT payments for solar PV generated and exported to the network (either through a Jurisdictional Government mandated scheme or a retailer scheme); and
· savings in a customer’s electricity bill.
The first two sources of return are relatively certain and straightforward to predict for solar PV installers, who would then translate those returns into their marketing for customers. Savings in electricity bills resulting from a reduction in energy imported from the grid will likely be the biggest component to the financial value for new installations. The value of these savings is equal to the net reduction in energy consumed at the household multiplied by the applicable level of retail electricity volume based tariff.13
Energy bill savings may be difficult to accurately predict as it will depend on the following factors specific to the individual customers.
· the configuration of the solar PV installation in terms of size and location as this determines energy generated and the time of generation;
· the level and structure of retail tariffs; and
· the consumption patterns of the customer, and whether the customer changes its consumption behaviour following the installation.
Solar PV installers are likely to make simple assumptions and generalisations on these factors when converting the investment into a payback period.
The level of solar PV generated will primarily be driven by size of the installation and the geographical location (in terms of solar radiation). The specific conditions under which the installation occurs — for example, available roof space, the presence of shade, roof tilt and the direction the PV array faces – will also impact on the volume of electricity generated.
The time of day when solar is generated is important as the financial value will depend on the alignment between the timing of solar generation and consumption within the household. Savings in avoided energy imported from the grid occur when the household is consuming the electricity produced by the installation. Electricity generated that is surplus to immediate needs is exported and the customer rewarded through the feed in tariff. Both contribute to reducing the energy bills.
For this reason, the difference between the variable component of the retail tariff and the feed in tariff will determine the value to the customer from consuming its solar PV output (self-consumption) and hence the incentive on the customer to shift its consumption to align with the solar PV output.
For most customers, the variable component of their retail tariff will be around 15 cents to 25 cents per kWh higher than their feed-in tariff and hence the customer has the incentive to shift its consumption to the middle of the day to better align with the solar PV maximum output period. However this is not the case for those customers on a net premium feed in tariff where the feed-in tariff is actually 20 to 30 cents per kWh higher than the variable component of the retail tariff. In such circumstances, the customer has the financial incentive to maximise exports and therefore to shift consumption away from the middle of the day when solar PV output is greatest. This incentive is explained further in section 3.3.1 below and the implications for market efficiency discussed in chapter 9.
In summary, the capability of a consumer to maximise the financial value from the investment in solar PV will depend on the alignment of their consumption with the output of the solar PV. This will vary
13 Residential electricity tariffs are (currently) generally made up of a) a fixed price that typically applies on a daily basis and is independent of the amount of electricity consumed; and b) a variable volume tariff (also referred to a "usage" or "energy" charge) for each unit of electricity consumed.

KPMG | 23
© 2016 KPMG, an Australian partnership and a member firm of the KPMG network of independent member firms affiliated with KPMG International Cooperative (“KPMG International”), a Swiss entity. All rights reserved. The KPMG name and logo are registered trademarks or trademarks of KPMG International.
Liability limited by a scheme approved under Professional Standards Legislation.
by household characteristics and it may not be possible to shift consumption to the middle of the day. It will also depend greatly on the information provided and incentives facing customers.
For example, while the customer may have strong knowledge of the maximum output capacity of its installation, he/she may not have the skills to express solar PV output in terms of household appliance use (eg dishwashers, air-conditioners, TVs). Also there will always be a proportion of customers who will not actively engage with such decisions regarding how to maximise the value of their installations and therefore will not consider how to shift their consumption.
This incentive to align consumption with the times of maximum output may not be consistent with maximising the market efficiency benefits from solar PV installations. Market benefits depend on the ability of solar PV installations to dampen peak consumption across the market. The period when the distribution network is at greatest peak is often in the late afternoon and not in the middle of day. This misalignment between consumer incentives and market efficiency is explored in chapter 9.
3.1.2 Financial costs and payback period Costs will be mostly driven by the size of the installation and the costs of installation. The price of an installed system will depend on the installer, the design of the system, date of installation and the level of competition in the market.
There are potentially some hidden costs which the customer is not aware of or does not consider when making the purchase. These include: the costs of maintaining the installation (although these should not be high); the need to replace the inverter (usually around 10 years after installation); and the potential for the retailer to change the tariff structure when the customer installs solar PV.
Given these cost drivers, it is not straightforward to assume that amount of the financial value is directly dependent on the size of the installation. A bigger installation does not necessarily mean greater returns and a shorter payback rate.
This is supported by the analysis in Figure 5 which shows this relationship between payback period and the volume of exports for customers that are not on premium FiT rates.
Figure 5: Payback period compared to solar export
Source: Moyse, Damien, Solar Payback: Smaller is better, Business Spectator, 24 September 2013.

KPMG | 24
© 2016 KPMG, an Australian partnership and a member firm of the KPMG network of independent member firms affiliated with KPMG International Cooperative (“KPMG International”), a Swiss entity. All rights reserved. The KPMG name and logo are registered trademarks or trademarks of KPMG International.
Liability limited by a scheme approved under Professional Standards Legislation.
This chart demonstrates that the estimated payback period increases as the percentage of solar PV energy exported increases.14 Therefore where a greater share of output is exported instead of consumed, the payback period will be longer. This means that to minimise the payback period, customers should match the size of their system as closely as possible to their daytime consumption levels.
The remainder of this chapter explores two aspects of the policy and regulatory framework which impact on the financial value from solar PV installation and therefore can influence consumer behaviour. Before doing so, the next section briefly explains that there are different types of customers based on the technology that they currently have in place. These different customers will have different incentives when it comes to changing tariff types and behaviours.
3.1.3 Different customer types Before discussing the different influences on the value of solar PV for customers, it is important to note that there are broadly three customer types:
· potential solar PV customers that do not currently have solar PV;
· existing solar PV customers that do not have a smart meter and therefore cannot take advantage of certain tariff types without incurring additional costs; and
· existing solar PV customers that have a smart meter and therefore may have access to wide range of tariff types.
The value of solar PV to each of these customers, and the potential change in value associated with a change in tariff, may differ.
For example, potential solar PV customers will likely need to upgrade their meter at the time they install solar PV. There would be a small incremental cost to installing a smart meter rather than the required bi-directional meter with less functionality, which would enable them to access a wider range of tariffs that may increase the value of their solar PV. On the other hand, existing solar PV customers that do not currently have a smart meter will incur the full cost of installing a new meter in order to access different tariffs. The costs for these types of customers associated with upgrading their meter may outweigh any benefits associated with changing their tariff.
Each of these customer types should be considered when identifying the incentives on customers in relation to their consumption behaviour.
3.2 Retail Tariff level and structure Currently, residential electricity prices generally comprise of a fixed (standing) charge and a variable charge for each unit of electricity consumed. Such tariffs are referred to as two part tariffs. Some retail offers have only one price for the variable component. Others are structured such that the first block of energy is charged at a different price to subsequent blocks of consumption (i,e. inclining or declining block).
Different tariff structures are emerging at both the retail and network level. This is due not only to the recent reforms to promote more efficient network tariffs but also driven through more diversification in retail products as retailers offer new products (e.g. Powershop, Mojo Energy). Table 1 provides an overview of the different structures and general implications for solar PV customers. It is possible
14 This chart is from 2013 and therefore may no longer accurately reflect system costs and therefore payback periods

KPMG | 25
© 2016 KPMG, an Australian partnership and a member firm of the KPMG network of independent member firms affiliated with KPMG International Cooperative (“KPMG International”), a Swiss entity. All rights reserved. The KPMG name and logo are registered trademarks or trademarks of KPMG International.
Liability limited by a scheme approved under Professional Standards Legislation.
that the retail tariff could combine elements of different tariff structures, for example, a demand tariff and a variable charge.
Table 1: Tariff design structure options and implications for solar PV customer
Tariff Design Description Implication for solar PV customer Time varying tariffs
Time varying tariffs are tariffs which differ during the time of day when electricity is consumed. Their objective is to incentivise customers to shift consumption away from peaks by charging higher rates at peak time. A time varying tariff can de designed in a number of ways. The most common categories of time-varying rates are Time-of-Use (ToU), Critical Peak Pricing (CPP), Peak Time Rebates (PTR)15, and Real Time Pricing (RTP).
Such tariffs could provide greater rewards for solar PV customers depending on the alignment of the solar PV output and peak periods where rates are highest.
Capped Usage Allowance tariff
Horizon Power is piloting a new tariff whereby customers have an allocated usage allowance during the peak period and are provided with a financial incentive to use less electricity during this time.16 This can be considered to be a variation on a time varying tariff, where the rewards and penalties are made more explicit and easier to understand.
Solar PV customers will have a greater reward when they align their consumption with solar PV output and minimise their net consumption during the peak period.
Demand Tariffs A demand tariff is based on a customer’s maximum kW demand over a specified time period – for example, the monthly billing cycle. It is typically based on the customer’s maximum demand across all hours of the month or on their maximum demand during peak hours of the month, or sometimes on both. Demand tariffs for residential customers are expected to be introduced in 2017, except in NSW.
The implications for a solar PV customer will depend on how the demand tariff is calculated and the ability of the solar PV to reduce the maximum demand during the charging period. If the maximum demand occurs at night or during a day whether solar output is low (due to weather) then there is little difference for the solar PV customer compared to a non-solar PV customer under a demand tariff
Wholesale price pass through products
New retail products are emerging which provides residential customers with access to wholesale prices or more flexibility in how to purchase electricity Currently such products are being offered by Powershop and Mojo Energy and are available to solar PV customers
Such products could benefit solar PV customers through the greater flexibility and ability to structure their electricity purchases to best align with their solar PV output and consumption patterns
Any comparison between the tariff structures options presented in table 1 and current two part tariffs must also assess any difference in the fixed charge component. The fixed charge component does not vary with generation or consumption, and potential savings from charging tariff structures from volume based charges to time of use or demand tariffs could be offset if such tariffs contained a higher fixed charge. Generally any increases in the proportion of tariffs recovered through the fixed charge will diminish the value of the solar PV installation.
15 While not strictly a time varying tariff, PTRs provide an incentive for customers to reduce their demand at peak times. 16 See https://www.horizonpower.com.au/about-us/our-projects/power-ahead-research-pilot/

KPMG | 26
© 2016 KPMG, an Australian partnership and a member firm of the KPMG network of independent member firms affiliated with KPMG International Cooperative (“KPMG International”), a Swiss entity. All rights reserved. The KPMG name and logo are registered trademarks or trademarks of KPMG International.
Liability limited by a scheme approved under Professional Standards Legislation.
Some customers may also be on a time of use retail tariff structure. Time of use offers vary the variable charge by different periods of the day and provide consumers with the opportunity to save on their electricity bills by consuming electricity during cheaper ‘off-peak’ periods.17 Such pricing structures are more closely aligned to the costs of providing consumers with electricity services, thereby providing consumers with the option of reducing their peak demand to save money, or continuing to use electricity at those times when the value they place on that use outweighs the costs.
Generally solar customers stand to benefit more by shifting from a flat offer to a retail time of use offer than consumers who do not have solar, even before shifting their consumption.18 This is because solar generation offsets some of the relatively more expensive peak and shoulder consumption for time of use consumers, while allowing them to benefits from cheaper off-peak consumption.
However the extent of any additional savings from moving to a time of use tariff compared to a flat tariff (all other factors remaining the same) will depend on the structure of the time of use offer. We note that the typical structure of retail time of use offers varies between jurisdictions and network regions, with differences in the length of peak period, and the potential saving from shifting consumption from peak and off-peak. In some jurisdictions, such as South Australia, the length of the peak ranges from 42 percent to 58 percent of weekly hours while in NSW, the length of the peak period varies from 6 percent to 21 percent of total weekly hours.
In principle the ability of a solar PV customer to opt into a time of use retail tariff offer will improve the financial returns from the solar PV installations.19 There is still a financial incentive for solar customers to shift consumption to align with the solar PV generation maximum periods, which could overlap with the retail offer peak period, although the time of use structure diminishes that incentive. This incentive is different to customers without solar installations where moving to the time of use retail tariff structure provides an incentive to shift consumption to non-peak periods.
From a market efficiency perspective, there are two observations to note regarding retail tariff offers:
1. Solar PV installations are not required to have interval metering capability. Outside of Victoria,
current rules only require solar PV installations to have bi-directional metering capability. To date, this has constrained that value that solar customers can obtain from their systems. Metering issues are discussed further below.
2. The structure of retail tariff offers influences the incentive for solar PV customers to align consumption with the periods when solar PV output is highest. Therefore tariff design has a role to play in addressing alignment between consumer incentives and market efficiency. As discussed above, this matter explored further in chapter 9.
Another market observation is that some retailers do not make all of their offers available to solar households. There may be a wide range of reasons for this and this report has not explored this matter.
3.2.1 Structure of network tariffs The structure of the fixed and variable charges in a retail offer is influenced by the structure of the underlying distribution network tariff, which also includes fixed and variable charges. Distribution
17 Typically these periods are classified as 'peak', 'shoulder' and 'off-peak' periods. 18 This holds true where there are no cross-subsidies between customers on flat tariffs and those on time of use tariffs. In some network areas, customers on flat tariffs are able to access a cheap, legacy network tariff which is no longer open to new customers. There is a possibility that customers on these legacy tariffs will be better of remaining on a flat tariff. 19 This analysis assumes a flat feed in tariff structure. A time of use feed in tariff structure could change this finding.

KPMG | 27
© 2016 KPMG, an Australian partnership and a member firm of the KPMG network of independent member firms affiliated with KPMG International Cooperative (“KPMG International”), a Swiss entity. All rights reserved. The KPMG name and logo are registered trademarks or trademarks of KPMG International.
Liability limited by a scheme approved under Professional Standards Legislation.
network tariffs tend to account for between 20% and 40% of retail offers, depending on the jurisdiction.
The structure of distribution network tariffs is currently the subject of reforms, following the AEMC Rule change on distribution network tariffs. This introduced obligations on distributors to structure their tariffs to reflect better the efficient costs of network services so that customers can make more informed decisions about their electricity usage.20 New tariff structures are required to be implemented in 2017.
Expected changes to network tariffs are likely to have implications on the financial return earned by solar PV customers and the incentives driving consumption patterns. This section briefly explores a number of potential changes:
1. A shift away from volume charges to higher fixed charges: Under current tariff offers, volume based charges tend, on average, to account for around 80% of the total bill. Changes to network tariffs to recover a higher proportion of costs through fixed charges will likely be fed through to higher fixed charges in retail offers. This will decrease the financial value for solar PV installations given that the customers are required to pay the higher fixed charge irrespective of network usage levels. This will also impact on the viability of additional investment in battery storage as discussed in chapter 10.
2. Introduction of demand charges: Most of the distribution business are proposing to introduce a demand tariff in addition to the fixed and volume based charges. A demand charge is based on a customer’s maximum kW demand over a specified time period – for example, the monthly billing cycle. These charges would change customers’ incentives by encouraging them to consider reducing the maximum energy they take from the network during the peak period, as distinct from lowering their average consumption over a peak period as they would under a time of use energy charge. Even if a customer still uses the same total energy, they would benefit financially if they can reduce their maximum peak demand. For solar PV customers, demand charges make the financial return consideration more complicated. As explained above, under volume charges, the incentive to is maximise consumption at times when solar PV output is greatest in order to minimise the volume of electricity which the customer purchases from its retailer. Under demand charges, a solar PV customer’s incentive is to minimise its peak consumption during the peak charging period. There is still an incentive to shift consumption to align with solar PV output, however the customer may not receive the benefit of this if having solar does not impact on its peak consumption which could be during times when solar PV output is lowest (i.e. evening, or a cloudy day).
3. Critical peak day pricing – Under a critical peak day price, the network business is able to notify customers of a temporary large price increase which will apply on a limited number of critical days when the system demand is at its highest. Notification is usually provided 24 hours in advance of the critical day and the customer is incentivised to minimise their electricity consumption or seek alternative supply sources between the nominated peak period (eg 2pm to 6pm). Under this tariff design, the value of solar PV is through its contribution to reducing the customers’ consumption on the nominated days. Similar to demand charges, a solar customer may not benefit from this if their solar PV is not generating at the time of the nominated peak period. This option may therefore present increased risks to customers, due to the relatively high critical peak price that would be incurred if their solar PV was not generating during the critical peak period.
20 Details of the AEMC’s Rule change are available at - www.aemc.gov.au/Rule-Changes/Distribution-Network-Pricing-Arrangements

KPMG | 28
© 2016 KPMG, an Australian partnership and a member firm of the KPMG network of independent member firms affiliated with KPMG International Cooperative (“KPMG International”), a Swiss entity. All rights reserved. The KPMG name and logo are registered trademarks or trademarks of KPMG International.
Liability limited by a scheme approved under Professional Standards Legislation.
How retailers represent the changes to network tariffs in their offerings to customers could influence the impact on solar PV customers and affect the choices customers make. Retailers will have their own commercial and regulatory factors to consider in this regard.
Some network businesses are proposing the changes in tariffs to be voluntary, while other changes will be applied to all residential customers. Some changes could diminish the expected financial returns which the customer based its decision to install solar PV on and therefore extend the payback period. It will be important that there is sufficient engagement with customers to help them understand and adapt to the changes.
The changes to distribution network tariffs are currently being considered by the AER. The role of retail tariff structures in promoting the efficient combination of battery and solar PV installations is discussed in the ATA report. The ATA’s analysis is discussed in section 10.
3.3 Incentives to encourage solar uptake All jurisdictional governments and the Commonwealth Government implemented schemes to encourage the uptake of rooftop solar PV by residential customers to support renewable energy targets. There were two main mechanisms for this:
· State based Feed-in Tariffs (FiTs); and
· small-scale technology certificates (STCs) provided under the Commonwealth Government Renewable Energy Target scheme. This replaced the Commonwealth Government’s earlier Solar Homes and Communities Plan, which provided a rebate for solar installs.
3.3.1 Feed-in tariffs FiTs are a payment to a customer for generating electricity, paid per kWh. The type and level of FiT differs between jurisdictions and has reduced over time. As a consequence of these changes, different FiTs now apply to different customers, depending on when they installed solar PV.
There are effectively two different categories of feed in tariffs:
· Government Scheme Premium FiTs; and
· retailer FiTs.
To encourage the adoption of solar installations, jurisdictional governments offered premium FIT rates, which were significantly higher than the wholesale cost of electricity. These rates are subsidised through distribution network charges and recovered across all customers in the jurisdiction. While these premium FiT schemes are now closed for new entrants, existing schemes have been grandfathered and so customers will continue to receive the premium rate until the scheme terminates.
As discussed in section 2, these premium rates were highly effective in fostering uptake of solar PV installations. In response to the success of these schemes, most jurisdictional governments closed eligibility for new entrants from 2011 onwards. Since then, new installations have been able to qualify for schemes available from their retailer. Generally these schemes provide a tariff payment that is equivalent to the avoided cost of supply due to the operation of a rooftop solar generator and are significantly lower than the government schemes premium rates. These retailer schemes can either be regulated where the jurisdictional regulator sets the minimum rate that retailers must offer, or competitive, where retailers are free to offer their own rate in competition with each other.

KPMG | 29
© 2016 KPMG, an Australian partnership and a member firm of the KPMG network of independent member firms affiliated with KPMG International Cooperative (“KPMG International”), a Swiss entity. All rights reserved. The KPMG name and logo are registered trademarks or trademarks of KPMG International.
Liability limited by a scheme approved under Professional Standards Legislation.
As part of a package of energy market reforms endorsed by the Council of Australian Governments (COAG) on 7 December 2012, COAG agreed to a revised set of National Principles for Feed-in Tariff Arrangements. These arrangements were amended to provide for all forms of micro generation technologies, including household solar PV, to be offered a fair and reasonable tariff for any energy that is exported.
Figure 6 shows the current range of FiTs available in each jurisdiction and demonstrates the gap between the closed premium rates and retail rate.
Figure 6: Range of feed-in tariffs available by jurisdiction
Source: KPMG analysis of FiT levels
The level of FiTs has changed dramatically since the introduction of Government premium schemes. As a result of these changes:
· some customers now, or will, face different FiTs compared to when they installed the system;
· two customers with the same system could face very different incentives regarding how they maximise the value of their system (one on premium, one on market); and
· the rolling back of premium schemes in New South Wales, South Australia and Victoria at the end of 2016 will impact on the net electricity bills of the affected customers. It is estimated by the ATA that 275,000 customers will be affected by these changes with the largest impact in NSW, where customers’ payments for solar generation could reduce by up to $4,000.
These changes could lead to confusion for customers seeking to maximise value from their system. For example, a customer that installed its system while on a net premium FiT has an incentive to export as much of its generation as possible by shifting their consumption to the evening or overnight. Conversely, once they come off a premium FiT, their incentives switch to consuming as much of their own generation as possible, implying that they would shift their consumption to during the day. As discussed in section 8.2, evidence suggests that many customers may not fully understand these implications.

KPMG | 30
© 2016 KPMG, an Australian partnership and a member firm of the KPMG network of independent member firms affiliated with KPMG International Cooperative (“KPMG International”), a Swiss entity. All rights reserved. The KPMG name and logo are registered trademarks or trademarks of KPMG International.
Liability limited by a scheme approved under Professional Standards Legislation.
Table 2 provides a summary of the premium schemes which were introduced by the jurisdictional governments and also explains the current approach to FiTs for residential customers. Further information is provided in Appendix B.
Table 2: Summary of FiT arrangements by jurisdiction
Jurisdiction Government Premium Scheme21 Current approach to FiTs
ACT Pre July 2011 customers receive a gross rate between 30.1 and 50 cents per kWh depending on date of connection and capacity. Rates will be paid for 20 years from installation
Rates for new installations are set competitively by retailers
NSW Scheme ends on 31 December 2016. Pre April 2011 customers received either gross 60 cents or 20 cents per kWh depending on date of installation
Rates are competitively set by retailers with the regulator setting a recommended (non-binding) benchmark range.
NT No scheme has been provided Retailers operate a buyback scheme voluntarily.22
QLD Pre July 2012 customers will continue to receive a net 44 cents per kWh until 2028 subject to continuing to meet eligibility requirements
In South East Queensland, retailers offer customers with new installations competitive rates. In regional Queensland, retailer minimum rate are regulated.
SA Customers between July 2008 and Sept 2011 receive 44 cents per kWh until June 2028. Customers who installed between Oct 2011 and Sept 2013 received 16 cents per kWh until Sept 2016
For new installations, there is a minimum rate which is set by the regulator
TAS Customers in Tasmania could apply for the Transitional Legacy Tariff until August 2013. This scheme pays 28.283 cents per kWh until December 2018
For new installations, the regulator sets the regulated rate each year.
VIC 3 schemes were available depending on time of installation. The standard and transitional schemes end on 31 December 2016. The Premium schemes applied to installations between Nov 2009 and Dec 2011 and customers received 60 cents per kWh until Nov 2024.
Regulator sets minimum retailer FiT for new solar installations. This rate must be offered by retailers with more than 5000 customers.
WA Customer installations between July 2010 and August 2011 receive 40 cents per kWh while installations after August 2011 receive 20 cents per kWh up to a capacity cap. Under the scheme, eligible customers receive the payment for 10 years from installation.
Retailers must offer new installations a buyback rate. Terms and conditions of the buyback scheme are reviewed by the Government.
The remainder of this section explains:
· how FiTs influence customer behaviour; and
· the future direction of FiTs.
21 In some States, retailers offer a top-up payment in addition to the government premium rate. For example, in Victoria as of 19 February 2015, some retailers offer a ‘top-up’ of 8 to 10 cents per kWh. 22 As of January 2016, Jacana Energy offers an energy flat buy-back rate of 25.54 c/kWh for residential consumers

KPMG | 31
© 2016 KPMG, an Australian partnership and a member firm of the KPMG network of independent member firms affiliated with KPMG International Cooperative (“KPMG International”), a Swiss entity. All rights reserved. The KPMG name and logo are registered trademarks or trademarks of KPMG International.
Liability limited by a scheme approved under Professional Standards Legislation.
Interactions between feed in tariffs and consumer behaviour
The design and levels of the FiT payments will impact on customer consumption behaviour and hence the potential efficiency benefit to the market from solar PV installations. This section briefly explores how the design of the FiT will change the value proposition for solar and whether the behavioural incentives regarding consumption would result in market efficiency. By this we mean, whether the consumer is incentivised to install a solar PV system that is configured to align generation with existing consumption patterns, or shift consumption to align with its solar PV output generated over the course of a day.
Net versus Gross Payments
There are two types of payment mechanisms, ‘net’ payment and ‘gross’ payment. These different types of payments require different metering configurations for measuring generation and consumption, however there is no impact on the flow of energy. That is, whether a customer has a ‘net’ or ‘gross’ payment will not influence whether the energy flows into the home or network.
A net versus gross metering arrangement has significant implications for the level of financial benefit that households receive from their solar PV investments. Under a net FiT,23 the customer receives a payment only for the surplus energy that is exported to the grid from their solar PV unit. However under a gross mechanism, the customer receives the payment for every kWh produced regardless of how much of the solar generated electricity is used by the household and how much is fed back into the grid.
The difference between a net and gross payment mechanism will impact on customers’ behaviour. Under a net payment the customer is incentivised to minimise personal consumption during the times of the day when the installation is producing the most electricity. However under a gross mechanism, there is no incentive on the customer to change its behaviour. Where the retail rate is higher than the FiT rate, customers on net payments have increased returns compared to gross payment customers because under the net scheme, customers avoid paying the retail rate and get the value of consuming their own energy.
Whether such behaviour promotes market efficiency and saves system costs will depend on the alignment between the times of the day when the solar production is highest (and hence the incentive to defer consumption is greatest) and the times of the day when the system is at peak demand. This issue is discussed further in chapter 9 when the report explores the impact of solar PV installations on network costs.
In Australia, the majority of FiT schemes operate under a net payment mechanism, with the exception of NSW and ACT government premium schemes which operated on a gross payment mechanisms. These schemes have been closed to new installations since the middle of 2011, and the NSW Solar Bonus scheme will end on 31 December 2016, with customers reverting to the retailers’ net payment schemes.
Customers on Premium Feed in Tariff Rates
The financial return to consumers from maximising their export is increased if the customer is on a subsidised net premium rate as compared to a retailer FiT. As shown in figure 6, the difference between these rates is substantial at around 40 to 60 cents per kWh. This difference reflects the extra value to consumers from deferring consumption away from times when solar generation is at
23 There are different variants of net metering. For example, the FiT could apply to total energy produced less total energy consumed. This is the case in the Northern Territory. Alternatively, where customers may have two separate retail tariffs (for example in Tasmania, where customers have one tariff for light and power and a different tariff for heating and hot water), export may be netted off only one of these elements. These different arrangements will have different implications.

KPMG | 32
© 2016 KPMG, an Australian partnership and a member firm of the KPMG network of independent member firms affiliated with KPMG International Cooperative (“KPMG International”), a Swiss entity. All rights reserved. The KPMG name and logo are registered trademarks or trademarks of KPMG International.
Liability limited by a scheme approved under Professional Standards Legislation.
the highest compared to consumers on retailer offered rates and for those customers, there is a possibility that the premium FiT rate is more than the variable component of their retail tariff.
This applies to those customers on high premium net rates such as Victoria, Queensland and South Australia. Whether such behaviour promotes market efficiency and saves system costs will depend on the alignment between solar production and the system peak. It also depends on the customer’s response to higher returns. Higher returns should, in theory, provide a greater incentive for customers to maximise their export. However, some customers may prefer to “set and forget” and instead see the higher returns overall as a reason to be less concerned about shifting their consumption.
Premium feed in tariffs rates will also impact on the incentives for such customers to install batteries and could actually act as a barrier to install such new technologies. This disincentive applies equally to customers on net and gross premium rates. There are two issues here:
· In some jurisdictions, a customer on a premium rate would become ineligible for that rate if it installs batteries. This is case in ACT, SA and Queensland. The rationale for this prohibition is that it may be impossible with the metering technology at the premises, to tell if the exported energy has solely been produced by the solar PV installation.
· In addition, there is a financial disincentive under current retail tariffs. If the premium FiT is more than the variable component of the retail tariff then the customer would lose revenue if it uses the battery to stored solar generation for later use at the premises. As explained above, the behavioural incentive on customers with premium rates is to maximise their solar exports and hence there is very little value from installing a battery to support the solar PV installation. This disincentive may change if the retail rate becomes time varying and there is value for the consumer to stored solar generated electricity for consumption at times when the time varying retail rate is highest. The issues associated with combining batteries and solar are discussed further in chapter 10.
Future Reforms to Feed in Tariff design
A number of different reviews are exploring the question on the appropriate design and level of feed in tariff designs:
· The Essential Services Commission of Victoria (ESCV) has conducted a review into the true energy value of distribution generation, including solar PV, and whether current policy and regulatory frameworks governing the remuneration of distribution provide adequate compensation consistent with the true value.24 The Victorian Government has accepted most of the ESCV recommendations including the introduction of time-of-use feed-in tariffs that align with the time blocks operating for flexible retail prices (peak, shoulder and off-peak) plus the addition of a payment to recognise the environmental and social value of distributed generation25
· The Queensland Productivity Commission has recently completed its inquiry into solar feed-in pricing in Queensland. Its recommendations are currently being considered by the Queensland Government.26
24 The Essential Service Commission of Victoria initiated this review on 22 December 2015 following receipt of terms of references from the Victorian Minister. http://www.esc.vic.gov.au/document/energy/30381-inquiry-into-the-true-value-of-distributed-generation-to-victorian-consumers-our-proposed-approach/ A final report was released on 21 August 2016. 25 See more at: http://www.delwp.vic.gov.au/energy/electricity/victorian-feed-in-tariff/esc-enquiry-into-energy-value-of-distributed-generation 26 Queensland Productivity Commission final report was submitted to the Queensland Government on 20 June 2016 and has not been released. http://www.qpc.qld.gov.au/inquiries/solar-feed-in-pricing/

KPMG | 33
© 2016 KPMG, an Australian partnership and a member firm of the KPMG network of independent member firms affiliated with KPMG International Cooperative (“KPMG International”), a Swiss entity. All rights reserved. The KPMG name and logo are registered trademarks or trademarks of KPMG International.
Liability limited by a scheme approved under Professional Standards Legislation.
· The Essential Services Commission of South Australia is currently considering whether or not there should be a minimum regulated retailer-paid FiT which must be paid to residential and small business electricity customers with solar PV installations.27
The focus of these reviews is to consider whether current FiT levels represent a fair price given the benefits from solar power produced by residential customers and exported into the electricity grid. This also includes whether the small scale technology certificates provide adequate compensation for environmental benefits from reducing the need for electricity from fossil fuel sources.
Currently none of the regulated FiT rates includes an allowance for any benefits to networks from solar PV generation and the Queensland and Victorian reviews are also considering the value of solar PV installations to network costs.
An important issue regarding potential reforms to FiT design is whether the rates should vary with time of day (i.e. Time of Use pricing) to better reflect the energy value from solar generation. Currently FiT payments made to solar PV customer for the electricity they export has been the same irrespective of whether that electricity is being delivered at a time of high demand or at a time when supply is in abundance.
It is worth noting that AusNet Services previously had a solar-specific network tariff for small customers with grid-connected solar PV systems up to 5kW. The tariff included an offset for electricity generated equal to the price that was paid for electricity consumed. During the summer peak period, an additional payment for excess generation was provided.28 No other networks developed such a tariff, and AusNet Services has removed this tariff (with effect from 1 January 2017) to comply with new pricing principles that do not permit discrimination based on different technology types.
In addition, Horizon Power offers a FiT that varies by geographic location.29 The rates are set by Horizon to reflect their cost of electricity generation and distribution in that area. This approach provides customers in areas with a high cost to serve a greater incentive to export.
Wholesale prices vary throughout the day peaking in the late afternoon. Therefore the value of electricity generated by solar PV installation to the market changes during the day. A FiT tariff design which better reflects the changing value would, in theory, provide stronger incentives on the solar PV customer to maximise net exports at the times of the day when the wholesale prices are high.
The ESCV has recommended that the current single tariff should be replaced by a framework that allows for a time and location varying FiT and that the regulated minimum FiT is expressed as a multi rate tariff aligned with the time blocks operating for flexible retail prices (namely: peak, shoulder and off-peak). This time varying feed-in tariff should be supplemented with a ‘critical peak’ tariff that would be paid when the wholesale price of electricity is equal to or exceeds $300 per MWh.30
There are impediments to making time-varying export pricing workable for FiT design, notably the low presence of advanced meters with interval metering capability, as discussed below.
Another issue being considered is whether retailers will have the incentive to offer time varying FiT rates. In theory, retailers should have the incentive to minimise consumption (and hence, maximise solar PV generation) at the time of day when wholesale prices are highest as doing so will lower their costs of supply. In practice, this incentive will depend on the particular circumstances of each retailer including its business model, hedging arrangements and whether it owns any generation.
27 http://www.escosa.sa.gov.au/projects/246/electricity-retailer-feed-in-tariff-review-of-regulatory-arrangements.aspx 28 AusNet Services, Electricity Distribution, Annual Tariff Proposal 2015, 1 January 2015, p24 29 https://horizonpower.com.au/being-energy-efficient/solar/eligibility-to-install-and-buyback-schemes/ 30 Essential Service Commission, The Energy Value of Distributed Generation – Draft Report, April 2016.

KPMG | 34
© 2016 KPMG, an Australian partnership and a member firm of the KPMG network of independent member firms affiliated with KPMG International Cooperative (“KPMG International”), a Swiss entity. All rights reserved. The KPMG name and logo are registered trademarks or trademarks of KPMG International.
Liability limited by a scheme approved under Professional Standards Legislation.
3.3.2 Small-scale technology certificates Under the Commonwealth Government Renewable Energy Target Scheme, owners of small-scale renewable systems (i.e., solar) are able to create and sell certificates for every megawatt hour of power they generate. These certificates are labelled small-scale technology certificates (STCs).
STCs are effectively a financial incentive for both individuals and businesses to install renewable energy systems including solar, wind and hydro. One STC is equal to one megawatt hour of renewable electricity either generated or displaced by the system. However, because STCs are paid up-front the financial incentive does not reflect the actual output of a PV system. Rather, the system is deemed to generate a certain amount of energy based on its location and the deemed life of the system.
The value of an STC is subject to supply and demand conditions in the market. If owners elect, they may sell STCs on the market for an uncapped price or through a clearing house operated by the Clean Energy Regulator. The clearing house offers a fixed price of $40 however the STCs will be only be sold on the clearing house once a buyer becomes available. Therefore, the sale may be delayed.
In earlier years of the scheme, early adopters of small generation units were incentivised by multipliers that allowed additional STCs to be created for the first 1.5kW of capacity. This was reduced over the years from a factor of 5 times (which applied between June 2009 to June 2011) and has now been phased out completely. Generally, one STC is equal to one megawatt hour of eligible renewable electricity either generated or displaced by the system. An STC can only be created within the first 12 months of installation of an eligible system.
Generally, householders who purchase these systems assign the right to create their certificates to an agent in return for a lower purchase price and therefore the STCs effectively provide a subsidy to the installer. This subsidy reduces the up-front cost of purchasing and installing a solar PV system by around 30–40 per cent on average. Further, since there is no ongoing benefit, there is no impact on customer behaviour in terms of shifting consumption.
The level of this benefit differs across the country depending on the geographical location (i.e., level of solar radiation, installation date and the expected amount of electricity that is generated in the lifetime of the system (up to a maximum of 15 years)). In Queensland, based on average solar PV system prices, the level of the SRES subsidy is between 2.8 and 2.9c/kWh for predicted generation.31
As there is no binding target for the SRES, there is no limit on the number of STCs that can be surrendered across the scheme. Any system under 100kW is eligible to generate STCs.32 Under the Renewable Energy (Electricity) Act 2000, certificates can be created until 31 December 2030.
3.4 Metering As discussed above, solar PV customers may maximise the value of their solar PV system by switching to different forms of retail tariffs, such as time of use tariffs. Further, different types of FiTs may evolve in the future that incentivise customers to export at certain times of day, such as during peak periods. The availability of these types of tariffs relies on a customer having the necessary metering technology to enable electricity consumption to be measured at different times of day. This is known as interval metering.
31 Queensland Productivity Commission, Draft Report: Fair Price for solar pricing – Overview, March 2016. http://www.qpc.qld.gov.au/files/uploads/2016/03/Fact-Sheet-Solar-Draft-Report-Revised.pdf 32 Systems with a capacity above 100kW are eligible for Large-scale Generation Certificates. This scheme operates on a very different basis.

KPMG | 35
© 2016 KPMG, an Australian partnership and a member firm of the KPMG network of independent member firms affiliated with KPMG International Cooperative (“KPMG International”), a Swiss entity. All rights reserved. The KPMG name and logo are registered trademarks or trademarks of KPMG International.
Liability limited by a scheme approved under Professional Standards Legislation.
Currently, Victoria is the only jurisdiction with widespread access to the necessary metering technology, following a mandate roll out of smart meters in that jurisdiction. Of the approximately 2.9 million households with access to retail time of use offers33, more than 2.75 million are in Victoria.34
Current Rules (outside of Victoria) only require solar PV installations to have bi-directional metering capability. Given that solar PV installations had to incur metering costs at the time of installation, there would only have been incremental costs associated with requiring meters to be capable of interval reading. Ensuring that solar installations have up to date metering technology would have, on average, improved the financial returns to solar PV installations and provided a platform to encourage solar PV customers to help minimise system peaks.
This issue is will be resolved from 1 December 2017, under the AEMC metering contestability change to the NER when all new and replacement meters, including those for solar PV installations, will be required to be capable of being remotely read and recording date on an interval basis. However this is a lost opportunity for existing solar customers who have to include new costs if they want to install such a meter.
This could also be an issue for NSW gross FiT customers between 31 December 2016, when the gross FiT scheme is no longer available and 1 December 2017, when the new metering rules take effect. The change in the structure of the FiT from gross to net will require some affected solar PV customers to change their meter. While the NSW Government has amended its Electricity Supply Act to facilitate the competitive roll-out of smart meters prior to the new national arrangements taking effect,35 there is no requirement for any newly installed meters to be an interval read meter.
33 AEMC 2015 Residential Electricity Price Trends Final Report. In Victoria, offers with different rates for different times of the day are also referred to as flexible pricing offers. 34 See http://www.smartmeters.vic.gov.au/installation 35 Electricity Supply Amendment (Advanced Meters) Act 2016

KPMG | 36
© 2016 KPMG, an Australian partnership and a member firm of the KPMG network of independent member firms affiliated with KPMG International Cooperative (“KPMG International”), a Swiss entity. All rights reserved. The KPMG name and logo are registered trademarks or trademarks of KPMG International.
Liability limited by a scheme approved under Professional Standards Legislation.
4 Pre-sales We found that the majority of customers install solar PV to reduce their energy bills or for other financial reasons. A smaller, but still high proportion of customers are seeking greater control over their energy and, related to this, greater independence. Some customers also cite environmental reasons as a factor influencing their decision to install solar PV.
However, many customers that have not yet installed solar PV face a number of barriers to doing so. The greatest barriers are faced by people who cannot afford the capital and installation costs, renters who must negotiate with their landlord to install solar PV, and apartment dwellers, who face issues around joint ownership of property.
Future uptake of solar PV is likely to be linked to the attractiveness of battery storage and changes to network tariffs, as well as reducing the barriers discussed above. Uptake of solar PV could be either tempered or strengthened by the introduction of battery storage. Some potential solar PV customers may choose to wait until battery storage becomes more cost effective and established to install solar PV, in order to avoid risks around technology becoming obsolete. On the other hand, some customers may value the additional flexibility and independence from combining solar PV with battery storage.
The impact of changes to network tariffs will depend on the extent to which network tariff structures are incorporated in retail price structures, the individual customer’s consumption profile relative to network usage, and the nature of the tariff structure.
This chapter sets out our findings relating to what motivates residential customers to install a solar PV system. The findings draw on evidence from surveys and interviews conducted by UMR and MEFL, as well as from available literature both within Australia and internationally.
The chapter also considers the broader market conditions, including government policies, that have influenced customers’ decisions to consider solar PV and what factors might drive the continued development of the residential solar PV market.
4.1 What motivates a customer to install solar PV? In assessing the experiences and outcomes of customers it is important to recognise that not all customers are the same and, as such, they may have different expectations about how their solar PV system will perform. A customer’s motivation for installing solar PV is an important characteristic to consider when exploring these differences. For example, a customer who installs solar PV primarily to reduce their electricity bills will assess the performance of their system against a different metric from a customer that has installed a system primarily for environmental reasons.
Results from the UMR survey suggest that the majority of customers install solar PV systems to reduce their energy bills. However, there is also a strong sense that customers are seeking greater energy independence. Environmental concerns, while important, featured less strongly.

KPMG | 37
© 2016 KPMG, an Australian partnership and a member firm of the KPMG network of independent member firms affiliated with KPMG International Cooperative (“KPMG International”), a Swiss entity. All rights reserved. The KPMG name and logo are registered trademarks or trademarks of KPMG International.
Liability limited by a scheme approved under Professional Standards Legislation.
These results suggest that for the majority of customers, a lower electricity bill and reduced grid consumption are important outcomes. A smaller group of customers is less concerned about the financial outcomes, but wish to see a reduction in their carbon emissions.
4.1.1 Most customers want to save money on their energy bills To date, the main driver for customers to install solar PV systems appears to be a desire to save money on their electricity bills. Of customers with solar PV that were surveyed by UMR, 60% strongly agreed that reducing household energy bills was a factor contributing to their decision to install solar. Other financial reasons, including being able to get a feed-in tariff and government grant schemes, also featured strongly.
Figure 7: Reasons for installing solar
How much have the following factors contributed to your decision to install a solar electricity system?
Source: UMR report.
The findings from the UMR survey are consistent with other surveys, both within Australia and in the UK, that examine motivations for installing solar PV. In Australia, a survey undertaken by CSIRO36 found that 70% of customers surveyed that had installed solar PV had done so primarily to save money on their power bill. A further 11% had done so to benefit from government rebates and 4% had done so to be less reliant on energy retailers.
A survey conducted on behalf of Energex, Ergon Energy and Powerlink in Queensland (“the 2015 Queensland household energy survey”) also found that the primary drivers for investing in solar PV were financial37, although fewer customers felt strongly about this in 2015 (60%) than in 2014 (66%). Forty-five per cent wanted to make the most of their current feed-in tariff and 34% thought solar was a good investment.
36 Romanach, L., Contreras, Z., and Ashworth, P. (2013). Australian householders’ interest in active participation in the distributed energy market: Survey results. Report nr EP133598. CSIRO, Pullenvale, p21. 37 Colmar Brunton, Queensland Household Energy Survey 2015, Insights Report, 11 February 2016.

KPMG | 38
© 2016 KPMG, an Australian partnership and a member firm of the KPMG network of independent member firms affiliated with KPMG International Cooperative (“KPMG International”), a Swiss entity. All rights reserved. The KPMG name and logo are registered trademarks or trademarks of KPMG International.
Liability limited by a scheme approved under Professional Standards Legislation.
Similarly, a UK study found that the key drivers for customers installing solar PV are also financial, although environmental considerations have become increasingly important since 2011.38 This contrasts with the UMR research, where reputational issues appear to be becoming more important.39 Of the UK customers surveyed that had solar PV, 74% installed it because the feed-in tariff represented a good investment. Just over 50% specified environmental considerations as a reason, while 44% and 37% cited rising electricity prices and feed-in tariffs making solar PV affordable as reasons, respectively.
4.1.2 Customers also want energy independence The UMR results also suggest that customers with solar PV have a strong desire for energy independence. Over 30% of customers surveyed strongly agreed that becoming less dependent on mains electricity was a factor contributing to their decision to install solar PV. A further 50% mostly or mildly agreed with that statement. This could be due in part to the sustained increases in electricity prices over the last few years, which may have led some customers to feel increasingly as though they lacked control over their energy bill.
Similar responses came through ECA’s first Energy Consumer Sentiment Survey which was released in July 2016, where customers stated that the value for money of electricity services (and gas services) are significantly less than compared with their banking, water, mobile phone, insurance and internet services. Also customers are not confident that the markets are working in their interest nor than they expect outcomes to improve in the next five years.40
4.1.3 Environmental concerns are also a factor, but less important Twenty-six per cent of customers surveyed by UMR strongly agreed that protecting the environment was a factor in their decision to install solar PV. A further 46% mostly or mildly agreed.
The CSIRO41 survey found that 11.7% of respondents had installed solar PV so as to reduce household carbon emissions. Environmental reasons were the fourth most common factor found in the Queensland survey.
In the UK, a survey found that just over 50% of respondents cited environmental considerations as a reason for installing solar PV.42
These results suggest that while environmental considerations are an important driver for some customers to install solar PV, the majority of customers are more concerned about reducing their electricity bills and reducing their reliance on the grid, rather than reducing their carbon emissions or protecting the environment.
4.1.4 Installation cost and renting are the main barriers to solar PV There is a cohort of potential customers that would be interested in installing solar but have concerns about the cost, or are currently renting their home and see this as a barrier to doing so.
Approximately half of the respondents to the UMR survey that had not installed solar had considered getting solar. A further 37% had not given any serious thought to it, while 12% had rejected the idea.
38 Purple Market Research, Final Report to Citizens Advice: A review of consumer experience of solar PV systems, June 2015, p22. 39 UMR, Usage of solar electricity in the national energy market, A quantitative study, July 2016, p.14. 40 Energy Consumer Australia: Energy Consumer Sentiment Survey Findings, July 2016 41 Romanach, L., Contreras, Z., and Ashworth, P. (2013). Australian householders’ interest in active participation in the distributed energy market: Survey results. Report nr EP133598. CSIRO, Pullenvale, p21. 42 Purple Market Research, Final Report to Citizens Advice: A review of consumer experience of solar PV systems, June 2015, p22.

KPMG | 39
© 2016 KPMG, an Australian partnership and a member firm of the KPMG network of independent member firms affiliated with KPMG International Cooperative (“KPMG International”), a Swiss entity. All rights reserved. The KPMG name and logo are registered trademarks or trademarks of KPMG International.
Liability limited by a scheme approved under Professional Standards Legislation.
Of those that had considered installing solar PV or had rejected the idea, the main drivers were the same as for those respondents that had installed solar; that is, to reduce household energy costs and to reduce dependency on mains electricity.
The cost of installation appears to be the main barrier to respondents installing solar PV. Approximately a third of customers surveyed that do not have solar PV consider it to be too expensive to install.43 This is consistent with research conducted by Newgate Research (Newgate) on behalf of the AEMC regarding new and emerging technologies. Newgate’s report for the AEMC found that the upfront financial outlay was a large barrier for many.44 Newgate also found that some customers see the reduction in solar rebates as an example of energy providers and/or the government hampering the uptake of technology.45
Another third of respondents to the UMR survey were renting their home and cited this as the main barrier to installing solar PV. Again, this is consistent with the Newgate’s research for the AEMC, which found that renters assumed that their landlords may not allow solar to be installed.46
However, living in a rental property was not a barrier to some customers arranging for solar to be installed at their property. Sixty-one per cent of renters with solar PV had it installed after they moved in. Interestingly, 40% of renters said that they made the decision to install the system.
These results suggest that although renting may present a barrier to many householders, there is at least a small group of customers that have managed to successfully negotiate with their landlord to install solar PV.
Figure 8: Reasons for not installing solar
Which of the following best describes the reason why you don’t have solar electricity at your home?
Source: UMR Report.
43 UMR, Usage of solar electricity in the national energy market, A quantitative study, July 2016, p.95. 44 Newgate Research, AEMC 2016 Retail Competition Review: New and Emerging Energy Technologies and Services, Consumer Research Report, June 2016, p30. 45 Newgate Research, AEMC 2016 Retail Competition Review: New and Emerging Energy Technologies and Services, Consumer Research Report, June 2016, p20. 46 Newgate Research, AEMC 2016 Retail Competition Review: New and Emerging Energy Technologies and Services, Consumer Research Report, June 2016, p35.

KPMG | 40
© 2016 KPMG, an Australian partnership and a member firm of the KPMG network of independent member firms affiliated with KPMG International Cooperative (“KPMG International”), a Swiss entity. All rights reserved. The KPMG name and logo are registered trademarks or trademarks of KPMG International.
Liability limited by a scheme approved under Professional Standards Legislation.
The CSIRO survey found that, even amongst those that had not installed solar PV or other distributed technologies, on average householders support solar PV technologies.47
The survey conducted on behalf of Queensland network businesses found that the primary barriers to solar PV were financial and a perception that they would need to change their behaviour.
Figure 9: Barriers to Solar PV in Queensland
Source: Colmar Brunton, Queensland Household Energy Survey 2015, Insights Report, 11 February 2016.
4.1.5 Apartment dwelling may also be a barrier While not explicit in the UMR survey, it also appears that living in a dwelling that has a strata may also be a barrier. Of the solar users surveyed, 84% lived in a detached house. Only 5% lived in a unit or apartment, and 4% in a townhouse. In contrast, of the non-solar users surveyed, 20% lived in a unit or apartment, and a further 8% lived in a townhouse.
Similarly, Newgate found that apartment dwellers assumed solar (and battery storage technologies) could not fit or be retrofitted into their properties.48
Modelling of forecast solar PV and battery uptake that underpins AEMO’s 2016 National Electricity Forecasting Report assumes a limit for residential solar PV of 55% of all households in a region. This limit was set on assuming that only private, separate dwellings could install PV system.49
4.2 Future uptake of solar PV In the last five to ten years, the up-take of solar PV has been driven, at least in part, by premium feed-in tariffs and government rebates. These schemes were used by governments to motivate the
47 Romanach, L., Contreras, Z., and Ashworth, P. (2013). Australian householders’ interest in active participation in the distributed energy market: Survey results. Report nr EP133598. CSIRO, Pullenvale, p21. 48 Newgate Research, AEMC 2016 Retail Competition Review: New and Emerging Energy Technologies and Services, Consumer Research Report, June 2016, p35. 49 Jacobs, Projections of uptake of small-scale systems, 6 June 2016, p11.

KPMG | 41
© 2016 KPMG, an Australian partnership and a member firm of the KPMG network of independent member firms affiliated with KPMG International Cooperative (“KPMG International”), a Swiss entity. All rights reserved. The KPMG name and logo are registered trademarks or trademarks of KPMG International.
Liability limited by a scheme approved under Professional Standards Legislation.
uptake of solar PV by making it more cost effective for customers. However, the level of the feed-in tariffs has reduced significantly over time and, in some jurisdictions, is no longer regulated. The value of the certificates created under the SRES has ramped down. As a consequence the residential market for solar PV has slowed.
While the pace of connections may have slowed, sales are likely to continue. The cost of solar PV installations has reduced sufficiently such that for many customers it is now a cost effective option, even without premium feed-in tariffs. The ECA Energy Consumer Sentiment Survey found that households have also made significant investment in rooftop solar panels and solar hot water systems with the highest uptakes in Queensland, South Australia and Western Australia and that proportion of households with rooftop solar and solar water systems could double in most jurisdictions in the next 5 years.50 As discussed in the previous section, customers also have a desire to be less dependent on the grid for their energy needs. This motivation will continue to drive sales, albeit at a slower pace.
This is consistent with forecasts underpinning AEMO’s 2016 National Electricity Forecasting Report, which suggests that residential uptake of solar PV will continue steadily, but at a slower rate than previous years. 51
There are a number of factors that could contribute to ongoing uptake of solar PV:
· reforms or technology developments that make it easier to install solar PV in rental properties and units;
· increased availability and reduced cost of battery storage; and
· network and retail tariff reform.
Each of these is discussed in turn.
4.2.1 Reforms or technology developments to remove barriers to uptake of solar PV
As discussed above, one of the major barriers to some householders installing solar PV is that they rent their home. Making it easier for renters to install solar, as well as making it easier for apartment dwellers to do so, could strengthen residential demand for solar PV. However, while some work has been conducted to consider how these customers can benefit from solar PV (see Box 1 below), the barriers to individual electricity supply from solar PV remain.
Rental properties
As discussed above, approximately a third of respondents surveyed who have not installed solar PV cited renting their home as the primary reason. A number of barriers exist for these potential customers. First, they would need the owner’s permission, and second, there is no guarantee that a renter will continue living in that property for a sufficient period of time to make the installation of solar PV financially worthwhile.
One option that has been mooted for addressing these barriers is the advent of leasing panels and solar power purchase agreements. Under these arrangements, a renter could avoid the upfront cost of the panels by instead leasing the panels or entering into a solar power purchase agreement with a solar provider. However, this solution does not fully address the barriers since the landlord’s consent
50 Energy Consumer Australia: Energy Consumer Sentiment Survey Findings, July 2016. The survey also found that although not many small businesses have invested in solar technology, 48% of businesses expect to invest in this technology in the future 51 Jacobs, Projections of uptake of small-scale systems, 6 June 2016, p27.

KPMG | 42
© 2016 KPMG, an Australian partnership and a member firm of the KPMG network of independent member firms affiliated with KPMG International Cooperative (“KPMG International”), a Swiss entity. All rights reserved. The KPMG name and logo are registered trademarks or trademarks of KPMG International.
Liability limited by a scheme approved under Professional Standards Legislation.
would still be required. Further, there would be no certainty for the solar provider that a new tenant would be prepared to enter into an agreement if the initial tenant moved out.
There is a possibility the owner could install a solar PV system at their own expense and charge their tenant for use of electricity. However, it may not be in the owner’s financial interests and it is not clear what customer protections may apply to the renter.
Despite these issues, the UMR survey shows that there are some customers renting their home that have arranged for solar to be installed, and similarly some landlords that have decided to install solar in their rental properties.
From the landlord’s perspective, there may be a number of reasons for installing solar. These include:
· historically, they intended to move into the property in the near future and wanted to take advantage of premium feed-in tariffs when they were available;
· to increase the value of their property;
· to obtain tax deductions; and
· to increase the likelihood that their tenants will stay, or because they view it is a way to attract tenants to reduce the vacancy rate.
Where the landlord decides to install solar, to obtain the feed-in tariff the electricity account would need to be in their name. The landlord would need to have an agreement in place with the tenant regarding how electricity usage charges would be passed through. Further, the landlord may need to consider offering the tenant financial incentives in order to encourage them to change the way in which they use electricity to maximise the value of the solar PV system to the owner.
Residences subject to strata
Unit owners also face barriers to installing solar PV. This is primarily because they would require consent from their strata. Issues include:
· who owns the roof space (typically it is jointly owned);
· insurance;
· maintenance; and
· responsibility for any damage to the roof.
These difficulties are reflected in the small proportion of solar customers surveyed by UMR that live in a dwelling other than a detached house. Only 5% of solar respondents lived in apartments, and even lower proportions lived in a semi-detached house, a terrace or a townhouse/villa.52 In contrast, 20% of non-solar respondents lived in apartments, and a further 16% lived in a semi-detached house, a terrace, or a townhouse/villa.
Smart Blocks is an initiative developed by the City of Melbourne and City of Sydney. The purpose of the program is to assist apartment owners and their managers to improve the energy efficiency of common property in apartment buildings. One option that they suggest is solar PV. The Smart Blocks website states:53
Installing a solar system can not only make your building more attractive to property buyers and tenants, but can potentially improve resale values and occupancy rates.
52 UMR, Usage of solar electricity in the national energy market, A quantitative study, July 2016, p97. 53 http://smartblocks.com.au/what-can-i-do/install-solar/

KPMG | 43
© 2016 KPMG, an Australian partnership and a member firm of the KPMG network of independent member firms affiliated with KPMG International Cooperative (“KPMG International”), a Swiss entity. All rights reserved. The KPMG name and logo are registered trademarks or trademarks of KPMG International.
Liability limited by a scheme approved under Professional Standards Legislation.
The website provides a useful source of information to apartment owners. However, they have not been able to resolve any of the barriers listed above for these potential solar customers, including how individual apartments can obtain the benefits of solar PV directly. Rather, the focus is on using solar PV to supply electricity to common areas.
Box 1: Renewables for All
“Renewables for All”54 is a project that is advocating amendment of policy settings and regulatory arrangements to help all Australians access the benefits from clean energy solutions, including solar PV. Some of the proposed aimed at renters and apartment dwellers include:
· Solar gardens, where energy from a centralised, shared, off site facility is sent directly to homes.
· Community owned renewable energy, where households and businesses own shares, or solar panels, in a centralised solar facility and receive credits on their bills from energy generated.
· Tax incentives, which allow people to invest in renewable energy outside of their own home without facing tax consequences.
Each of these mechanisms provides a means for people to invest in solar PV outside of their own homes. While the solar garden option would allow customers to directly benefit from investment in PV, the remaining options do not directly address the barriers to renters and apartment dwellers installing systems in their own homes.
4.2.2 Uptake of battery storage Complementing the desire for independence, battery storage is now becoming a plausible option for many customers. While batteries may not yet be cost effective, this may not be a deterrent for those customers that are seeking energy independence. Of those customers surveyed by UMR who had undertaken serious research on installing batteries, 76% agreed that they were considering batteries so as to become less dependent on mains electricity. This compares to 73% who agreed that they were considering batteries to reduce household energy costs.
However, it does not appear likely that battery storage will lead to another period of high growth in solar PV at the residential level, at least not for some time. Modelling by the ATA on the economics of battery storage suggests it is unlikely to be cost effective for many customers until at least after 2020. AEMO is forecasting that battery storage will not become economic for the average consumer until the early 2020s, and so this technology will have limited impact on the solar PV market until then.55
Further, some customers may choose to delay installing solar until battery storage becomes more economic. Operating parameters such as DC voltage ranges may change, operating standards may change, and there may be other developments that mean that solar PV systems installed today may not be completely fit for purpose for incorporating storage at a later date. Consequently, such customers may face additional capital costs to install a battery that they would not face if they delayed installation of solar.
Those customers that do not want to defer the installation of solar PV but are not prepared to install batteries at today’s prices have at least two options:
54 http://cpagency.org.au/renewables-for-all-resources/ 55 AEMO, National Electricity Forecasting Report 2016, June 2016, p5.

KPMG | 44
© 2016 KPMG, an Australian partnership and a member firm of the KPMG network of independent member firms affiliated with KPMG International Cooperative (“KPMG International”), a Swiss entity. All rights reserved. The KPMG name and logo are registered trademarks or trademarks of KPMG International.
Liability limited by a scheme approved under Professional Standards Legislation.
· Install solar PV with a battery-ready (‘hybrid’) inverter and install the battery system once prices reduce. This approach has the advantage that, subject to changes in technology or standards, a new inverter will not be required in order to install battery storage. However, hybrid inverters are more expensive than standard inverters and there is no guarantee that the technology or standards will not change and so render the inverter obsolete.
· Install solar PV with a standard inverter and purchase a new, hybrid inverter or DC to DC converter once battery prices reduce. This approach has the advantage that a standard inverter is cheaper and avoids the risks around the hybrid inverter becoming obsolete. However, it is likely that the standard inverter would not have reached the end of its useful life prior to battery storage becoming economic. Consequently there would be some cost associated with replacing it early.
Customers seeking to install solar PV and battery storage therefore face a trade-off between installing systems now and facing higher costs, as well as the risk of technology changing, versus waiting until battery storage becomes economic to install the solar PV system. It should be noted that a solar PV installation without batteries today will likely deliver faster payback times as the lower upfront cost will typically outweigh the smaller bill savings. It is also likely that new technology will emerge and become commercial that would remove the need for a hybrid inverter in a retro-fitted battery project for a solar PV installation.56
This issue may become a source of confusion for some customers if their options are not clearly articulated by the solar retailer, particularly for those customers that may not be aware of the different inverter required to be battery-ready.
4.2.3 Reforms to network tariffs Network tariffs are currently being reformed to better signal the costs associated with investing in, operating and maintaining the distribution network. As discussed in chapter 3, the effects on current and potential solar PV customers will depend on the extent to which network tariff structures are incorporated in retail price structures and whether the customer has a smart meter that can record energy consumption at different times of day. The effects will also depend on an individual customer’s consumption profile relative to network usage, and the nature of the tariff structure.
Assuming that the new tariff structures are visible to the customer, the value to potential customers of installing solar PV will change compared to under existing tariffs. For example:
· Time of use tariffs57 could make solar PV a more attractive option for those customers whose load profile coincides with the average load profile on the network, compared to if they are on a flat tariff. These customers would typically use most of their electricity in the evening, when there is the most stress on the network and so prices are higher. Provided the network peak is in daylight hours, these customers would benefit from solar PV as they could use their own generation at times of high network prices.
· Similarly, demand charges58 may make solar PV an attractive option for customers that have peaky energy use, where the peak demand period coincides with generation. Again, provided a customer’s maximum demand is during daylight hours, they could reduce this maximum demand by drawing on their solar PV, and so minimise their demand charge.
56 In its report, ATA notes that there a current opportunity for retro-fit solar-battery projects to utilise a separate DC to DC converter, as an alternative to a more expensive hybrid inverter with battery control functionality. This approach can save in the order of $5,000 on the cost a of a new, replacement hybrid inverter as part of a retro-fit project. 57 Time of use tariffs are consumption charges that vary with the time of day at which electricity is consumed. 58 Demand charges are a charge based on a customer’s highest recorded demand during a billing period.

KPMG | 45
© 2016 KPMG, an Australian partnership and a member firm of the KPMG network of independent member firms affiliated with KPMG International Cooperative (“KPMG International”), a Swiss entity. All rights reserved. The KPMG name and logo are registered trademarks or trademarks of KPMG International.
Liability limited by a scheme approved under Professional Standards Legislation.
· Conversely, a higher fixed charge may reduce the attractiveness of solar PV. Solar PV can only be used to offset variable charges, since the fixed component does not change with energy use. Therefore a relatively high fixed charge compared to the variable component will reduce the proportion of the bill that solar PV can offset, and therefore raising the relative cost of solar PV.

KPMG | 46
© 2016 KPMG, an Australian partnership and a member firm of the KPMG network of independent member firms affiliated with KPMG International Cooperative (“KPMG International”), a Swiss entity. All rights reserved. The KPMG name and logo are registered trademarks or trademarks of KPMG International.
Liability limited by a scheme approved under Professional Standards Legislation.
5 Sales We found that customers rely on their solar installer to obtain information. While most customers considered they had sufficient information to make decisions about their system, almost a third wished they had more information before installation.
Based on case studies undertaken by MEFL, systems generally appear to have been sized and installed appropriately for individual customers. However, MEFL found instances where customers have had systems installed that are larger than they need, and where the panels suffer from shading.
There is also anecdotal evidence that some customers are being sold systems that are not sized appropriately for them. First, some customers appear to not have a full understanding of how different factors influence the payback period for a system, and simply assume that larger systems will provide greater returns. Second, some customers are having systems installed that are too small for their needs as a result of the capacity threshold under which a Distribution Network Service Provider (DNSP) will automatically pre-approve a system to connect to their network. This threshold seems to act as an artificial constraint on the sizing of residential PV, creating a market distortion.
This chapter sets out the findings from research related to residential solar customers’ experiences of the sales process, including the information that they use to inform their decision. The findings draw on evidence from surveys and interviews conducted by UMR and MEFL, as well as from available literature both within Australia and internationally.
This chapter also considers whether systems have been designed appropriately for customers, including system size and panel orientation.
5.1 Do customers have the right information? Most customers surveyed by UMR considered they had sufficient information to make an informed decision about whether installing solar is right for them. However, the customer survey also indicates that many customers lack important knowledge, such as the specified output of the panels and the level of their FiT. This suggests that while customers are generally satisfied with their solar PV system, they may not have been provided with the information they need to make the right decisions for them about their systems.
Thirty-two percent of customers surveyed agreed, to varying degrees, that they wished they had been given more information about their solar system before installation. These tended to be the customers that were approached by solar marketers rather than those customers that decided to install solar and then sought a provider. This suggests that some customers are not being provided with the information they need, or are not aware of the questions they should be asking.
There are a few websites that provide useful information on the factors that customers should consider when installing solar PV, and the various factors that will affect the system’s performance.

KPMG | 47
© 2016 KPMG, an Australian partnership and a member firm of the KPMG network of independent member firms affiliated with KPMG International Cooperative (“KPMG International”), a Swiss entity. All rights reserved. The KPMG name and logo are registered trademarks or trademarks of KPMG International.
Liability limited by a scheme approved under Professional Standards Legislation.
These websites include, for example, the CEC’s website, jurisdictional government websites and some DNSPs’ websites. However, these websites to not appear to be widely known or used.
Rather, the majority of customers surveyed by UMR relied on information provided by the solar installer. Approximately a fifth of customers used product review websites and forums such as Whirlpool or looked at other solar electricity providers. Approximately a tenth consulted other sources of information such as their electricity retailer (if not their solar installer), state or federal government agencies, the CEC or environmental organisations.59
A CSIRO survey published in 2013 found that customers were most likely to trust CSIRO, consumer organisations such as Choice, scientists or engineers and experts in solar energy technology when seeking information on solar PV.60 Conversely, the least trusted sources were the media, electricity and gas companies, government departments and agencies and solar industry organisations. However, as the UMR survey found customers do not appear to be utilising the “more trusted” sources of information, perhaps because they are not aware they exist or do not know where to look.
The UMR survey results also suggest that the majority of customers are unlikely to be undertaking their own financial assessment of the value of installing solar and the impact of different sized systems on their return. Rather, they are relying on information provided by the installer. This is despite most respondents suggesting that the primary reasons for installing solar was for financial reasons. Consequently, to ensure that customers are obtaining value for money, system designers must have incentives to install the right system for their customers.
Box 2: Customers aren’t always getting the right information
One of the key pieces of information to assist with the purchase decision is the predicted output of a solar PV system. CEC accredited retailers are required to disclose the predicted output of a system as part of the quotation process to potential purchasers.
Phone consultations undertaken by MEFL found that more than 60% of solar customers interviewed were not given, or at least could not recall being given, any indication of predicted output of the system.61 Even fewer (seven in total) have retained this documentation as part of their records.
This is an issue for consumers where their perception of their system’s output significantly exceeds the actual capacity of the specified system to generate electricity – either because the provider has inflated the predicted output or where they have relied on other sources of information.
Where predicted output was documented in writing, for the most part the predictions were accurate or conservative. However, some evidence was found of over-prediction. The evidence gathered did not demonstrate this was systemic or the domain of a particular provider or jurisdiction.
Generally in the energy market, the ECA Energy Consumer Sentiment Survey found that while consumers are confident in their own abilities to choose the energy products and services that are right for them, they are less confident that information is available to help them make good decisions.62
59 UMR, Usage of solar electricity in the national energy market, A quantitative study, July 2016, p20. 60 Romanach, L., Contreras, Z., and Ashworth, P. (2013). Australian householders’ interest in active participation in the distributed energy market: Survey results. Report nr EP133598. CSIRO, Pullenvale, p30. 61 MEFL, Energy Consumers Australia – Experience of Solar Consumers, 10 October 2016, p12. 62 Energy Consumer Australia: Energy Consumer Sentiment Survey Findings, July 2016

KPMG | 48
© 2016 KPMG, an Australian partnership and a member firm of the KPMG network of independent member firms affiliated with KPMG International Cooperative (“KPMG International”), a Swiss entity. All rights reserved. The KPMG name and logo are registered trademarks or trademarks of KPMG International.
Liability limited by a scheme approved under Professional Standards Legislation.
5.2 Are systems being designed appropriately? System design is very important for customers to obtain the best value from their systems. Two important factors influencing solar PV performance that designers can control are system size and solar exposure (orientation, tilt of panels and shading).63
5.2.1 Size of system Roof space and budget are key factors that will determine system size for customers. However, the size of solar systems has also been influenced to varying degrees over time by a number of other, external factors, including:
· the cost of the solar panels;
· the type, structure and level of FiTs; and
· the capacity limit at which DNSPs will automatically approve connection to their network.
In the early 2010s, the cost of solar panels was a significant limiting factor on the size of systems being installed. Prior to 2012, limits on government rebates also appear to have been a consideration in limiting system size.
As the cost of panels decreased, the design and level of FiTs became an important determinant of system size – generally, the bigger the system, the better the return with a premium FiT. Since 2013, more 2.5 to 4.5kW and 4.5 to 6.5kW systems are being installed than systems less than 2.5kW. Since mid-2015, the number of 4.5 to 6.5kW systems installed has exceeded the number of 2.5 to 4.5kW systems.64 The average system size for residential customers is now over 5kW.
As governments have moved away from generous FiTs, so that customers now face a net FiT that is significantly lower than their retail tariff, system sizes should more closely reflect individual customers’ load profiles if they want to minimise the payback period for the system (see chapter 3). This implies that every installation should be considered in the context of the individual customer.
Some retailers provide a guide on the appropriate system size based on the number of people in the house as a proxy for energy use, as well as average daily use for that household size.
Others provide a system size calculator with varying degrees of sophistication. However, it is not clear to what extent retailers are tailoring systems to individual customers’ circumstances. MEFL found that in determining system sizing for customers, solar providers did not routinely investigate customer bills to determine the right size of system. They also found no evidence that solar installers in Victoria had taken the step of interrogating available smart meter data.
Even where solar providers do consider a customer’s consumption patterns, to do so effectively requires understanding the time of day at which a customer uses the most electricity. Where installers base the system size on a customer’s average daily use rather than average daily day time use, a customer that uses most of their electricity in the evening and overnight may end up with a system that is bigger than their needs.
Anecdotal evidence suggests that some new solar systems are not being matched to consumption. Rather, some system sizes appear to be driven by two factors:
63 Quality of the main components and wiring and installation design are also important. These are discussed in the next chapter. 64 APVI, Monthly Installations by Size Category.

KPMG | 49
© 2016 KPMG, an Australian partnership and a member firm of the KPMG network of independent member firms affiliated with KPMG International Cooperative (“KPMG International”), a Swiss entity. All rights reserved. The KPMG name and logo are registered trademarks or trademarks of KPMG International.
Liability limited by a scheme approved under Professional Standards Legislation.
· an assumption by customers that larger systems are better; and
· the limit at which DNSPs will automatically approve connection to their network.
Customer misperceptions that bigger is better
Anecdotal evidence suggests that many customers assume that larger systems will provide greater returns. This assumption could reflect customers’ experiences under historical incentive schemes, or more generally a lack of information or understanding about the various factors that influence the payback on panels and how those factors interact.
Some customers may wish to install a system that is larger than necessary for their household load profile. For example, they may install a large system for environmental reasons so as to displace other, more carbon-intensive generation. Provided the customer is aware that this will increase the payback period for the system, then this is a logical choice for that customer.
However, as discussed in chapter 4, most customers that install solar do so primarily for financial reasons. Installing a system that is larger than necessary is unlikely to be the right outcome for them. Consequently, we would expect to see larger systems than necessary in a minority of cases and only where the customer had installed the system for non-financial reasons.
Site visits conducted by MEFL indicated that customers did not have a good understanding of the implications of the system size on the expected financial returns. Rather, most households visited assumed that a larger solar system would increase returns.
As discussed above, most customers rely on their solar provider for information relating to the design of their system. This was confirmed by MEFL’s site visits, which found that although customers were offered a number of system sizes, they tended to opt for the one recommended by the installer. Solar providers may have an incentive to install a system that is larger than necessary where their profitability is related to the size of units that they sell. Consequently if a customer has the impression that “bigger is better”, the solar provider may have no incentive to inform them otherwise. Based on the site visits, MEFL suggested that most installers appeared to be recommending the largest system that a customer could afford, or could fit on their roof.
Despite these concerns, MEFL did not find evidence of significant problems with over-sizing.65 MEFL’s findings are set out in Box 3 below.
Box 3: Evidence of over-sizing
MEFL undertook analysis to determine whether customers had been sold a system that was larger than necessary to meet their on-site energy needs.
To do this, MEFL analysed customer data where the customer was on a FiT of less than 10c per kWh. Of the 19 systems that met this criterion, there were four examples of systems that had very low (less than 50%) self-consumption of generated electricity. A fifth customer had 51% self-consumption.
Of the five customers with the lowest self-consumption, three identified themselves as environmentalists, indicating that they may have been willing to oversize their systems despite a reduction in financial return.
Sandra and Ken had an existing system that catered for their needs but installed another system to improve their environmental impact even though it did not benefit them financially.
65 MEFL, Energy Consumers Australia – Experience of Solar Consumers, 10 October 2016, p13-15.

KPMG | 50
© 2016 KPMG, an Australian partnership and a member firm of the KPMG network of independent member firms affiliated with KPMG International Cooperative (“KPMG International”), a Swiss entity. All rights reserved. The KPMG name and logo are registered trademarks or trademarks of KPMG International.
Liability limited by a scheme approved under Professional Standards Legislation.
However, the UMR survey did not find any correlation between system size and protecting the environment being a key reason for installing solar PV.
These results suggest that there are instances of larger systems being installed than is necessary, increasing the payback period for these customers. However, it is difficult to conclude whether this issue is widespread.
Influence of DNSP policies on system size
Observations from both DNSPs and solar providers that we spoke to suggest that installers are recommending systems that are no larger than the size at which the relevant DNSP will auto-approve the installation, even where a larger system may be appropriate. As discussed further in chapter 7, systems over a certain size require a network impact assessment to be conducted by the DNSP. The threshold at which an assessment is required depends on the DNSP, but is generally around either 5kW or 10kW for urban customers. This is consistent with the average system size that is currently being installed (5.2kW).
Where a network impact assessment is required, this incurs an additional cost with no guarantee of the outcome. To avoid this additional cost and risk, some installers simply recommend a lower system size to their customers, even where a bigger system is more appropriate.
Consequently, a DNSP policy decision on the size at which they will set the auto-approve threshold appears to be placing an upper limit on the system size. From an individual customer perspective, this is a market distortion that is preventing them from installing a system that best suits their needs.
5.2.2 Panel orientation and shading Under the CEC’s System Design Guidelines, the designer's responsibilities are to, amongst other things, provide a site-specific full system design including all shading issues, orientation and tilt. While a small sample and therefore not statistically significant, MEFL’s site visits suggest that this framework is broadly driving the right outcomes for customers in terms of panel orientation and shading.
To date, FiTs have encouraged orientation of panels towards the north to maximise output and so financial return under the premium and gross FiTs (subject to a customer’s load profile and physical constraints). Some government websites that are intended to assist customers in installing PV also note customers should install their panels facing north if possible.66
Consistent with this, in their site visits MEFL found the majority of systems faced north. While some faced east or west (or a combination of more than one orientation), this is in line with the expectation that some systems will be designed to match generation times with high energy use, in which case a western or even eastern orientation may be preferable. In one instance, MEFL found that the customer had opted for east facing panels for aesthetic reasons.
Anecdotally, some customers are starting to orient their panels further towards the west, possibly in response to lower FiTs which provide an incentive to export as little as possible. These incentives will be amplified with new cost-reflective tariffs, and so we would expect to see more panels facing west as these tariffs are implemented.
MEFL found that most panels were oriented appropriately so as to minimise shading.67 In some instances, overshadowing impacts were seen to have been dealt with very well. However, there
66 For example see http://www.yourhome.gov.au/energy/photovoltaic-systems 67 MEFL, Energy Consumers Australia – Experience of Solar Consumers, 10 October 2016, p7-191.

KPMG | 51
© 2016 KPMG, an Australian partnership and a member firm of the KPMG network of independent member firms affiliated with KPMG International Cooperative (“KPMG International”), a Swiss entity. All rights reserved. The KPMG name and logo are registered trademarks or trademarks of KPMG International.
Liability limited by a scheme approved under Professional Standards Legislation.
were five instances where shading was a problem. MEFL concluded that most of these issues could have been addressed by making changes to the system placement. In one instance, overshadowing resulted in performance of approximately 60% of what would have been expected for a system of its size.
5.3 Effectiveness of voluntary codes As discussed in section 2.3, there are a number of frameworks in place to help protect solar customers with solar PV systems. Of these, it is primarily the CEC’s industry codes that guide system design issues.
It is difficult to be conclusive about the effectiveness of these voluntary codes without a greater sample of site visits to ascertain the extent to which systems are being appropriately tailored to individual customers. From the small sample of site visits conducted by MEFL, there are instances where customers either have a system that is bigger than they need, or their system is not performing optimally due to shading issues. However, there do not appear to be any systemic issues.
The CEC’s System Design Guidelines impose requirements, amongst other things, to consider all shading issues, orientation and tilt, along with the system's site-specific energy yield. However, the guidelines do not appear to require the designer to consider the appropriate system size for the customer. This could be a useful addition.
Enforcement of compliance with the Accreditation Code is likely to be effective. The CEC has the power to remove an accreditation. The CEC has a demerit system whereby a total of 20 demerit points can be accrued within a 24 month period before accreditation is suspended. If a business loses its accreditation, it cannot provide customers with the STC. Consequently solar installers have an incentive to comply with the Accreditation Code and relevant Guidelines.
There is a risk that this mechanism may be less effective in the future if the government subsidy is removed, and so the business need to be accredited falls away. This issue may also arise with battery storage, if any accreditation scheme remains voluntary and there is no incentive in the form of a government subsidy to become accredited.
This is the case with the Solar Retailer Code of Conduct, which is voluntary and does not have the “hook” of the government incentive. Many solar PV retailers have chosen not to sign the Solar Retailer Code of Conduct. Of the ten solar retailers that installed the most rooftop PV systems in Australia in 2015 (based on quarterly volume of registered capacity), only one has signed the Solar Retailer Code of Conduct.68 This could cause two issues:
· customers that do not contract with a solar retailer that has signed the Solar Retailer Code of Conduct do not have access to the complaints mechanism managed by the CEC (although they would still have access to the other complaint mechanisms); and
· even if customers do have complaints about a CEC-accredited retailer, the Solar Retailer Code of Conduct is not enforceable in any meaningful way. While the CEC could remove the accreditation, it cannot impose any other penalties, such as financial penalties. Given the number of retailers that successfully operate without CEC accreditation, removal of this may not be viewed as a sufficient constraint on behaviour.
68 The top ten retailers as cited by Sunwiz, www.sunwiz.com.au are: True Value Solar; Euro Solar; Powerark Solar Pty Ltd; AGL Solar; SolarGain; Origin Energy; Advance Finance Solutions Pty Ltd; Green Engineering; Infinite Energy; and Country Solar Pty Ltd.

KPMG | 52
© 2016 KPMG, an Australian partnership and a member firm of the KPMG network of independent member firms affiliated with KPMG International Cooperative (“KPMG International”), a Swiss entity. All rights reserved. The KPMG name and logo are registered trademarks or trademarks of KPMG International.
Liability limited by a scheme approved under Professional Standards Legislation.
It is important to note that a solar retailer that has not signed the CEC’s Code of Conduct may still be operating consistently with the Code. Further, there may be a number of valid reasons why solar retailers have chosen not to sign the CEC’s Code of Conduct.

KPMG | 53
© 2016 KPMG, an Australian partnership and a member firm of the KPMG network of independent member firms affiliated with KPMG International Cooperative (“KPMG International”), a Swiss entity. All rights reserved. The KPMG name and logo are registered trademarks or trademarks of KPMG International.
Liability limited by a scheme approved under Professional Standards Legislation.
6 Installation Most customers appear to be satisfied with the installation process. There do not appear to be any systemic issues associated with sub-standard or unsafe installations and, based on a number of case studies, solar installers for the most part are installing the systems so as to maximise value to the customer, for example by avoiding panel shading.
This chapter sets out the findings from research related to a customer’s experience of the installation process itself, such as the time taken for installation and whether there were any issues with the safety or functioning of the installation. The findings draw on evidence from surveys and interviews conducted by UMR and MEFL, as well as audits undertaken by the CER.
6.1 Customer experience with installation UMR found that a significant majority of customers (87%) were satisfied to some degree with the installation process. Only 6% expressed a degree of dissatisfaction with the installation process.
Figure 10: Satisfaction with the installation process
How satisfied were you with the installation process?
Source: UMR Report.
A survey conducted by CHOICE found that 32% of owners reported having problems with their installer.69 The most common problem reported for installers was a significant delay with the installation work (12% of all solar customers). Major issues such as incorrect wiring or labelling and safety issues were uncommon.
69 Sheftalovich, Zoya, Which solar power system should you get?, 14 January 2015, available at www.choice.com.au

KPMG | 54
© 2016 KPMG, an Australian partnership and a member firm of the KPMG network of independent member firms affiliated with KPMG International Cooperative (“KPMG International”), a Swiss entity. All rights reserved. The KPMG name and logo are registered trademarks or trademarks of KPMG International.
Liability limited by a scheme approved under Professional Standards Legislation.
6.2 Quality and safety of installation 6.2.1 CER inspections The CER is required to inspect a statistically significant sample of installed systems each year for compliance with SRES eligibility criteria. This includes relevant standards related to electrical safety. The objective of the inspection program is to ensure that the increased installation demand resulting from Renewable Energy Target incentives does not lead to any reduction in installation standards.
The CER’s inspection reports are referred to state and territory electrical safety regulators as well as the CEC, in its capacity as the manager of accreditation of solar panel installers. If the CER inspector finds an unsafe system he/she is required under his/her electrical license conditions to render it safe. He/she is then required to notify all relevant parties of the extent and nature of the safety risk. Any follow-up is at the discretion of the state or territory regulator.
Figure 11 below shows the trends in the systems inspected that were considered safe, unsafe70 or substandard71 since monitoring began 2011. The results are presented on a cumulative basis. The chart shows that the proportion of unsafe systems has hovered around 4% since inspections began. The proportion of sub-standard systems has fallen.
Figure 11: Inspection trends
Source: CER, Inspections update No.14, February 2016, p3.
The majority of unsafe installations are attributed to water entry to direct current isolator switch enclosures. The majority of substandard installations are attributed to installers failing to ensure that all direct current wiring in the building is enclosed in heavy duty conduit
70 An unsafe system has a safety hazard which poses an imminent risk to a person or property. The inspector shuts down the system or renders it safe. The inspector also advises the relevant state or territory regulatory authority of the nature and extent of the safety risk. The system owner should contact the installation company or a qualified installer to rectify the items listed for improvement. 71 A substandard small-scale system does not meet key clauses in the standards and requirements for installation and may lead to premature equipment failure or other issues. The inspector advises the relevant state or territory regulatory authority of the nature and extent of the identified issues. The installation work and or equipment should be improved. The system owner should contact the installation company or a qualified installer to rectify the items listed for improvement.

KPMG | 55
© 2016 KPMG, an Australian partnership and a member firm of the KPMG network of independent member firms affiliated with KPMG International Cooperative (“KPMG International”), a Swiss entity. All rights reserved. The KPMG name and logo are registered trademarks or trademarks of KPMG International.
Liability limited by a scheme approved under Professional Standards Legislation.
The inspections program provides a source of information for electrical safety regulators and peak industry bodies to consider whether current standards and practices are adequate. To aid this, the CER publishes an annual analysis of the data collected from the inspection program.
As necessary, a committee is convened by the CER to discuss the results of previous inspections with state and territory electrical safety regulators and peak industry bodies. The committee may refer matters to Standards Australia where changes to standards are required. The committee may also refer issues to the CEC where their System Design Guidelines require updating.
Overall, it appears that the framework for escalating and resolving issues relating to sub-standard or unsafe installation practices appears to be working. There is no evidence from the CER inspections to suggest there are any systemic issues associated with installation practices. As discussed in the previous chapter, the CEC’s Accreditation Code of Conduct and System Design Guidelines appear to provide sufficient incentives to promote safe practices.
6.2.2 MEFL findings The CER audit results are consistent with MEFL’s site visits, which showed that in general there were no systemic failures in quality of installation. However, there were isolated examples of a lack of compliance plates on individual pieces of equipment and poor finishing on wiring.72
In respect of installation issues, MEFL considered the location of the inverter and quality of installation. Poor inverter placement can lead to a higher rate of decline in performance, which is an issue for consumers if this leads to faults which incur a replacement cost (out of warranty) and lost generation.
The majority of inverter placements were found to be appropriate, in that they were:
· out of direct sunlight;
· protected from rain;
· convenient to the switchboard; and
· appropriately located to allow for regular checking of status / performance.
There were two examples out of the 29 site visits where the placement of the inverter was suboptimal. The installer had opted to locate the inverter close to the switchboard for convenience. As a result, both inverters were in direct sunlight, diminishing the readability of the inverter, and they lacked rain protection. In some instances direct sun can cause seals to perish, resulting in water ingress to the inverter. As noted above, this appears to be one of the primary causes of unsafe systems in the CER inspections.
In general, MEFL found the site visits demonstrated good quality installation. However, there was at least one example of a lack of compliance plates on individual pieces of equipment and poor finishing on wiring. A lack of compliance plates may indicate that non-compliant components were used.
Other quality considerations such as irregularities in framing were occasionally observed by MEFL. However, they found no evidence to suggest poor quality work has led to any sub-standard performance or infrastructure fault.
Given the differing ages of installations visited, it is not possible to determine whether there was any non-compliance with the appropriate Australian Standard (AS5033) in place at the time. While some of the older systems would fail today’s standard, which mandates the use of conduits for wiring, this change to the standard did not occur until 2012.
72 MEFL, Energy Consumers Australia – Experience of Solar Consumers, 10 October 2016, p21.

KPMG | 56
© 2016 KPMG, an Australian partnership and a member firm of the KPMG network of independent member firms affiliated with KPMG International Cooperative (“KPMG International”), a Swiss entity. All rights reserved. The KPMG name and logo are registered trademarks or trademarks of KPMG International.
Liability limited by a scheme approved under Professional Standards Legislation.
7 Connect and commission Individual DNSP policies appear to be driving a number of outcomes for individual customers wanting to connect solar PV systems to the grid. First, the ease with which customers can obtain approval to connect to the network depends on the size of the system. This is resulting in some customers installing a smaller system than would best suit them to avoid the additional cost and challenges of seeking approval for a larger system.
Second, for larger systems that require network approval, the ability to connect is effectively on a “first come, first served” basis. Some networks have had to turn down applications due to system constraints. Customers that want to connect a larger system must wait until the network is augmented to install their system.
Network capacity could create an additional barrier to new solar customers. This may raise equity concerns, particularly where customers that have not yet installed solar PV have not done so because of financial barriers, or barriers due to renting or living in an apartment.
This chapter sets out the findings from research related to a customer’s experience of the grid connection process, including the ease with which a customer can gain approval to connect to the grid and, subsequently, the ease with which the connection takes place. In respect of the commissioning of the system, this chapter also considers customers’ experiences in having their system recognised by their retailer to reflect the FiT in their retail bill. The findings draw on evidence from interviews conducted by MEFL, as well as other published research where possible.
This chapter also considers the impact on potential solar PV customers of the limited capacity of networks to accommodate increasing penetration of solar PV.
7.1 Customer experience 7.1.1 Approval to connect The National Electricity Rules set out the requirements for connecting embedded generators, including solar PV, to the distribution network. This includes obligations on both DNSPs and the connecting party, from when an initial connection enquiry is lodged through to the acceptance of a connection offer. For basic connections, which includes a typical residential rooftop PV system, the DNSP must make an offer to connect using a model standing connection offer that has been approved by the AER.
Each DNSP has a threshold system size under which systems are automatically pre-approved for connection to the network. Over the threshold, customers must apply for pre-approval. This is so the DNSP can assess the impact on its network as well as on the quality of supply to other customers as a result of a larger system being connected. Typically this involves a desktop analysis by the DNSP.
The level of the threshold differs between DNSPs and also depends on the type of line a customer is connected to.

KPMG | 57
© 2016 KPMG, an Australian partnership and a member firm of the KPMG network of independent member firms affiliated with KPMG International Cooperative (“KPMG International”), a Swiss entity. All rights reserved. The KPMG name and logo are registered trademarks or trademarks of KPMG International.
Liability limited by a scheme approved under Professional Standards Legislation.
In Victoria, four of the five DNSPs have a threshold of 10kW, while AusNet Services has a threshold of 4.6kW. This may have led to some confusion for customers, particularly those on the edge of the AusNet Services network. Customers may intend to install a system greater than 4.6kW on the assumption that it will automatically be pre-approved, only to find that they actually need to seek approval.
Customers connected to Single Wire Earth Return (SWER) lines (typically in non-urban areas) may be subject to a lower kW threshold for automatic pre-approval and may have faced similar confusion.
As discussed in chapter 5, the threshold at which a DNSP will auto-approve a connection appears to have driven the size of the system installed in some instances. Anecdotal evidence suggests that some installers consider applying to the DNSP to obtain approval for a larger system difficult and costly, and they are not willing to take the risk that the DNSP will not approve the system.
On the other hand, DNSPs tell us that the majority of residential customers that apply for pre-approval have their applications approved for the system size that they applied for. Overall, a minority of customers are required to reduce their system size in order to connect, and a very small proportion are denied approval to connect. One DNSP told us that they do not reject many applications, and those that they do reject are generally for administrative, not technical, reasons.
MEFL only inspected one site where a system that was larger than 5kW had been installed, so they were not able to ascertain whether there were any particular issues associated with applying for pre-approval for larger systems.
However, research conducted by Newgate for the AEMC with a group of 66 customers across the NEM found that some customers have been told that the solar capacity in their area had been reached and so they could not connect.73 This issue is discussed in section 7.2 below.
7.1.2 Ease of connection and commissioning There is limited information on customer views of the connection process itself. However, many customers may not differentiate between the solar PV installation process and the grid connection process, particularly where the whole process goes smoothly and is organised by the solar provider.
In the interviews that MEFL conducted, they found that customers considered the connection and commissioning of the system was the second most difficult part of the process after deciding on the system. This was due to two factors:
· delays in distributor connection sign-off; and
· retail billing and commissioning coordination.
Although it was only a small sample, MEFL found that delays in achieving sign-off for connecting the system to the grid were more prevalent in Victoria than in NSW. This is despite almost all customers in Victoria having smart meters already installed, and so not requiring a meter change.
In Victoria it is difficult to determine which entity participating in the process is at fault for any delays. Once the system is installed an Energy Safe Victoria inspector is required to carry out an inspection, before the installer can lodge the necessary forms with the electricity retailer. The retailer then notifies the distributor to install the meter, if required. There could be delays at any point in this process, and it is not necessarily transparent to the customer where the delays have occurred.
73 Newgate Research, AEMC 2016 Retail Competition Review: New and Emerging Energy Technologies and Services, Consumer Research Report, June 2016, p35.

KPMG | 58
© 2016 KPMG, an Australian partnership and a member firm of the KPMG network of independent member firms affiliated with KPMG International Cooperative (“KPMG International”), a Swiss entity. All rights reserved. The KPMG name and logo are registered trademarks or trademarks of KPMG International.
Liability limited by a scheme approved under Professional Standards Legislation.
MEFL also found that, due to a number of entities being involved in coordinating the necessary paperwork, there was some degree of confusion regarding whose responsibility it is to lodge it with the retailer. This resulted in some customers missing out on higher FiTs.
A Victorian customer was assured of the transitional feed-in-tariff and was told that his system install had ‘made the cut-off date’. When he still wasn’t receiving a solar feed in on his first bill he enquired and found a paper trail gap - the solar provider claimed he sent the paperwork but it was never received.
MEFL found that some customers are not gaining the full value of their systems due to delays in their retailer recognising their system. This appeared to be predominantly an issue with smaller retailers. Of the 74 interviews undertaken, nine rated their experience with their retailer as not enjoyable (the lowest rating). Of these, six were with smaller retailers. Conversely, the larger retailers, particularly Origin and AGL, had very little negative feedback.
7.2 Issues for future solar customers Outcomes and costs for potential solar customers are being driven in part by individual DNSP policies and network capacities, as well as decisions by existing solar customers. This is likely to raise equity concerns over time, as more customers seek to connect to networks that are at, or close to, their solar capacity. Many of the customers that have not yet installed solar PV have not done so because of financial barriers, or barriers due to renting or living in an apartment. Network capacity issues could present an additional barrier to these potential customers that was not experienced by earlier adopters.
To date, residential solar PV customers that are connected in the grid have primarily faced administrative costs, or costs associated with upgrading their meter or undertaking testing. Importantly, existing solar customers have not paid a fee for their use of the network to export solar generated from their system. While many solar customers consider this is reasonable on the basis that they are providing other benefits, it may present a growing issue for new solar customers.
While existing networks may be able to handle a certain penetration of solar PV, there is a limit at which the network cannot cope with additional solar PV without impacting the quality, reliability and security of supply of electricity to all customers. Some DNSPs have already had to turn down connection applications that require approval due to system constraints (although they suggest this is a minority) and, as discussed above, research suggests that some customers have been told that they cannot connect their system due to capacity limits in the system.
It is not clear how widespread and significant these issues currently are. Fourteen postcodes already have solar PV penetration of over 50% of households. In these areas it is likely to be increasingly difficult for new solar customers to connect their systems to the grid.
In some areas, the capacity of the network to manage solar installation may currently be lower than 50% of premises. In its most recent regulatory proposal, South Australia Power Networks (SAPN) presented modelling by Power Systems Consultants that examined the impact of increasing penetration of embedded generation, including solar PV, on the quality of supply. The study found that, in the older areas of SAPN’s low voltage network, existing network infrastructure and voltage

KPMG | 59
© 2016 KPMG, an Australian partnership and a member firm of the KPMG network of independent member firms affiliated with KPMG International Cooperative (“KPMG International”), a Swiss entity. All rights reserved. The KPMG name and logo are registered trademarks or trademarks of KPMG International.
Liability limited by a scheme approved under Professional Standards Legislation.
regulation approaches limit the acceptable level of solar PV penetration to around 25% of customers.74
On the other hand, Ausgrid has recently announced plans to streamline the application process for solar PV and battery systems up to 30kW.75 The new application process will remove the requirement for a more detailed technical assessment of systems sized from 5-10kW for single phase connections. Both the fees and time associated with the application process are intended to be reduced.
In the current context of low FiTs, customers that are installing systems for financial reasons ought to be sizing the system to match their daytime consumption. Therefore smaller households in urban areas should still be able to connect a system that suits them financially with automatic pre-approval. These issues are more likely to affect customers with large daytime loads or that want to install larger systems for environmental reasons.
In regional and rural areas where customers are more likely to be connected to SWER lines with lower thresholds for auto-approval, a higher proportion of customers are likely to be affected.
In both urban and rural areas these issues will continue to grow as solar PV penetration rates increase. There is a possibility that DNSPs could seek to recover the costs associated with managing their network to allow for increased solar PV on a cost reflective basis. That is, future solar PV customers may face additional costs that existing customers have not had to pay to connect to the network. Again, this creates equity issues in the context of where future solar customers may have lower incomes or have faced other barriers to connecting solar PV.
74 SAPN, Regulatory Proposal 2015-2020, December 2013, p215. 75 Ausgrid, Ausgrid to cut fees and fast-track solar and battery applications, 27 July 2016, available at http://www.ausgrid.com.au/solarfasttrack

KPMG | 60
© 2016 KPMG, an Australian partnership and a member firm of the KPMG network of independent member firms affiliated with KPMG International Cooperative (“KPMG International”), a Swiss entity. All rights reserved. The KPMG name and logo are registered trademarks or trademarks of KPMG International.
Liability limited by a scheme approved under Professional Standards Legislation.
8 Customer outcomes We found that residential customers are generally satisfied with the performance of their solar PV system. The majority of customers consider their system is performing about as well as expected or better. Similarly, most customers are satisfied with the impact that their system has had on their retail electricity bills.
However, evidence suggests that many customers do not understand the detail of how their system works or how they can maximise the value of their system. Knowledge of warranties is low, and some customers are incurring unnecessary costs associated with cleaning and maintaining their systems. Instances have been identified where customers were satisfied with the performance of their system, yet inspection and testing revealed that the design, and therefore system output, was sub-standard.
Close to half of customers surveyed indicated that they had taken steps to use more energy when the sun is shining and/or less when it is not. This indicates that many customers are willing to modify their behaviour to maximise the value of their system. However, it is not clear that all customers have sufficient knowledge or understanding of how to do so. This is evidenced by the survey results which suggest that more than one in five customers did not know if the tariff they paid for mains electricity changed after they installed solar and were also not sure what FiT they were being paid. Without knowing these tariffs, they would not have the information to determine how to change their consumption in order to minimise the payback period for their system.
This chapter sets out our findings relating to overall outcomes for customers and the extent to which their expectations about their solar PV systems are being met. The findings draw on evidence from surveys and interviews conducted by UMR and MEFL, as well as from other published research where available.
The chapter also considers the impact that having a solar PV system has had on customers’ behaviour.
8.1 System performance 8.1.1 Most customers are satisfied with system performance The majority of customers surveyed by UMR thought their system performed about as well as they had expected or better. However, twelve per cent felt their system performed a little worse or much worse than they expected.
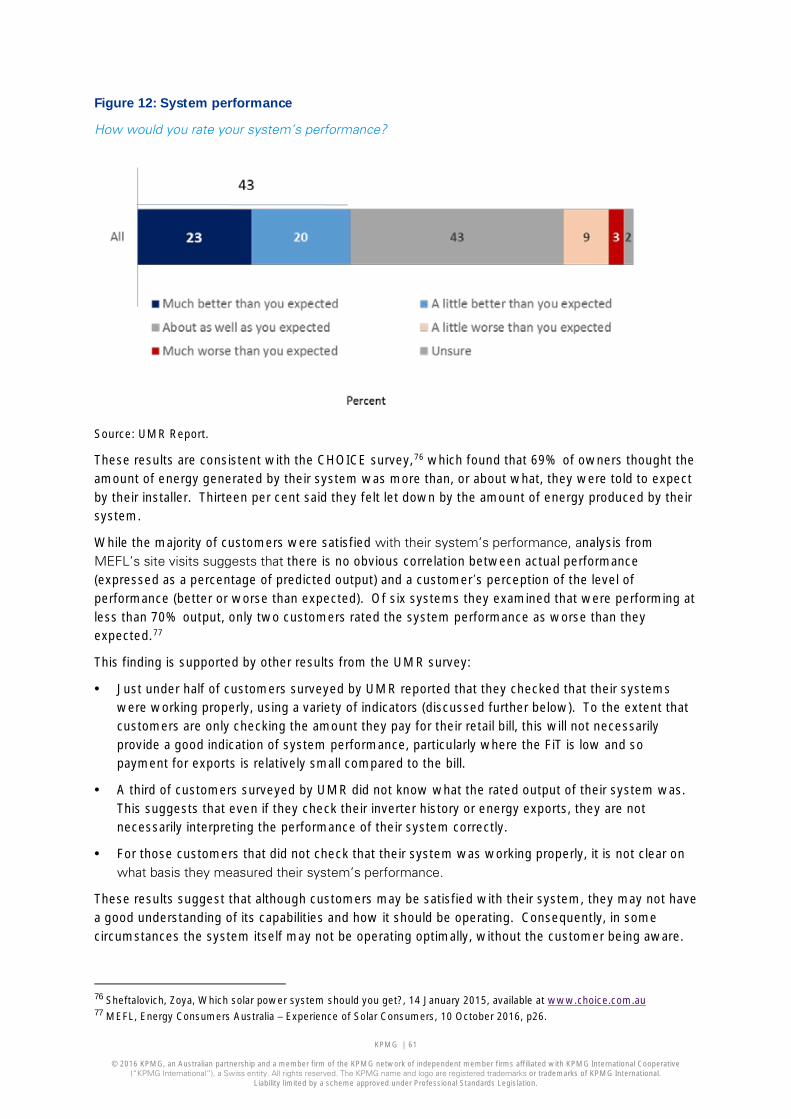
KPMG | 61
© 2016 KPMG, an Australian partnership and a member firm of the KPMG network of independent member firms affiliated with KPMG International Cooperative (“KPMG International”), a Swiss entity. All rights reserved. The KPMG name and logo are registered trademarks or trademarks of KPMG International.
Liability limited by a scheme approved under Professional Standards Legislation.
Figure 12: System performance
How would you rate your system’s performance?
Source: UMR Report.
These results are consistent with the CHOICE survey,76 which found that 69% of owners thought the amount of energy generated by their system was more than, or about what, they were told to expect by their installer. Thirteen per cent said they felt let down by the amount of energy produced by their system.
While the majority of customers were satisfied with their system’s performance, analysis from MEFL’s site visits suggests that there is no obvious correlation between actual performance (expressed as a percentage of predicted output) and a customer’s perception of the level of performance (better or worse than expected). Of six systems they examined that were performing at less than 70% output, only two customers rated the system performance as worse than they expected.77
This finding is supported by other results from the UMR survey:
· Just under half of customers surveyed by UMR reported that they checked that their systems were working properly, using a variety of indicators (discussed further below). To the extent that customers are only checking the amount they pay for their retail bill, this will not necessarily provide a good indication of system performance, particularly where the FiT is low and so payment for exports is relatively small compared to the bill.
· A third of customers surveyed by UMR did not know what the rated output of their system was. This suggests that even if they check their inverter history or energy exports, they are not necessarily interpreting the performance of their system correctly.
· For those customers that did not check that their system was working properly, it is not clear on what basis they measured their system’s performance.
These results suggest that although customers may be satisfied with their system, they may not have a good understanding of its capabilities and how it should be operating. Consequently, in some circumstances the system itself may not be operating optimally, without the customer being aware.
76 Sheftalovich, Zoya, Which solar power system should you get?, 14 January 2015, available at www.choice.com.au 77 MEFL, Energy Consumers Australia – Experience of Solar Consumers, 10 October 2016, p26.

KPMG | 62
© 2016 KPMG, an Australian partnership and a member firm of the KPMG network of independent member firms affiliated with KPMG International Cooperative (“KPMG International”), a Swiss entity. All rights reserved. The KPMG name and logo are registered trademarks or trademarks of KPMG International.
Liability limited by a scheme approved under Professional Standards Legislation.
MEFL also found that a customer’s source of advice was important in shaping a customer’s expectations about the performance of their system. The highly engaged customers that undertook independent research generally had a more realistic expectation about the performance of, and financial return on, their system. In contrast, customers that relied on friends and neighbours for advice were more likely to have an unreasonable expectation of performance and financial return.
Some of the confusion may have arisen where advice was taken from customers who were on a premium or transitional FiT and were not aware that those FiTs were no longer available when they installed their system.
8.1.2 Impact on retail bills Most customers that responded to the UMR survey thought their retail bills had changed by the amount they had expected or better. Fifteen per cent thought the change in their retail bills was a little or much worse than expected.
Figure 13: Rating retail bill changes
How would you rate the amount your bills changed as a result of installing your solar electricity system?
Source: UMR Report.
These results are consistent with a survey recently conducted by Solar Citizens, which found that 89% of Solar Citizens members that have solar panels are satisfied their system is saving them money by reducing their electricity bills.78 Fifty-six per cent claimed to have more than halved their annual electricity bills.
Research conducted by Newgate for the AEMC found that customers with solar panels felt some frustration at the reducing rebates especially more recent entrants, since it extends the payback period for the panels. However, they were still satisfied with their decision to install solar PV due to the environmental benefits.79
78 http://www.solarcitizens.org.au/solar_census_results_2016 79 Newgate Research, AEMC 2016 Retail Competition Review: New and Emerging Energy Technologies and Services, Consumer Research Report, June 2016, p30.

KPMG | 63
© 2016 KPMG, an Australian partnership and a member firm of the KPMG network of independent member firms affiliated with KPMG International Cooperative (“KPMG International”), a Swiss entity. All rights reserved. The KPMG name and logo are registered trademarks or trademarks of KPMG International.
Liability limited by a scheme approved under Professional Standards Legislation.
The view that the environmental benefits remain even as financial benefits reduce was echoed in the MEFL research. Many customers in Victoria and NSW were aware that their FiT would reduce at the end of 2016 but had not thought through the impact on their bills. One customer noted:
“I’m aware that we’ll lose the transitional tariff at the end of the year, but given we have had the system for nearly five years we are satisfied that we’ve made a good dent in the initial investment by now – and the environmental benefit is unchanged”
Consequently, negativity around the reduction in FiTs appears to be a reflection of the external policy environment rather than any issue with the performance of the systems themselves.
8.1.3 Issues with faults and warranties A number of customers have had issues with their solar PV systems not working. The most common problem has been with the inverter, although issues with the panels appear to be becoming increasingly prevalent. Most customers have been able to have their systems repaired under warranty at no, or limited, cost. However, most customers do not have a good sense of how long the various warranties on their systems are for.
The UMR survey found that 28% of customers had experienced one or more problems or faults with their system. Of those that experienced a fault, 50% of these were attributed to the inverter not working. These results are consistent with the Choice survey, which found that 25% of owners reported having had problems with their solar PV system. Again, the most common issue was that the inverter stopped working. Choice found that 10% of survey respondents had to replace their inverter since installation.
Figure 14: Occurrence and cause of faults
Have you ever had a problem or fault with your solar electricity system, where you needed professional assistance?
Source: UMR Report.

KPMG | 64
© 2016 KPMG, an Australian partnership and a member firm of the KPMG network of independent member firms affiliated with KPMG International Cooperative (“KPMG International”), a Swiss entity. All rights reserved. The KPMG name and logo are registered trademarks or trademarks of KPMG International.
Liability limited by a scheme approved under Professional Standards Legislation.
What was the most recent fault?
Source: UMR Report.
MEFL’s research also backs up the finding that the inverter is most likely to be at fault when systems are not working properly.
While problems with the inverter remain the most common source of faults, systems installed more recently are proportionally more likely to have a problem with the panels themselves.
Figure 15: Cause of faults
What was the most recent fault (by year of installation)?
Source: UMR Report.
Close to 80% of customers that reported a fault were still covered by a warranty. Most of these customers did not have to pay any costs associated with fixing the fault. However, some customers had to pay a fee for the technician’s visit. This suggests that the majority of customers that have known problems with their systems are able to address these issues under existing customer protection frameworks.
Many customers are not aware of, or incorrectly report, the length of the warranties on their panels and inverters. This contributes to concerns that customers have a limited understanding of the details of their systems. A quarter to a third of respondents to the UMR survey were not sure how long the warranty on their panels or inverter were. Forty-one per cent of respondents thought their panel warranty was for ten years or less, even though all panels have a minimum of a 15 year warranty. Forty-five per cent of respondents thought their inverter warranty was 5 years or less. This could result in customers paying for the system to be fixed themselves, even where it should be remedied under warranty.
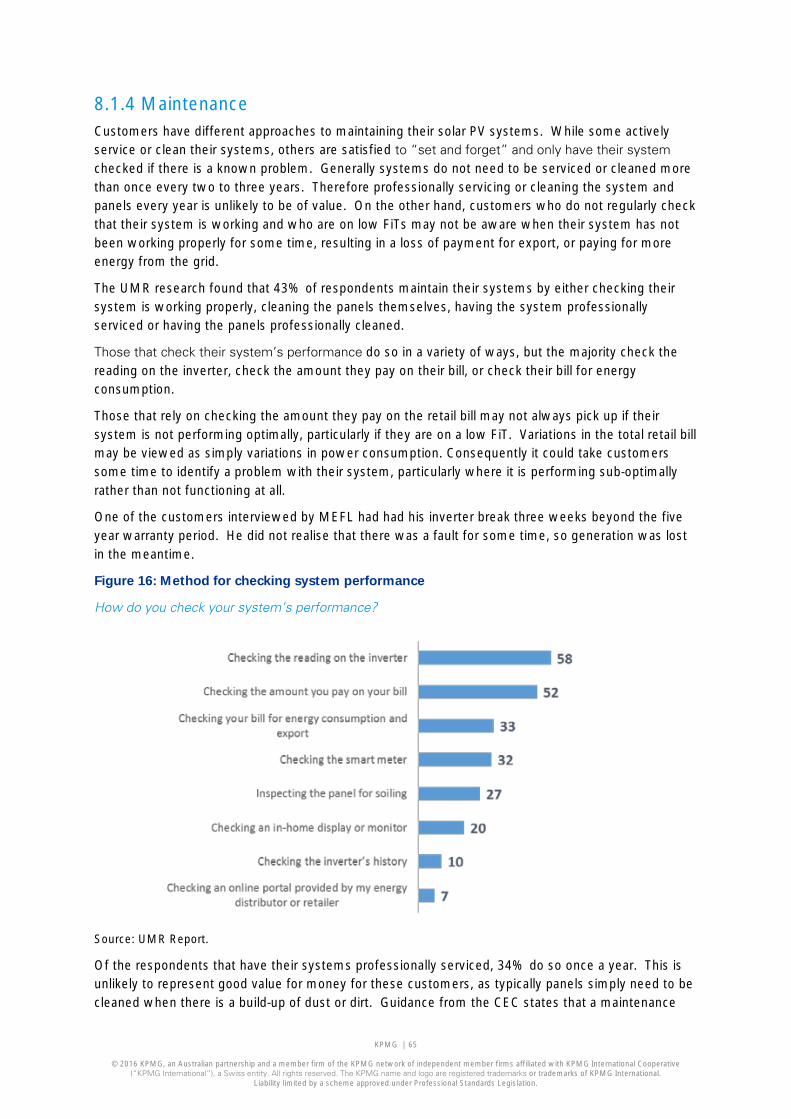
KPMG | 65
© 2016 KPMG, an Australian partnership and a member firm of the KPMG network of independent member firms affiliated with KPMG International Cooperative (“KPMG International”), a Swiss entity. All rights reserved. The KPMG name and logo are registered trademarks or trademarks of KPMG International.
Liability limited by a scheme approved under Professional Standards Legislation.
8.1.4 Maintenance Customers have different approaches to maintaining their solar PV systems. While some actively service or clean their systems, others are satisfied to “set and forget” and only have their system checked if there is a known problem. Generally systems do not need to be serviced or cleaned more than once every two to three years. Therefore professionally servicing or cleaning the system and panels every year is unlikely to be of value. On the other hand, customers who do not regularly check that their system is working and who are on low FiTs may not be aware when their system has not been working properly for some time, resulting in a loss of payment for export, or paying for more energy from the grid.
The UMR research found that 43% of respondents maintain their systems by either checking their system is working properly, cleaning the panels themselves, having the system professionally serviced or having the panels professionally cleaned.
Those that check their system’s performance do so in a variety of ways, but the majority check the reading on the inverter, check the amount they pay on their bill, or check their bill for energy consumption.
Those that rely on checking the amount they pay on the retail bill may not always pick up if their system is not performing optimally, particularly if they are on a low FiT. Variations in the total retail bill may be viewed as simply variations in power consumption. Consequently it could take customers some time to identify a problem with their system, particularly where it is performing sub-optimally rather than not functioning at all.
One of the customers interviewed by MEFL had had his inverter break three weeks beyond the five year warranty period. He did not realise that there was a fault for some time, so generation was lost in the meantime.
Figure 16: Method for checking system performance
How do you check your system’s performance?
Source: UMR Report.
Of the respondents that have their systems professionally serviced, 34% do so once a year. This is unlikely to represent good value for money for these customers, as typically panels simply need to be cleaned when there is a build-up of dust or dirt. Guidance from the CEC states that a maintenance

KPMG | 66
© 2016 KPMG, an Australian partnership and a member firm of the KPMG network of independent member firms affiliated with KPMG International Cooperative (“KPMG International”), a Swiss entity. All rights reserved. The KPMG name and logo are registered trademarks or trademarks of KPMG International.
Liability limited by a scheme approved under Professional Standards Legislation.
schedule should be provided by the installer of a solar PV system. However, there does not appear to be much independent guidance available on how best to maintain a system.
8.1.5 Panel shading by new buildings While systems can be designed to avoid expected panel shading, situations have arisen where, following installation, a customer’s panels have subsequently been shaded due to new building construction.
This issue relates to local planning laws and requirements and therefore a detailed analysis of this issue is beyond the scope of this report. However, it is important that potential customers are aware that this situation could occur when evaluating the benefits of solar PV for them, and the potential effects of shading as a result of new construction or building modifications.
8.2 Impact on customer behaviour As discussed in chapter 3, customers have a financial incentive to adjust the way in which they use electricity to maximise the value of their solar PV system. The time at which they should consume the most energy will depend on the relative values of their FiT and their retail tariff. The structure of these tariffs, for example whether they change with the time energy is used, will also influence the optimum time to maximise energy consumption and creates an additional layer of complexity for customers.
For those customers with a relatively low FiT, maximising value requires consuming energy during the day so as to minimise the amount of energy that is exported. Forty-two per cent of customers surveyed by UMR said they have taken steps to use more energy when the sun is shining and/or less when it is not. UMR analysis found that those customers who are more likely to change their behaviour:
· installed their systems later, which is consistent with having a lower FiT;
· considered that solar generation was an important factor for moving into their house; and
· had experienced more than one fault.
For the 49% that had not taken such steps, this could be because they:
· were on a premium FiT and therefore it would not make financial sense to do so;
· did not think that the financial benefits outweighed the inconvenience; or
· were not aware of how they could change their energy consumption behaviour to maximise the value of the solar PV system.
The remaining 9% were unsure of whether they’d taken steps to use more energy when the sun is shining and/or less when it is not.
Of the customers that MEFL interviewed, approximately 60% had changed their energy behaviour in some way to maximise their financial return.80 Some customers, while aware of the financial benefits, considered these benefits too marginal to warrant changing their lifestyles.
As discussed in section 8.1.1, those customers that were advised by friends or family on premium FiTs to install a solar PV system were more likely to have unrealistic expectations about the
80 MEFL, Energy Consumers Australia – Experience of Solar Consumers, 10 October 2016, p28.

KPMG | 67
© 2016 KPMG, an Australian partnership and a member firm of the KPMG network of independent member firms affiliated with KPMG International Cooperative (“KPMG International”), a Swiss entity. All rights reserved. The KPMG name and logo are registered trademarks or trademarks of KPMG International.
Liability limited by a scheme approved under Professional Standards Legislation.
performance of their systems, where their systems were installed following the reduction in FiTs. These customers are also at risk from not understanding how to adjust their consumption behaviour to maximise the value of their system.
For example, two neighbours could have exactly the same solar PV system but have very different consumption incentives where they are on different FiTs rates. One could be incentivise to shift their consumption towards the evenings (i.e. on premium FiT) and the other customer faces a completely different incentive to shift consumption towards the day time (i.e., on market FiT). Ultimately, for customers that do not know what retail and FiTs they are on, or that do not understand how the systems work, they could be increasing the payback time for their systems as they do not how to make change their consumption pattern to maximise the value of their installation.
There is some evidence to suggest this may be the case for a number of customers. The UMR survey results suggest there is some confusion about both retail and feed-in tariffs, which makes it difficult for customers to respond appropriately. A third of customers did not know if the tariff they paid for mains electricity changed after they installed a solar PV system.
Another third of survey respondents were unsure which FiT they were on. One fifth of customers did not know either whether their retail tariff had changed, or their FiT. This suggests that there is a substantial proportion of customers that do not have the information required to maximise the value of their solar PV system value.

KPMG | 68
© 2016 KPMG, an Australian partnership and a member firm of the KPMG network of independent member firms affiliated with KPMG International Cooperative (“KPMG International”), a Swiss entity. All rights reserved. The KPMG name and logo are registered trademarks or trademarks of KPMG International.
Liability limited by a scheme approved under Professional Standards Legislation.
9 Market outcomes Historically, potential network benefits have not been signalled to solar PV customers when they make decisions that influence network costs, such as the orientation of the panels and the time at which a customer is incentivised to export versus consume electricity. Rather, investment in solar PV and incentives on customers to shift their consumption to different times of day has been driven by factors other than alleviating network congestion, including the level and structure of feed-in tariffs relative to retail tariffs. Specifically, under premium net feed-in tariffs, customers have had an incentive to maximise their export throughout the day, rather than in the evening when the network is most under stress.
This disconnect between the solar PV market and the electricity market means that the wider benefits of solar PV have only partially been captured. To date, on the whole, there has not seem to been a material reduction in peak demand across the distribution networks, except in specific locations. While solar PV has resulted in a lower level of demand on some parts of some networks, this has not always resulted in lower infrastructure costs. In addition, DNSPs state that there are costs associated with managing the network impacts of high penetration of solar PV and the level of energy being exported.
Going forward, we expect incentives will become better aligned. Changes to feed-in tariffs through the cessation of the premium schemes are providing customers with incentives to consume, rather than export, their generation. Complementing this, DNSPs are required to better signal the costs of using their networks, including at different times of day. Together, these signals could provide solar PV customers with a more consistent set of incentives to shift their grid consumption away from times when there is the most stress on the distribution network. This may allow DNSPs to defer expenditure that would otherwise need to occur, reducing costs to all electricity customers.
This chapter sets out our findings relating to overall outcomes for the wider energy market, particularly on distribution network costs. It identifies the benefits and costs that have accrued, or are likely to accrue, to the wider market as a result of solar PV, noting that the network benefits and costs of solar PV are socialised across all electricity customers.
9.1 Distribution network benefits and costs 9.1.1 Potential benefits of solar PV to DNSPs Rooftop solar PV has the potential to provide benefits to the distribution network. These benefits primarily relate to avoided network expenditure where generation is able to alleviate network congestion at times of peak demand or through avoided line losses. This, in turn could reduce the tariffs charged by the DNSP, providing benefits to all electricity customers connected to the network.
The nature of the benefits provided by rooftop solar PV depends crucially on time, location and the local network conditions. For example, where there is existing excess network capacity, solar PV is unlikely to add significant value to the network. On the other hand, where solar PV generation coincides with peak demand in areas where the network would otherwise be stressed, network

KPMG | 69
© 2016 KPMG, an Australian partnership and a member firm of the KPMG network of independent member firms affiliated with KPMG International Cooperative (“KPMG International”), a Swiss entity. All rights reserved. The KPMG name and logo are registered trademarks or trademarks of KPMG International.
Liability limited by a scheme approved under Professional Standards Legislation.
benefits could arise by deferring the need to invest in additional network capacity. Similarly, greater reliance on solar PV could avoid the need to replace existing infrastructure on a like-for-like basis.
Figure 17 – Trend in Seasonal Peak Demand by region
Consequently the ability of rooftop solar PV to defer distribution network investment will depend on a number of circumstances and the impact of solar PV installation on peak demand will vary significantly by zone substation and network feeder. This makes the ability to forecast the uptake of solar PV at a granular level important and we note that AEMO continues to grow its expertise in this area through its annual National Electricity Forecasting Report.81
Additional benefits could also arise through grid support services (e.g. managing voltage, maintaining power quality) and maintaining network reliability and resilience through reducing expected unserved energy.82 Also solar PV systems, in aggregate, could increase cyclic ratings on substation transformers. By reducing the amount of zone substation load earlier in the day, solar PV will lower the operating temperature of transformers prior to facing peak loads later in the day. While technology exists that could help solar PV generation provide these benefits, it is not currently widespread. Further, the benefits are likely to be greater when combined with battery storage. This is discussed further in chapter 10.
81 The National Electricity Forecasting Report (NEFR) provides AEMO’s independent electricity consumption and maximum and minimum demand forecasts over a 20-year outlook period for the National Electricity Market (NEM) and each of the five NEM regions: New South Wales (including Australian Capital Territory), Queensland, South Australia, Tasmania, and Victoria. 82 In it is network value of distribution generation review the Essential Service Commission in Victoria has also noted that distributed generation may provide a further benefit in related to bushfire mitigation, for example in circumstances where deploying distributed generation in a remote area, and thereby enabling the linking network to be de-energised during high fire risk days.

KPMG | 70
© 2016 KPMG, an Australian partnership and a member firm of the KPMG network of independent member firms affiliated with KPMG International Cooperative (“KPMG International”), a Swiss entity. All rights reserved. The KPMG name and logo are registered trademarks or trademarks of KPMG International.
Liability limited by a scheme approved under Professional Standards Legislation.
9.1.2 Any distribution network benefits have only been partially realised There are two decisions by customers that will influence the extent to which their solar PV can contribute to the broader network benefits discussed above:
· the orientation of their panels; and
· the time at which solar customers consume, versus export, their solar generation.
Historically, potential network benefits have not been signalled to solar PV customers when making these decisions. Investment in solar PV has been driven by factors other than alleviating network congestion. Specifically, customers on gross and premium FiTs have had an incentive to maximise their export throughout the day and in particular times when the network is under greatest stress. The reasons for this behaviour are explained in chapter 3.
As a consequence, customers have typically faced their panels north to maximise the amount of time that their system is generating and exporting. However, if panels faced west, generation from rooftop solar PV is more likely to coincide with the distribution network’s maximum peak demand, which in most jurisdictions occurs on summer evenings.83 This would help alleviate stress on the network. This is shown in the figure below.
Figure 18 – Generation profile by panel orientation
Source: modelling provided by ATA
Some DNSPs are actively trying to encourage their customers to face their panels west. In their regulatory proposal for 2016-2020, AusNet Services proposed exploring options to encourage customers to re-orient their panels west using financial incentives. AusNet Services noted “facing panels west offers a tangible benefit in both reducing the evening peak and reducing the energy under the peak”.84 The program aims to target a 1,000kVA demand reduction which they estimate could be achieved through incentivising 1,700 customers to orient their solar panels westwards. AusNet estimated that this level of demand reduction would translate to a total cost reduction of $0.7m between 2019 and 2030.
83 Note that peak demand can occur at different times in different networks and so the optimum time for solar PV to be generating may differ in different parts of the network. 84 AusNet Services, p229.

KPMG | 71
© 2016 KPMG, an Australian partnership and a member firm of the KPMG network of independent member firms affiliated with KPMG International Cooperative (“KPMG International”), a Swiss entity. All rights reserved. The KPMG name and logo are registered trademarks or trademarks of KPMG International.
Liability limited by a scheme approved under Professional Standards Legislation.
Despite the historical misalignment of incentives, solar PV may have provided at least some benefits to distribution networks, however it is difficult to conclude on the magnitude of any benefits due to limited available quantitative evidence. Solar PV is treated as negative load for the purposes of forecasting demand. Consequently, where reduced forecast demand is identified as deferring network expenditure, it is difficult to distinguish how much of the value of the deferral is attributable to an increase in energy efficiency or other forms of energy reduction, fewer connections than forecast, or an increase in solar PV penetration.
However, in its 2015 Distribution Annual Planning Report, Energex highlights a number of factors that have contributed to declining demand growth. They note “Solar PV has also had a small but increasing influence in summer day peak system demand. Importantly, in comparison with prior years, decline in peak demand has resulted in network limitations being deferred…It has also resulted in reduced capital expenditure”.85
SAPN noted in its most recent regulatory proposal that solar PV does reduce network demand to some degree, but emphasised that this is only up until late afternoon and not reliably when there is cloud cover.86 It did not specifically link the reduced network demand to a deferral in capital expenditure.
Other DNSPs argue that increasing solar PV penetration has not contributed to a reduction in peak demand. For example, AusNet Services states that the timing of its network’s peak means that solar energy reduces the overall energy delivered, but does not reduce the demand peak.87 This may be predominantly due to solar panels facing northward. As discussed above, AusNet Services has proposed providing customers with a financial incentive to re-orient their panels to the west. Consequently, it must attribute some network value in solar PV, where the timing of the output better aligns with its network peak.
Some DNSPs have suggested that, to date, increases in solar PV penetration may have shifted the peak to later in the day, potentially without reducing it.88 To this extent this is the case, this may be an effect of current incentives on customers to export as much as possible during the day and so shift their consumption to later in the day. Further, as the peak occurs later in the evening, it becomes more difficult for solar PV to contribute to its reduction.
This was a finding in analysis prepared for the AEMC as part of the local Generation Network Credit Rule Change.89 AECOM stated that while solar PV is reducing peak demand during daylight hours, future uptake of solar PV will further shift most peak demand periods from daylight hours to the evenings. AECOM commented that once the peak period has been shifted outside of sunlight hours, solar PV is unable to provide further peak demand reduction. As discussed further below, this issue may be addressed to some extent by changing the consumption incentives faced by customers going forward.
While DNSPs generally acknowledge the potential benefits of solar PV in terms of reducing the severity of peak demand spikes, some are of the view that it does not do this sufficiently reliably due to the intermittent nature of solar PV. For example, Energex has noted that while it does factor in the
85 Energex, DAPRT 2015, p59. 86 SAPN, Regulatory Proposal 2015-20, 5 December 2013, p116. 87 AusNet Services, regulatory proposal, p16. 88 Analysis commissioned by the Energy Networks Association suggested that in some instances as more customers take up solar PV, the overall level of peak demand occurring in the evening can remain broadly the same. The analysis suggests that peak shifting has occurred in South Australia and Queensland, which are the regions with the highest solar PV penetration. See Frontier Economics, Valuing the impact of local generation on electricity networks, A report prepared for the Energy Networks Association (ENA), February 2015, p13-16. 89 AECOM – report to the Australian Energy Market Commission, Modelling the impact of embedded generation on network planning, 29 August 2016.

KPMG | 72
© 2016 KPMG, an Australian partnership and a member firm of the KPMG network of independent member firms affiliated with KPMG International Cooperative (“KPMG International”), a Swiss entity. All rights reserved. The KPMG name and logo are registered trademarks or trademarks of KPMG International.
Liability limited by a scheme approved under Professional Standards Legislation.
impact of solar PV into its demand forecasts and therefore the planning and development of its network, “due to the intermittent nature of solar PV, it cannot necessarily be relied upon for network planning purposes”.90
We note that while there is currently limited quantitative evidence of the benefits (or costs) of solar PV, a number of projects are underway or have recently been completed to develop frameworks to measure these benefits. Modelling conducted for Essential Services Commission (ESCV) as part of its review into the network value of distributed generation estimated that in 2017 the network benefits of solar PB systems provide a total of approximately $3m of network value in Victoria.91 The ESCV noted that this value is very dependent on location, asset life-cycle, the capacity of distribution generation and coincident timing of local generation to network peaks. This modelling was conducted at the zone sub-station level, and ESC found that out of a total 224 zone sub-stations in Victoria, only 6 had an estimated network value of more than $10 per solar kW, while the majority (164) having an estimated value of $0 or less than $1 per kW.
Further analysis on this matter is provided in:
· analysis conducted n as part of the AEMC’s rule change on Local Generation Network Credits (LGNC);
· a report by Frontier Economics on behalf of the Energy Networks Association in support of the ENA’s submission to the AEMC’s LGNC consultation paper; and
· a paper by Ernst & Young on behalf of the CEC as part of its Future Proofing in Australia’s Electricity Distribution Industry project.
9.1.3 Distribution network benefits may increase in future Frameworks have changed, or are in the process of changing, which will better align individual incentives with efficient market outcomes. Technology advances can improve the ability of solar PV installation to be optimised to provide network value. Also changes to government incentive schemes, combined with changes in network tariff structures, are now providing incentives for panels to be oriented west. Innovation in the design of FiTs could help this further.
Since 9 October 2016, accredited inverter systems must now meet an updated standard, AS/NZS 4777.2:20.92 The main updates to inverter standards allow distributed generation system to have the capability to provide services to the network. This includes further new voltage and frequency set-points and limits to be compatible with requirements of network businesses. The updated standards also require inverters to have Demand Response Mode (DRM) capabilities. DRM capabilities allow a remote operator to alter the inverter system to operate in a certain way, such as disconnecting from the grid, preventing generation of power, or increasing power generation.
These functionalities for new inverters make them distinct from older generation inverters, and have been referred to as “smart‟ inverters. They have the ability to make distributed generation more controllable and responsive to peak network demand – in other words, optimised for network value. Hence the potential network benefits could increase if such technology leads to greater controllability and responsiveness for networks from solar PV installations.
90 Energex, Letter to the Queensland Productivity Commission’s Solar Feed-in Pricing in Queensland: Draft Report, 15 April 2016, p2. 91 Essential Service Commission of Victoria, The Network Value of Distributed Generation – Distributed Generation Inquiry Stage 2 Draft Report, 15 November 2016, section 4. 92 Standards Australia 2015, Grid connection of energy systems via inverters - Inverter requirements, AS/NZS 4777.2:2015, October.

KPMG | 73
© 2016 KPMG, an Australian partnership and a member firm of the KPMG network of independent member firms affiliated with KPMG International Cooperative (“KPMG International”), a Swiss entity. All rights reserved. The KPMG name and logo are registered trademarks or trademarks of KPMG International.
Liability limited by a scheme approved under Professional Standards Legislation.
In relation to government incentive schemes, after 31 December 2016 only the ACT will have a legacy gross FiT, which no new customers can obtain. Further, in Victoria, NSW and South Australia, some of the premium FiT schemes will come to an end.93 For reasons discussed in chapter 3, this will provide solar customers with an incentive to align their consumption with their generation. For the majority of customers with consumption profiles that peak in the evening, this implies generating as much as possible in the evening.
Complementing this, once cost reflective tariffs come into place, networks will be able to better signal the times and areas where network costs are highest. This will provide solar customers with additional incentives to draw on their own generation at times when the network is under stress and, at least for new customers, face their panels west. We note that in their 2016 National Electricity Forecast, AEMO assumes that newly installed PV systems will begin to face west. This is in response to projected consumer incentives from peak prices during the evening.94
However, the extent of such improvements in incentives will be dependent on having meters capable of interval reading at the solar PV household. For those customers outside of Victoria, this may require additional costs. It may also depend on whether customers opt in to cost reflective tariffs, subject to the tariff arrangements in their jurisdiction. The extent of the potential savings in total bills from opting to move to cost reflective tariffs will depend on the customer’s consumption pattern and the design of the tariff options.95
Box 4: Sensitivity analysis on impact of non-performing installations
The typical asset life of an inverter component to a solar PV installation is 10 years. If a failed inverter is not replaced, then the installation will no longer be operational. There may be other reasons why a solar installation becomes non-operational, e,g., faults not addressed.
This creates a potential risk that over time a proportion of installation may become no longer operational and the customer does not have the financial ability or desire to fix the issue. This especially may be the case if feed in tariffs are low. It may also be possible that some customers will “set and forget” and not realise that their system is not fully functioning
We conducted some sensitivity analysis to assess the materiality of this potential risk on long term forecasts of solar PV generation. We modelled two scenarios: A. 1% of units become non-operational after 10 years; and B. 5% of units become non-operational after 10 years since installation. We found that the impact to be low with forecast energy output decreasing by 2% in 2025 under the 5% failure rate scenario. This is mainly due to the relatively small size of installation installed in the early years of the PV market.
9.1.4 Impact on costs There are a number of costs identified by DNSPs associated with high penetration of solar PV. While low uptake may not have a significant impact on the network, as the uptake of PV increases the impact on the network increases and can result in power quality and security issues. In particular, high penetration of solar PV can cause voltage deviations from the required standard, which has an 93 Payments under the NSW Solar Bonus Scheme ends on 31 December 2016. In South Australia, customers on a 16c/kWh FiT ceased receiving payments on 30 September 2016, but those on the 44c/kWh tariff will continue to receive payments until 30 June 2028. In Victoria, the transitional and standard FiT schemes end on 31 December 2016, but the premium scheme continues until 2024. See Appendix C for further details. 94 AEMO, National Electricity Forecasting Report, June 2016, p16 and 28. Based on advice from Jacobs, AEMO assumed a westerly shift in rooftop panel orientation, commencing from zero at the start of 2016–17 and resulting in 10% of capacity projections having a westerly panel orientation by 2035–36. 95 Any savings will also be net of the investment in metering costs plus any costs incurred in changing behaviour

KPMG | 74
© 2016 KPMG, an Australian partnership and a member firm of the KPMG network of independent member firms affiliated with KPMG International Cooperative (“KPMG International”), a Swiss entity. All rights reserved. The KPMG name and logo are registered trademarks or trademarks of KPMG International.
Liability limited by a scheme approved under Professional Standards Legislation.
impact on all customers. Managing these variations can require the installation of additional monitoring equipment, or equipment to manage the voltage changes.
For customers with solar PV, higher voltages can cause a customer’s system to disconnect automatically from the network, preventing the customer from exporting energy until the network voltage returns to normal levels. Low voltages can impact power quality for all customers, for example flickering lights. Voltages outside the required range can also cause damage to appliances and equipment.
High penetration of solar PV can also cause flows to reverse on a network feeder, when rooftop generation exceeds demand. This creates similar quality of supply challenges. Energex states that during daylight hours up to 13% of its distribution feeders operate in reverse due to PV installations.96
As discussed in chapter 7, consultants for SAPN found that in areas of SAPN’s low voltage network, the acceptable level of solar PV penetration is limited to around 25% of customers. Providing additional capacity for new solar customers would require augmentation to existing network infrastructure and changes to their voltage regulation approaches.
Some networks are trying to get consumers to change their behaviour to reduce pressure on the network by shifting their load to daytime. However, where a DNSP needs to augment its network, the costs of doing so falls on all electricity customers connected to that network.
For example, Energex estimates that $10million in operating expenditure will be incurred during 2015-20 relating to voltage investigations and re-balancing LV transformer circuits.97 In the same period Energex expects to incur approximately $24 million in capital expenditure for monitoring and remediation works relating to power quality issues caused by solar PV.
The costs of this expenditure is treated as a “standard control service” for the purpose of revenue recovery, meaning that is, all electricity customers face the costs incurred by the DNSP, irrespective of whether or not they have a solar PV system. To the extent that the costs incurred by DNSPs in managing increased solar PV currently outweigh the benefits, then this also contributes to the equity issues faced by potential customers that have not yet installed solar PV discussed in chapter 7.
Generally increased solar PV is leading to lower load factors98 through having a greater proportional impact on consumption volumes than on maximum peak demand levels. This is especially the case in Queensland, South Australia and Victoria. Lower load factors may create issues relating to the operation and utilisation of network assets.
9.2 Transmission network benefits and costs The addition of rooftop solar PV to the energy mix may also provide benefits further upstream, where reduced demand could reduce stress on transmission networks for similar reasons as discussed above. While the location of solar PV still has some importance for reducing stress on the transmission network, the effect is less strong since there is a greater level of aggregation on the transmission network. Further, the transmission network peak tends to occur earlier in the day when commercial businesses are operating.
96 Energex DAPR 2015-16 – 2019-20 volume 1 pii. 97 Energex, Response to Consultation Paper: National Electricity Amendment (Local Generation Network Credits) Rule 2015, 4 February 2016, p4. 98 “Load factor” refers to the extent to which the network is utilised.

KPMG | 75
© 2016 KPMG, an Australian partnership and a member firm of the KPMG network of independent member firms affiliated with KPMG International Cooperative (“KPMG International”), a Swiss entity. All rights reserved. The KPMG name and logo are registered trademarks or trademarks of KPMG International.
Liability limited by a scheme approved under Professional Standards Legislation.
ElectraNet has found that the high penetration of solar PV in South Australia has had some effect on maximum demand on the transmission network. In its most recent Annual Planning Report, ElectraNet noted that “Maximum demand has fluctuated due to the wide variation in heatwave conditions across different summers, but may indicate an overall declining trend.”99 This was based on analysis presented in the chart below.
Figure 19: Maximum, average and minimum demand on ElectraNet’s network
Source: ElectraNet, South Australian Transmission Annual Planning Report, June 2016.
However, ElectraNet does not specify whether the reduction in maximum demand has resulted in any tangible cost reductions to date, or whether it is likely to do so in the future.
ElectraNet also notes that the declining minimum demand increases the challenges of managing the high voltage transmission system, and that additional reactive plant100 is expected to be required.101
With incentives on customers now encouraging a shift away from exporting as much as possible during the day, transmission networks may lose some of the benefits that they have experienced to date from rooftop solar PV. Exports from residential solar customers have been contributing to meeting commercial load. Upstream, this may have been contributing to a reduction in transmission peak demand. By encouraging increased self-consumption, this reduces the amount of commercial load being met by rooftop solar, placing relatively more strain on the upstream transmission network.
However, any reduction in benefits for the transmission network associated with the change in use of residential rooftop PV may be counterbalanced by the anticipated increase in commercial rooftop solar PV.
99 ElectraNet, South Australian Transmission Annual Planning Report, June 2016, p17. 100 Reactive plant is required to provide voltage control in the event of voltage collapse. 101 ElectraNet, South Australian Transmission Annual Planning Report, June 2016, p8.

KPMG | 76
© 2016 KPMG, an Australian partnership and a member firm of the KPMG network of independent member firms affiliated with KPMG International Cooperative (“KPMG International”), a Swiss entity. All rights reserved. The KPMG name and logo are registered trademarks or trademarks of KPMG International.
Liability limited by a scheme approved under Professional Standards Legislation.
9.3 Wholesale Market and system security The penetration of solar PV installation will also have an impact on the wholesale market and generators’ revenue through the impacts on both maximum demand and minimum demand. Increasing growth in solar PV capacity could have a material impact on generator profitability and investment signals which in turn could impact system reliability and security.
In its 2016 National Electricity Forecasting Report (NEFR), AEMO reported that maximum demand over the next 20 years is expected to remain flat in NSW and Tasmania, increase in Queensland and decrease in Victoria and South Australia. It noted that the key drivers for these forecast changes in maximum demand is the balance between continuing improvements in energy efficiency and uptake of rooftop PV, offsetting demand growth in grid-supplied electricity from the increased use and capacity of cooling appliances plus potentially the increasing use of electric devices.102
In the 2016 NEFR, AEMO also discussed the impact on minimum demand caused by the expected increase in installed solar PV capacity. Minimum demand refers to the lowest electricity demand that is expected in any measured time period.
AEMO commented that while minimum demand for electricity is forecast to remain flat for five years across the NEM region, there is the potential for a rapid reduction in the last half of the forecast period driven by forecast increases in rooftop PV. By the mid-2020s, when the effective installed capacity (after allowing for the lower efficiency of aged panels) of rooftop PV across the NEM is forecast to reach 11 GW, AEMO expects that minimum demands will start to shift to midday when the sun is strongest and directly overhead, which is already the case in South Australia. AEMO notes that this may create challenges for the operation of large thermal generators, which must be constantly running, and for the provision of frequency control services.
This impact is likely to be strongest in South Australia. In 2014–15, South Australia recorded an operational minimum demand of 790 MW at 13:30 on 26 December 2014, South Australia’s lowest operational demand since NEM commencement and lower than any evening demand in South Australia. At this time, rooftop PV output was 445 MW. Based on the continued uptake of rooftop PV and its contribution to supply, by 2023–24, rooftop PV is expected to offset 100% of demand generated from the grid in South Australia. AEMO is investigating this impacts and the possible consequences of such an event on system security and reliability.
Figure 20 shows the extent of the decreases expected in minimum demand for NSW, South Australia, Queensland and Victoria.103
102 AEMO, National Electricity Forecasting Report, June 2016, p.5 and 6 103 AEMO National Electricity Forecasting Data – Operational neutral min demand for summer. Data available from AEMO website.

KPMG | 77
© 2016 KPMG, an Australian partnership and a member firm of the KPMG network of independent member firms affiliated with KPMG International Cooperative (“KPMG International”), a Swiss entity. All rights reserved. The KPMG name and logo are registered trademarks or trademarks of KPMG International.
Liability limited by a scheme approved under Professional Standards Legislation.
-1,000
0
1,000
2,000
3,000
4,000
5,000
6,000
Figure 20 - Forecast trends in minimum demand 2015 to 2036 (MW)
NSW QLD SA VIC

KPMG | 78
© 2016 KPMG, an Australian partnership and a member firm of the KPMG network of independent member firms affiliated with KPMG International Cooperative (“KPMG International”), a Swiss entity. All rights reserved. The KPMG name and logo are registered trademarks or trademarks of KPMG International.
Liability limited by a scheme approved under Professional Standards Legislation.
10 Future developments The combination of battery storage and solar installation at the residential level will lead to greater flexibility for customers and also increased complexity in the decisions that they face. Energy storage systems are both more technically and economically complex than solar PV systems, and customers face more decisions on how to operate battery storage.
Providing reliable and accurate information that is easy to access and understand will be important to help solar customers consider their options with respect to battery storage. This includes whether to purchase batteries, and also to help them evaluate how best to use and integrate battery storage into their decisions relating to energy. This will need to be coupled with appropriate consumer protections.
Modelling conducted by the Alternative Technology Association (ATA) found that for many solar PV customers, investing in batteries will not become cost effective until after 2020 when payback periods will be less than the assumed 10 years asset life for the battery and inverter. This applies for customers either retro-fitting battery systems or investing in new solar-battery combination systems. ATA also found that the financial viability of solar-battery combinations varies greatly across different jurisdictions and customer consumption profiles, and is sensitive to how the customer intends to charge and discharge the battery.
The value proposition of installing batteries will be unique to each customer as it will depend greatly on a customer’s total consumption, the battery capability and the way they use electricity over a day. Even if the price of batteries falls as anticipated over the next decade, the additional investment in batteries may never make financial sense for some consumers.
Battery storage has the potential to contribute to market efficiency. The value of solar PV installations with battery storage as a measure to reduce system peak is less reliant on individual consumers’ abilities and preferences to actively shift consumption to align with solar PV output. An integrated solar PV and battery system will automatically help to dampen the contribution of residential consumption towards system peaks.
Battery integration therefore has the potential to improve the market efficiency impacts of existing residential solar PV. To achieve this, better alignment of individual decisions with market efficiency is essential. As the network tariff structure will influence the financial value of combining batteries with solar PV, current reforms to network tariffs may go some way to assisting with the efficient integration of battery storage, The effectiveness of these reforms at promoting the efficient integration of batteries will depend on a range of different factors, including the design of the network tariff structures, how well those tariff structures align with the battery management technology and preferences of customers, how retailers pass through the network tariff signal into the retail offer, as well as government policy.
A solar customer with a battery will have the incentive to opt for tariff structures where they can avoid the most charges that relate to the energy they use. The relative proportion of tariffs recovered through the fixed component is key as this component cannot be influenced by the operation of the solar-battery installation.
The current trends toward increasing fixed component to retail prices and having a higher fixed component to time of use/demand tariffs compared to flat consumption tariffs may impact on the

KPMG | 79
© 2016 KPMG, an Australian partnership and a member firm of the KPMG network of independent member firms affiliated with KPMG International Cooperative (“KPMG International”), a Swiss entity. All rights reserved. The KPMG name and logo are registered trademarks or trademarks of KPMG International.
Liability limited by a scheme approved under Professional Standards Legislation.
viability of investing in batteries. In addition, existing customers on premium feed in tariffs will lose payments if they combine batteries with their existing solar PV installation.
Current reforms to network tariffs may not necessarily promote increased uptake of battery storage. Network businesses, retailers and policy makers may need to consider whether additional incentives are required to promote efficient uptake of battery from the market perspective.
The battery storage market is in its infancy and further policy work is needed on a range of matters including regulation, standards and safety matters. It is important that this policy work draws on the lessons learned from addressing similar issues during the emergence and development of the solar PV market. For example, difficulties that have arisen at the interface between individual customers and the grid, as observed in the solar industry, are also likely to occur in the battery storage market. There does not appear, at this stage, to be a consistent framework to guide DNSPs in developing policies for grid-connected residential battery storage nor an accreditation framework for businesses installing batteries.
Providing customers with the tools and protections they need, as well as ensuring individual decision making is aligned efficient market outcomes, relies on multiple entities working together. Policy makers and industry should draw on the experience of, and lessons learned in, the solar PV industry to ensure that benefits from battery storage are realised by both customers and the broader market.
This chapter looks towards potential further developments in the solar PV markets, notably how the availability of battery storage at the residential level will impact on the use of solar PV. The chapter covers how this development will affect customers as well as impacting on the broader market, particularly DNSPs. This chapter summarises ATA’s research into battery storage and combination with solar PV installations. It also draws on evidence from surveys and interviews conducted by UMR and MEFL, as well as from other published research where available.
10.1 Integrating battery technology with solar
installations Technological advances, particularly in battery storage, are making storage devices cheaper and more accessible to a wider range of electricity consumers. Products are emerging which would enable residential customers to install and use storage “behind the meter”104 to manage their energy use. Major retailers, such as Origin and AGL, are now offering battery products which can be retro-fitted to existing solar PV installations.
The availability of batteries will change the economics of solar for residential customers. While these developments bring new choices for customers, they also bring new challenges. Financial trade-offs will become more complex to assess as customers consider the interactions between energy sourced from solar, the role of batteries and interaction with the grid. Customers will need tools and information to be able to make the right decisions for them about their energy use and how they combine solar generation with battery storage. This will need to be coupled with appropriate consumer protections.
104 That is, on the customer’s premises.

KPMG | 80
© 2016 KPMG, an Australian partnership and a member firm of the KPMG network of independent member firms affiliated with KPMG International Cooperative (“KPMG International”), a Swiss entity. All rights reserved. The KPMG name and logo are registered trademarks or trademarks of KPMG International.
Liability limited by a scheme approved under Professional Standards Legislation.
This section explores how battery storage creates new choices for solar PV customers and its impact on consumption behaviour. This analysis draws mostly on the ATA research and more detail is provided in its report. The section sets out the following decisions that the customer must make:
· whether the battery is charged only from the solar PV system, or whether it can also be charged via the grid;
· whether the economics of a solar PV system combined with battery storage makes sense for them and, if so:
o the appropriate size for the solar PV system; and
o the appropriate size for the battery.
The key choice regarding the integration of battery and solar is how the customer intends to charge the battery and whether charging will only be through electricity generated from the solar PV installation or if the customer wants the ability to also charge the battery from the grid. The flexibility to charge from the grid will create additional costs as it will require:
· smart communications systems to achieve alignment between solar production, battery charging and discharging, and importing from the grid. The design of this system may depend on the design of the retail tariff and the ability of the software and hardware to do charging/discharging optimisation; and
· either an “AC coupled” system – meaning that an additional battery-dedicated inverter-charger is required to control the system and communicate with the existing solar inverter – or an inbuilt AC to DC charger which can allowed a DC coupled arrangement to be charged from the grid.105
This choice applies equally to customers with existing PV installations and those customers considering purchasing a battery and solar combined installation.
It is expected that initially the majority of battery and solar combinations at the residential level will be “DC coupled”, which means that the battery can only be charged through the solar installation.106
As explained in chapter 3, financial returns from the solar PV system are maximised when the solar customer is able to consume as much of its solar output as possible (assuming that the customer is not on a premium feed in tariff). This may be difficult given that for north-facing panels, maximum output will during the middle of the day and a customer residential peak tends to be around evening time. In addition, for a majority of customers there will only be a proportion of consumption which a customer can easily shift between periods.
The value of battery storage is therefore that it removes the need for customers to have to actively align their consumption behaviour with their solar PV output in order to maximise financial returns. The battery will enable the customer to consume its solar PV output whenever they want during the day.107 The savings achieved through investment in battery storage are therefore related to the difference between the variable component of the retail tariff and the lost revenue due to less export qualifying for the feed in tariff.108
The value of combining batteries with solar PV installations will depend on how the customer uses the storage capability, refer to as the battery management system. Battery utilisation will be a
105 AC coupling involves the battery being connected on the AC side (or the grid or household side) of the solar inverter – meaning the wires connecting the battery to the solar system are 240V AC. Given all batteries operate in DC, AC coupling requires a second battery-dedicated inverter (and battery charge controller) – which further adds to the cost of the overall system. 106 DC coupling involves siting the battery on the DC side of (or indeed plugging it directly into) the solar inverter. 107 Subject to the technical capability of the battery for charging and discharging. 108 This assumes that the feed in tariff is a net mechanism not a gross mechanism (see section 3). A gross scheme does not make any policy sense for a battery installation as there unlikely to be any exports.

KPMG | 81
© 2016 KPMG, an Australian partnership and a member firm of the KPMG network of independent member firms affiliated with KPMG International Cooperative (“KPMG International”), a Swiss entity. All rights reserved. The KPMG name and logo are registered trademarks or trademarks of KPMG International.
Liability limited by a scheme approved under Professional Standards Legislation.
function of the ability of a certain sized solar system (or the grid in AC coupling) to fully charge the battery to its rated capacity, as well as the consumption profile of the individual customer. Both of these involve significant variability as weather patterns change and the behaviour of households change over days, weeks and seasons.
In summary, the financial incentive on solar customer remains the same for solar and battery combined as for solar PV alone. That is, to maximise the volume of solar PV output which they are able to self-consume and to minimise net export to the grid (ignoring the possible different incentives if there is a time of use feed in tariff). The effect of installing certain battery storage systems is to allow customers to “set and forget” and not have to adapt their lifestyle in order to maximise the value of their solar PV system.
Hence for residential customers, their daytime load profile influences the value to them of investing in battery storage. A solar PV without storage offers the greatest potential benefit where significant electricity consumption occurs during the daytime (i.e. during solar generation hours). A consistently high daytime load leads to solar generation being used directly on-site, leaving insufficient excess solar left to charge a battery for use in the evening and overnight. For such a customer, battery storage may offer little financial value.
By contrast, a load shape with lower daytime and higher evening and/or night-time consumption will realise greater benefits from a solar-battery combined system. As this is likely to be the typical consumption pattern for residential customers, integration of battery with solar installation could, in principle, improve the returns from solar for many customers.
In addition, the size of existing solar PV installation will impact on the value of battery storage as this determines the volume of electricity generated that can be stored. Early adopters of solar PV who have on average smaller installations, will have lower returns from batteries compared to customers who have installed solar more recently.
From a market efficiency perspective, battery storage integrated into existing solar PV will automatically help to dampen the contribution of residential consumption towards system peaks. This is because demand from these customers at the peak period can be served by discharging their battery instead of importing electricity from the grid. The value of solar PV installations as a measure to reduce system peak is less reliant on individual consumers’ abilities and preferences to actively shift consumption to align with solar PV output.
One other issue to consider with respect to consumer choice and battery solar integration is the sizing of the solar PV installation. However it is not straightforward to assume that with a battery a customer should maximise the size of its solar PV system. The optimal size of solar PV from a financial perspective relates to:
· the average daily consumption at the premises; and
· whether the incremental cost of a system size that is larger than the average daily consumption is less than the value earned through exporting surplus electricity (either through the feed in tariff or potentially in the future, selling to neighbours through a peer to peer transaction).
Likewise in regard to the size of the battery, a bigger capacity does not necessarily mean higher returns. Ideally, the customer should be installing a battery which has a reasonably high utilisation rate over the course of the year.109 Therefore the size should be related to the net volume of solar PV output which is not consumed at the time of being generated and which will be used by the consumer later in the day.
The tariff structure for the customer will also affect the financial viability of investing in battery storage. On the one hand, a customer should, in principle, have greater rewards from investing in
109 Average daily discharge of the battery (on an annual basis) as a percentage of its useable capacity.

KPMG | 82
© 2016 KPMG, an Australian partnership and a member firm of the KPMG network of independent member firms affiliated with KPMG International Cooperative (“KPMG International”), a Swiss entity. All rights reserved. The KPMG name and logo are registered trademarks or trademarks of KPMG International.
Liability limited by a scheme approved under Professional Standards Legislation.
battery storage under a demand tariff or a time varying tariff as compared to being under a flat tariff. This is because a battery should, for most customers, enable them to reduce net consumption at peak times and reduce maximum demand.
However, on the other hand, this will also depend on the fixed component (i.e. standing charge) to the various tariff structures. A higher proportion charged through the fixed component will decrease the viability of battery storage, as the battery cannot be used to reduce this cost. Evidence in Australia points towards DNSPs increasing their fixed charges and higher fixed charges for time of use and demand based tariffs compared to flat tariffs. This trend may limit the financial viability of solar-battery installations.
Further, the fixed component to retail tariffs vary depending on retailers and the state or territory in which they are operating. Fixed component charges as a percentage of total retail prices are the highest in Victoria, comprising on average 26 per cent of the representative consumer’s bill, compared to 15 to 20 per cent in other jurisdictions.110 Hence the financial viability will differ across jurisdictions. This is discussed further in section 10.2.
The economics for a customer investing in a solar-battery system will depend on a wide range of different factors, including:
· the level and structure of retail tariffs;
· the size of the battery compared to both the solar PV output and the consumption of the household;
· the battery management strategy employed by the customer;
· the weather pattern prior to and during peak periods (as this will determined the stored energy in the battery);
· the household’s daily consumption profile;
· the relative difference between the feed in tariff rate and the retail consumption rate;
· whether the customer is on a premium feed in tariff; and
· whether the battery can be charged also from the grid.
For customers who decide to opt for a battery configuration which also allows charging from the grid, they also need to factor in the difference in the variable component of the retail tariffs at the time of charging from grid imports as compared to time when the battery is being discharged in assessing how to maximise returns from their investment.
Such choice helps to demonstrate the additional level of complexity facing customers considering investing in battery storage to integrate with their current solar PV installations. As discussed above, a solar–battery combination may not make financial sense for all customers.
It will very difficult for customers to evaluate such choices. We consider that solar-battery integration products for residential customers are likely to be developed in ways which can easily be marketed to customers, such as the size of installation and battery which would allow the customer to be self-sufficient and not rely on importing electricity.
10.1.2 Desire to take up battery storage While some customers are aware of the complexities associated with battery storage, the UMR customer survey suggests that a majority of customers that already have solar PV are open to the idea of installing batteries.
110 AEMC, 2014 Residential Electricity Price Trends, Final Report p.74

KPMG | 83
© 2016 KPMG, an Australian partnership and a member firm of the KPMG network of independent member firms affiliated with KPMG International Cooperative (“KPMG International”), a Swiss entity. All rights reserved. The KPMG name and logo are registered trademarks or trademarks of KPMG International.
Liability limited by a scheme approved under Professional Standards Legislation.
Interviews conducted by MEFL found that there was a high degree of awareness that there was not currently a positive return on investment for battery storage, but consumers expected that in time there would be. There was some interest by customers in further managing energy loads at different times of day to optimise output. This could more easily achieved through the use of battery storage than by changing their lifestyle.
One customer interviewed by MEFL had batteries installed, and 8% of customers surveyed by UMR that said they were aware of batteries or claimed to have installed them. In research for the AEMC, Newgate found of 2,333 residential electricity customers surveyed, 2 per cent had battery storage.111 These customers are “early adopters” that are likely to be motivated by reasons other than cost.
Figure 21: Interest in installing solar
Based on [description] and anything else you may have heard, how interested are you now in adding batteries to your solar electricity system?
Source: UMR Report.
Of those customers that were considering installing battery storage to complement an existing solar PV system, the desire for independence was the strongest motivating factor, followed by reducing household energy costs. Interestingly, this is the reverse of the main motivations cited by customers who had installed solar PV. This may reflect the current high cost of batteries, and that customers that do wish to install batteries in the short term are doing so for non-financial reasons.
Similar opinions were found through the 2015 Queensland Household Energy Survey.112 That survey found that while awareness of, and intended uptake of battery storage has increased significantly across Queensland in recent years, few customers have spoken with a battery salesperson and generally underestimate the cost of a system. At this stage, the price of batteries remains the greatest barrier to uptake followed by a lack of understanding and the absence of government incentives or rebates being made available.
10.2 Financial viability of battery storage and solar ECA commissioned the Alternative Technology Association (ATA) to provide analysis and advice regarding the current and future economics and technical aspects of solar and energy storage for
111 Newgate Research, AEMC 2016 Retail Competition Review: New and Emerging Energy Technologies and Services, Consumer Research Report, June 2016, p14. 112 https://www.ergon.com.au/__data/assets/pdf_file/0003/205608/2015-Queensland-Household-Energy-Survey-summary-report.pdf

KPMG | 84
© 2016 KPMG, an Australian partnership and a member firm of the KPMG network of independent member firms affiliated with KPMG International Cooperative (“KPMG International”), a Swiss entity. All rights reserved. The KPMG name and logo are registered trademarks or trademarks of KPMG International.
Liability limited by a scheme approved under Professional Standards Legislation.
residential consumers in the National Electricity Market (NEM). As part of its research, ATA modelled the economic value to residential consumers of installing different sized batteries either as a retro-fit to homes with existing solar PV; or as part of new solar-battery installations. This included modelling the economic value for typical residential customers across the NEM over the period to 2025 under a range of different tariff structures.
This section provides a brief summary of their methodology and findings.
Overview of ATA’s methodology
To understand the economic value to a residential consumer of installing different sized batteries, either as a retro-fit to homes with existing solar PV or as part of a new solar-battery installation, ATA conducted modelling across five separate locations within the NEM and considered the value for customers making the investment (i.e. system purchase and install) in either 2016, 2020 and 2025.113
Various scenarios were modelled based on the following assumptions:
· solar PV size was either 2kW or 5 kW,
· Battery capacity size was either 3kWh or 10 kWh.
Regarding the input prices for these investments, ATA assumed the following:
· $0.60-$0.80 per watt for solar PV installations based on current retail prices available in the market. ATA assumed a 1% p.a. reduction in the future price of installation for the modelling.114
· $1,200/kWh for the 3kWh battery and $1,000/kWh for the 10kWh battery. The model assumes a total capital battery price reduction compared to today’s prices of approximately 20% for new solar-battery systems, and 35-40% for retro-fit battery systems, by 2020. ATA noted that a further 20% reduction by 2020 is potentially achievable for retro-fit batteries should the global market for storage grow at the rate experienced by solar in 2009-2013.
Results were modelled for the following three different types of consumers:
Consumer type Average Daily Load Consumption Pattern
Working Couple 8kWh Relatively low day time load
Average Home 15kWh Similar to Working Couple plus
one child
Large Family 30kWh Relatively high day time load
The modelling was based solely on batteries which were only able to be charged from the solar installation and not from the grid. Batteries and inverters were assumed to be operational for 10 years, after which time the customer had to make a further investment to replace these assets.
Tariffs for the modelling were set separately for each location and year, based on an assessment of available retail tariff offers in 2016, and projected offers in 2020 and 2025 (taking into account industry price forecasts). The following tariff types were used as an input into the baseline scenarios:
113 Capital cities were selected: Sydney, Melbourne, Adelaide, Brisbane and Hobart. The modelling results were as defined 10 year Net Present Values (NPVs) and cash flows were discounted by 2.5%. The modelling was undertaken using ATA’s ‘Sunulator’ solar-battery simulation model. 114 Small Technology Certificates (STCs) were also accounted for in the model for those scenarios where a new solar-battery system was being installed. With the scheme closure due in 2030, ATA modelled a reduced number of STCs awarded for investment in new solar-battery systems in 2020 and 2025.

KPMG | 85
© 2016 KPMG, an Australian partnership and a member firm of the KPMG network of independent member firms affiliated with KPMG International Cooperative (“KPMG International”), a Swiss entity. All rights reserved. The KPMG name and logo are registered trademarks or trademarks of KPMG International.
Liability limited by a scheme approved under Professional Standards Legislation.
a) a flat tariff;
b) a 3-part Time of Use tariff for Victoria, NSW and QLD;
c) a 2-part Time of Use tariff for SA; and
d) a demand (i.e. kW-based) tariff for each location.
Tariffs used in the modelling were informed by existing offers available in the market. For future tariffs, such as demand tariffs, ATA reviewed DNSPs’ Tariff Structure Statements.
As explained earlier, the economic value from battery storage will dependent greatly on the strategy employed by the customer for charging and discharging the battery. The majority of the modelling undertaken by ATA involved the battery management strategy of buffering the solar PV output.
This strategy relies on a sensor to instantaneously detect the level of export or import from the grid. Solar generation is first used to supply on-site loads. Any excess is used to charge the batteries (within the limits of battery capacity and maximum charge rate), eliminating export to the grid (unless the battery is fully charged and there remains excess solar generation above on-site consumption). When on-site consumption is greater than solar generation, energy is discharged from the batteries (within battery limits) to avoid import from the grid where possible.
This is probably the most simplistic battery management strategy employed on the basis that the majority of the battery products in the Australian market are set up with the battery unable to be charged directly from the grid. Other strategies would probably be of more value to different customers – for example, reserving battery capacity for peaks - especially if the battery can be charged from grid.
The main finding from ATA’s modelling is that, given their high capital cost and relatively small additional benefits beyond that offered by solar PV, batteries do not currently offer economic value to residential energy consumers (in 2016). Payback periods are substantially longer than the ATA’s assumed 10 years asset life for the battery and inverter. This applies for both customers either retro-fitting battery systems or investing in new solar-battery combination systems.
After 2020, some locations and household types are able to install storage, as part of either new solar-battery systems, or retro-fit battery systems, and obtain a payback on their capital within the asset life of that battery and inverter. This can be seen in Figure 22, which models the payback period for an investment in a new 5kW solar PV system with a new 10kWh battery by an Average Home on a flat tariff.
Given their abundant sunshine and higher electricity tariffs, Adelaide and Brisbane achieve the fastest payback times, reducing to ten years or less by 2020 as component prices fall. Sydney and Hobart attain that mark by 2025; however Melbourne does not due to a combination of low electricity tariffs and relatively low levels of sunshine.

KPMG | 86
© 2016 KPMG, an Australian partnership and a member firm of the KPMG network of independent member firms affiliated with KPMG International Cooperative (“KPMG International”), a Swiss entity. All rights reserved. The KPMG name and logo are registered trademarks or trademarks of KPMG International.
Liability limited by a scheme approved under Professional Standards Legislation.
Figure 22: Simple115 Payback by Location for Average Home, New 5kW Solar + 10kWh Battery
Source: ATA report
The estimated value is greater for consumers with a 5 kW PV system combined with a 10 KWh battery compared to consumers with a 2kW system combined with a 3 KWh battery. This is largely due to the smaller solar system (2kW) not generating enough excess electricity to fully charge the battery on a regular basis. In turn, the battery can’t support as much of the household load – providing smaller benefits relative to upfront cost. In addition, smaller solar/battery systems are more expensive per unit of capacity.
Regarding consumer consumption patterns, ATA found that households with larger daily loads and peaky consumption profiles stand to benefit more from the installation of storage than those with smaller daily loads and flatter consumption profiles. Therefore of the different consumer types modelled, ATA found that the Large Family obtains the most value, followed by the Average Home. ATA did not find any scenarios where investment in battery storage became financially viable for the Working Couple.
The Average Home makes better use of the large solar system and battery, resulting in a large bill saving. The Large Family consumes much of their solar generation immediately, resulting in an even bigger bill saving, but a slightly lower battery utilisation. The Working Couple does not consume enough electricity frequently at night to fully discharge the large 10 kWh battery. At the same time, the large solar system is often exporting to the grid for a low value.
Interestingly ATA found that the Working Couple are not materially better off with a smaller solar PV and battery system (2kW + 3kWh). While the Working Couple makes better use of the battery, there are many sunny days on which the battery cannot absorb all of the excess solar and significant amounts of solar generation are exported to the grid. Due to economies of scale, this small system is more expensive per unit of capacity than the large system, prolonging payback.
115 ATA modelled payback periods on both a simple number of years payback and a discounted payback. ATA considered that whilst discounted payback is the more accurate economic measure, consumers are more likely to use the simple method.

KPMG | 87
© 2016 KPMG, an Australian partnership and a member firm of the KPMG network of independent member firms affiliated with KPMG International Cooperative (“KPMG International”), a Swiss entity. All rights reserved. The KPMG name and logo are registered trademarks or trademarks of KPMG International.
Liability limited by a scheme approved under Professional Standards Legislation.
Throughout the modelling period, a key finding is that the solar component provides by far the greatest proportion of the financial returns compared to the battery component where the value is achieved through flatting the net import consumption of the household. For this reason, ATA considers that a solar installation without battery is likely to deliver faster payback times as the lower upfront cost will typically outweigh the smaller bill savings.
For the battery retro-fit cases, the economics are once again worse than for the new solar-battery system. A key factor is whether the cost of the replacement hybrid inverter is accounted for. However we understand that there now exists an opportunity for new or retro-fit solar-battery projects to utilise a separate DC to DC converter, as an alternative to a more expensive hybrid inverter with battery control functionality. This approach can save in the order of $5,000 on the cost a of a new, replacement hybrid inverter as part of a retro-fit project. As such, this approach could become the most economic way to undertake a retro-fit project for existing solar homes. ATA modelling did not take this potential saving into account.
Regarding different tariff structures, ATA found that for many residential customers installing batteries that only charge from the solar PV system, they will be slightly better off on flat tariffs than a Time of Use (ToU) or a demand tariff. We believe this finding is a reflection of the fact that ATA based their analysis on a selection of observed prices, which happen to have the following characteristics:
· the fixed component of the flat tariff is lower than the fixed component of the TOU or Demand tariff structures; and
· there is a relatively small difference in the c/Kwh charge for the flat tariff compared to the c/kWh charge for the time of use peak and non-peak rates.
ATA’s finding that customers are better off on a flat tariff than a TOU or a demand tariff may seem to be counterintuitive and is likely due to the sample of tariffs used for the analysis. In practice, the relative tariff impacts for solar PV customers installing batteries will depend on the relative strength of the network cost signal contained in each tariff structure offered.
ATA also found that the economics of demand tariffs are relatively sensitive to individual consumption profiles. Smaller energy users with lower maximum demand will likely benefit from a demand tariff with a higher kW component. In contrast, larger energy users would benefit from a demand tariff with a lower kW component. In Brisbane and Sydney, the demand tariff generally in resulted in longer payback times as ATA maximum demand tended to occur at times when the batteries were depleted under their assumed simple battery management strategy. A strategy that is optimised to account for demand tariffs would be expected to provide a shorter payback period than one that is not optimised.
These results regarding tariffs are very sensitive to the assumed battery management strategy, the estimate retail tariff levels and the size of the solar PV battery units. Any modelling results on financial viability under different tariff structures needs to be undertaken with care. Such results are very sensitive to the individual circumstances of the customer and the functionality of the battery. Therefore general observations on the value to customers under different tariffs types may not apply to a given customer.
In addition, the battery management strategies will be key, including whether the battery discharges consistent with a time of use tariff and/or peak periods. Strategies such as tariff optimisation or peak lopping where the battery is designed to be smart and discharge when there is greatest value will impact on the value under different tariff structures
As explained in chapter 2, the solar PV market saw a marked increase in the average size of installation over time as the capital costs declined. ATA is expecting that the economics of battery integration will see a similar trend in battery sizes. They noted that a small battery size of 3kWh is the

KPMG | 88
© 2016 KPMG, an Australian partnership and a member firm of the KPMG network of independent member firms affiliated with KPMG International Cooperative (“KPMG International”), a Swiss entity. All rights reserved. The KPMG name and logo are registered trademarks or trademarks of KPMG International.
Liability limited by a scheme approved under Professional Standards Legislation.
most economic system under current cost estimates but that by 2025, 10kWh batteries appear to be competitive.
ATA also noted that electric storage hot water systems and heat pump systems may offer the potential for existing (and new) solar customers to maximise the use of their solar-generated electricity, without the need to invest in as yet expensive chemical energy storage in batteries.
10.3 Barriers to battery/solar integration This section explores potential barriers to existing residential customers integrating battery storage with their solar PV installations.
10.3.1 Technical capability to combine battery storage with existing solar While there are multiple ways that battery storage can be added to an existing solar PV installation, it cannot be assumed that it would be straightforward to install a battery and have it operate with the existing installation. ATA advises that the majority of solar PV systems installed in Australia are not completely battery ready – i.e. an existing solar customer cannot simply purchase a lithium ion, flow or sodium battery and have it retro-fitted to their existing system.
The main reason for this is the technical capability of the existing inverter is not compatible with the charging and discharging of the battery. This means that for most existing solar customers, they will need to either replace their existing, string inverter, or add a second inverter to their existing system. For some customers it may instead be possible to install a DC to DC convertor which can alleviate the need for a new hybrid inverter. This option depends on the system functionality required by the customer.
For this reason, all new battery products are sold with a new inverter or require a separate inverter to be purchased for installation. Existing solar customers may not be aware of this additional cost associated with battery storage, which could be in the region of $1000+. Also it is not clear if new solar PV installations contain an inverter which is battery compatible.
In addition, the operation of the battery and solar PV systems may require new IT management systems to align the operation of the battery and the solar PV installation so as to maximise the financial returns to the customer. Battery storage systems are far more complex than solar PV systems. For example, the useable lifetime of the battery can be shortened if the batteries are over-charged, over-discharged (especially fully discharged), charged when the temperature is too high, charged too quickly, discharged too quickly, etc. For these reasons, lithium batteries require a Battery Management System (BMS) responsible for monitoring the safe operation of the battery, and other battery chemistries require other types of battery controllers.

KPMG | 89
© 2016 KPMG, an Australian partnership and a member firm of the KPMG network of independent member firms affiliated with KPMG International Cooperative (“KPMG International”), a Swiss entity. All rights reserved. The KPMG name and logo are registered trademarks or trademarks of KPMG International.
Liability limited by a scheme approved under Professional Standards Legislation.
10.3.2 Premium feed in tariffs Premium FiT rates will also impact on the incentives for such customers to install batteries and could actually act as a barrier to installing such new technologies. This disincentive applies equally to customers on either a net or gross premium rate. There are two issues here:
1. The rules regarding a solar customer’s ability to modify their system and retain the premium FiT may influence their decision to install battery storage. In some jurisdictions, a customer on a premium rate would become ineligible for that rate if it installs batteries. This is case in ACT, SA and Queensland. The rationale for this prohibition is that it may be impossible with the metering technology at the premises to tell if the exported energy has solely been produced by the solar PV installation.
2. More importantly, there is a financial disincentive under current retail tariffs. If the premium FiT is more than the variable component of the retail tariff then the customer would lose revenue if it uses the battery to store solar generation for later use at the premises.
As explained in chapter 3, the behavioural incentive on customers with premium rates is to maximise their solar exports and hence there is very little value from installing a battery to support the solar PV installation. This disincentive may change if the retail rate becomes time varying and there is value for the consumer to store solar generated electricity for consumption at times when the time varying retail rate is highest.116
Consequently customers in affected jurisdictions may delay their decision to install batteries until the premium FiT schemes close. While we have not been able to find the actual number of solar PV customers who are currently on highest premium FiT schemes for their region, we estimate that percentage of customers on premium FiT compared to total installations ranges from 20% in NSW to over 50% in Queensland.
Table 3: Estimates of percentage of residential installations on premium feed in tariff rates
NSW VIC SA QLD
Total installations (as at 1 July 2016)
337,949 289,053 197,549 337,949
Estimated % 20% 34% 40% 55%
Source: KPMG analysis of Clean Energy Regulator data for total installation numbers
10.4 Customer Issues 10.4.1 Customer Understanding and information The UMR survey results found that two thirds of respondents thought there was enough information available for them to feel confident about whether installing batteries was right for them.
In contrast, research conducted by Newgate for the AEMC found that many customers wanted more information about new technology, including battery storage. Newgate found that “the dearth of knowledge and understanding is currently the greatest barrier to overcome before there is a
116 Subject to the timing of the peak rate and the net consumption profile of the household.

KPMG | 90
© 2016 KPMG, an Australian partnership and a member firm of the KPMG network of independent member firms affiliated with KPMG International Cooperative (“KPMG International”), a Swiss entity. All rights reserved. The KPMG name and logo are registered trademarks or trademarks of KPMG International.
Liability limited by a scheme approved under Professional Standards Legislation.
substantial shift in the momentum around new technology uptake”.117 Similarly the 2015 Queensland Household Energy Survey found that while 68% of solar PV owners surveyed are aware of battery storage, only 14% intend to purchase it. Respondents to that survey expected battery storage costs to be around $7,000 which is considerably less than actual costs. It should be noted that the contrasting views could be influenced by selection bias. The majority of respondents to the UMR survey were selected specifically because they were solar customers, who may be more informed on the available technologies that could complement their existing investment. Respondents to the research undertaken by Newgate for the AEMC and the Queensland Household Energy Survey included a higher proportion of customers that did not have solar.
Providing reliable and accurate information that is easy to access and understand will be important to help solar customers consider their options with respect to battery storage. This includes whether to purchase batteries, and also to help them evaluate how best to use and integrate battery storage into their decisions relating to electricity. This will need to be coupled with appropriate consumer protections.
It is likely that sophisticated IT management systems will become part of the battery products. This could develop to help “set and forget” type approaches, whereby alignment of the charging and discharging of the battery with a particular tariff structure (e.g. ToU or demand charge) may offer increased consumer benefits. However there may be issues (and additional costs) with retro-fitting such IT systems for those customers with existing solar PV installations.
10.4.2 Safety of battery – solar installations As explained above, battery storage systems are both more technically and economically complex than solar PV systems. They also create additional safety issues to be addressed in order to protect customers. The 2015 Queensland Household Energy survey found that 14% of respondents stated that safety concerns were a barrier to purchasing battery storage.
The installation of grid-connected energy systems with battery storage is a relatively new and emerging field, which is growing rapidly. However as recognised by the Clean Energy Council existing standards do not address recent product innovations and developments, such as packaged ‘battery energy storage systems’, also known as ‘all-in-one’ systems, which combine battery storage, inverters and other control equipment into a single assembly, with pre-engineered connections.
Given a lack of standards specific to emerging battery technologies and configurations, in April 2016, both the CEC and the Australian Energy Storage Council released (separate) sets of interim guidelines for battery installation and safety. The CEC guidelines - Installation Guidelines for Grid Connected Energy Systems with Battery Storage will become mandatory for its members from 1 October 2016. This guideline will list five main hazards associated with battery systems.118
Further work is required to have a complete and robust set of safety standards which is consistent with the available battery technology. Standards Australia is working with the COAG Energy Council to develop new standards and support the safe and efficient uptake of new storage technology in Australia. Standards Australia commenced public consultation on the development of Australia’s first comprehensive set of industry standards for battery storage in May 2016.
A related issue is that while the CEC accreditation framework applies to businesses installing solar PV and other renewable energy systems, there is no similar system in place for businesses installing
117 Newgate Research, AEMC 2016 Retail Competition Review: New and Emerging Energy Technologies and Services, Consumer Research Report, June 2016, p7. 118 These five safety hazards include electric shock, energy, chemical, fire and gravitational. http://www.solaraccreditation.com.au/installers/compliance-and-standards/accreditation-guidelines.html

KPMG | 91
© 2016 KPMG, an Australian partnership and a member firm of the KPMG network of independent member firms affiliated with KPMG International Cooperative (“KPMG International”), a Swiss entity. All rights reserved. The KPMG name and logo are registered trademarks or trademarks of KPMG International.
Liability limited by a scheme approved under Professional Standards Legislation.
battery systems. While all electrical work is still required by law to be undertaken by suitably qualified tradespeople and follow all manufacturer recommendations, and CEC members are subject to its battery installation guidelines, consideration of an appropriate accreditation framework for battery installation, similar to solar PV installation, is required.
10.5 Market issues 10.5.1 Incentives through tariff design As explained in chapter 3, reforms have recently been introduced to achieve greater cost reflectivity in network tariffs design and structures. The objective is to require network prices to reflect the efficient cost of providing network services to individual consumers so that they can make more informed decisions about their electricity usage. Distribution business are required to have approved efficient tariff structures in place from 2017.
This section explores this matter of tariff reform from the perspective of a customer who has (or is considering having) both solar and battery storage at their premises.
As explained above, the combination of battery and solar could dampen the incentives on a consumer to shift their consumption as they could instead use the battery to meet their electricity needs during peak times.
The financial value of a ToU tariffs will depend on the customer’s consumption pattern and the capacities of both the solar PV unit and battery. For example, a consumer may benefit from a time of use tariff structure to charge from the grid in the off-peak and consume the energy from the battery during the peak if the solar PV output is insufficient to meet its peak demand.
The situation regarding demand tariffs is slightly more complicated. The incentive is for the consumer to store electricity in advance of any days when solar PV output is impacted (e.g. due to weather) in order to minimise the value peak demand occurring during the charging period applicable to the demand charge. This would require a high level of engagement by the customer to consider and implement, or a high level of sophisticated automation.
ATA modelling confirms this. The ATA found that households installing DC coupled batteries would generally be no worse off from being on a flat tariff as compared with a ToU or demand tariff, noting that these results likely arise from using observed prices. For many homes and locations, customers would indeed be better off on a flat tariff. Peak tariffs have less of an impact if a customer has solar and battery storage, as the battery will enable the customer to consume its solar PV output whether it wants during the day and hence the proportion of consumption exposed to peak pricing is less compared to customer without battery.
In principle, a solar customer with a battery will have the incentive to opt for tariff structures where the fixed charge component is lowest. This is because this component cannot be influenced by the operation of the solar-battery installation. Any trends toward higher fixed charges under the tariff reform is likely to negatively impact on the financial returns available for batteries.
This is in contrast to those customers who only have battery storage without any solar installation. For these customers, the financial return is from selecting a time of use tariff and the battery controller is then programmed to supply electricity to the household during peak times and charge the battery using cheap off-peak electricity.
One objective of tariff reform is to provide better incentives on consumers to help influence consumption patterns in a way which dampens system peaks. However for the reasons outlined above, tariff reforms that result in a relatively high fixed price are likely to be ineffective towards customers who have solar and battery integration.
KPMG | 92
© 2016 KPMG, an Australian partnership and a member firm of the KPMG network of independent member firms affiliated with KPMG International Cooperative (“KPMG International”), a Swiss entity. All rights reserved. The KPMG name and logo are registered trademarks or trademarks of KPMG International.
Liability limited by a scheme approved under Professional Standards Legislation.
Tariffs choice may not be the only policy mechanism to promote efficient uptake of battery storage for solar PV customers. The effectiveness of current network reforms at promoting the efficient integration of batteries will depend on a range of different factors, including how retailers pass through the network tariff signal into the retail offer, government policy, the design of the network tariff structures plus how well those tariff structures align with the battery management technology and preferences of customers.
As explained above, battery integration will help to improve the market efficiency impacts of existing solar PV customers through dampening net demand at peak periods. The question for network businesses and policy makers is if and how, in the absence of being able to use tariffs to reward behaviour which helps to manage system peaks, solar PV customers should be rewarded for such behaviour to promote efficient uptake of battery from the market perspective. As found by ATA, solar installations without batteries will be financially better for consumers as they lead to faster payback compared to combined solar and battery. While this is a better outcome for consumers it is potentially worse for market efficiency.
10.5.2 Implications of increased penetration of battery storage Like solar, individual decisions regarding the design and installation of battery storage, as well as the subsequent changes in a customer’s load profile, will have wider implications. These will be felt most noticeably by DNSPs, for whom battery storage could either impose or reduce costs:
· Battery storage can absorb more PV generation, reducing the volume of export and its impacts and potentially contributing to the reduction in local peak demand (on the assumption that stored power will be used in the evening). This outcome is consistent with current incentives on customers that are on low feed-in tariffs and have an incentive to match generation with consumption.
· Battery storage could result in more generation being exported onto the network in some instances, if the battery is being discharged at the same time as energy is being generated. Currently the financial incentive is for customers to self-consume electricity which is stored in the battery. However this could be an issue if customers are instead incentivised to generate more energy than they consume.
DNSPs seeking to encourage or reduce these impacts could result in individual DNSP policies driving different outcomes across the NEM, as has been the case with solar PV. Already, many DNSPs have put regulations around battery inverters and the CEC is working with the industry to develop arrangements regarding export.
It is also reported that battery storage could lead to customers becoming self-sufficient and opting to disconnect from the electricity network. At this stage, the substantial costs of going completely off-grid are likely to limit the likelihood of this occurring. ATA estimates the total costs of going off-grid in the region of $40,000 per residential premises.119
While off grid solutions could become more common once battery storage becomes financially feasible, it is unlikely that many customers will disconnect from the electricity network in the short to medium term. However the policy implications including the appropriate charges for such disconnection have not been properly settled.
119 ATA Report to ECA, Storage Advice p.33

KPMG | 93
© 2016 KPMG, an Australian partnership and a member firm of the KPMG network of independent member firms affiliated with KPMG International Cooperative (“KPMG International”), a Swiss entity. All rights reserved. The KPMG name and logo are registered trademarks or trademarks of KPMG International.
Liability limited by a scheme approved under Professional Standards Legislation.
10.5.3 Network connection and performance arrangements
Local DNSPs detail requirements for the installation of embedded generators, which includes solar systems and battery storage systems. These requirements must be consistent with the connection arrangements specified in the National Electricity Rules and jurisdictional regulations.
Such requirements are intended to ensure the safety of embedded generation systems and ensure that the operation of the embedded generator does not adversely affect other electricity consumers connected to the local electricity network. We understand that most local connection requirements are currently being revised to ensure they adequately cater for the safe operation of battery storage systems.
The AEMC has recently conducted a review into regulatory issues associated with the development of battery storage.120 In its final report, the AEMC identified a number of issues regarding the processes for the connection of storage capability to the electricity network, both behind the meter and on the grid itself, plus the ability of parties to use their storage capability to participate in the wholesale market.121
To address such barriers and to also simplify and streamline the connection process for battery storage, the AEMC recommended that:
1. AEMO conduct a review of the existing registration category of small generator aggregator to determine whether the ensuing rights and obligations are suited to parties seeking to utilise the combined capability of disaggregated storage behind the meter for participation in the NEM.
2. AEMO conduct an assessment of whether there are any technical limitations to small generation aggregators offering frequency control ancillary services, for example by aggregating the combined capability of a number of storage devices behind the meter.
3. The AER, as part of its ongoing compliance work in this area, review existing DNSP basic connection service offerings for micro-embedded generation to ensure they clearly articulate their applicability to the connection of a storage system intending to export electricity to the grid.
4. The AEMC conduct a review of the technical standards contained in the NER to assess their applicability for connection of storage assets, as either a generating system or a load, by registered participants
5. The AEMC conduct a review of the technical requirements that apply to the connection of micro-embedded generation
The progress of these issues are critical to ensure that the regulatory frameworks are not inhibiting the efficient deployment of battery storage, including battery solar integration.
120 http://www.aemc.gov.au/Major-Pages/Technology-impacts 121 http://www.aemc.gov.au/Major-Pages/Technology-impacts/Documents/AEMC-Integration-of-energy-storage,-final-report.aspx

KPMG | 94
© 2016 KPMG, an Australian partnership and a member firm of the KPMG network of independent member firms affiliated with KPMG International Cooperative (“KPMG International”), a Swiss entity. All rights reserved. The KPMG name and logo are registered trademarks or trademarks of KPMG International.
Liability limited by a scheme approved under Professional Standards Legislation.
Appendix A: Glossary of terms AC – Alternating current
AEMC – Australian Energy Market Commission
AEMO – Australian Energy Market Operator
AER – Australian Energy Regulator
ATA – Alternative Technology Association
BMS – Battery Management System
CEC – Clean Energy Council
CER – Clean Energy Regulator
COAG – Council of Australian Governments
CSIRO – Commonwealth Scientific and Industrial Research Organisation
DC – Direct current
DNSP – Distribution Network Service Provider
ECA – Energy Consumers Australia
ESV – Essential Service Commission of Victoria
FiT – Feed-in Tariff
GWh – Gigawatts per hour
kWh – Kilowatts per hour
LGNC – Local Generation Network Credits
MEFL – Moreland Energy Foundation
MWh – Megawatts per hour
NECF – National Energy Customer Framework
NEM – National Electricity Market
NEO – National Electricity Objective
NERL – National Energy Retail Law
NERO – National Energy Retail Objective
NERR – National Energy Retail Rules
Newgate – Newgate Research
NGO – National Gas Objective
PV – Photovoltaic
SAPN – South Australia Power Networks
STC – Small Scale Technology Certificates
SWER – Single Wire Earth Return
ToU – Terms of use
UMR – UMR Research

KPMG | 95
© 2016 KPMG, an Australian partnership and a member firm of the KPMG network of independent member firms affiliated with KPMG International Cooperative (“KPMG International”), a Swiss entity. All rights reserved. The KPMG name and logo are registered trademarks or trademarks of KPMG International.
Liability limited by a scheme approved under Professional Standards Legislation.
Appendix B: Code of Conduct CEC Accreditation Code of Conduct
All Clean Energy Council-accredited installers are bound by the CEC’s code of conduct. The code of conduct is intended to “guide the behaviour of accredited installers and designers, and the standards of conduct and professionalism expected from them”.122 It therefore deals with matters relating to the design and installation of solar PV systems.
The code of conduct requires that anyone that holds any form of CEC accreditation:
· shall act so as to uphold and enhance the honour, integrity and dignity of the sustainable energy industry and the Clean Energy Council by associating, in their business activities, exclusively with individuals and enterprises of good character
· shall solicit work, advertise and promote their services and products with dignity and truth, avoiding any potentially misleading statements or omissions
· shall apply their skill and knowledge in the interest of their clients or employers for whom they act as faithful agents or trustees
· shall regard as confidential any information concerning the business and technical affairs of their clients or employers
· shall inform their clients or employers if circumstances arise, in which their judgment or the independence of their service may be compromised by reason of business connections, personal relationships, interests or affiliations
· shall deal honestly and truthfully with clients, employers and government agencies in all matters pertaining to payments, discounts, rebates and grants and the conditions applying to them
· shall continue their professional development throughout their careers (including by taking all reasonable steps on an ongoing basis to maintain familiarity with all current relevant laws, ordinances, regulations, standards, codes of practice and guidelines) and shall assist and encourage other accredited persons to similarly advance their knowledge and experience
· shall observe and conform to all relevant Australian Standards and all relevant Clean Energy Council accreditation guidelines, and all applicable laws, ordinances, regulations and codes of practice
· shall promptly report any apparent breach of any of these rules by a fellow accredited person or applicant for accreditation to the Clean Energy Council, Accreditation Management
· shall promptly report to a member of the Clean Energy Council Accreditation Management any activity or behaviour by a non-accredited person operating in, or making statements about, the sustainable energy industry, which activity or behaviour by that person would be a breach of these rules if that person held any Clean Energy Council accreditation, so that an appropriate response to be made by the Clean Energy Council, and
· shall not bring the industry into disrepute.
122 See www.solaraccreditation.com.au.

KPMG | 96
© 2016 KPMG, an Australian partnership and a member firm of the KPMG network of independent member firms affiliated with KPMG International Cooperative (“KPMG International”), a Swiss entity. All rights reserved. The KPMG name and logo are registered trademarks or trademarks of KPMG International.
Liability limited by a scheme approved under Professional Standards Legislation.
Box 5: Accreditation Code of Conduct Under the terms of the Clean Energy Council’s design accreditation, system designers are expected to adhere to the Clean Energy Council System Design Guidelines. Under these guidelines, the designer's responsibilities are to:
· provide full specifications of the system including quantity, make and model number of the solar modules and inverter
· provide a site-specific full system design including all shading issues, orientation and tilt, along with the system's site-specific energy yield, including average daily performance estimate in kWh for each month of solar generation
· ensure array design will fit on available roof space
· ensure array mounting frame installation will comply with AS1170.2
· ensure array configuration is compatible with the inverter specification
· ensure all equipment is fit for purpose and correctly rated
· obtain warranty information on all equipment.
The guidelines also specify the documentation that the designer is required to provide to the installer, which includes:
· A list of equipment supplied
· A list of actions to be taken in the event of an earth fault alarm
· The shutdown and isolation procedure for emergency and maintenance
· A basic connection diagram that includes the electrical ratings of the PV array and the ratings of all overcurrent devices and switches as installed
· Site-specific system performance estimate
· Recommended maintenance for the system
· Maintenance procedure and timetables
· If the designer runs a sales company and engages accredited installers, someone in the company must be an accredited designer who takes responsibility for the system design and performance estimate for each job. If the designer does not take this responsibility, the designer is required to inform the installer of this.

KPMG | 97
© 2016 KPMG, an Australian partnership and a member firm of the KPMG network of independent member firms affiliated with KPMG International Cooperative (“KPMG International”), a Swiss entity. All rights reserved. The KPMG name and logo are registered trademarks or trademarks of KPMG International.
Liability limited by a scheme approved under Professional Standards Legislation.
Appendix C: Feed-in Tariffs This appendix outlines government guaranteed, regulated retailer and competitive retailer feed-in tariffs (FiTs) for each jurisdiction. Tariff payments are net unless otherwise stated.
As set out below, jurisdictional governments have taken different approaches to FiTs and there have been policy changes to these schemes over time. Consequently there may be some confusion for solar customers about what they are entitled to.
A.1: Queensland Queensland FiTs began with the introduction of the Solar Bonus Scheme (SBS) under the Clean Energy Act, 2008 and is administered by the Department of Energy and Water Supply.
The SBS was available from July 2008 until 30 June 2014 to small customers. Customers on the SBS received a guaranteed government rate and had the ability to switch retailers during the Scheme. The SBS had two periods with which customers fell into:
· Customers that applied to the Scheme before July 2012 were eligible for a net 44 cents per kWh government FiT and will continue to receive this rate until July 2028; or
· Customers that applied to the Scheme between July 2012 and June 2014 and received 8 cents per kWh government FiT until 30 June 2014.
The SBS operates as a net payment mechanism and is funded through higher network charges for all electricity consumers.
In 2012, the Queensland Government launched an inquiry into FiTs led by the Queensland Competition Authority (QCA) – an independent body that ensures monopoly businesses do not abuse their market power. The results of the inquiry found that:
· Future feed-in tariff schemes should be funded by electricity retailers, rather than regulated network businesses, to avoid cross-subsidies and the inequitable recovery of costs from those customers least able to afford them.
· There is no compelling evidence to support a regulated, mandatory minimum feed-in tariff for customers in the south east Queensland retail electricity market.
· Regulated minimum retailer funded feed-in tariffs should be established for regional customers depending on customer location.
· Government could move PV customers to a time-of-use tariff to expose them to a more cost reflective fixed charge than they face under flat residential tariffs. This would reduce the problem of PV customers avoiding some of the true cost of their network access due to their net consumption profile, which leads to higher average variable network charges.
Following this review, Queensland transitioned to a geography and population based tariff structure, divided up between regional Queensland and south-east Queensland (SEQ). The setting of the FiT rates also changed.
In regional Queensland, a flat tariff structure was adopted post review. The flat tariff structure was and is determined by the QCA on an annual basis. The most recent tariff structure fares were 6.534 cents per kWh (2014-15), 6.348 cents per kWh (2015-16) and 7.448 cents per kWh (2016-17). An important change to note with the recent tariff rates is the 2016-17 jump from 6.348 to 7.448 cents per kWh. This jump was driven by a higher wholesale prices given by both an increase in demand from the Queensland-based Liquefied Natural Gas (LNG) project(s) and general higher fuel costs for gas-fired generation plants.

KPMG | 98
© 2016 KPMG, an Australian partnership and a member firm of the KPMG network of independent member firms affiliated with KPMG International Cooperative (“KPMG International”), a Swiss entity. All rights reserved. The KPMG name and logo are registered trademarks or trademarks of KPMG International.
Liability limited by a scheme approved under Professional Standards Legislation.
From 1 July 2014, customers in South East Queensland who were previously on the 8 cents per kWh rates, as well as new solar customers, will receive a FiT that is set by their retailer. As of July 2016, these Market FiTs ranged from 4 to 10 cents per kWh.
A.2 New South Wales
In 2009, under the Electricity Supply Act 1995, the NSW Government introduced the Solar Bonus Scheme (SBS). The SBS commenced 1 January 2010 and was legislated to run for seven years to 31 December 2016.
Customers who applied for the Scheme between January 2010 and April 2011 will receive a gross 20 cents per kWh or 60 cents per kWh depending on the dates of purchase (or lease) until 31 December 2016.
There are no government FiTs currently open for new applications in NSW. New solar customers receive competitive retailer FiTs which ranged from 5 to 10 cents per kWh as at 18 February 2015. For 2016/17, the Independent Pricing and Regulatory Tribunal (IPART) publish a recommended benchmark range of between 5.5 to 7.2 cents per kWh. This benchmark range is a guide to the unsubsidised value of solar feed-in tariffs that some electricity retailers voluntarily offer to customers who are not part of the SBS.
In setting this range, IPART takes into account the wholesale electricity costs, avoided losses and NEM fees. Under its methodology, IPART treats solar PV customers similar to other generators in the market.
The objective of the SBS was to encourage the uptake of renewable energy in NSW. Since its inception, over 146,000 households and small businesses have installed small-scale renewable energy generators. Additionally, since the Scheme’s closure to new applicants in April 2011, a further 174,000 households and small businesses have installed systems without a subsidised FiT.123
A.3 Australian Capital Territory
The ACT has two premium FiT Schemes (Small and Medium Scale Fit Scheme and Large Scale FiT Scheme). The Small and Medium Scale FiT Scheme is directly applicable to rooftop solar panels for households, the latter is more suitable for larger scale, industrial size solar electricity generation.
The ACT’s Scheme provided for a ‘gross’ FiT, whereby each kilowatt hour produced was paid the incentive. This is in contrast to the alternative, ‘net’ tariff arrangement, which pays only for electricity surplus to household consumption.
The ACT’s Micro Generator scheme was open for applications between March 2009 and July 2011. The Medium Generator Scheme was open between February 2011 and July 2011. Government mandated rates range from 30.1 to 50.05 cents per kWh gross, depending on the date of connection and capacity. These rates will be paid for 20 years from connection. Over the lifetime of the Scheme, there were five different rates that were applied to customers, these include:
· 50.05 cents/kWh (installation capacity up to 10 kW) for applications approved 1 March 2009 to 30 June 2010;
· 40.04 cents /kWh (installation capacity between 10 to 30 kW) for applications approved 1 March 2009 to 30 June 2010;
· 45.7 cents /kWh (installation capacity up to 30 kW) for applications approved 1 July 2010 to 31 May 2011;
· 34.27 cents /kWh (installation capacity between 30 to 200 kW) for applications approved 7 March 2011 to 11 July 2011; and
123 NSW Government – Department of Industry: Resources and Energy, http://www.resourcesandenergy.nsw.gov.au/energy-consumers/solar/solar-bonus-scheme/faqs-about-the-solar-bonus-scheme-closure, site accessed 27 June 2016.

KPMG | 99
© 2016 KPMG, an Australian partnership and a member firm of the KPMG network of independent member firms affiliated with KPMG International Cooperative (“KPMG International”), a Swiss entity. All rights reserved. The KPMG name and logo are registered trademarks or trademarks of KPMG International.
Liability limited by a scheme approved under Professional Standards Legislation.
· 30.16 cents /kWh (generator capacity up to 200 kW) for applications approved 12 July 2011 to 13 July 2011 Gross 2011.
Following the closure of these schemes to new applications, customers receive a FiT set by their retailer. These currently range from 5.1 to 7.5 cents per kWh.
A.4 Victoria
Victoria has three government FiT schemes which are now closed to new applications however existing customers still receive a guaranteed rate. New solar customers and those who lose eligibility for their FiT scheme receive competitive retailer FiT subject to a minimum tariff.
The Standard Feed-in Tariff (SFIT) Scheme was open to applications from January 2008 to December 2012 and offers a ‘fair and reasonable tariff’ which is the same ‘one-for-one’ rate as that paid by the customer for their electricity. Customers on the SFIT cannot switch retailers without losing their ‘fair and reasonable tariff’ since the rate is contracted with and funded by each customer’s electricity retailer. The SFIT will be paid until December 2016.
The Premium (PFIT) Scheme was open to applications from November 2009 to December 2011. The PFIT of 60 cents per kWh will be paid until November 2024. As of 19 February 2015, some retailers offer a ‘top-up’ of 8 to 10 cents per kWh.
The Transitional (TFIT) Scheme replaced the Premium Feed-in Tariff in 2011 was open to application from January to December 2012. The TFIT of 25 cents per kWh will be paid until December 2016. As of 2014, some retailers offer a ‘top-up’ of 8 to 10 cents per kWh.
Customers on the PFIT and TFIT schemes can switch retailers without losing their FiT, however the retailer ‘top-up’ could change and exit fees may apply.
From January 2013, there has been a minimum retailer FiT for new solar customers. The Essential Services Commission (Commission) is responsible for determining the minimum rate that a relevant retailer must pay to its customers, who are small renewable energy generators, for electricity they produce and export into the electricity distribution system.
The rate of the minimum FiT reflects a forecasted wholesale market value of PV electricity for the coming year. The FiT rate for 2016 (1 January to 31 December 2016) is 5.0 cents per kWh. This rate will hold until the ESC revises it again for the following year. This rate is a reduction from the 6.2 cents per kWh rate set for 2015. The minimum rate must be offered by retailers with more than 5,000 customers.
A.5 South Australia
The South Australian Solar Feed-in Tariff scheme commenced in July 2008 and closed to new applications in September 2013. Customers on this scheme that receive a government guaranteed rate fall into two categories depending on when they applied:
· Eligible customers who applied for the scheme between July 2008 and September 2011 will receive a 44 cents per kWh FiT until June 2028.
· Eligible customers that applied for the scheme between October 2011 and September 2013 will receive a 16 cents per kWh FiT until September 2016.
Retailers in South Australia also offer a ‘top-up’ of 8 cents per kWh in addition to the government-guaranteed rate. Customers on this scheme can switch retailers without losing their FiT, while it still applies, however the retailer ‘top-up’ could change.
Since January 2012, there has been a regulated minimum retailer FiT in South Australia set by the Essential Services Commission of South Australia (ESCoSA). This regulated FiT is based on the minimum electricity forecasted spot price. This differs markedly from the retail price of electricity as it does not take into account transmission and distribution costs, retailer margins or operating costs.

KPMG | 100
© 2016 KPMG, an Australian partnership and a member firm of the KPMG network of independent member firms affiliated with KPMG International Cooperative (“KPMG International”), a Swiss entity. All rights reserved. The KPMG name and logo are registered trademarks or trademarks of KPMG International.
Liability limited by a scheme approved under Professional Standards Legislation.
ESCoSA set the regulated minimum retailer FiT at 6 cents per kWh from 1 July 2014 and 5.3 cents per kWh from 1 January 2015. The 2016 FiT rate is 6.8 cents per kWh, which is 1.5 cents per kWh up from the previous year. This uplift reflects the forecast increase in the wholesale cost of electricity and also takes into account important exogenous factors such as the expected shutdown of the Northern Power Station at Port Augusta in March 2016.
In 2015, ESCoSA stated it is favourably disposed to a deregulation of the regulated tariff at the conclusion of calendar year 2016, unless it observes a marked deterioration in the effectiveness of the overall energy retail market or it becomes aware of evidence conclusively demonstrating that the PV market is not competitive in South Australia. The Commission is currently consulting on whether a minimum R-FiT value should continue to be set from 2017.
A.6 Tasmania
Customers in Tasmania could apply for the Transitional Legacy Tariff until August 2013. This scheme pays 28.283 cents per kWh until December 2018. Customers on the Transitional Legacy Tariff can switch retailers without losing their FiT. For new solar customers, the Office of the Tasmanian Economic Regulator sets a regulated FiT. This rate was 8.282 cents per kWh from January 2014 to June 2014 and 5.551 cents per kWh from 1 July 2014 to 30 June 2015.
A.7 Western Australia
The Western Australian residential net feed-in tariff scheme was open to applicants between 1 July 2010 and 1 August 2011. Consumers eligible for the Residential Feed-in Tariff, receive a payment of 40 c/kWh for exported electricity if they applied before 1 July 2011. Applications after 1 July 2011 received a rate of 20 cents/kilowatt for applications up to a combined capacity cap of 150 MW. Once the capacity cap was reached, the scheme closed to new applicants. Under the scheme, eligible customers receive the payment for 10 years since installation.
For new installations government-owned retailers must offer eligible customers a buyback scheme. This ensures residents, schools and non-profit organisations with renewable energy systems can sell their excess energy to Synergy and Horizon Power. Under this scheme, retailers offer a buy-back rate for electricity exported by eligible consumers from renewable energy systems. The rates must be “fair and reasonable” and are reviewed by the Public Utilities Office.124 From 1 July 2016, Synergy offers a buyback rate of 7.135 cents per KWh
A.8 Northern Territory
Jacana Energy offers a voluntary feed-in tariff for residential customers with an eligible solar photovoltaic system. As of January 2016, an energy flat buy-back rate of 25.54 c/kWh is payable to residential consumers and 29.72 c/KWh is payable to commercial customers. This scheme is not legislated by the Northern Territory Government.
124 In assessing rates, the PUO take into account: the wholesale cost of electricity; line loss reductions provided by distributed renewable energy; peak reductions provided by distributed renewable energy, capacity benefits provided by renewable energy and the costs to retailers of running the scheme.

The information contained in this document is of a general nature and is not intended to address the objectives, financial situation or needs of any particular individual or entity. It is provided for information purposes only and does not constitute, nor should it be regarded in any manner whatsoever, as advice and is not intended to influence a person in making a decision, including, if applicable, in relation to any financial product or an interest in a financial product. Although we endeavour to provide accurate and timely information, there can be no guarantee that such information is accurate as of the date it is received or that it will continue to be accurate in the future. No one should act on such information without appropriate professional advice after a thorough examination of the particular situation.
To the extent permissible by law, KPMG and its associated entities shall not be liable for any errors, omissions, defects or misrepresentations in the information or for any loss or damage suffered by persons who use or rely on such information (including for reasons of negligence, negligent misstatement or otherwise).
© 2016 KPMG, an Australian partnership and a member firm of the KPMG network of independent member firms affiliated with KPMG International Cooperative (“KPMG International”), a Swiss entity. All rights reserved.
The KPMG name and logo are registered trademarks or trademarks of KPMG International. Liability limited by a scheme approved under Professional Standards Legislation.
Contact us
Eamonn Corrigan
Director
+ 61 (2) 9335 8555
Elisabeth Ross
Associate Director
+ 61 (2) 9335 7729
kpmg.com.au