residential land supply & demand assessment surf coast
TRANSCRIPT

RESIDENTIAL LAND
SUPPLY & DEMAND ASSESSMENT
Surf Coast
September 2018
Final
Spatial Economics

Demand & Supply – Residential Land Surf Coast Shire Page | 2
09/09/2018
Final Version 1.1
Spatial Economics Pty Ltd
ABN: 56 134 066 783
www.spatialeconomics.com.au

Demand & Supply – Residential Land Surf Coast Shire Page | 3
CONTENTS
EXECUTIVE SUMMARY....................................................................................................... 6
1.0 Introduction......................................................................................................................... 10
1.1 Context................................................................................................................................ 10
1.2 Purpose ............................................................................................................................... 10
2.0 Approach & Scope ............................................................................................................... 10
3.0 Population and Dwelling Growth .......................................................................................... 16
3.1 Historical Population Growth ................................................................................................ 16
3.2 Historical Population, Dwelling Growth – Major Areas (regions) ............................................. 18
4.0 Recent Residential Development Activity ............................................................................. 21
4.1 Residential Building Approvals ............................................................................................. 22
4.2 Residential Lot Construction ................................................................................................ 24
4.3 Location of Residential Development Activity ....................................................................... 24
4.4 Lot Construction by Supply Type .......................................................................................... 26
4.5 Dispersed/Minor Infill Lot Construction ................................................................................. 27
4.5.1 Dispersed/Minor Infill Supply – Achieved Densities ............................................................. 27
4.5.2 Dispersed/Minor Infill Supply – Parent Lot Size................................................................... 28
4.5.3 Dispersed/Minor Infill Supply – Project Size and Yield ......................................................... 28
4.6 Broadhectare Lot Construction ............................................................................................ 30
4.6.1 Broadhectare Lot Construction – Diversity ......................................................................... 30
4.6 Major Infill Lot Construction ................................................................................................. 31
4.7 Rural Residential Lot Construction ........................................................................................ 32
4.8 Vacant Residential Lot Sales Pricing ..................................................................................... 32
5.0 Residential Land Supply ....................................................................................................... 36
5.1 Stock of Zoned Broadhectare/Major Infill Land Stocks ........................................................... 37
5.2 Stock of Un-Zoned Broadhectare Land Stocks ...................................................................... 37
5.3 Land Fragmentation ............................................................................................................ 38
5.4 Rural Residential Land Stocks............................................................................................... 39
5.4.1 Short-Term Future Lot Construction - Rural Residential ...................................................... 41
5.4.2 Future (Unzoned) Rural Residential Land Stocks ................................................................ 41
6.0 Projected Housing Demand ................................................................................................. 44
6.1 Housing Demand Scenarios.................................................................................................. 46
6.2 Changing Composition of Future Housing Demand – Household Types.................................. 48
6.3 Changing Composition of Future Housing Demand – Age Structure ....................................... 50
7.0 Adequacy of Land Stocks ..................................................................................................... 53
7.1 Years of Supply – Surf Coast ................................................................................................. 53

Demand & Supply – Residential Land Surf Coast Shire Page | 4
LIST OF GRAPHS Graph 1: Estimated Resident Population Annual Growth Rate, 2001 to 2017 (%) – Surf Coast Shire,
Greater Melbourne, Greater Geelong and Rest of Victoria
Graph 2: Estimated Resident Population Growth Rate, 2011 to 2017 (%) – Surf Coast SA2s Vs Selected Jurisdictions
Graph 3: Residential Building Approvals by Type – Surf Coast Shire
Graph 4: Residential Building Approvals by ABS SA2s - 2011 to 2018 (FYTD)
Graph 5: Share of Residential Development Activity by Supply Type – Surf Coast
Graph 6: Dispersed Infill - Achieved Lot Size Cohorts, 2007 to 2018
Graph 7: Parent Lot Size of Dispersed Infill Projects (Surf Coast Shire), 2007 to 2018
Graph 8: Dispersed Infill Development – Lot Yield & Project Size Distribution, 2007 to 2018
Graph 9: Broadhectare Lot Construction Size Distribution – Surf Coast Shire
Graph 10: Median Lot Size (sqm) – Broadhectare Lot Construction
Graph 11: Median Sales Values – Vacant residential lots, 2007-2017 – Surf Coast Shire Vs Selected Jurisdictions
Graph 12: % Price difference - Vacant residential lots, 2007-2017 – Surf Coast Shire Vs Metropolitan
Melbourne and Greater Geelong
Graph 13: Median Sales Values ($) – Vacant residential lots, 2007-2017 –Selected localities
Graph 14: Stock of Rural Residential Allotments, 2017
Graph 15: Stock of Rural Residential’ Allotments by Lot Size Cohort, 2017
Graph 16: Historic and Projected Demand for Residential Dwellings, 2007 to 2031
Graph 17: Projected Growth in Households by Type, Surf Coast Shire – 2016, 2026 to 2036
Graph 18: Average Annual % Change in Population by Age Cohort, 2016 to 2036
Graph 19: Proportional Population Distribution by Age Cohort, 2016 and 2036
LIST OF TABLES
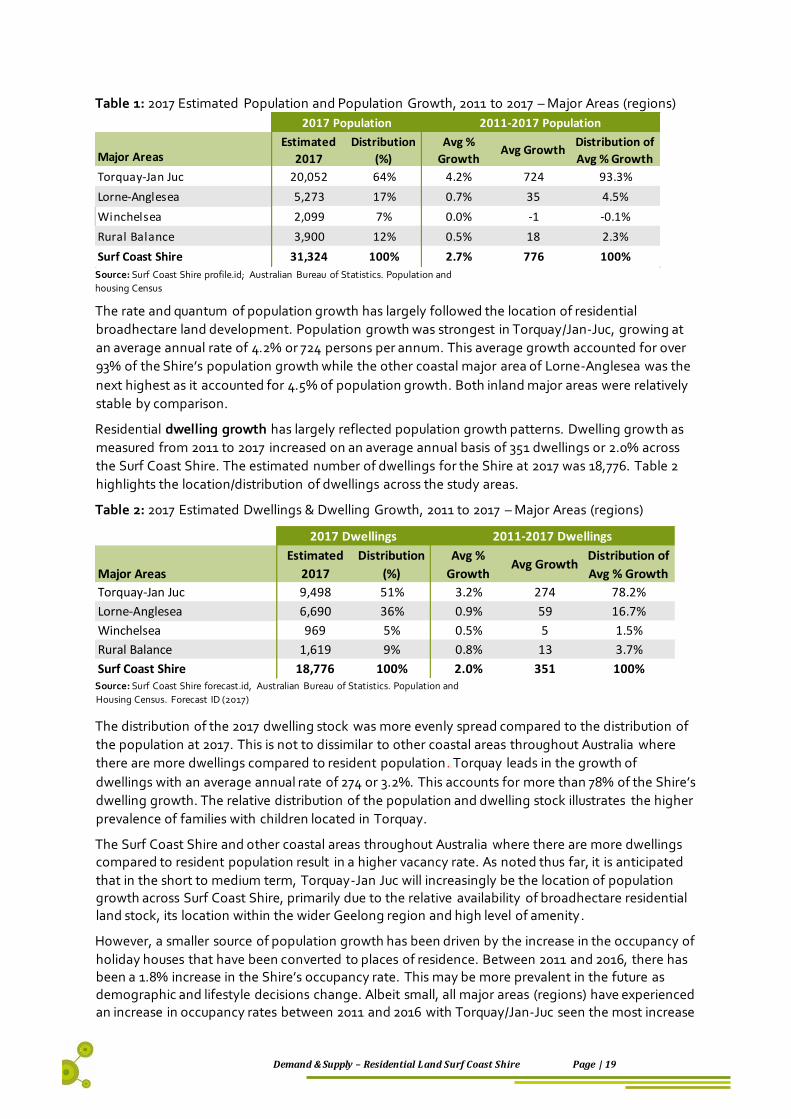
Table 1: 2017 Estimated Population and Population Growth, 2011 to 2017 – Major Areas (regions)
Table 2: 2017 Estimated Dwellings & Dwelling Growth, 2011 to 2017 – Major Areas (regions)
Table 3: Occupancy Rates, 2011 to 2016 – Study Areas
Table 4: Residential Subdivision Activity.
Table 5: Median values – Vacant residential lots, Surf Coast Shire and Greater Geelong and selected
localities
Table 6: Anticipated Broadhectare/Major Infill Lot Construction Activity, 2018
Table 7: Estimated Years of Broadhectare/Major Infill Residential Land Supply, 2018

Demand & Supply – Residential Land Surf Coast Shire Page | 5
LIST OF IMAGES
Image 1: Broadhectare Supply and Lot Construction
Image 2: Major Infill Supply and Lot Construction
Image 3: Dispersed Infill Supply and Construction
Image 4: Rural Residential Supply and Construction
Image 5: Residential Lot Construction Activity, Torquay/Jan-Juc – 2007 to 2018
Image 6: Dispersed Infill Lot Construction – Torquay/Jan-Juc region
Image 7: Zoned and Unzoned Broadhectare Land Supply Areas (Fragmentation), Torquay
Image 8: Surf Coast Shire - Average annual change of households without dependents, 2016 to
2036.
Image 9: Surf Coast Shire - Average annual change of households with dependents, 2016 to 2036
LIST OF MAPS Map 1: Surf Coast Shire and reporting geographies – Major Areas (regions), ABS 2016 Statistical
Areas Level 2 (SA2) and Vic In Future Statistical Areas 2016
Map 2: Anticipated Development Timing - Residential Broadhectare/Major Infill Land Stocks
(Torquay), 2018
Map 3: Anticipated Development Timing - Residential Broadhectare/Major Infill Land Stocks (Winchelsea), 2018

Demand & Supply – Residential Land Surf Coast Shire Page | 6
EXECUTIVE SUMMARY The following report provides a detailed assessment of the historic, current and future assessment
of residential land supply and demand cross the Surf Coast Shire.
This study considers recent activity, projected demand, and adequacy of supply in terms of
residential broadhectare and major infill land.
Historic Population and Dwelling Growth
Population Growth
Population growth has increased on an average annual basis of 2.7% or 776 persons per annum from 2011 to 2017. The estimated population in the Surf Coast Shire in 2017 was 31,324. The resident
population is located/distributed in:
• Torquay/Jan-Juc – 20,052 persons (64% share of total population base);
• Lorne/Anglesea – 5,273 persons (17% share of total population base);
• Winchelsea – 2,099 (7% share); and
• Rural Balance – 3,900 (12% share).
Dwelling Growth
Residential dwelling growth has largely reflected population growth patterns. Dwelling growth as measured from 2011 to 2017 increased on an average annual basis of 351 or 2.0% across the Shire. By
region:
• Torquay/Jan-Juc – 274 dwellings, 3.2% growth;
• Lorne/Anglesea – 59 dwellings, 0.9% growth;
• Winchelsea – 5 dwellings, 0.5% growth; and
• Rural Balance – 13 dwellings, 0.8% growth.
In terms of dwelling stock measured at 2017, there was:
• Torquay/Jan-Juc – 9,498 dwellings (51% share of total dwelling stock);
• Lorne/Anglesea – 6,690 dwellings (36% share of total dwelling stock);
• Winchelsea – 969 (5% share); and
• Rural Balance – 1,619 (9% share).
Residential Development Activity
Residential Building Approvals As measured from 2002/03 to 2017/18 (FYTD), residential building approvals within Surf Coast Shire averaged 427 per annum. Annual building approval activity have been relatively consistent ranging
from an average of 444 between 2002 to 2009, to 394 from 2011 to 2018 (FYTD). The 2017/18 FYTD data suggest that it could experience a similar high peak likened to 2004/2005.
In the last three years, residential building approval activity has averaged approximately 460 per annum.
Residential Lot Construction
From 2007 to 2018 residential lot construction activity has averaged 365 per annum. However, in the last five years, residential lot construction activity has averaged 402. Lot construction activity peaked at 720 in 2016, declining to 140 in 2017 and is illustrating significant volumes at 607 in the
current financial year.

Demand & Supply – Residential Land Surf Coast Shire Page | 7
Of the lot construction activity measured in the last five years:
• 5% was rural residential (20 lots per annum);
• 5% was major infill (20 lots per annum);
• 19% was dispersed/minor infill (75 lots per annum); and
• 71% was broadhectare (287 lots per annum).
Residential lot construction activity over the last five years was concentrated within the Torquay/Jan-Juc region at 85% of all lot activity or 340 lots per annum. Of the remaining lot
construction activity:
• 9% was located in the Lorne/Anglesea region (average of 35 per annum);
• 6% in the Winchelsea region (23 per annum); and
• 1% in the Rural Balance region (4 per annum).
Minor Infill Lot Construction Over the last three years, the majority of minor infill lot construction activity (57%) was sized less than
500 sqm. Nearly 34% of minor infill lot construction resulted in lots sized greater than 600 sqm. These ‘larger’ lots were typically constructed outside of the Torquay/Jan-Juc region.
Broadhectare/Major Infill Lot Construction Of the broadhectare lot construction activity in the last five years:
• 2% were compact (sized less than 300 sqm);
• 58% were suburban (sized 300 to 500 sqm);
• 37% were large suburban (500 to 1,000 sqm); and
• 3% low density suburban (over 1,000 sqm).
This large diversity of lot size ranges has been a response by the development industry and the Surf Coast Shire council to affordability/pricing points, consumer preferences and land use planning
objectives.
There is a general trend of increasing densities of broadhectare lot construction activity. In 2009, the median size of a constructed broadhectare lot was 653 sqm, declining to around 450 sqm in
recent times. Current broadhectare lot construction densities across Surf Coast are comparable to that across the municipal area of Geelong.
Residential Vacant Land Sales Pricing
Since 2007, the median sales value of vacant residential lots has modestly increased in Surf Coast Shire from $200,000 in 2007 to $278,000 in 2017 – an annual average growth of 3.4% per annum.
During this period, Greater Geelong increased from $142,000 to $205,000 – an annual average growth of 3.7% per annum.
From a pure price perspective, the broadhectare land market in Torquay has attracted a higher
premium compared to all areas in the Greater Geelong and Surf Coast region. Although there is diversity within inland localities and those closer to Geelong, Torquay has continued to attract higher values despite the continued growth of neighbouring areas of Armstrong Creek and Mount
Duneed.

Demand & Supply – Residential Land Surf Coast Shire Page | 8
Residential Land Supply Broadhectare & Major Infill Land Stocks In total, the Surf Coast Shire currently has capacity for the future provision of approximately 6, 773 additional dwellings (including areas that are as yet, not zoned for residential development
purposes), in broadhectare/major infill sites.
This capacity is comprised of:
• 4,131 unzoned broadhectare lots (61% of supply); and
• 2,642 zoned broadhectare lots (39% of supply).
Feedback from the development industry regarding their market expectations and development
intentions suggests that over the next five years on average, 416 lots/dwellings per annum will be constructed within existing zoned broadhectare/major infill sites. Historically, over the last three years, broadhectare/major infill lot construction has averaged 382 per annum. It is expected and
highly probable that this level of anticipated development activity will likely occur.
Rural Residential As at November 2017 across the Surf Coast municipal area there was a total lot stock of 1,205 rural
residential allotments. Of this stock only 127 lots (11%) were vacant. The majority (61%) of the rural residential lot stock is located in the Torquay/Jan-Juc region.
Approximately 51% of the rural residential lot stock (both occupied and vacant) is less than one hectare in size. Only 13% of the rural residential lot stock (or 151 lots) is sized greater than three hectares.
There are currently two areas identified for future Low Density Residential (LDRZ) land stocks, they are currently zoned Farm (FZ). One is located in Moriac (11.5 hectares) and the other in Torquay (38 hectares).
Projected Housing Demand Spatial Economics have developed a number of projected demand scenarios based on the most
recently available evidence. These demand scenarios are outlined below.
Scenario One: idForecast – dwelling forecasts undertaken for the Shire of Surf Coast by ForecastID. Dwelling requirements from 2016 to 2031 at 382 per annum or 1.8% per annum
growth rate (note this is trend growth as illustrated from 2011 to 2016).
Scenario Two: VIF2016 – current State Government dwelling projections. Dwelling
requirements from 2016 to 2031 at 392 per annum or 1.9% per annum growth rate.
Scenario Three: Recent Trend – based on actual recent trend growth over the last three years continuing to 2031 and being constant. Dwelling requirements from 2016 to 2031 at 490 per
annum or 2.3% per annum growth rate would result.
The largest and fastest growth in households across the Surf Coast Shire will be households with no
children (lone person and couples without children households), growing at an average annual rate of 2.5% or 201 households per annum from 2016 and 2036. This household type is projected to represent 57% of the change in household structure to 2036.
The next largest (in terms of absolute growth) is households with children (couples with kids & single parent families), projected to grow at 96 households per annum or a 1.7% growth rate, with the larger gain expected to occur between 2026 and 2036.
The Victorian State Government has modified the FHOG to increase the FHOG to $20,000 for eligible first-home buyers who buy or build their new home valued up to $750,000 in regional
Victoria. The Surf Coast Shire is defined as a regional area for the purpose of the FHOG.

Demand & Supply – Residential Land Surf Coast Shire Page | 9
Expressed demand levels for housing will increase during the implementation of the newly structured FHOG across Surf Coast. However, once this cease, the level of expressed housing
demand will be normalised (based on natural increase, household formation and population migration levels i.e. underlying demand).
Adequacy of Land Stocks Years Supply – Broadhectare & Major Infill In terms of zoned broadhectare/major infill residential land stocks it is estimated based on the
identified supply and projected demand scenarios, there are sufficient land stocks to satisfy between 5 to 7 years of demand across the Surf Coast municipality.
In addition, there are sufficient unzoned broadhectare/major infill residential land stocks (this includes the Spring Creek land release area) to satisfy between 9 to 12 years of demand.
Spatial Economics consider that the total stock of zoned broadhectare residential land is sufficient to
meet short-term requirements. However, in the interests of maintaining both a competitive land supply market and meeting underlying dwelling requirements, it is recommended that the stock of
zoned broadhectare residential land be increased in the short term.

Demand & Supply – Residential Land Surf Coast Shire Page | 10
1.0 Introduction 1.1 Context The following report is a residential land supply and demand assessment for the Surf Coast Shire.
The assessment includes:
• the identification of historical and current residential lot construction activity by supply type
and location;
• identification of all zoned and unzoned major residential land supply stocks including
estimates of lot yields on a project by project basis;
• identification of anticipated broadhectare/major infill residential lot construction activity
(development timing);
• examination of the quantum and composition of future residential demand;
• presentation of potential future demand scenarios; and
• estimation of the years of supply of undeveloped broadhectare and major infill residential
land stocks.
The assessment provides a robust and transparent assessment of the supply and demand for residential land across Surf Coast. Where appropriate, comparisons to other regional Victorian municipalities/urban centres are provided to further inform the relative ‘state of play”. The
assessment will facilitate informed decision making in terms of the existing and future broadhectare residential land supply requirements.
In addition, the information will be of assistance to other related planning processes such as
infrastructure and service planning.
1.2 Purpose The monitoring of land supply is a key tool to assist in the management and development of growth
across the Surf Coast Shire. The primary purpose of monitoring residential land supply is to improve the management of urban growth by ensuring that council, public utilities, government and the development industry have access to up-to-date and accurate information on residential land availability, development trends, new growth fronts, and their implications for planning and
infrastructure investment.
The following report provides accurate, consistent and updated intelligence on residential land
supply, demand and consumption. This in turn assists decision-makers in:
• maintaining an adequate supply of residential land for future housing purposes;
• providing information to underpin strategic planning in urban centres;
• linking land use with infrastructure and service planning and provision;
• taking early action to address potential land supply shortfalls and infrastructure constraints;
and
• contributing to the containment of public sector costs by the planned, coordinated
provision of infrastructure to service the staged release of land for urban development.
2.0 Approach & Scope The following provides a brief outline of the major methodologies and approach in the assessment
of recent residential lot construction, residential land supply areas, dwelling demand scenarios and
determination of assessing adequacy of residential land stocks.

Demand & Supply – Residential Land Surf Coast Shire Page | 11
The methodology that Spatial Economics has employed for this project is based on the simple
premise of matching the supply type with demand. This methodology assesses recent construction
and future supply using the same criteria with the supply type definitions based on outcomes and
on a lot by lot basis rather than administrative boundaries.
The methodology used by Spatial Economics is consistent with other State Government
methodologies around Australia, including the Victorian State Governments Regional Urban
Development Program. The criteria used to define the supply types are explained below.
Future Dwelling Requirements
The Victorian State Government population and household projections undertaken by the
Department of Environment, Land, Water & Planning (VIF2016) provide a sound basis for potential
dwelling growth requirement projections as they are developed in the context of State population
growth.
Population and dwelling projections undertaken by id Consulting commissioned by Surf Coast Shire
are also included as a possible future demand scenario.
In addition, alternative dwelling demand scenarios are presented based on actual recent growth
trends and the scenario of sustained high growth.
Land Supply Type Definitions
1. Broadhectare is defined as residential development on greenfield sites (sites that have not
been used previously for urban development purposes or previously subdivided for
normal/urban density development) and typically located on/or near the urban fringe.
2. Major Infill is defined by development or capacity greater than 10 lots/dwellings per site
within the established urban area. There is often debate and “shades of grey” to the
difference of major infill and broadhectare. Often, major infill can be described as remnant
broadhectare i.e. greenfield land left undeveloped and urban development subsequently
surrounding the site. Major infill sites are also characterised by having had no previous
urban use/ activity.
3. Dispersed Infill is from a lot/dwelling construction perspective, residential development
occurring within the established urban area (not on broadhectare or major infill sites) that
yield less than 10 dwellings per individual construction project. Typically, it entails
‘backyard’ style subdivision projects.
4. Rural Residential is from a dwelling construction perspective, all activity on land zoned
Rural Residential and Low Density Residential.

Demand & Supply – Residential Land Surf Coast Shire Page | 12
The images below illustrate the supply types.
Image 1: Broadhectare Supply and Lot Construction
Image 2: Major Infill Supply and Lot Construction

Demand & Supply – Residential Land Surf Coast Shire Page | 13
Image 3: Dispersed Infill Supply and Construction
Image 4: Rural Residential Supply and Construction

Demand & Supply – Residential Land Surf Coast Shire Page | 14
Geography
The following geographic areas are utilised for the land supply assessment and demographic
analysis.
Map 1: Surf Coast Shire and reporting geographies – Major Areas (regions), ABS 2016 Statistical
Areas Level 2 (SA2) and Vic In Future Statistical Areas 2016
Major Areas (regions): These areas are derived by Spatial Economics and includes the localities of Torquay -Jan Juc, Lorne- Anglesea, Winchelsea and Rural Balance. These Major Areas (regions) are utilised to assess both the projected demand and supply of residential land stocks.
2016 ABS SA2: Australian Bureau of Statistics geographic definition that are a general-purpose
medium sized area built from whole SA1s. Their aim is to represent a community that interacts together socially and economically. Surf Coast Shire comprises of three SA2 areas and with Lorne-Anglesea and Winchelsea SA2s geographically larger than the Major Areas (regions). The Torquay SA2 is slightly smaller than the corresponding major area (region) as it excludes a rural portion to its
east. When combined, the 2016 SA2s are do not match the 2016 Surf Coast LGA.
VIFSAs: Victoria in Future (VIF) is now published for a series of newly-developed geographic areas
known as Victoria in Future Small Areas (VIFSA). VIFSAs are based on SA2s but adjusted so as to be
exact subsets of LGAs. In some cases, SA2s are aggregated, some are split, and a small number of

Demand & Supply – Residential Land Surf Coast Shire Page | 15
VIFSAs are identical to SA2s. Surf Coast Shire comprises two VIFSAs – Torquay/Jan Juc and Surf
Coast Rural.
Residential Lot Construction
Residential lot construction has been determined via the assessment of the residential cadastre and
the application of this cadastre to the land supply types identified above.
A constructed lot is defined by the year of construction and the finalisation of certificate of title.
Lot construction is only captured if it is for residential purposes.
It is noted, where new lot construction occurs (typically within mixed use type zones) and one lot
results in multiple dwellings, the dwelling count is collected. Lot construction from the following
assessment will largely result in one net additional dwelling.
Construction activity has been assessed on an annual financial year basis from 2007 to 2018.
Lot and dwelling construction has been undertaken for the following supply types:
• Rural Residential;
• Dispersed Infill;
• Major Infill; and
• Broadhectare.
Lot Yields Lot yields on a site basis has been undertaken for only broadhectare and major infill residential
supply.
In establishing the lot yield for each individual land parcel, the following information was used:
incidence and location of native vegetation, zoning, natural features such as creeks, escarpments,
floodways, localised current/recent market yields, ability to be sewered, existing studies such as
structure plans.
In addition to site specific issues, ‘standard’ land development take-outs are employed, including
local and regional. The amount/proportion of such take-outs are dependent on the land parcel i.e. a
1ha site will have less take-outs than say a 50ha site. Further intelligence and verification is sourced
from the local land development industry and Council officers.
Years of Supply
With the amount of supply and demand estimated, adequacy is described in years of supply. For
example, it can be stated that there are X years of supply based on projected demand within a given
geographic area.
In assessing the number of years of major residential land supply (broadhectare and major infill),
only a component of the total projected demand is apportioned to estimate future demand. The
remainder is apportioned for future demand of other forms of residential supply such as dispersed
infill and rural residential.

Demand & Supply – Residential Land Surf Coast Shire Page | 16
3.0 Population and Dwelling Growth
Key Findings
Population growth has been particularly strong across Surf Coast Shire, growing at an annualised
rate of 2.7% or 776 persons from 2011 to 2017. This population growth rate is significantly higher
than its regional counterparts, Greater Ballarat (1.7%) and Greater Geelong (2.1%).
The most significant annual average population growth between 2011 and 2017 occurred in the
following major areas:
- 4.2% or 724 persons per annum in Torquay-Jan Juc;
- 0.7% or 35 persons per annum in Lorne-Anglesea; and
- 0.5% or 18 persons per annum in Rural Balance.
Torquay-Jan Juc accounted of over 93% of the population gain in the Shire between 2011 and 2017.
Dwelling growth has largely reflected population growth, growing at an annualised rate of 2.0% or
351 dwellings per annum from 2011 to 2017.
The most significant annual average dwelling growth between 2011 and 2017 occurred in the
following major areas:
- 3.2% or 274 dwellings in Torquay-Jan Juc;
- 0.9% or 59 dwellings in Lorne-Anglesea; and
- 0.8% or 13 dwellings in Rural Balance.
Torquay accounted for nearly 80% of dwelling growth within the Shire between 2011 and 2017.
In terms of dwelling stock measured at 2017, major areas with the most significant dwelling stocks:
- 9,498 dwellings located in Torquay-Jan Juc – 51% of the Shire’s dwelling stock;
- 6,690 dwellings located in Lorne-Anglesea– 36% of the dwelling stock;
- 1,619 dwellings located in Rural Balance – 9% of the dwelling stock; and
- 969 dwellings located in Winchelsea – 5% of the dwelling stock.
The following section of the report details actual population and dwelling growth for Surf Coast and its composite small areas. In addition, where appropriate, comparison to other Victorian
municipalities/urban centres is undertaken.
3.1 Historical Population Growth Historical Population – Surf Coast SA2 areas
The following assessment of historical population growth is sourced from the Australian Bureau of
Statistics Estimated Resident Population (ERPs) publication. The Torquay, Lorne-Anglesea and
Winchelsea population estimates are collected at an ABS SA2 level.
Although the Surf Coast SA2 areas are slightly inconsistent with the major areas (regions), it is still
highly valuable as a source to examine historic rates of population growth and comparative
population growth to other jurisdictions.
The ERP is calculated each year by the ABS and re-based after each Census with revised (final)
estimates then re-published for the preceding five years. Most LGA level projections use ERPs as a
base, rather than Census counts. Census data is great for telling us about the characteristics of the
population, while ERPs are a better measure of the total number of people who normally reside in
an area.

Demand & Supply – Residential Land Surf Coast Shire Page | 17
The most recent estimate of the Surf Coast’s population is 31,324 people at 30 June 2017. The
population grew by 879 people (2.9%) from the 30 June 2016 figure. This figure is the last available
preliminary population estimate before all Estimated Resident Population (ERPs) are rebased in late
2018 using data from the 2016 Census and the preliminary 2017 total.
Historically, the Surf Coast Shire has consistently exceeded the growth rates experienced in Greater
Geelong. Noteworthy is the significant higher annual growth rates in Surf Coast compared to
metropolitan Melbourne during the 2005 to 2012 period. In the last five years, the Shire’s growth
rate has been relatively stable and are comparable to those of metropolitan Melbourne.
Graph 1: Estimated Resident Population Annual Growth Rate, 2001 to 2017 (%) – Surf Coast Shire,
Greater Melbourne, Greater Geelong and Rest of Victoria
Source: Australian Bureau of Statistics. Estimated Resident Population
Note: Rest of Victoria excludes Greater Geelong
During the 2011-2016 period, Surf Coast Shire experienced net gains from across metropolitan
Melbourne with the largest coming from Wyndham City (198 persons), Moonee Valley City (106)
and Hobsons Bay (104). Meanwhile, there was an overall net loss to Greater Geelong (nearly 500
people) between 2011 to 2016.
The majority of the population loss to Greater Geelong were people aged 12 to 34 years. This
suggests the departure of school aged and young adults moving to Greater Geelong for education
(secondary and tertiary) and to access services and employment opportunities. In contrast, the
Shire experienced some gain of people aged over 35 years between 2011 and 2016.
Historical Population – A Comparison
Surf Coast Shire, particularly the Torquay SA2, has shown strong and increasing growth in
population in recent years. The resident population growth rate of Torquay compared to two major
regional centres – Geelong and Ballarat are significantly greater. Torquay from 2011 to 2017 grew at
an average annual rate of 4.2% compared to Ballarat at 1.7% and Geelong at 2.1%.
0.0%
0.5%
1.0%
1.5%
2.0%
2.5%
3.0%
3.5%
4.0%
4.5%
An
nu
al G
row
th R
ate
%
YearsSurf Coast Shire Greater Melbourne Greater Geelong Rest of Victoria

Demand & Supply – Residential Land Surf Coast Shire Page | 18
Graph 2: Estimated Resident Population Growth Rate, 2011 to 2017 (%) – Surf Coast SA2s Vs Selected Jurisdictions
* Includes Jan Juc area
Source: Australian Bureau of Statistics. Estimated Resident Population
The Torquay and Grovedale SA2s (4.1%) had similar population growth rates for this period.
Grovedale SA2 is adjacent to Torquay SA2 and features the development fronts of Armstrong Creek (part), Marshall and Grovedale. The SA2 areas of Lorne-Anglesea and Winchelsea experienced significantly lower growth rates compared to the Torquay SA2 (less than 1% combined).
Melton and Wyndham LGAs – designated growth areas of metropolitan Melbourne experienced
population growth rates of 4.8% and 6.4% respectively between 2011 and 2017.
3.2 Historical Population, Dwelling Growth – Major Areas (regions) Analysis has been undertaken to further understand the dynamics of recent population growth,
dwelling construction across the four major areas of Torquay-Jan Juc, Lorne-Anglesea, Winchelsea
and Rural Balance. Australian Bureau of Statistics data from the 2011 and 2017 Census along with
population and dwellings information from .id consulting has been used to identify the scale of
recent population and dwelling change by these study areas.
Population & Dwelling Change – Study Areas
Rates of population and dwelling growth across Surf Coast Shire has been strong as measured from
2011 to 2017.
Population growth has increased on an average annual basis of 2.7% or 776 persons per annum.
The estimated population in Surf Coast Shire is 2017 was 31,324. The location/distribution of the
2017 estimated resident population is shown in Table 1.
0.0%
1.0%
2.0%
3.0%
4.0%
5.0%
6.0%
7.0%
Ballarat LGA GreaterGeelong LGA
Bacchus MarshSA2
Grovedale SA2 Melton LGA Wyndham LGA
Gro
wth
Rat
e %
Areas
Torquay Lorne - Anglesea Winchelsea Surf Coast (S)
Demand & Supply – Residential Land Surf Coast Shire Page | 19
Table 1: 2017 Estimated Population and Population Growth, 2011 to 2017 – Major Areas (regions)
Source: Surf Coast Shire profile.id; Australian Bureau of Statistics. Population and
housing Census
The rate and quantum of population growth has largely followed the location of residential
broadhectare land development. Population growth was strongest in Torquay/Jan-Juc, growing at
an average annual rate of 4.2% or 724 persons per annum. This average growth accounted for over
93% of the Shire’s population growth while the other coastal major area of Lorne-Anglesea was the
next highest as it accounted for 4.5% of population growth. Both inland major areas were relatively
stable by comparison.
Residential dwelling growth has largely reflected population growth patterns. Dwelling growth as
measured from 2011 to 2017 increased on an average annual basis of 351 dwellings or 2.0% across
the Surf Coast Shire. The estimated number of dwellings for the Shire at 2017 was 18,776. Table 2
highlights the location/distribution of dwellings across the study areas.
Table 2: 2017 Estimated Dwellings & Dwelling Growth, 2011 to 2017 – Major Areas (regions)
Source: Surf Coast Shire forecast.id, Australian Bureau of Statistics. Population and
Housing Census. Forecast ID (2017)
The distribution of the 2017 dwelling stock was more evenly spread compared to the distribution of
the population at 2017. This is not to dissimilar to other coastal areas throughout Australia where
there are more dwellings compared to resident population. Torquay leads in the growth of
dwellings with an average annual rate of 274 or 3.2%. This accounts for more than 78% of the Shire’s
dwelling growth. The relative distribution of the population and dwelling stock illustrates the higher
prevalence of families with children located in Torquay.
The Surf Coast Shire and other coastal areas throughout Australia where there are more dwellings compared to resident population result in a higher vacancy rate. As noted thus far, it is anticipated
that in the short to medium term, Torquay-Jan Juc will increasingly be the location of population growth across Surf Coast Shire, primarily due to the relative availability of broadhectare residential land stock, its location within the wider Geelong region and high level of amenity.
However, a smaller source of population growth has been driven by the increase in the occupancy of
holiday houses that have been converted to places of residence. Between 2011 and 2016, there has been a 1.8% increase in the Shire’s occupancy rate. This may be more prevalent in the future as demographic and lifestyle decisions change. Albeit small, all major areas (regions) have experienced an increase in occupancy rates between 2011 and 2016 with Torquay/Jan-Juc seen the most increase
Major AreasEstimated
2017
Distribution
(%)
Avg %
GrowthAvg Growth
Distribution of
Avg % Growth
Torquay-Jan Juc 20,052 64% 4.2% 724 93.3%
Lorne-Anglesea 5,273 17% 0.7% 35 4.5%
Winchelsea 2,099 7% 0.0% -1 -0.1%
Rural Balance 3,900 12% 0.5% 18 2.3%
Surf Coast Shire 31,324 100% 2.7% 776 100%
2011-2017 Population2017 Population
Major Areas
Estimated
2017
Distribution
(%)
Avg %
GrowthAvg Growth
Distribution of
Avg % Growth
Torquay-Jan Juc 9,498 51% 3.2% 274 78.2%
Lorne-Anglesea 6,690 36% 0.9% 59 16.7%
Winchelsea 969 5% 0.5% 5 1.5%
Rural Balance 1,619 9% 0.8% 13 3.7%
Surf Coast Shire 18,776 100% 2.0% 351 100%
2017 Dwellings 2011-2017 Dwellings

Demand & Supply – Residential Land Surf Coast Shire Page | 20
during this period. Noteworthy is the significantly lower occupancy rate in Torquay-Jan Juc at 2016 compared to rates in Winchelsea and the Rural Balance.
Table 3: Occupancy Rates, 2011 to 2016 – Study Areas
Source: Surf Coast Shire profile.id; Australian Bureau of Statistics. Population and Housing Census
Key Issues
Whilst the Surf Coast Shire experienced moderate/strong growth in the last decade, it is Torquay-
Jan Juc that continues to experience the strongest population and housing growth. This growth is
comparable to some areas found on the peri-urban areas of metropolitan Melbourne (Melton) and
Greater Geelong (Grovedale). Torquay-Jan Juc’s coastal lifestyle, access to Geelong and residential
land availability has made it highly desirable in the past decade. There are no socio-demographic
factors that would indicate that this strong underlying demand will not continue. With increasing
rates of population growth, it is imperative that strategic land use policy plans for a range of
possible future demand levels.
Major Areas2011 2016
Difference
(%)
Torquay-Jan Juc 70.6% 72.3% 1.7%
Lorne-Anglesea 31.3% 32.0% 0.7%
Winchelsea 87.0% 87.1% 0.1%
Rural Balance 83.2% 83.9% 0.7%
Surf Coast Shire 57.8% 59.6% 1.8%
Occupancy Rates

Demand & Supply – Residential Land Surf Coast Shire Page | 21
4.0 Recent Residential Development Activity
Key Findings
Development Activity As measured from 2002/03 to 2017/18 (FYTD), residential building approvals within Surf Coast
Shire averaged 427 per annum. Annual building approval activity have been relatively consistent ranging from an average of 444 between 2002 to 2009, to 394 from 2011 to 2018 (FYTD). The
2017/18 FYTD data suggest that it could experience a similar high peak likened to 2004/2005.
In the last three years, residential building approval activity has averaged approximately 460 per annum.
The vast majority of building approvals (92%) since 2002/03 have been for separate houses with the residual being semi-detached dwellings/units/apartments.
From 2007 to 2018 residential lot construction activity has averaged 365 per annum. However, in
the last five years, residential lot construction activity has averaged 402. Lot construction activity peaked at 720 in 2016, declining to 140 in 2017 and is illustrating significant volumes at 607 in the
current financial year.
Of the lot construction activity measured in the last five years: 5% was rural residential (20 lots per annum); 5% was major infill (20 lots per annum); 19% was dispersed/minor infill (75 lots per
annum); and 71% was broadhectare (287 lots per annum).
Residential lot construction activity over the last five years was concentrated within the
Torquay/Jan-Juc region at 85% of all lot activity or 340 lots per annum. Of the remaining lot construction activity:
• 9% was located in the Lorne/Anglesea region (average of 35 per annum);
• 6% in the Winchelsea region (23 per annum); and
• 1% in the Rural Balance region (4 per annum).
Over the last three years, the majority of minor infill lot construction activity (57%) was sized less than 500 sqm. Nearly 34% of minor infill lot construction resulted in lots sized greater than 600 sqm.
These ‘larger’ lots were typically constructed outside of the Torquay/Jan-Juc region.
Of the minor infill lots constructed 72% yielded two or over net lots/dwellings, 10% of lot
construction activity was within projects yielding 6 to 9 dwellings. Approximately 50% of all dispersed infill projects were sourced from parent lots sized from 500 to 1,200 sqm.
As previously outlined, broadhectare lot construction activity has averaged 287 lots per annum
over the last five years. Over the last three years, broadhectare lot construction has increased substantially to an average of 369 per annum. Of the broadhectare lot construction activity in the last five years:
• 2% were compact (sized less than 300 sqm);
• 58% were suburban (sized 300 to 500 sqm);
• 37% were large suburban (500 to 1,000 sqm); and
• 3% low density suburban (over 1,000 sqm).
Vacant Residential Lot Sales Activity
The median sales value of a vacant residential allotment in 2017 was: - $278,000 across the Surf Coast Shire); - $281,000 in Torquay;
- $158,000 in Winchelsea; - $185,000 in Armstrong Creek; and
- $240,000 in Ocean Grove

Demand & Supply – Residential Land Surf Coast Shire Page | 22
Section 4.0 of this report details the recent activity of residential lot construction and dwelling
approvals in Surf Coast Shire. Residential lot construction activity is detailed from 2007 to 2018.
This section of the report details residential lot construction by location, supply type, achieved
densities, project size/yield and sales pricing of constructed residential lots.
Where appropriate, comparisons to other regional Victorian jurisdictions is included.
4.1 Residential Building Approvals Although Surf Coast had a peak in 2004/05 of nearly 600 residential dwellings approved, residential
building approval activity has been relatively consistent ranging approximately 400 to 450 dwellings
per annum since 2002. Albeit slightly lower since 2011 at 394 approvals per annum, there was a
fundamental and consistent upward shift in the volume of approval activity in the last two years.
Please note that the 2017/18 building approvals data is incomplete and is the financial year-to-date
at May 2018.
This consistent demand for new housing is consistent with population data from the Census.
The vast majority of building approvals (92%) since 2002/03 have been for separate houses with the
residual being semi-detached dwellings/units/apartments. This proportion of non-separate
dwellings has consistently remained under 10% since 2006. Prior to this, medium density dwelling
approvals peaked at 16% of all approval activity in 2004/05 and 14% the year after. Graph 3
illustrates residential dwelling approval activity by type for the Surf Coast Shire.
Graph 3: Residential Building Approvals by Type – Surf Coast Shire
* 2017-2018 Financial year to date (to May 2018) Source: Australian Bureau of Statistics
Since 2011, the Surf Coast municipality has averaged 394 building approvals per annum with
2017/18* being the highest peak (at 536 approvals) since 2004/2005.
An examination of ABS SA2 dwelling approvals data from 2011 to 2018 (FYTD) reveals most of these
building approvals have been for separate houses in Torquay with a significant increase from 202
dwellings in 2012/13 to nearly 300 dwellings in 2014/2015. Total approvals in the Torquay SA2 in
2017/2018* has exceeded the Shire’s annual average of 394 approvals at 404. This dominance is
2002-2009
Avg. 444 p.a2011-2015
Avg. 346 p.a
0%
2%
4%
6%
8%
10%
12%
14%
16%
18%
0
100
200
300
400
500
600
700
% m
ediu
m d
ensi
ty &
oth
er
Bu
ildin
g A
pp
rova
ls
Year
Separate Houses Medium Density & Other
Total Average
2016 to 2018*
Avg.458

Demand & Supply – Residential Land Surf Coast Shire Page | 23
consistent with the population and dwelling growth in the previous section of this report. Graph 4
illustrates building approval activity by type for all the SA2s in Surf Coast Shire.
Graph 4: Residential Building Approvals by ABS SA2s - 2011 to 2018 (FYTD)
* 2017-2018 Financial year to date (to May 2018)
Source: Australian Bureau of Statistics
Lorne-Anglesea comprised of the second most number of approvals for separate houses since 2011
with its scale been consistent at approximately 50-60 dwellings per annum. Building approvals in
Winchelsea made up an average of 8% of total residential building approvals between 2011 and
2018* and were all for separate houses.
2011-2018*
Avg. 394 p.a
0
100
200
300
400
500
600
2011-2012 2012-2013 2013-2014 2014-2015 2015-2016 2016-2017 2017-2018*
Bu
ildin
g A
pp
rova
ls
Year
Torquay - Houses Torquay - Medium Density
Lorne-Anglesea - Houses Lorne-Anglesea - Medium Density
Winchelsea - Houses Winchelsea - Medium Density

Demand & Supply – Residential Land Surf Coast Shire Page | 24
4.2 Residential Lot Construction Analysis has been undertaken to determine, on a lot by lot basis, the location and amount of
residential lot construction across the municipal area of Surf Coast by financial year from 2007 to
2018. Lot construction activity has been classified into distinct supply types and/or supply locations.
Compared to building approvals, residential lot construction is markedly more cyclical. From 2007 to
2018 residential lot construction activity has averaged 365 per annum. However, in the last five
years, residential lot construction activity has averaged 402. Lot construction activity peaked at 720
in 2016, declining to 140 in 2017 and is illustrating significant volumes at 607 in the current financial
year.
In the last three years, residential lot construction activity across the municipality has averaged 490.
Of the lot construction activity measured in the last five years:
• 5% was rural residential (20 lots per annum);
• 5% was major infill (20 lots per annum); •
• 19% was dispersed/minor infill (75 lots per annum); and
• 71% was broadhectare (287 lots per annum).
4.3 Location of Residential Development Activity Residential lot construction activity over the last five years was concentrated within the
Torquay/Jan-Juc region at 85% of all lot activity or 340 lots per annum. Of the remaining lot
construction activity:
• 9% was located in the Lorne/Anglesea region (average of 35 per annum);
• 6% in the Winchelsea region (23 per annum); and
• 1% in the Rural Balance region (4 per annum).
Table 4 below summarises the quantum of residential subdivision activity by location/financial year.
Table 4: Residential Subdivision Activity.
2014 2015 2016 2017 2018
Lorne-Anglesea 15 49 68 4 37
Rural Balance 1 7 7 3 3
Torquay-Jan Juc 305 130 612 119 536
Winchelsea 0 34 36 14 31
Surf Coast Shire 321 220 723 140 607 Source: Spatial Economics Pty Ltd
Image 5 below highlights the location of residential development activity across the Torquay/Jan-
Juc region from 2007 to 2018.

Image 5: Residential Lot Construction Activity, Torquay/Jan-Juc – 2007 to 2018
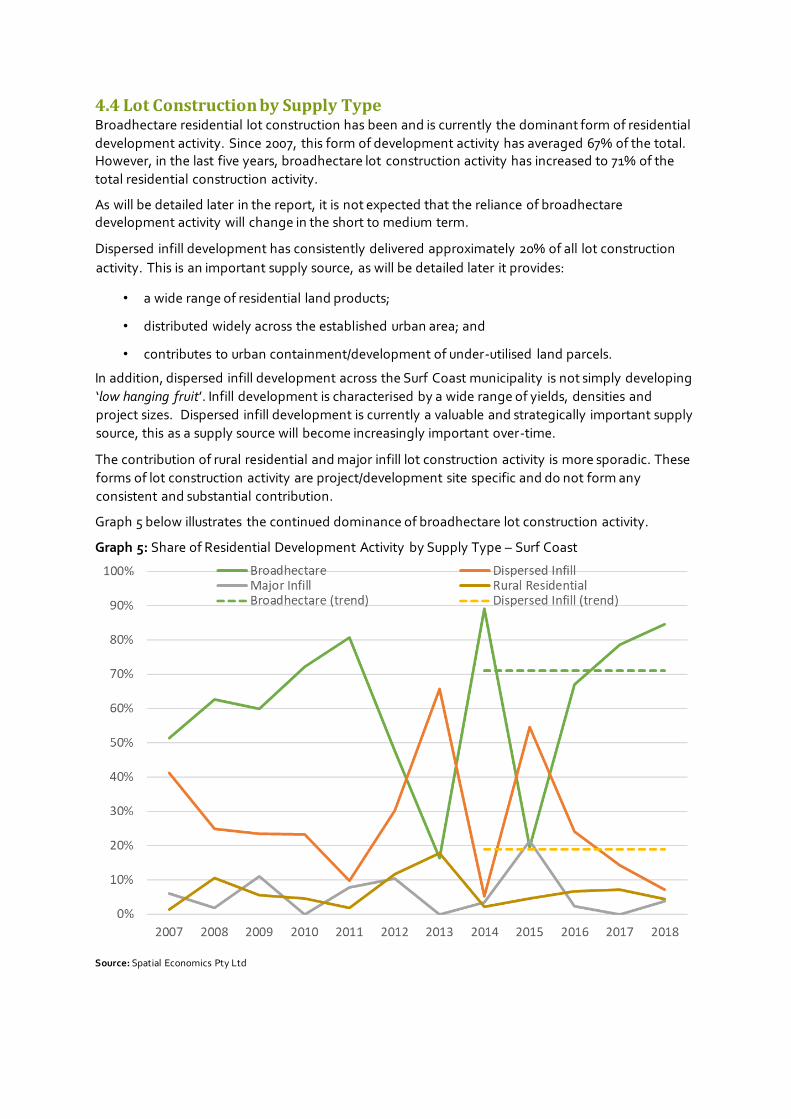
4.4 Lot Construction by Supply Type Broadhectare residential lot construction has been and is currently the dominant form of residential
development activity. Since 2007, this form of development activity has averaged 67% of the total. However, in the last five years, broadhectare lot construction activity has increased to 71% of the
total residential construction activity.
As will be detailed later in the report, it is not expected that the reliance of broadhectare development activity will change in the short to medium term.
Dispersed infill development has consistently delivered approximately 20% of all lot construction
activity. This is an important supply source, as will be detailed later it provides:
• a wide range of residential land products;
• distributed widely across the established urban area; and
• contributes to urban containment/development of under-utilised land parcels.
In addition, dispersed infill development across the Surf Coast municipality is not simply developing
‘low hanging fruit’. Infill development is characterised by a wide range of yields, densities and
project sizes. Dispersed infill development is currently a valuable and strategically important supply
source, this as a supply source will become increasingly important over-time.
The contribution of rural residential and major infill lot construction activity is more sporadic. These
forms of lot construction activity are project/development site specific and do not form any
consistent and substantial contribution.
Graph 5 below illustrates the continued dominance of broadhectare lot construction activity.
Graph 5: Share of Residential Development Activity by Supply Type – Surf Coast
Source: Spatial Economics Pty Ltd

Demand & Supply – Residential Land Surf Coast Shire Page | 27
4.5 Dispersed/Minor Infill Lot Construction The following provides an overview of the development outcomes of dispersed infill development
activity across the Surf Coast municipal area. Dispersed infill activity is a significant supply source
across the municipality, accounting for 19% of lot construction activity in the last five years. It is
important to understand the characteristics of dispersed infill development, so land use planning
policy can further enhance development outcomes and optimize this as a supply source in the
future.
4.5.1 Dispersed/Minor Infill Supply – Achieved Densities Dispersed infill lot construction activity across the Surf Coast municipality is achieving both 1) a
wide range of densities and 2) a high proportion of medium density land products.
The experience in Geelong, Ballarat, Bacchus Marsh and Melbourne suggests that as the supply of
larger parent lots decreases, and land prices continue to rise in the established urban area, the
development industry will find it profitable to re-subdivide smaller parent lots.
The size distribution of newly constructed minor infill lots is shown in the graph below.
In the last 3 years 26% of all minor infill development activity was sized less than 300 sqm,
compared to 22% from 2007 to 2015. The size of minor infill lot construction over the last 3 years is
slightly decreasing. It is suspected that in the short to medium term, this trend will likely to continue
in response to consumer demand, changing demographics and the cost of residential land.
Over the last three years, the majority of minor infill lot construction activity (57%) was sized less
than 500 sqm. Nearly 34% of minor infill lot construction resulted in lots sized greater than 600 sqm.
These ‘larger’ lots were typically constructed outside of the Torquay/Jan-Juc region. .
The graph below illustrates the lot size range for constructed dispersed infill lots across the Surf
Coast municipality.
Graph 6: Dispersed Infill - Achieved Lot Size Cohorts, 2007 to 2018
Source: Spatial Economics Pty Ltd

Demand & Supply – Residential Land Surf Coast Shire Page | 28
In summary dispersed infill lot construction across Surf Coast is characterised by medium density
outcomes and a diverse range of larger lot sizes.
4.5.2 Dispersed/Minor Infill Supply – Parent Lot Size Dispersed residential infill development across Surf Coast is primarily sourced from ‘moderately’
sized ‘parent’ lots, whether vacant or with an existing dwelling. The graph below illustrates the
‘parent’ lot size distribution for dispersed infill development.
Of particular strategic importance is the significant volume of dispersed infill projects sourced from
parent lots sized from 500 to 800 sqm and 800 to 1,200 sqm. Approximately 50% of all dispersed
infill projects were sourced from parent lots sized from 500 to 1,200 sqm. Dispersed infill projects
sourced from ‘parent’ lots sized greater than 2,000 sqm were typ ically located outside of the
Torquay/Jan-Juc region
This reliance on relatively smaller parent lot sizes (within Torquay/Jan-Juc) illustrates the significant
latent supply potential. There is not a significant reliance on ‘larger’ sized parent lots as a supply
source for dispersed infill residential development within Torquay/Jan-Juc region.
Note: - parent lot size refers to the size of the allotment prior to subdivision.
Graph 7: Parent Lot Size of Dispersed Infill Projects (Surf Coast Shire), 2007 to 2018
Source: Spatial Economics Pty Ltd
4.5.3 Dispersed/Minor Infill Supply – Project Size and Yield In addition to the 1) diverse lot sizes delivered and 2) significant proportion of medium density lot
size outcomes from dispersed infill development – dispersed infill development projects have
relatively ‘significant’ net lot yields (in the context of a municipality with the dominant form of land
supply sourced from greenfield land). This form of development can be categorised as typically
suburban backyard subdivision projects undertaken by the cottage building industry.
Of the dispersed infill lots constructed 72% yielded two or over net lots/dwellings, 10% of lot
construction activity was within projects yielding 6 to 9 dwellings.

Demand & Supply – Residential Land Surf Coast Shire Page | 29
Graph 8: Dispersed Infill Development – Lot Yield & Project Size Distribution, 2007 to 2018
Source: Spatial Economics Pty Ltd
Image 6: Dispersed Infill Lot Construction – Torquay/Jan-Juc region

Demand & Supply – Residential Land Surf Coast Shire Page | 30
4.6 Broadhectare Lot Construction As previously outlined, broadhectare lot construction activity has averaged 287 lots per annum over
the last five years. Over the last three years, broadhectare lot construction has increased
substantially to an average of 369 per annum.
As outlined previously broadhectare lot construction represents approximately 71% of all residential
lot construction activity across the municipality over the last five years. This contribution measured
over-time has been relatively consistent, however, in the last three years, it has increased to 75%.
Over the last five years, the vast majority (94%) of broadhectare lot construction activity was
located in the Torquay/Jan-Juc region.
4.6.1 Broadhectare Lot Construction – Diversity Lots constructed from broadhectare supply sources have produced a wide diversity of lot sizes.
Graph 9 below illustrates the diversity of lot construction.
Of the broadhectare lot construction activity in the last five years:
• 2% were compact (sized less than 300 sqm);
• 58% were suburban (sized 300 to 500 sqm);
• 37% were large suburban (500 to 1,000 sqm); and
• 3% low density suburban (over 1,000 sqm).
This large diversity of lot size ranges has been a response by the development industry and the Surf
Coast Shire council to affordability/pricing points, consumer preferences and land use planning
objectives.
The diversity of lot sizes has narrowed in recent times reflecting a general trend of increasing
densities of broadhectare lot construction. The proportion of lots sized between 300 and 500 sqm
increased from 26% to 61%. There has been a marked decline (from 46% to 12%) in the proportion
of lots sized above 600 sqm.
While consumer preference across Surf Coast has historically been for larger broadhectare lots,
price pressures have driven the recent expressed demand for smaller allotments. This has been
confirmed with the local land development industry.
Graphs 9 and 10 below illustrate both the median size and diversity of residential lot construction.
The median lot size of constructed broadhectare lots varies over-time (due to the development
outcomes of individual broadhectare land estates). However, there is a general trend of increasing
densities of broadhectare lot construction activity.
In 2009, the median size of a constructed broadhectare lot was 653 sqm, declining to around 450
sqm in recent times. Current broadhectare lot construction densities across Surf Coast are comparable to that across the municipal area of Geelong.

Demand & Supply – Residential Land Surf Coast Shire Page | 31
Graph 9: Broadhectare Lot Construction Size Distribution – Surf Coast Shire
Source: Spatial Economics Pty Ltd
Graph 10: Median Lot Size (sqm) – Broadhectare Lot Construction
Source: Spatial Economics Pty Ltd
4.6 Major Infill Lot Construction Major infill lot/dwelling construction activity can be essentially described as remnant broadhectare
development across the municipal area of Surf Coast. It is defined as developments, within the
established urban area, with a capacity greater than 10 lots/dwellings per site. There is often debate

Demand & Supply – Residential Land Surf Coast Shire Page | 32
and “shades of grey” to the difference of major infill and broadhectare. Often, major infill sites are
in effect broadhectare land left undeveloped as urban development proceeded on surrounding the
sites.
Major infill lot construction measured over the last five has represented 5% of all lot construction
activity.
Major infill development is characterised by slightly higher-density outcomes and relatively
‘significant’ project yields. As measured from 2013, the median lot/dwelling density by residential
supply type was:
• 476 sqm for broadhectare;
• 429 sqm for dispersed infill; and
• 427 sqm for major infill.
4.7 Rural Residential Lot Construction Rural residential lot construction activity over the last five years has represented 5% of all lot
construction activity across the municipal area – or 20 lots per annum
Nearly 80% of rural residential lot construction was in the Torquay/Jan-Juc region. The typical
constructed lot size was around 4,200 sqm.
4.8 Vacant Residential Lot Sales Pricing The sales value of vacant residential lots is a prime outcome indicator of the ‘state of the land
supply’ market. It is a simple measure that captures both supply and demand dynamics.
Since 2007, the median sales value of vacant residential lots has modestly increased in Surf Coast
Shire from $200,000 in 2007 to $278,000 in 2017 – an annual average growth of 3.4% per annum.
During this period, Greater Geelong increased from $142,000 to $205,000 – an annual average
growth of 3.7% per annum. Median price gains experienced in Wyndham City were reflective of
those experienced throughout metropolitan Melbourne as a whole. Between 2007 and 2017, there
was a:
• 6.1% average annual increase across metropolitan Melbourne;
• 3.7% average annual increase in Greater Geelong;
• 6.8% average annual increase in Wyndham City; and
• 3.4% average annual increase in Melton City.

Demand & Supply – Residential Land Surf Coast Shire Page | 33
Graph 11: Median Sales Values – Vacant residential lots, 2007-2017 – Surf Coast Shire Vs Selected
Jurisdictions
Source: Valuer General Victoria
Vacant lots in the Surf Coast Shire have historically sold at a premium compared to those in Greater
Geelong and metropolitan Melbourne. Between 2007 and 2017, vacant lots in the Shire would
attract on average a 40% premium compared to vacant lots sold in Greater Geelong. These vacant
lots would attract on average a 24% premium compared to vacant lots sold in metropolitan
Melbourne. Interesting is the decline of this premium against metropolitan Melbourne as median
vacant lot values in Melbourne has increased at a higher rate compared to the Shire from 2013
onwards.
Graph 12: % Price difference - Vacant residential lots, 2007-2017 – Surf Coast Shire Vs Metropolitan
Melbourne and Greater Geelong
Source: Valuer General Victoria
Analysis of vacant residential land sales values by locality within Greater Geelong and the Bellarine Peninsula illustrates Torquay’s premium on vacant residential lots compared to other development
$0
$50,000
$100,000
$150,000
$200,000
$250,000
$300,000
2007 2008 2009 2010 2011 2012 2013 2014 2015 2016 2017
Med
ian
pri
ces
$
Year
Metro. Melbourne Greater Geelong Wyndham City
Melton City Surf Coast Shire
0%
10%
20%
30%
40%
50%
60%
2007 2008 2009 2010 2011 2012 2013 2014 2015 2016 2017
Med
ian
pri
ce d
iffe
ren
ce %
Year
Premium Vs Geelong Premium Vs Metro. Melbourne
Avg. 10 yr Vs Geelong Avg. 10 yr Vs Metro. Melbourne

Demand & Supply – Residential Land Surf Coast Shire Page | 34
fronts in the region. Torquay peaked in 2011 as it reached a median value of $284,000. The release of residential lots in nearby Armstrong Creek (2010) and Mount Duneed (2012) around this time
may have caused a slight pullback in Torquay in 2012 and 2013 before values increased in 2014. Although Armstrong Creek and Mount Duneed both experienced slight declines during their third-
year of lot release, both localities have experienced gains in 2017 to surpass their initial median values at year one. Against Torquay, median values in Highton have been comparable in th e last 5 years (albeit a slight decline in 2017) while Ocean Grove has trended in a similar pattern since 2007
at consistent lower values.
Graph 13: Median Sales Values ($) – Vacant residential lots, 2007-2017 –Selected localities
Source: Valuer General Victoria
With Torquay providing most of Surf Coast Shire’s residential lots production since 2007, it has
meant that median sale values of Torquay are largely reflective of the median values across the Shire. The significantly lower values in Winchelsea have not affected the Shire’s medians overall due to the relatively smaller sales volumes during this period. Table 5 highlights the diversity of median
values for residential lots throughout the Greater Geelong and Surf Coast region.
Table 5: Median values – Vacant residential lots, Surf Coast Shire and Greater Geelong and selected
localities
Localities & LGAs Change
2016-2017 2017
2016-2017 % gain
Torquay $16,000 $281,000 6.0%
Surf Coast Shire $13,500 $278,500 5.1%
Highton -$5,000 $255,000 -1.9%
Ocean Grove $15,000 $240,000 6.7%
Mount Duneed $28,500 $222,000 14.7%
Leopold $37,500 $216,500 20.9%
Greater Geelong $18,500 $205,000 9.9%
Armstrong Creek $9,500 $185,000 5.4%
Marshall $13,500 $185,000 7.9%
Winchelsea $0 $158,000 0.0% Source: Valuer General Victoria
0
50000
100000
150000
200000
250000
300000
2007 2008 2009 2010 2011 2012 2013 2014 2015 2016 2017
Med
ian
pri
ces
$
Year
Armstrong Creek Mount Duneed Marshall Highton
Leopold Ocean Grove Winchelsea Torquay

Demand & Supply – Residential Land Surf Coast Shire Page | 35
From a pure price perspective, the broadhectare land market in Torquay has attracted a higher
premium compared to all areas in the Greater Geelong and Surf Coast region. Although there is
diversity within inland localities and those closer to Geelong. Torquay has continued to attract
higher values despite the continued growth of neighbouring areas of Armstrong Creek and Mount
Duneed.
Key Issues
As measured through building approval and residential lot construction activity, in the last three
years there has been a sustained shift in increased demand levels for housing across the Surf Coast
Shire, particularly in Torquay/Jan-Juc. This illustrates the need to plan for differing growth
scenarios. Projecting future growth is an extremely difficult task.
To deal with this kind of uncertainty it is best to 'lean' on the side of assuming stron ger growth
overall and in any given market segment. That is to ensure that (within reason) there is scope to
meet any unexpected upturn in demand. Secondly, to plan for a diversity of supply types and
locations. Planning that locks in controls based on one set of demand projections is likely to make it
very difficult for the market to adjust supply to cater for unexpected changes in housing demand.
Recent lot construction reveals the dominance of broadhectare lot construction compared to
dispersed infill. There is ample latent supply that would readily support an increased share of
dispersed infill development activity.
In the short to medium term, with an increase in housing demand levels, only the broadhectare land
development industry has the ‘ready’ capacity of responding by increasing production. The
dispersed infill land/housing industry simply does not have the resources and capacity to respond to
short term increases in demand.
A prime outcome indicator of an imbalance of supply and demand is the rapid increase in sales
values. Vacant residential lot sales pricing across the Shire has not experienced comparative
excessive price increases.
Demand & Supply – Residential Land Surf Coast Shire Page | 36
5.0 Residential Land Supply
Key Findings
In total, the Surf Coast Shire currently has capacity for the future provision of approximately 6,773 additional dwellings (including areas that are as yet, not zoned for residential development
purposes), in broadhectare/major infill sites.
This capacity is comprised of:
- 4,131 unzoned broadhectare lots (61% of supply); and
- 2,642 zoned broadhectare lots (39% of supply).
There are two land release areas located in the Briody Drive area, Torquay with a total
lot/dwelling capacity 532 that are characterised by fragmented land holdings and significant existing low-density residential uses. Land parcels across these two land release areas range from 0.8 to 4.5 hectares. The typical land parcel is sized between 1 to 1.5 hectares. These two land
release areas combined represent 8% of the broadhectare residential land stocks across the municipal area.
The vast majority (zoned and unzoned) broadhectare/major infill undeveloped residential land supply is located in Torquay/Jan-Juc (6414 lots), the remainder (397 lots) in Winchelsea.
Feedback from the development industry regarding their market expectations and development
intentions suggests that over the next five years on average, 416 lots/dwellings per annum will be constructed within existing zoned broadhectare/major infill sites. Historically, over the last three
years, broadhectare/major infill lot construction has averaged 382 per annum. It is expected and highly probable that this level of anticipated development activity will likely occur.
As at November 2017 across the Surf Coast municipal area there was a total lot stock of 1,205 rural
residential allotments. Of this stock only 127 lots (11%) were vacant. The majority (61%) of the rural residential lot stock is located in the Torquay/Jan-Juc region, followed by 26% in the Rural Balance region and 11% in the Winchelsea region. Approximately 51% of the rural residential lot
stock (both occupied and vacant) is less than one hectare in size. Only 13% of the rural residential lot stock (or 151 lots) is sized greater than three hectares.
There are currently two areas identified for future Low Density Residential (LDRZ) land stocks, they are currently zoned Farm (FZ). One is located in Moriac (11.5 hectares) and the other in Torquay (38 hectares).
Section 5.0 of the report details the stock (measured in lots) of broadhectare/major infill residential land supply across the municipal area of Surf Coast as at July 2018.
In addition, it provides an overview of current rural residential land stocks.
For broadhectare/major infill land supply areas, anticipated lot construction timing is presented. This refers to the likely timing of lot construction, not dwelling construction. It is highlighted and highly recognised that the timing presented is a guide, it will not equate to full completion of
activity, but rather a guide to likely broad development construction initiation.
The location of the anticipated lot construction activity illustrated will generally commence
development (e.g. 0-2 years), although complete ‘build-out’ may not be achieved within the stated time-frames.

Demand & Supply – Residential Land Surf Coast Shire Page | 37
5.1 Stock of Zoned Broadhectare/Major Infill Land Stocks As at July 2018, there was a residential lot capacity within zoned broadhectare/major infill sites of
approximately 2,642.
The location of zoned broadhectare/major infill residential land stocks are distributed within the
following regions within the municipality:
• Torquay/Jan-Juc – 2,430 lots (92% of supply); and
• Winchelsea – 207 lots (8% of supply).
Table 6 identifies the lot yield and estimated development timing of zoned broadhectare/major in fill lot stock.
Table 6: Anticipated Broadhectare/Major Infill Lot Construction Activity, 2018
Development Timing
0-2
years 3-5
years 6-10 years
No Timing
Total Zoned
Potential
Residential (Unzoned)
UGZ (Approved
Structure Plan Required) Total
Lorne/Anglesea 5 5 5 Torquay/Jan-Juc 1050 820 202 358 2430 2,002 1939 6371
Winchelsea 42 165 207 190 397
Surf Coast 1097 985 202 358 2642 2192 1939 6773 Source: Spatial Economics Pty Ltd
Based on existing planning permits, recent construction activity and Council/Development Industry feedback it is anticipated that over the next five years, on average, 416 lots/dwellings per annum will be constructed within existing zoned broadhectare/major infill sites. Historically, over the last
three years, broadhectare/major infill lot construction has averaged 382 per annum. It is expected and highly probable that this level of anticipated development activity will likely occur.
In addition to the identified zoned broadhectare/major land stocks with an estimated development
timing, there is broadhectare/major infill land stocks where a no timing status and in some cases no yield have been established. This is primarily due to the identified site being highly likely to be
developed at some point however, due to for example existing or underutilised uses, the likely development timing is highly speculative.
Of the development sites with an estimated lot/dwelling yield (with a No-Timing status), all are
located within the Torquay/Jan-Juc region. It is estimated that these sites will yield approximately 358 lots/dwellings. These development sites are highly fragmented with existing significant low density residential uses. It is expected, that over the course of time, these sites will be redeveloped
to higher density residential uses. However, there can be no certainty to the eventual timing of re-development.
There are a further eight sites with a No Timing status (with no estimated yield estimates) with a total area of 28 hectares. The dwelling yield could feasibly range from 200 to 350 dwellings, based on recently achieved dwelling densities.
5.2 Stock of Un-Zoned Broadhectare Land Stocks Analysis has been undertaken in conjunction with Council planning officers to identify the location
and expected lot yield of currently unzoned residential land stocks. Sites for future residential development are identified within various Council strategy planning documents. Structure planning, and rezoning processes are required before residential development can proceed on such
sites.

Demand & Supply – Residential Land Surf Coast Shire Page | 38
There are approximately 435 hectares of land (with an estimated yield of 4,131 dwellings) identified for potential future broad-hectare residential development across the municipal area as at July
2018.
Of the currently unzoned land stocks (i.e. can not be currently developed for normal residential
lot/dwelling construction):
• A lot potential of 3,941 is located within the Torquay/Jan-Juc region; and
• A 190 lot potential is located in Winchelsea.
Of the significant unzoned potential future broad hectare residential land release areas located in Torquay, there are:
• 850 lots located in Messmate Road Future Growth Area;
• 165 lots in the Strathmore Drive area;
• 212 lots in the Briody Drive precinct;
• 760 lots in the North East Future Residential Investigation Area; and
• 1,939 lots in the Spring Creek Precinct Structure Plan area.
A major future residential land supply source is located within the Spring Creek Structure Plan,
located within the Torquay/Jan-Juc region, the future land release area is summarised below.
Spring Creek Precinct Structure Plan (PSP) Area
• The PSP applies to approximately 245 hectares of land extending generally one-kilometre
west of Duffields Road. The precinct is bounded by Grossmans Road to the north, Duffields Road to the east, Great Ocean Road to the south and rural land to the west.
• It is estimated to have a lot/dwelling yield of approximately 1,939.
• The PSP has been prepared by Surf Coast Shire Council with assistance from the Victorian Planning Authority (VPA) and in consultation with government agencies, service authorities
and key stakeholders.
• Surf Coast Shire Council adopted Amendment C114 and the Spring Precinct Structure Plan, subject to changes, in October 2017. The Amendment and PSP were submitted to the
Minister for Planning in March 2018.
5.3 Land Fragmentation There are two major land release areas located in Torquay with a total lot/dwelling capacity 532 that
are characterised by fragmented land holdings and significant existing low-density residential uses. These areas are illustrated in the image below. The southern land release area (shaded in red) is
zoned for current normal residential density development and has a lot dwelling capacity of approximately 320. The northern land release area (shaded in green) is currently zoned Low Density Residential (LDRZ) is identified for future normal density residential development.

Demand & Supply – Residential Land Surf Coast Shire Page | 39
Image 7: Zoned and Unzoned Broadhectare Land Supply Areas (Fragmentation), Torquay
Land parcels across these two land release areas range from 0.8 to 4.5 hectares. The typical land parcel is sized between 1 to 1.5 hectares.
Given 1) the existing significant residential uses; and 2) the level of fragmentation/relatively small
land parcel sizes; and 3) alternative broadhectare land supply sources (that are larger in size with limited existing uses) – it is considered that these land release areas can have no certainty to the likely
timing of development.
It is observed in other jurisdictions, that similar sites to the above do get fully developed over the passage of time. However, a conservative approach in assessing the supply and demand equation is
highlighted in the above context.
These two land release areas combined represent 8% of the broadhectare residential land stocks across the municipal area.
5.4 Rural Residential Land Stocks The stock of both occupied and vacant rural residential allotments have been determined on a lot
by lot basis as at November 2017. Occupied is defined as having evidence of a ‘habitable’ dwelling, commercial use, or other significant capital intensive land use. Vacant is defined as having no evidence of a significant capital intensive use (as verified via the interpretation of aerial imagery).
As at November 2017 across the Surf Coast Shire there was a total stock of 1,205 rural residential allotments. Of this stock, only 127 lots (11%) were vacant. Rural residential lots as a supply type is comparatively low across the Surf Coast Shire when compared to other regional municipalities
across Victoria.
The majority (61%) of the rural residential lot stock is located in the Torquay/Jan-Juc region,
followed by 26% in the Rural Balance region and 11% in the Winchelsea region.
Graph 14 summarises the stock (lots) of both occupied and vacant rural residential allotments by region.
Zoned (320
Lot Capacity)
Un-Zoned (212
Lot Capacity)
Likely
Short-
term
activity (7 Lots)

Demand & Supply – Residential Land Surf Coast Shire Page | 40
There is approximately 208 hectares of vacant rural residential land across the municipality. Of this vacant lot stock, 164 hectares is zoned Low Density Residential (LDRZ), the remaining 45 hectares
is zoned Rural Living (RLZ).
Graph 15 illustrates the size distribution of all existing rural residential allotments (occupied and
vacant).
Graph 14: Stock of Rural Residential Allotments, 2017
Source: Spatial Economics Pty Ltd
Graph 15: Stock of Rural Residential’ Allotments by Lot Size Cohort, 2017
Source: Spatial Economics Pty Ltd
Demand & Supply – Residential Land Surf Coast Shire Page | 41
Approximately 51% of the rural residential lot stock (both occupied and vacant) is less than one hectare in size. Only 13% of the rural residential lot stock (or 151 lots) is sized greater than three
hectares. The high proportion of smaller rural residential allotments results in a significant limitation in terms of any future feasible re-subdivision.
5.4.1 Short-Term Future Lot Construction - Rural Residential Over the last three years, residential lot construction across the municipality has substantially increased compared to the longer-term average. This increase in activity is also illustrated for rural
residential subdivision activity, averaging over the last three years 28 lots.
Based on subdivision approval data, it is anticipated that this trend is likely to continue and most
probably increase. Currently, there is subdivision approval for 123 rural residential lots on individual land parcels yielding over 15 lots. These sites are located in the Torquay/Jan-Juc region (69 lots), the remaining 54 lots are located in the Rural Balance region (Moriac).
5.4.2 Future (Unzoned) Rural Residential Land Stocks There are currently two areas identified for future Low Density Residential (LDRZ) land stocks, they are currently zoned Farm (FZ). One is located in Moriac (11.5 hectares) and the other in Torquay (38
hectares).
Key Issues
The estimated lot/dwelling capacity of existing zoned broadhectare/major infill land supply sites are
essentially based on recent trends, planning permits and short to medium terms market
expectations. Over the last ten years, the median broadhectare lot constructed within the growth
areas of metropolitan Melbourne, Greater Geelong, major regional and urban centres such as
Torquay has dramatically declined. Therefore, the estimate of broadhectare lot capacity can be
seen as conservative. In the medium to longer term, it would be reasonable to expect broadhectare
lot densities to increase, and thus, an increase in lot/dwelling capacity.
Although not assessed within this study, it is observed (through considerable experience), there is a
high capacity for dispersed infill redevelopment in particularly Torquay/Jan-Juc. This means that
there are readily alternative residential land supply stocks outside of undeveloped
broadhectare/major infill estates - therefore a feasible opportunity to decrease the reliance on
broadhectare land.
Caution is highlighted in terms of the composition of the existing undeveloped (zoned and unzoned)
residential broadhectare land stocks. Significant levels of fragmentation, relatively small land
parcels and significant existing uses are likely to delay the timely redevelopment of these areas.
Spatial Economics consider that these areas will be developed over the passage of time. However,
no certainty can be given to the likely timing of development.

Map 2: Anticipated Development Timing - Residential Broadhectare/Major Infill Land Stocks (Torquay), 2018

Map 3: Anticipated Development Timing - Residential Broadhectare/Major Infill Land Stocks (Winchelsea), 2018
Demand & Supply – Residential Land Surf Coast Shire Page | 34

6.0 Projected Housing Demand
Key Findings
Spatial Economics has developed a number of projected demand scenarios based on the most recently available evidence available. These demand scenarios are outlined below:
Scenario One: idForecast – dwelling forecasts undertaken for the Shire of Surf Coast by ForecastID. Dwelling requirements from 2016 to 2031 at 382 per annum or 1.8% per annum growth rate (note this is trend growth as illustrated from 2011 to 2016).
Scenario Two: VIF2016 – current State Government dwelling projections. Dwelling requirements from 2016 to 2031 at 392 per annum or 1.9% per annum growth rate.
Scenario Three: Recent Trend – based on actual recent trend growth over the last three years continuing to 2031 and being constant. Dwelling requirements from 2016 to 2031 at 490 per annum or 2.3% per annum growth rate would result.
The largest and fastest growth in households across the Surf Coast Shire will be households with no children (lone person and couples without children households), growing at an average annual rate of
2.5% or 201 households per annum from 2016 and 2036. This household type is projected to represent 57% of the change in household structure to 2036. The growth of “households without kids” is largely reflecting the ageing of the existing population (i.e. children leaving home).
The next largest (in terms of absolute growth) is households with children (couples with kids & single parent families), projected to grow at 96 households per annum, a 1.7% growth rate.
Two age cohorts that are projected to increase at the greatest rates are:
- Seniors (70 to 84) at 4.2% per annum; and - - Elderly aged (85+) at 5.6% per annum.
The Victorian State Government has modified the FHOG to increase the FHOG to $20,000 for eligible first-home buyers who buy or build their new home valued up to $750,000 in regional Victoria. The Surf Coast Shire is defined as a regional area for the purpose of the FHOG. This will
result in increased levels of expressed housing demand across the Surf Coast Shire. This assessment has not attempted to quantify 1) the level of brought forward demand; and 2) the potential/likely transferred demand across Surf Coast.
This assessment incorporates the most recently available demand figures to project dwelling requirements and future adequacy of residential land. These figures use current Victoria in Future 2016 (VIF2016): Population and Household Projections, undertaken by the Department of
Environment, Land, Water and Planning and dwelling projections undertaken by id Consulting (id Forecasts) for the Surf Coast Shire (updated at October 2017) as the basis for projecting dwelling
requirements.
VIF2016 details state-wide, regional and metropolitan areas as well as local government area population, household and dwelling projections. When produced they encompassed the latest
available trends such as changes to levels of immigration or economic conditions, or changes to policy affecting population growth locations and levels, and subsequent demand for housing.
VIF2016 projections are undertaken at a VIFSA2 region. The VIFSA2 regions for Surf Coast are larger
geographically than both the major areas (regions) and ABS SA2 areas. However, the Torquay VIFSA2 area is somewhat comparable to the SA2 as the additional rural portion has seen little
change or future likely development.
The dwelling growth rates of the Torquay VIFSA2 sourced from VIF2016 have been applied to the dwelling stock as at 2016 sourced from the 2016 Australian Bureau of Statistics Population and
Housing Census to the Torquay study area. This is then compared to each of the forecasts.

Demand & Supply – Residential Land Surf Coast Shire Page | 45
Projected dwelling requirements for the Surf Coast Shire sourced from VIF2016 indicate that from 2016 to 2031 there will be a total requirement for 5,892 additional dwellings (average annual growth
of 393 dwellings or 1.9%). It is forecast that the Torquay VIFSA2 will account for nearly 80% of the total dwelling demand with an average annual growth of 311 per annum. For specific time cohorts,
average annual dwelling requirements include:
• 2016 to 2021 – 389 (2.0%);
• 2021 to 2026 – 395 (1.9%); and
• 2026 to 2031 – 395 (1.7%).
Projected dwelling requirements sourced id Forecast indicate that from 2016 to 2031 there will be a total dwelling requirement of 5,723 (average annual growth of 382 dwellings or 1.8%). These are
slightly lower than the dwelling demand forecasts compared to VIF2016 with Torquay-Jan-Juc area expected to supply approximately 78% of the Shire’s dwelling growth. For specific time cohorts,
average annual dwelling requirements include:
• 2016 to 2021 – 378 (2.0%);
• 2021 to 2026 – 385 (1.8%); and
• 2026 to 2031 – 382 (1.7%).
VIF2016 is currently being updated based on the results of the 2016 Census and updated State and national estimated resident population. There is no doubt that, based on the 2016 census outcomes,
the State Government population and dwelling projections will be revised upwards.
The perfect ‘demographic storm’ Spatial Economics highlighted within the Geelong Settlement
Strategy – background papers is gathering strength, just when it might have reached a point where it would not continue. The ingredients of that ‘storm’ were:
• high levels of net overseas migration (+180,000) to Australia, although this was down from
the peak of 300,000 in 2007-08;
• but in Victoria's case this was embellished by a high share coming to Victoria - up to 36% in 2015-16 compared with the usual 20%-25%;
• record (at least since 1971) levels of net interstate migration to Victoria;
• high natural increase - record numbers of births. Although the fertility rate is going down
migration adds to the pool of people who are in child bearing ages;
• deaths increasing but only slightly owing to continuing improvements in life expectancy; and
• in Torquay’s case, its attractiveness as a coastal living option.
Then in May 2017 there was a radical upward revision of Victoria's 2016 population estimates which
flowed through to settlements such as Torquay. In September 2017, we had the release of the March 2017 quarter population estimates for States and Territories. Importantly, what stands out, is the net overseas migration is again on the increase - up 45,000 in the year to 31st March 2017
compared with the year to March 2016.
Furthermore, Victoria's share remains high - at around 36%. With NSW, the two states account for 76% of net overseas migration (NOM). Victoria's NOM for 2016-17 is likely to be 16,000-18,000
higher than it was in 2015-16. There are several implications of this:
1. The high dwelling growth scenario presented below of 2.3% for the Surf Coast Shire is
possible (likely to be a practical planning scenario).

Demand & Supply – Residential Land Surf Coast Shire Page | 46
2. The recent growth means that, when the ABS and DELWP do their next set of projections, there will be a considerable uplift in assumptions and the projected population for
Melbourne by 2050. Spatial Economics estimate it will be closer to 9 million than 8 million. This new figure becomes a guide for planning, development and investment for Greater
Melbourne (this includes implications/growth flow-on to Surf Coast, particularly Torquay/Jan-Juc).
3. This faster growth rate of population growth in Victoria has a marginal direct impact on Surf
Coast. But the greater impact is likely to be the indirect one - the more quickly Melbourne fills up and outwards, the sooner and greater will be the overflow to Surf Coast.
4. This combination of interstate and overseas migration adds to the pool of young adults. It
adds to births, and 20-40 years down the track, adds to the pool of future procreators.
6.1 Housing Demand Scenarios Up front, Spatial Economics acknowledges that all projections are ‘wrong’. That is to say, they will
almost never exactly match the actual amount and timing of population growth. However, when
they point us in the right direction then they are doing what they are intended for. In this context it is
often most sensible to use a number of scenarios with various growth rates. This can help decision
makers to better understand the range of uncertainty and to plan in a way that minimises the
adverse effects of underestimating or overestimating growth.
Another factor influencing the accuracy/achievement of projected growth numbers is the availability
and composition of residential land supply. If the land supply is restricted this will prevent the
underlying demand for housing being realised.
So then what is the best course of action? In planning terms, we really need to be prepared for a
range of possible futures of population and dwelling growth – this means considering a range of
realistic growth forecasts and supply options.
Spatial Economics have developed a number of projected demand scenarios based on the most
recently available evidence. These demand scenarios are outlined below.
Scenario One: idForecast – dwelling forecasts undertaken for the Shire of Surf Coast by ForecastID.
Dwelling requirements from 2016 to 2031 at 382 per annum or 1.8% per annum growth rate (note this is trend growth as illustrated from 2011 to 2016).
Scenario Two: VIF2016 – current State Government dwelling projections. Dwelling requirements
from 2016 to 2031 at 392 per annum or 1.9% per annum growth rate.
Scenario Three: Recent Trend – based on actual recent trend growth over the last three years
continuing to 2031 and being constant. Dwelling requirements from 2016 to 2031 at 490 per annum or 2.3% per annum growth rate would result.
Graph 16 summarises the projected demand scenarios for residential dwellings for the Surf Coast
Shire. In addition, it highlights historic ‘actual’ demand for residential dwellings in the form of
residential lot construction and net dwelling growth identified by the ABS Census.

Demand & Supply – Residential Land Surf Coast Shire Page | 47
Graph 16: Historic and Projected Demand for Residential Dwellings, 2007 to 2031
Source: DELWP. Victoria in Future 2016: Population and Household Projections
Forecast ID - Surf Coast Australian Bureau of Statistics – 2011 and 2016 Population and Housing Census
Australian Bureau of Statistics – Building Approvals
Lot Construction - Spatial Economics Pty Ltd
First Home Owners Grant (FHOG)
The Victorian State Government has modified the FHOG to increase the FHOG to $20,000 for
eligible first-home buyers who buy or build their new home valued up to $750,000 in regional Victoria. The Surf Coast Shire is defined as a regional area for the purpose of the FHOG.
A new home includes:
• A newly built home;
• An existing property which is being sold for the first time as a new residential premise;
• A land and building package, or
• Vacant land on which you will build a new home.
The $20,000 FHOG will be applicable to:
• Contracts entered into from 1 July 2017 to 30 June 2020 for the purchase of a new home in regional Victoria;
• Comprehensive home building contracts entered into from 1 July 2017 to 30 June 2020 by the owner of land wholly in regional Victoria, or a person who on completion of the contract will be the owner of land wholly in regional Victoria, to have a home built on the land; and
• The building of a home wholly in regional Victoria if the building work commences between 1 July 2017 and 30 June 2020 inclusive.
At a macro level, initiatives such as the FHOG (when there is no geographical differentiation) simply
brings forward underlying housing demand. Overall housing demand decreases proportionally once the grant ends and/or underlying demand for housing is satisfied.
0
100
200
300
400
500
600
700
800
2007
2008
2009
2010
2011
2012
2013
2014
2015
2016
2017
2018
2019
2020
2021
2022
2023
2024
2025
2026
2027
2028
2029
2030
2031
No
. of L
ots
/Dw
ellin
gsABS Census
Lot Construction
Lot Construction (average)
Building Approvals
Building Approvals (average)
Scenario 1 (ID Forecast)
Scenario 2 (VIF2016)
Scenario 3 (Recent Trend)
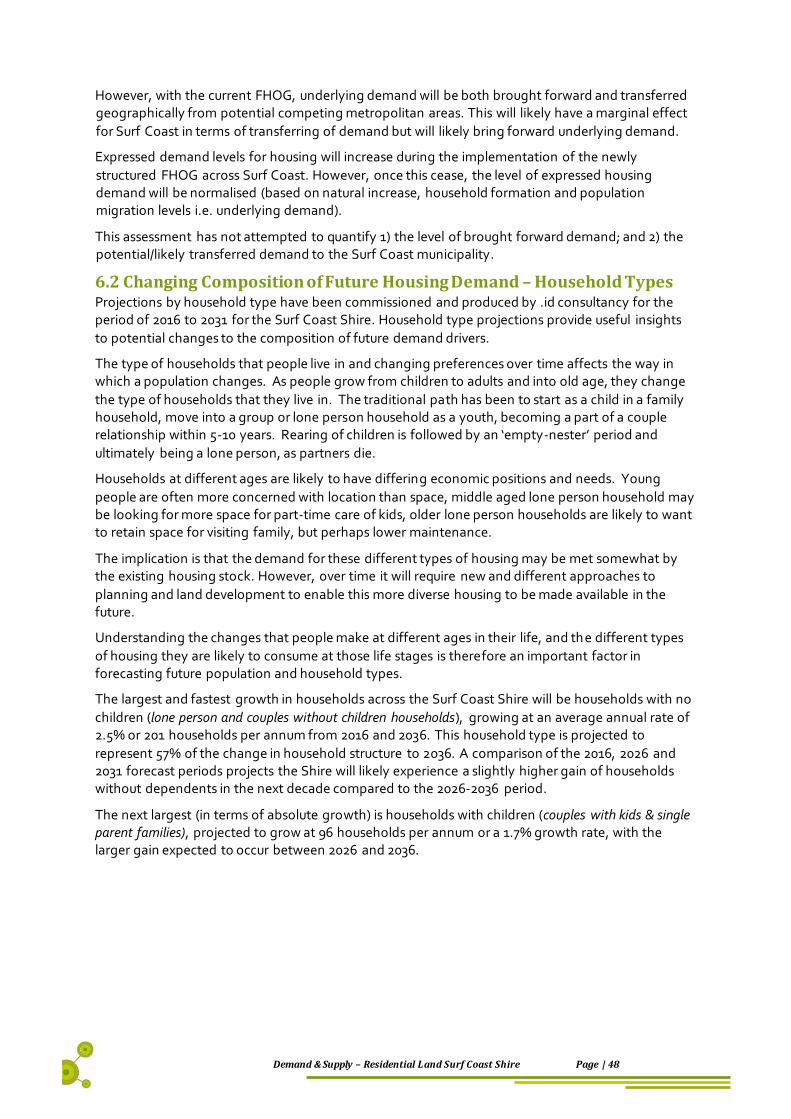
Demand & Supply – Residential Land Surf Coast Shire Page | 48
However, with the current FHOG, underlying demand will be both brought forward and transferred geographically from potential competing metropolitan areas. This will likely have a marginal effect
for Surf Coast in terms of transferring of demand but will likely bring forward underlying demand.
Expressed demand levels for housing will increase during the implementation of the newly
structured FHOG across Surf Coast. However, once this cease, the level of expressed housing demand will be normalised (based on natural increase, household formation and population migration levels i.e. underlying demand).
This assessment has not attempted to quantify 1) the level of brought forward demand; and 2) the potential/likely transferred demand to the Surf Coast municipality.
6.2 Changing Composition of Future Housing Demand – Household Types Projections by household type have been commissioned and produced by .id consultancy for the period of 2016 to 2031 for the Surf Coast Shire. Household type projections provide useful insights
to potential changes to the composition of future demand drivers.
The type of households that people live in and changing preferences over time affects the way in which a population changes. As people grow from children to adults and into old age, they change
the type of households that they live in. The traditional path has been to start as a child in a family household, move into a group or lone person household as a youth, becoming a part of a couple relationship within 5-10 years. Rearing of children is followed by an ‘empty-nester’ period and
ultimately being a lone person, as partners die.
Households at different ages are likely to have differing economic positions and needs. Young
people are often more concerned with location than space, middle aged lone person household may be looking for more space for part-time care of kids, older lone person households are likely to want to retain space for visiting family, but perhaps lower maintenance.
The implication is that the demand for these different types of housing may be met somewhat by the existing housing stock. However, over time it will require new and different approaches to
planning and land development to enable this more diverse housing to be made available in the future.
Understanding the changes that people make at different ages in their life, and the different types
of housing they are likely to consume at those life stages is therefore an important factor in forecasting future population and household types.
The largest and fastest growth in households across the Surf Coast Shire will be households with no
children (lone person and couples without children households), growing at an average annual rate of 2.5% or 201 households per annum from 2016 and 2036. This household type is projected to
represent 57% of the change in household structure to 2036. A comparison of the 2016, 2026 and 2031 forecast periods projects the Shire will likely experience a slightly higher gain of households without dependents in the next decade compared to the 2026-2036 period.
The next largest (in terms of absolute growth) is households with children (couples with kids & single parent families), projected to grow at 96 households per annum or a 1.7% growth rate, with the larger gain expected to occur between 2026 and 2036.

Demand & Supply – Residential Land Surf Coast Shire Page | 49
Graph 17: Projected Growth in Households by Type, Surf Coast Shire – 2016, 2026 to 2036
Source: forecast.id
The dominant growth of “households without kids” is largely reflecting the ageing of the existing population (i.e. children leaving home and retirees). Commissioned population forecasts by custom geographies project gains across the Shire with the largest expected to occur in the Torquay North
(+ 78 households) and Old Torquay-Torquay West (+ 53 households) between 2016 and 2036.
Image 8: Surf Coast Shire - Average annual change of households without dependents, 2016 to 2036.
Source: forecast.id
The growth of “households with kids” correlates with the forecast residential development in the
Shire. It is expected that the largest growth of this household is likely to occur in Torquay North (+
0
200
400
600
800
1000
1200
1400
1600
Couples withoutdependents
Lone personhouseholds
Couple familieswith
dependents
One parentfamily
Grouphouseholds
Other families
Ho
use
ho
lds
Household types
Change 2016-2026 Change 2026-2036
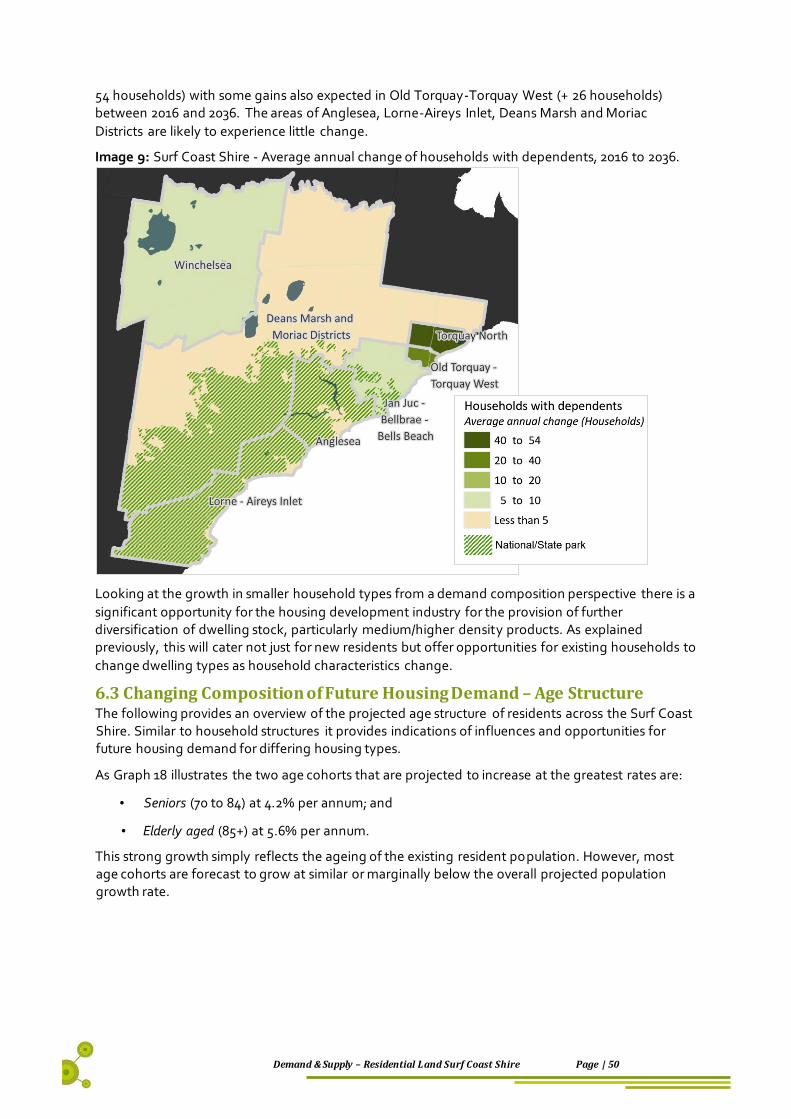
Demand & Supply – Residential Land Surf Coast Shire Page | 50
54 households) with some gains also expected in Old Torquay-Torquay West (+ 26 households) between 2016 and 2036. The areas of Anglesea, Lorne-Aireys Inlet, Deans Marsh and Moriac
Districts are likely to experience little change.
Image 9: Surf Coast Shire - Average annual change of households with dependents, 2016 to 2036.
Looking at the growth in smaller household types from a demand composition perspective there is a
significant opportunity for the housing development industry for the provision of further diversification of dwelling stock, particularly medium/higher density products. As explained previously, this will cater not just for new residents but offer opportunities for existing households to
change dwelling types as household characteristics change.
6.3 Changing Composition of Future Housing Demand – Age Structure The following provides an overview of the projected age structure of residents across the Surf Coast Shire. Similar to household structures it provides indications of influences and opportunities for future housing demand for differing housing types.
As Graph 18 illustrates the two age cohorts that are projected to increase at the greatest rates are:
• Seniors (70 to 84) at 4.2% per annum; and
• Elderly aged (85+) at 5.6% per annum.
This strong growth simply reflects the ageing of the existing resident population. However, most age cohorts are forecast to grow at similar or marginally below the overall projected population growth rate.
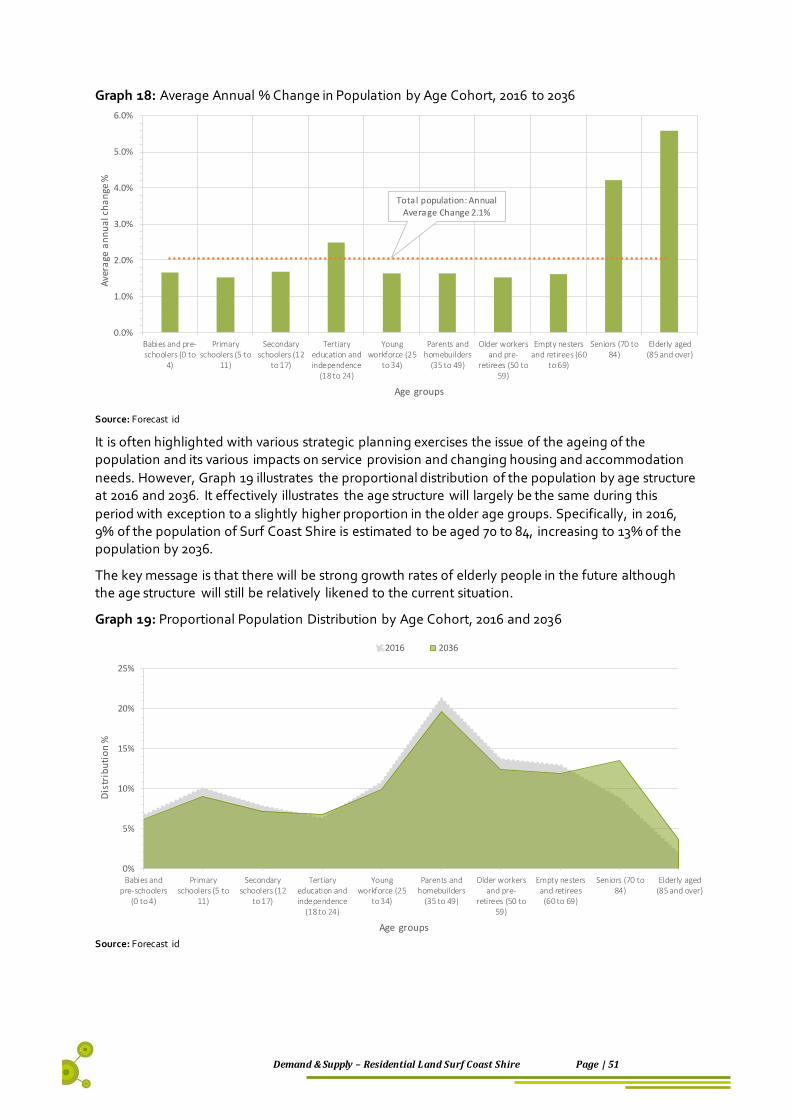
Demand & Supply – Residential Land Surf Coast Shire Page | 51
Graph 18: Average Annual % Change in Population by Age Cohort, 2016 to 2036
Source: Forecast id
It is often highlighted with various strategic planning exercises the issue of the ageing of the population and its various impacts on service provision and changing housing and accommodation
needs. However, Graph 19 illustrates the proportional distribution of the population by age structure at 2016 and 2036. It effectively illustrates the age structure will largely be the same during this
period with exception to a slightly higher proportion in the older age groups. Specifically, in 2016, 9% of the population of Surf Coast Shire is estimated to be aged 70 to 84, increasing to 13% of the population by 2036.
The key message is that there will be strong growth rates of elderly people in the future although the age structure will still be relatively likened to the current situation.
Graph 19: Proportional Population Distribution by Age Cohort, 2016 and 2036
Source: Forecast id
Total population: Annual Average Change 2.1%
0.0%
1.0%
2.0%
3.0%
4.0%
5.0%
6.0%
Babies and pre-schoolers (0 to
4)
Primaryschoolers (5 to
11)
Secondaryschoolers (12
to 17)
Tertiaryeducation andindependence
(18 to 24)
Youngworkforce (25
to 34)
Parents andhomebuilders
(35 to 49)
Older workersand pre-
retirees (50 to59)
Empty nestersand retirees (60
to 69)
Seniors (70 to84)
Elderly aged(85 and over)
Ave
rage
an
nu
al c
ha
nge
%
Age groups
0%
5%
10%
15%
20%
25%
Babies andpre-schoolers
(0 to 4)
Primaryschoolers (5 to
11)
Secondaryschoolers (12
to 17)
Tertiaryeducation andindependence
(18 to 24)
Youngworkforce (25
to 34)
Parents andhomebuilders
(35 to 49)
Older workersand pre-
retirees (50 to59)
Empty nestersand retirees(60 to 69)
Seniors (70 to84)
Elderly aged(85 and over)
Dis
trib
uti
on
%
Age groups
2016 2036
Demand & Supply – Residential Land Surf Coast Shire Page | 52
Key Issues Up front, Spatial Economics state the notion that all projections are ‘wrong’. That is to say, they are
almost never exactly going to match the actual amount and timing of population growth. However, when they point us in the right direction, in particular giving us a picture of what the future is likely to be (with various growth rates), then they are doing exactly what they are intended for.
So, then what is the best course of action? In planning terms, we really need to be prepared for the range of possible futures of population and dwelling growth – this means considering a range of realistic options.
When planning for future housing demand (housing need) there are two key approaches can help with this kind of uncertainty:
First, to 'lean' on the side of assuming stronger growth overall and in any given market segment. That is to ensure that (within reason) there is scope to meet any unexpected upturn in demand; and
Secondly, to plan for a diversity of supply types and locations.
Planning that locks in controls based on one set of demand projections is likely to make it very difficult for the market to adjust supply to cater for unexpected changes in housing demand.
The Surf Coast Shire is projected to experience significant socio-demographic changes. Specifically, the majority of household growth will be for households with no children. This growth will be sourced by simply changing household structures and migration to the municipality. This significant
household compositional change highlights the need/opportunity for the provision of diverse housing products across diverse locations.
The population across Surf Coast is ageing. That is, the proportion of older residents is increasing
the most, with the fastest population growth of all age categories being in the 70 to 85+ year age group. This has implications in terms of ageing in place, service delivery, the potential ‘churn’ of
housing stock i.e. downsizing of dwellings and the need for aged care housing (both independent and dependent housing/accommodation).
However, there will be significant, large amounts of growth of family aged adults, children and
empty nesters. These household will likely demand and consume traditional separate dwellings.
The current FHOG, will bring forward underlying housing demand to the municipality.

Demand & Supply – Residential Land Surf Coast Shire Page | 53
7.0 Adequacy of Land Stocks Key Findings
In terms of zoned broadhectare/major infill residential land stocks it is estimated based on the identified supply and projected demand scenarios, there are sufficient land stocks to satisfy between 5 to 7 years of demand across the Surf Coast municipality.
In addition, there are sufficient unzoned broadhectare/major infill residential land stocks (this includes the Spring Creek land release area) to satisfy between 9 to 12 years of demand
With the amount of supply and demand estimated, it is possible to describe the results in years of
supply (a simple and understandable measure). For example, it can be stated that there are X years of supply based on projected demand within a given housing market and by supply type.
This succinct way of describing adequacy is standard across most State Governments in Australia
and incorporates a wealth of information into a single figure. A series of adequacy numbers can be provided to reflect differing demand scenarios.
It is also possible to describe adequacy in a qualitative sense but with both the private and public sector familiar to this methodology, it seems appropriate to adopt the above approach. Years of supply can also be linked to trigger points relating to the need for additional land and more
importantly triggering specific strategic land use planning responses. The adequacy of broadhectare/major infill residential land supply sources is calculated as a residual taking into
account the state of the other supply types.
Analysis has been undertaken to estimate the years of broadhectare/ major infill residential lan d stocks for the Surf Coast municipal area – this is outlined below.
7.1 Years of Supply – Surf Coast Three future demand scenarios are used and assessed against the identified stock of broadhectare and major infill land. The demand scenarios are detailed in the previous section of the report. In
summary these include:
Scenario One: idForecast – dwelling forecasts undertaken for the Shire of Surf Coast by
ForecastID. Dwelling requirements from 2016 to 2031 at 382 per annum or 1.8% per annum growth rate (note this is trend growth as illustrated from 2011 to 2016).
Scenario Two: VIF2016 – current State Government dwelling projections. Dwelling
requirements from 2016 to 2031 at 392 per annum or 1.9% per annum growth rate.
Scenario Three: Recent Trend – based on actual recent trend growth over the last three years continuing to 2031 and being constant. Dwelling requirements from 2016 to 2031 at 490 per
annum or 2.3% per annum growth rate would result.
The share of broadhectare/major infill lot construction activity is assumed at 76%. This benchmark is
assumed constant over-time and is seen as a conservative assumption. In addition, the land release areas that have previously been identified (both zoned and unzoned) that are highly fragmented/with existing significant uses have been excluded from the below years of supply
estimates. These land release areas combined equate to approximately 1.4 to 2 years supply.
Table 7 summarise the estimated years of supply by demand scenario for broadhectare/major infill
residential land stocks across the Surf Coast municipal area as at July 2018.
In terms of zoned broadhectare/major infill residential land stocks, it is estimated based on the identified supply and projected demand scenarios, there are sufficient land stocks to satisfy
between 5 to 7 years of demand across the Surf Coast municipality. In addition, there are sufficient unzoned broadhectare/major infill residential land stocks (this includes the Spring Creek land release area) to satisfy between 9 to 12 years of demand

Demand & Supply – Residential Land Surf Coast Shire Page | 54
Table 7: Estimated Years of Broadhectare/Major Infill Residential Land Supply, 2018
Zoned
Potential
Residential (unzoned) Total
Scenario 1 7 12 19 Scenario 2 7 12 19 Scenario 3 5 9 14
Source: Spatial Economics Pty Ltd
Spatial Economics consider that the total stock of zoned broadhectare residential land is sufficient
to meet short-term requirements. However, Spatial Economics recommend that the stock of zoned
residential broadhectare land is increased in the short-term to maintain both a) a competitive land
supply market; and b) meeting underlying dwelling requirements.
The years of supply is not only dependent on the projected number of dwellings in total, the share of
total dwellings within major/broadhectare supply areas but also the timely realisation of the
identified supply opportunities.
Therefore, caution is highlighted in the interpretation of the years of major/broadhectare land
supply, as a major assumption is that the identified supply is realised in a development timing
setting.
Key Issues
Clause 11.02 of the State Planning Policy Framework includes under ‘Strategies’ the need to:
“Plan to accommodate projected population growth over at least a 15 year period and provide clear direction on locations where growth should occur. Residential land supply will be considered on a
municipal basis, rather than a town-by-town basis.”
The broadhectare/major infill residential supply assessment included within this assessment (the
method employed replicates the current State Governments methodology), illustrates that there is
between 14 to 19 years zoned and unzoned broadhectare/major infill residential land stocks.
Spatial Economics consider that the total stock of zoned broadhectare residential land is sufficient to
meet short-term requirements. However, Spatial Economics recommend that the stock of zoned
residential broadhectare land is increased in the short-term to maintain both a) a competitive land
supply market; and b) meeting underlying dwelling requirements.