resetting of neodymium isotopes and redistribution of … et al... · the eastern and southern...
TRANSCRIPT

Pergamon
Geochimica et Cosmochimica Acta, Vol. 58, No. 2. pp. 931-941, 1994 Copyright 0 I994 Elsevier Science Ltd Printed in the USA. All rights reserved
0016-7037/94 $6.00 + .OO
Resetting of neodymium isotopes and redistribution of REEs during sedimentary processes: The Early Proterozoic Chelmsford Formation, Sudbury Basin, Ontario, Canada
D. K. MCDANIEL, S. R. HEMMING, S. M. MCLENNAN, and G. N. HANSON
Department of Earth and Space Sciences, State University of New York at Stony Brook, Stony Brook, NY 1 1794-2100. USA
(Rr~~ived Much 12, 1993; accepted in revisedjiwn Au,yzuf 17, 1993)
Abstract-The REEs abundances and neodymium isotope compositions of sandstones and siltstones from the Early Proterozoic Chelmsford Formation reveal that the REEs in some samples were redistributed during the Early Proterozoic by surficial processes and that prior to redistribution, the Nd isotope system was partially reset. The Chelmsford Formation is a coarse-grained turbidite sequence, the youngest of three elastic units that fill the Sudbury Basin in Ontario. It is constrained to have been derived from nearby Late Archean Superior Province rocks by petrography, major- and trace-element chemistry, and Pb isotopic compositions of whole-rocks and feldspar. Although REE patterns and Nd model ages for samples from around the base of the formation reflect their derivation from undisturbed Superior Province rocks ( TDM - 2800 Ma), five samples from higher in the stratigraphic section show evidence that up to 60% of their La has been removed, and Sm/Nd has increased by up to 60%. These samples also have anomalously high Nd model ages (T DM = 3400 to 4400 Ma). The presence of pronounced positive Ce anomalies in the samples with anomalous T DM indicates the influence of surficial processes on the REE composition. The data scatter about a vertical array on a plot of,f&Nd vs. tE;dxO’ ( tNd calculated at 1800 Ma, approximately the depositional age), with values of,f smiNd between -0.45 and -0.14. Mixing of Nd from other sources is difficult to reconcile with the petrography, major- and trace-element geochemistry, and Nd and Pb isotopes. Removal of an LREE-enriched phase from the sedimentary system provides a viable mechanism to produce the REE and Nd isotopic characteristics of the Chelmsford Formation samples. Neodymium isotopes require that this phase was partially isotopically equilibrated with the matrix sediment near the time of sedimentation. This study shows the dangers of indiscriminate use of Nd model ages in provenance studies and demonstrates that the simultaneous examination of Sm/Nd and Nd isotopes on fsmiNd vs. CNd (or isochron) plots is required for the recognition of sedimentary redistribution of the REE.
INTRODUCTION
THE APPLICATION OF RARE earth elements (REEs) and Nd isotopes to sedimentary rocks has proven to be a powerful tool for characterizing provenance (e.g., NATHAN, 1976;
MILLER et al., 1986; NELSON and DEPAOLO, 1988; MCLEN- NAN et al., 1993). Because they normally have low solubilities in water, and are similar geochemically, REEs tend to be transferred quantitatively and unfractionated into the sedi- mentary record. The REE composition of a sedimentary
package, therefore, tends to reflect the average REE com- position of its provenance (TAYLOR and MCLENNAN, 1985; MCLENNAN, 1989). Neodymium model ages add a temporal dimension to provenance studies, providing extraction ages from a depleted mantle ( TDM) or chondritic reservoir ( Tc,“,)
(e.g., MCCULLOCH and WASSERBURG, 1978; MILLER et al., 1986). The application of model mantle ages assumes a con- stant Sm/Nd during the post-mantle history for both the crustal source and the sedimentary rock. The validity of this assumption, particularly with respect to sedimentary pro- cesses, may be questioned and some studies suggest that in some circumstances the REE composition of a rock may be altered during sedimentary processes (e.g., NESBITT, 1979; MILODOWSKI and ZALASIEWICZ, 1991; BANFIELD and Ec- GLETON, 1989; BOCK et al., 1993).
This study differs from many in that both REE and Nd isotopes are examined for a geographically and stratigraph- ically restricted sample set, obtained from a single formation
931
with a relatively simple and well-constrained provenance. Petrographic data, major- and trace-element geochemistry, and Pb isotopes indicate that the Chelmsford Formation was a first-cycle sediment derived predominantly from Superior Province rocks. Although the REE composition and Nd
model ages for samples collected from the base of the for- mation reflect derivation from Superior Province rocks, five
samples collected from higher in the stratigraphic section have distinct REE patterns and anomalously high Nd model ages. We will show that these characteristics require resetting of the Sm-Nd system associated with removal of LREE close to the time of deposition of the Chelmsford Formation.
GEOLOGIC SETTING
The Early Proterozoic Chelmsford Formation is the uppermost unit of the Whitewater Group, a sequence of elastic sedimentary rocks deposited within the Sudbury Basin, a gently folded northeast- southwest trending synclinorium in southern Ontario, Canada (Fig. 1). The Sudbury Basin is bound to the northwest and west by the Archean ( -2800 Ma) Superior Province, which consists of mafic- felsic greenstone and metasedimentary belts. gneiss terranes, and felsic plutons (GOODWIN, 199 1). Sedimentary, metasedimentary, and ig- neous rocks of the Huronian Supergroup (Southern Province) bound the eastern and southern margins of the basin. Sedimentary rocks of the Huronian Supergroup were deposited between 2500 and 2200 Ma (CARD et al., 1984. KROGH et al., l987), and are interpreted to have been derived from the Superior Province (e.g., YOUNG, 1968, MCLENNAN et al., 1979). To the southeast of the basin. the Grenville Front trends northeast to southwest. and bounds a terrane of Middle to Late Proterozoic deformation and metamorphism.

932 D. K. McDaniel et al.
FIG. I. Regional Map of Sudbury Basin Region. Possible sources in proximity to the Sudbury Basin include the Late Archean Superior Province, Early Proterozoic Southern Province, Early Archean crust (outside map area), Early Proterozoic arc in the Grenville Province, and the Sudbury Igneous Complex. Locations of coarse- (filled symbols), and fine-grained (open symbols) samples are shown. Inset shows the stratigraphic position of samples from continuous section at north end of basin representing approximately 210 m. Sample I6 is a coarse sand analyzed solely for Pb isotopes in feldspar.
The Sudbury Igneous Complex is a 1850 t I Ma (igneous zircons. KROGH et al.. 1984) layered igneous complex that rings the Sudbury Basin. On the basis of Sm-Nd (FAGGART et al.. 1985) and Re-0s (WALKER et al., 1991 ) systematics, it is interpreted to be derived from melting of Superior Province rocks. The Sudbury Igneous Complex is intrusive into the Onaping Formation. the lowest ofthree units that make up the Whitewater Group (Fig. I ). Its age provides a minimum for the time of deposition of the Onaping Formation. Shocked zircons within wall rock of the Sudbury Basin and within the Onaping Formation are discordant with upper and lower intercepts of 27 1 I + 7 Ma and I836 i I4 Ma, interpreted to reflect the age of the source (Superior Province) and of the shock event. respectively ( KROGH et al., 1984). The lower intercept defines a maximum age for deposition of the Whitewater Group. Accordingly. the Onaping Formation must have been deposited very close to 1850 Ma, indi- cating that it accumulated immediately following the shock event. Deposition of the successive Onwatin and Chelmsford Formations may also have been within this time interval, or may have followed intrusion of the Sudbury Igneous Complex. A Rb-Sr whole-rock iso- chron for samples of the Chelmsford Formation and the underlying Onwatin Formation gives an age of 1643 f 13Q Ma ( FAIRBAIRN et al., 1968) (recalculated for X = 1.42 X IO-“, STEIGER and JAGER, 1977) that may be interpreted as a minimum age of deposition.
The preserved thickness-of the Chelmsford Formation is approx- imately 850 m, however, the top of the section is eroded. Feldspar is dominated by nearly pure albite. suggesting diagenetic alteration, and that the Chelmsford Formation may have been buried up to 2.5 km (MCDANIEL et al., 1994). The Chelmsford Formation consists ofdark grey. very coarse- to fine-grained sandstones arranged in fining upward packages, and is interpreted to represent proximal turbidite deposits ( ROUSELL, 1972). There are no discernible facies changes either stratigraphically or geographically within the basin. Paleocurrent data indicate a southwesterly flow direction, parallel to the axis of the basin, suggesting deposition in an elongate trough (CANTIN and WALKER, 1972).
Provenance of the Chelmsford Formation
ROUSELL ( I972), on the basis of sandstone petrology, facies con- siderations. and paleocurrent data, suggested that the Chelmsford Formation was derived from a tonalitic source terrane such as found in the Superior Province. The petrography, and major- and trace- element geochemistry among the eleven sandstones in this study are consistent with this interpretation (MCDANIEL et al., 1994). Ac-
cording to the classification scheme ofFOLK ( 1980), the Chelmsford Formation is a texturally and mineralogically immature arkose. The framework mineralogy of the Chelmsford Formation is composed of subequal proportions of quartz and feldspar: matrix in the samples is as high as 40’%, and may be the result of alteration of labile phases (MCBRIDE, 1985). A component of sedimentary and metasedimen- tary rock fragments indicate a minor source of recycled sediment. The rare occurrence of resorbed quartz textures suggests a minor volcanic component. High Cr and Ni abundances vary sympatheti- cally with other ferromagnesian elements and indicate a mafic com- ponent. Although the major- and trace-element data for the Chelms- ford Formation allow additional provenance components, compo- sitions are not outside the range of Superior Province compositions (GOODWIN, 199 I ) and do not preclude a source derived solely from Superior Province rocks.
Lead isotopic systematics are consistent with petrographic and geochemical constraints, and provide strong evidence that the source of the Chelmsford Formation was composed ofessentially undisturbed Superior Province material. On a plot of 207Pb/204Pb vs. 206Pb/Z04Pb (Fig. 2, from MCDANIEL et al., 1994), feldspar compositions for the Chelmsford Formation lie within the field of recorded analyses of undisturbed plutonic feldspar from Superior Province rocks. Whole- rock lead isotopic compositions are characteristic of Superior Province rocks (MCDANIEL et al., 1994). Feldspar and whole-rock data for the Chelmsford Formation lie on a linear array on a plot of “‘Pb/ ‘04Pb vs. zo6Pb/204Pb. and are within the field of Superior Province compositions. Lead isotope systematics indicate that the Chelmsford Formation was predominantly derived from Superior Province rocks without undergoing any perceptible change in whole-rock U/Pb or Th/Pb. or disturbance of original Archean Pb in the feldspar. Indirect derivation of the feldspar. for instance via sedimentary rocks from the Huronian Supergroup is not precluded by Pb systematic& how- ever. petrography and geochemistry do not support a large component of recycled sediment in the source of the Chelmsford Formation.
ANALYTICAL METHODS
Figure 1 shows the location of fifteen samples selected for analysis. Care was taken to retrieve fresh, unweathered samples. Detailed sam- ple locations and descriptions are available in MCDANIEL et al. ( 1994). To test for a geographic control on composition, seven sam- ples were collected from roadcuts and natural outcrops around the base of the formation. To test for stratigraphic controls on compo- sition, nine samples (one from the base of the formation) were col-

Alteration of t(Nd) and REEs in the Chelmsford Fm., Sudbury 933
16.5
16.0
13.0 15.0 17.0 19.0 21.0 23.0 25.0
0
x
2, X X X X *06Pb
*04Pb 32.0tw”“““““““““““““’
13.0 15.0 17.0 19.0 21.0 23.0 25.0
FIG. 2. Plot of zo7Pb/Z04Pb vs. 206Pb/z04Pb and zo8Pb/Z04Pb vs. Z06Pb/Zo4Pb for samples from the Chelmsford Formation (data from MCDANIEL et al., 1994). Whole-rock and feldspar data for the Abitibi Belt of the Superior Province from GARI~PY and ALLBGRE ( 1985). Feldspar compositions for the Chelmsford Formation are from sam- ples IS, 16, and 17 (2 analyses), and fall within the field of recorded analyses for undisturbed plutonic feldspar from the Superior Province. Whole-rock analyses from samples 17, 18, 13, and 30 are consistent with evolution of the Superior Province. Filled symbols are sandstones and open symbols are shales.
lected at regular intervals through a 2 10 m thick continuous section of natural outcrop. Where present, coarSe and fine-grained sandstones were collected from the same fining-upward cycle for comparison of provenance information.
Table 1. REE data (ppm).
The REEs were analyzed by isotope dilution mass spectrometry on a NBS design, single-sector Nier-type h-inch radius thermal ion- ization mass spectrometer. Sample fusion and REE group separations were modified from the procedure presented in STERN and HANSON ( 1991). in which the REEs were eluted as a group with HCI in AG50W-X8 and then separated into cuts of Ce, Nd-Sm-Eu, Gd, and Dy-Er-Yb with methylactic acid. Because La data were required for this study, we modified the REE group separation procedure in order to remove Ba. This was achieved using 2 N HCl and 4N HN03 washes, prior to a 4 N HN09 REE elution. Lanthanum was collected with Ce in the REE separation step. Lanthanum .was run as an oxide using HSP04 and silica gel (similar to the Pb technique reported in CAMERON et al., 1969) on outgassed Re center filaments. For all but three samples, La abundances were obtained from separate rock dis- solutions; in all these cases, Ce was re-analyzed in order to correct for sample heterogeneity. Differences in REE abundances for separate dissolutions of the same sample powders were generally less than 5%; in-run precision was better than 1%. The low precision for separate dissolutions may be due to sample heterogeneity. BCR- 1 values for the period of analyses are the average of two dissolutions and reported in Table 1. Chondrite compositions used for normalization are from TAYLOR and MCLENNAN (1985).
Neodymium isotopic data were collected on unspiked samples on a Finnigan MAT Model 262 multicollector thermal ionization mass spectrometer at Stony Brook. Samples were prepared following a procedure similar to that for the REE, loaded on outgassed Re side filaments and run on a double filament assembly. Ratios were col- lected in the static mode and normalized to ‘46Nd/‘44Nd = 0.7219. Accepted analyses had ‘48Nd / “@Nd = 0.24 1620 + 20 ( 20). Samples were analyzed in two intervals. The absolute value of the La Jolla Nd standard for the first interval was 0.511858 + 17 (n = 23) and 0.5 11829 +- 2 I (n = 17) for the second interval. The change was due to geometric reconfiguration of the mass spectrometer. Each sample was run twice and corrected to a La Jolla standard ‘43Nd/‘44Nd of 0.5 I 1865. In-run precision was better than 0.000008, the average difference between two runs of the same solution was 0.0000 15. Chondrite values used for normalization are: ‘43Nd/‘44Nd = 0.512638 and ‘47Sm/144Nd = 0. I967 ( WASSERBURG et al., 198 1 ).
RESULTS
Rare Earth Elements
REE abundances for eleven medium-grained sandstones
and three sillstones from the Chelmsford Formation are re-
ported in Table 1. Two distinct patterns are recognized on chondrite-normalized REE diagrams (Fig. 3). With one ex- ception (sample 29, discussed later), samples collected from near the base of the Chelmsford Formation have high REE
Sample
La
Ce
Nd
Sm
EU
Gd
BY Er
Yb
CREE
La&mN
GdN/YbN
ce/ce*
EUIEU”
15.5
33.8 47.3 15.8 20.8
2.91 3.91
0.76 0.86
2.27 3.02
I.67 2.38
0.88 1.30
0.81 1 19
74.5
3.3
2.3 2.1
1.04
0.89 0.77
21.0
44.1
20.6
3.85
0.84
2.91
2.26
1.24
1.16
98.6
3.4
2.1
1.02
0.76
strntigraphie 13 (A) 22 21 17
24.6 5.8 4.0 4.6
51.7 22.0 12.9 19.2
22.9 7.3 4.6 6.2
4.30 1.65 1.14 1.74
0.95 0.49 0.37 0.54
3.37 1.62 1.18 1.75
2.67 1.63 1.24 1.68
1.49 0.91 0.77 0.98
1.40 0.84 0.80 0.95
113.4 42.2 27.0 37.6
3.6 2.2 2.2 1.7
2.0 1.6 1.2 1.5
I .03 1.68 1.48 1.80
0.76 0.92 0.98 0.95
4.8 3.9
16.5 16.8 12.0
6.2 6.2 6.1
1.58 1.60 1.58
0.46 0.46 0.46
1.52 1.57 1.56
1.53 1.54 1.47
0.90 0.92 0.86
0.89 0.91 0.84
34.8 28.8
1.9 1.6
1.4 1.4 1.5
1.53 1.26
0.90 0.90 0.90
3
17.8
37.6
17.1
3.03
0.88
2.23
1.64
0.86
0.81
82.0
3.7
2.2
1.02
1.03
6 11 30 29 (A) 32 BCR-1 Cl
23.6 12.9 22.4 18.9 25.5 0.367
45.0 46.1 29.4 53.1 42.2 54.5 0.957
20.4 21.1 13.0 24.9 19.0 28.6 0.711
3.75 3.89 2.41 5.15 3.48 6.62 0.23 1
0.95 1.03 0.71 1.04 0.86 1.94 0.087
2.91 3.32 1.91 4.81 2.94 6.71 0.306
2.20 2.79 1.54 4.74 1.86 6.42 0.381
1.18 1.49 0.83 2.87 0 99 3.69 0.249
1 10 1.34 0.76 2.46 0.95 3.40 0.248
101.1 63.5 121.5 91.2
4.0 3.4 2..7 3.4
2.1 2.0 2.0 1.6 2.5
0.96 1.08 1.10 1.07
0.88 0.88 1.01 0.64 0.82
t listed in ascending order, ‘(A)’ fine-grained samples. ZREE calculated as the sum of the REE reported here. BCR-I values are average of two analyses. CI chondrite normalizing values from Taylor and McLennan (1985).

934 D. K. McDaniel et al.
XREE > 60ppm
LaN/SmN> 3.2 Ce/Ce' = 0.96. 1.1
La Ce Nd SmEuGd Dy Er Yb
FIG. 3. Chondrite normalized REE plot ofChelmsford Formation samples. Sandstones are denoted by solid lines, and fine-grained samples by dashed lines. Note two distinct pattern types, one (circles) with LREE-enriched, smooth patterns. the other (diamonds) with less LREE-enrichment and pronounced Ce anomalies.
abundances (ZREE > 60 ppm), smooth patterns with con- siderable LREE enrichment ( LaN/SmN > 3.2. where the subscript ‘N’ refers to chondrite normalized abundances),
and GdN/YbN 2 2.0 (Fig. 3). Samples collected higher in the measured section have ZREE abundances less than 50
ppm, flatter patterns ( LaN/SmN < 2.2 and GdN/YbN < 1.6), and positive Ce anomalies. Ce/Ce* describes the magnitude of the Ce anomaly in a REE pattern; where Ce* is a calculated abundance assuming a smooth REE pattern. Praseodymium was not analyzed, therefore, Ce* has been calculated as a weighted geometric mean of LaN and NdN, such that
Ce Ce, -= Ce* Lai;’ X Nd’13 N
Ce/Ce* values of less than 1 indicate negative Ce anomalies, and values greater than 1, positive enrichment. Values of Ce/ Ce* for the less LREE-enriched set of samples are between 1.26 and 1.80, compared to values of between 0.96 and 1. IO for the more LREE-enriched samples. Eu/Eu* describes the enrichment of Eu relative to Sm and Gd, similar to Ce/Ce*, where Eu * is the geometric mean of SmN and GdN. Europium anomalies in the Chelmsford Formation are variable; Eu/ Eu * ranges from 0.64 to I .03. Most of the variation is present in the most LREE-enriched samples; among the less LREE- enriched samples, Eu/Eu* is between 0.90 and 0.98.
Three fine-grained samples of the Chelmsford Formation are included in this study, each associated with a medium- grained sandstone from the same Bouma sequence (‘A’ sam- ples, Table 1; dashed lines, Fig. 3 ). The REE patterns of two of these are parallel, and have similar abundances to the as- sociated sandstone. This includes one from the more LREE- enriched set and one from the less LREE-enriched set. Based on visual inspection, sample 29 appears to have the highest pelagic component of the three fine-grained rocks analyzed, and has a REE composition distinct from it’s associated sandstone (sample 30). Although the BREE of sample 29 is the highest of all samples analyzed ( 12 1.5 ppm), other REE characteristics are intermediate between the two extreme sample types: it has a slightly positive Ce anomaly (Ce/Ce* = l.lO), and intermediate LaN/SmN (2.7) and GdN/YbN
( 1.6). Sample 29 also has the greatest negative Eu anomaly
(Eu/Eu* = 0.64).
Nd Isotopes
Neodymium isotopic data are reported in Table 2. Present day tNd values (the deviation of the sample ‘43Nd/ ‘44Nd from a chondritic reference in parts per 104) for the more LREE- enriched set of samples are fairly uniform. between -27 and -29: those samples with less LREE-enrichment, however. have less negative and highly variable present day tNd values.
from -25 to - 16. TDM’s for the LREE-enriched samples (2700 to 2800 Ma) are within the range of Superior Province ages (e.g., MCCULLOCH and WASSERBURG, 1978, SHIREY
and HANSON, 1986), however, those for the less LREE-en- riched samples are highly variable and anomalously old (3200 to 4400 Ma). Sample 29 has a Nd model age of 3000 Ma. A plot of +,,, vs. time (Fig. 4) shows that the LREE-enriched samples follow an evolutionary trend that is uniform and have model ages similar to those found in the Superior Prov-
ince. The paths of the less LREE-enriched samples, however, are scattered. The sample with the shallowest slope ( 17) also has the oldest model age (4400 Ma). On the basis of REE patterns and neodymium isotopic composition, the two dis-
tinct sample types will be referred to as normal and anom- alous for the remaining discussion.
Samples from the base of the Chelmsford Formation have normal REE patterns, whereas those samples with anomalous patterns occur at higher stratigraphic positions. This variation may signify a fundamental difference in the variables that influence the process of REE redistribution (e.g., weathering intensity or style. or variations in the original mineralogic
Table 2. Nd isotopic compositions.
0.511258
-0.4220 0 511236
-0.4232 0511236
-0 3047 0.511363
-0 2410 0 511554
-0.1376 0.511841 0511848
-0.2147 0.511744 0511757
-0 2068 0.511746 0.511743
-0.4546 0.511168
-0.433 1 0 511202
-0.4326 0.511251 0 511267
-0.4309 0511185
-0.3639 0.511336 0511344
-0 4362 0511211
Sample l47_Q’
fSmlNd a
ENd &Nd TDM
144Nd 144Nd (1800 Ma) (Ma)
23 0 1139 -0.4209 0 511260
14 0 1137
13(A) 0 1135
22 0.1368
21 0 1493
17 0 1696
la(A) 0 1545
15 I 0 1560
3 0 1073
6 0.1115
11 0.1116
30 0 1119
29~ 0.1251
32 0.1109
-26.90 -7.88 2780
-27 36 -8 29 2810
-27 35 -8.25 2800
-24 86 -1 I 08 3370
-21 15 -1039 3590
-15 48 -9.28
-1731 -7 53
-1743 -8 23
-28.69 -8 12
-28 01 -8.36
-26 90 -7 33
-28.33 -8 90
-25.32 -8 87
4430
3370
3520
2740
2790
2720
2840
2980
0 511207 -27.88 -8.14 2770
‘(A)‘=fine-grained samples. Depleted mantle values from Taylor and
McLennan (1985).
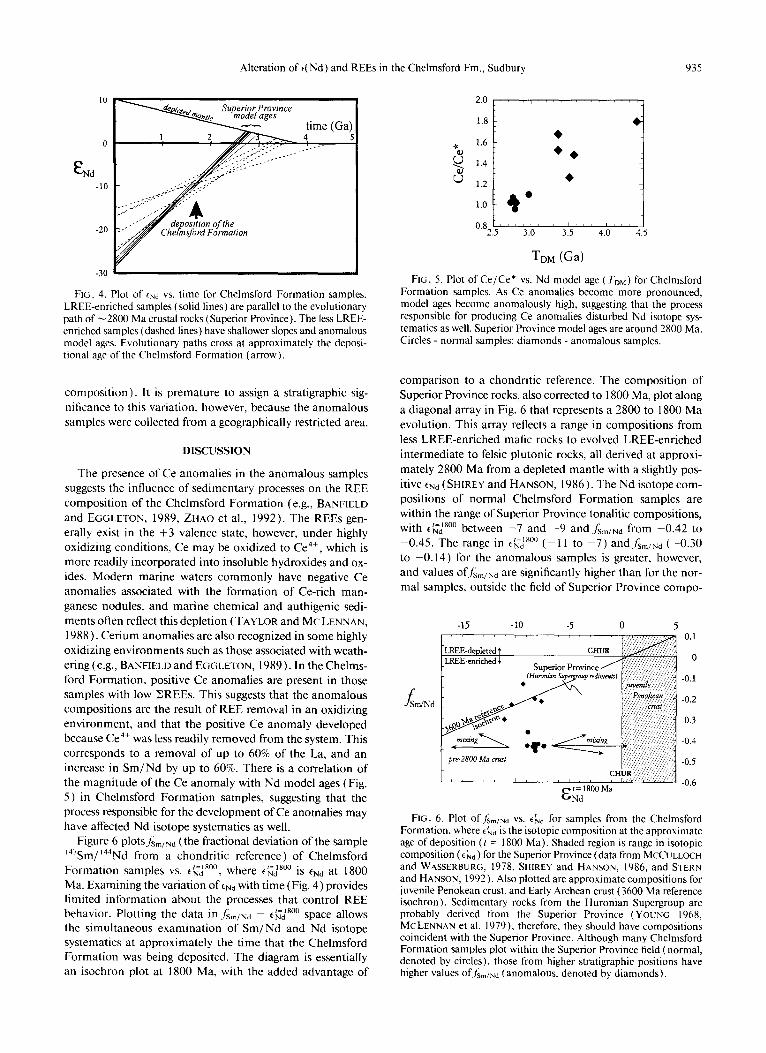
Alteration of c(Nd) and REEs in the Chelmsford Fm., Sudbury 935
-30
FIG. 4. Plot of tNd vs. time for Chelmsford Formation samples. LREE-enriched samples (solid lines) are parallel to the evolutionary path of -2800 Ma crustal rocks (Superior Province). The less LREE- enriched samples (dashed lines) have shallower slopes and anomalous model ages. Evolutionary paths cross at approximately the deposi- tional age of the Chelmsford Formation (arrow).
composition). It is premature to assign a stratigraphic sig-
nificance to this variation, however, because the anomalous samples were collected from a geographically restricted area.
DISCUSSION
The presence of Ce anomalies in the anomalous samples suggests the influence of sedimentary processes on the REE
composition of the Chelmsford Formation (e.g., BANFIELD
and EGGLETON, 1989, ZHAO et al., 1992). The REEs gen-
erally exist in the +3 valence state, however, under highly oxidizing conditions, Ce may be oxidized to Ce“+, which is more readily incorporated into insoluble hydroxides and ox- ides. Modern marine waters commonly have negative Ce anomalies associated with the formation of Ce-rich man-
ganese nodules, and marine chemical and authigenic sedi- ments often reflect this depletion (TAYLOR and MCLENNAN, 1988 ). Cerium anomalies are also recognized in some highly oxidizing environments such as those associated with weath-
ering (e.g., BANFIELD and EGGLETON, 1989). In the Chelms- ford Formation, positive Ce anomalies are present in those samples with low BREEs. This suggests that the anomalous compositions are the result of REE removal in an oxidizing
environment, and that the positive Ce anomaly developed because Ce 4+ was less readily removed from the system. This corresponds to a removal of up to 60% of the La, and an increase in Sm/Nd by up to 60%. There is a correlation of the magnitude of the Ce anomaly with Nd model ages (Fig. 5 ) in Chelmsford Formation samples, suggesting that the process responsible for the development of Ce anomalies may
have affected Nd isotope systematics as well. Figure 6 plotsfs,,Nd (the fractional deviation of the sample
‘47Sm/‘44Nd from a chondritic reference) of Chelmsford Formation samples vs. ,EJ800, where CN,, 1=‘800 is tNd at 1800 Ma. Examining the variation of tNd with time (Fig. 4) provides limited information about the processes that control REE behavior. Plotting the data in j&Nd - ~~~““” space allows the simultaneous examination of Sm/Nd and Nd isotope systematics at approximately the time that the Chelmsford Formation was being deposited. The diagram is essentially an isochron plot at 1800 Ma, with the added advantage of
2.0 I
1.8 - t
3
1.6 - +
++
3 1.4 -
u 1.2. +
1.0 i 3 .
o.82.5 I,,,,, ,,,I,,,,
3.0 3.5 4.0 4.5
TDM (Gal
FIG. 5. Plot of Ce/Ce* vs. Nd model age ( TDM) for Chelmsford Formation samples. As Ce anomalies become more pronounced, model ages become anomalously high, suggesting that the process responsible for producing Ce anomalies disturbed Nd isotope sys- tematics as well. Superior Province model ages are around 2800 Ma. Circles - normal samples; diamonds - anomalous samples.
comparison to a chondritic reference. The composition of Superior Province rocks, also corrected to 1800 Ma, plot along
a diagonal array in Fig. 6 that represents a 2800 to 1800 Ma evolution. This array reflects a range in compositions from
less LREE-enriched mafic rocks to evolved LREE-enriched intermediate to felsic plutonic rocks, all derived at approxi-
mately 2800 Ma from a depleted mantle with a slightly pos-
itive tNd ( SHIREY and HANSON, 1986). The Nd isotope com- positions of normal Chelmsford Formation samples are within the range of Superior Province tonalitic compositions, with e~~800 between -7 and -9 and,f,,,., from -0.42 to -0.45. The range in ,&“” (-I 1 to -7) and,fsmiNd (-0.30 to -0.14) for the anomalous samples is greater, however, and values off&N, are significantly higher than for the nor- mal samples, outside the field of Superior Province compo-
-15 -10 -5 0 5
f WNd
Gl1*00 Ma
0.1
0
-0.1
-0.2
-0.3
-0.4
-0.5
-0.6
FIG. 6. Plot of fsmlNd vs. thd for samples from the Chelmsford Formation, where eb,, is the isotopic composition at the approximate age of deposition (1 = 1800 Ma). Shaded region is range in isotopic composition ( tLd) for the Superior Province (data from MCCULLOCYH and WASSERBURG, 1978. SH~REY and HANSON, 1986, and STERN and HANSON, 1992). Also plotted are approximate compositions for juvenile Penokean crust. and Early Archean crust (3600 Ma reference isochron). Sedimentary rocks from the Huronian Supergroup are probably derived from the Superior Province (YOUNG 1968, MCLENNAN et al. 1979), therefore, they should have compositions coincident with the Superior Province. Although many Chelmsford Formation samples plot within the Superior Province field (normal, denoted by circles), those from higher stratigraphic positions have higher values of/&Nd (anomalous, denoted by diamonds).

936 D. K. McDaniel et al.
sitions. Sample 29, the argillite from the base of the section,
occupies an intermediate position in both Figs. 5 and 6, sug-
gesting that its REE composition is the result of the same process which affected the stratigraphically higher sandstones and siltstones. The high ZREE and extreme Eu anomaly may due to mineralogical controls (e.g., relative depletion ofquartz
and feldspar in the fine-grained fraction of turbidite flows), and/or may reflect a higher proportion of a distinct Archean
source (e.g., high-K granites).
Mixing With a Second Source
The Pb isotope data for the anomalous samples indicate
that they were derived in large part from Superior Province rocks. Nevertheless, we evaluate the possibility that the array
of compositions in Fig. 6 reflects mixing of sediments from one or more additional sources with sediment derived from
Superior Province rocks. Sample 17, with the highestfS,lNd, is chosen from the anomalous set of samples, and sample 6 from the normal set in mixing of Superior Province rocks
with an unknown component to evaluate the possible un- known component (Fig. 7). Mass balance indicates that a maximum of 20% of sample 17 may be composed of an endmember resembling sample 6. This constraint corresponds to a La abundance approaching 0 ppm for the unknown end- member. REE patterns associated with the unknown com- ponent are unreasonable, however, unless the anomalous samples are virtually entirely composed of that component.
The normal and anomalous samples are virtually indistin-
guishable on the basis of petrography, and major- and trace- element geochemistry (MCDANIEL et al., 1994), and the Pb- isotopic composition of anomalous sample 17 is similar to that of normal samples (Fig. 2) reflecting Superior Province derivation. Two feldspar populations taken from sample 17 have composiGons that require derivation from Superior
Province rocks. If mixing was the only mechanism responsible for the composition of anomalous Chelmsford Formation samples, this would be difficult to reconcile with the 20%
- .j81%
FIG. 7. REE plot illustrating requirements of an endmember com- position for a simple mixture of two sources. Solid lines are patterns of sample 6, a normal sample, and sample 17, the anomalous sample with the highest/&+,. Dashed lines are calculated REE patterns for the second endmember. Numbers are percent of the calculated second source required in the mix. Sample 17 must be comprised of a min- imum of 8 1% of such a second source; this is not consistent with the petrography, geochemistry, or Pb isotopic composition of the samples.
Superior Province constraint. A large component of the sec-
ond source in the anomalous samples imposes significant
restrictions on that source: it must be petrographically and geochemically similar to Superior Province rocks and satisfy the requirements imposed by Pb isotopes.
Among possible sources in proximity to the Sudbury Basin,
a large component of Huronian Supergroup sedimentary rocks is ruled out on the basis of petrography and geochem- istry. Neodymium and lead isotope systematics do not sup-
port a significant component of Penokean ( 1800 Ma) juvenile
crust and/or old (pre-2800 Ma) crust (see mixing arrays, Fig. 6). Fractionation of the REEs during melting of Superior
Province crust at approximately 1800 Ma (e.g., the Sudbury Igneous Complex, Penokean erogenic melts) would produce rocks with the isotopic composition ofthe Superior Province
but variable&,,, On an fSmlNd vs. tNd diagram, these melts could form an array of compositions similar to the Chelms-
ford Formation. Feldspar derived from an igneous rock formed by melting of Superior Province crust at 1800 Ma,
however, would record the Pb-isotopic composition of the rocks at 1800 Ma and would lie along a 2800 to 1800 Ma isochron projected from Superior Province initial composi-
tions. It is not reasonable to expect that feldspar populations taken from a rock consisting of 280% Archean crust melted at 1800 Ma would have undisturbed Archean Superior Prov- ince compositions.
Sedimentary Redistribution of the REE
We suggest that all of the Chelmsford Formation samples
were derived from Superior Province rocks. and that the REE and Nd isotope composition of the anomalous samples is the result of Early Proterozoic sedimentary re-equilibration and redistribution of the REE. This process may have occurred during weathering at the source, or alternatively, may have occurred at any point along the path of the sediment to the
basin. In order to fully appreciate the effects of REE redistribution
on Nd isotope systematics, it is instructive to construct a simplified model for the sedimentary history of an igneous source ( Fig. 8 ). As minerals from an igneous rock are crys- tallized from a melt, each phase will have the isotopic com- position of the melt, and variable Sm/Nd, according to the affinity of that phase for the different REEs. Plotted on an
f Sm,Nd vs. thd diagram at the time of crystallization (2800 Ma), the igneous source and its constituent minerals will form a vertical array, with similar values oft& and a range in f&,lNd (Fig. 8A). Similarly, separate rock types extracted from the melt will have the isotopic composition of the total melt, and a range of Sm/Nd, and therefore, form a vertical array at the time of crystallization. The isotopic composition of igneous rocks and their constituents evolve at a rate de- termined by their Sm/Nd, therefore, plotted at a later time ( 1800 Ma), they will lie on a diagonal array, or isochron, where the slope is a function of age (Fig. 8A). At this time,
the REEs in the rock may either totally or partially re- equilibrate during recrystallization. If the rock is completely reequilibrated, the isotopic and REE composition of the var- ious phases in the whole-rock homogenize, and subsequent phases that form will have the isotopic composition of the

Alteration of t( Nd) and REEs in the Chelmsford Fm., Sudbury 937
-0.2
f Sm/Nd -0.4
-0.6
(e) immpkte recquilibratibn I
t=1800 Ma
/ -15 -10 w-5 0 5
E Nd
-15 -10
EJ O 5 Nd
FIG. 8. Schematic examination of Nd isotope systematics for the history of an igneous source. Large squares represent whole-rock compositions, small squares are mineral phases. (A) Igneous rock crystallized at 2800 Ma and it’s constituent minerals form a vertical array (isochron) when plotted at 2800 Ma (open squares). The rate of isotopic evolution is controlled by the Sm/Nd so that, plotted at later time, such as 1800 Ma, a diagonal array, is produced (filled squares). (B) If the original rock is completely recrystallized at 1800 Ma, phases crystallizing at that time will have the isotopic composition of the whole-rock (filled square) and form a vertical array when plotted at 1800 Ma. (C) The isotopic composition of Nd homogenized at 1800 Ma (dashed square) will be controlled by the composition of unstable phases, and will fall along the diagonal trend of the rock’s original constituents. As such, it may have a different isotopic composition than the whole rock (filled square), and recrystallizing phases will have this isotopic composition and form a vertical array at 1800 Ma. (D) Physical removal of undisturbed minerals from the Superior Province (2800 Ma) source will shift the composition of the remaining sediment diagonally along the trend of the source (dashed arrows). In the case of complete rehomogenization, removal of a recrystallized ( I800 Ma) phase will shift the composition of the remaining rock vertically (solid arrows). (E and F) Possible explanations for the more negative values of and greater variability in cNd for the anomalous Chelmsford Formation samples compared to the normal samples. In E, solid arrows depict possible path for incomplete homogenization at I800 Ma. Low,/ &,, phase (small square), from Nd reservoir with less negative tfNd and higherf sm,Nd (dashed square) is removed from whole-rock ( normal samples field) to produce the composition of the anomalous samples (large square). In F, dashed arrows represent path of a more heterogeneous source for the anomalous samples. It is likely that both mechanisms play a role in the composition of the Chelmsford Formation. Superior Province field from data of MCCULLOCH and WASSERBURG ( 1978). SHIREY and HANSON (1986), and STERN and HANSON (1992).
whole-rock. Their Sm/Nd will be controlled by the phase, and thus form a vertical array at the time of recrystallization (Fig. 8B). This array is an isochron with an age ( 1800 Ma), and an initial isotopic composition ( tNd = -8), and the Nd isotope system has in this case been effectively reset on a mineralogical scale.
In a case where only a portion of the minerals are disturbed, the weighted average REE and neodymium isotopic com- position of the unstable phases will control the composition of the recrystallizing phases. For example, in Fig. 8c, if the
REE composition of the reequilibrating phases has a greater Sm/Nd (higher fSmiNd) than the whole-rock, tNd will be less negative, and shifted from the whole-rock composition to-
wards the upper right along the diagonal trend of the igneous rock. Newly crystallizing phases will, therefore, have a less negative isotopic composition than the whole-rock and vari- ablefsmlNdr and lie on a vertical trend when plotted at 1800 Ma (Fig. 8~).
Mineral sorting can alter the REE composition of a sedi- mentary rock (MCLENNAN, 1989). In Fig. 8d it can be seen

938 D. K. McDaniel et al
that simple physical removal of an igneous REE phase from
the 2800 Ma rock will shift the composition of the remaining
material along the 2800 Ma trend, away from the removed
phase (dashed arrows). If the removed phase has a low fSmlNdr the remaining sediment will have a higher fSmiNd and less negative cNd. For an undisturbed Archean rock with a short- lived crustal source, each mineral component within the rock preserves the isotopic composition of the mantle at the time
of extraction. Thus, although the removal of REEs by purely physical means may alter the Sm/Nd and neodymium iso-
topic composition, it will not significantly alter the apparent mantle extraction age of the remaining material. This pre-
cludes the composition of the anomalous Chelmsford For- mation samples from being purely the product of physical
removal of Superior Province-derived REEs. If one assumes total reequilibration at 1800 Ma, however, the removal of recrystallized REE phases will adjust the composition of the
remaining rock vertically (solid arrows, Fig. 8d). Although the anomalous samples have cg,*“” values within the range of Superior Province compositions, values offsmiNd are higher.
Using mass balance calculations on two samples from the Chelmsford Formation. we constrain the REE composition of phases that may have been removed. Sample 17, with the
highest,/&,,ud. is chosen from the anomalous set, and sample 6 represents the unaltered endmember from which the sed- imentary phase is removed to give the REE pattern of sample 17. Figure 9 is a plot of the REE abundances and accom- panying percentages of removed phases, and shows that if the removed phase has a high LREE abundance (e.g., La
= IO’ X chondrite), it need only make up a small percentage of the original rock (e.g.. 0.05%). The LaN/SmN associated with this phase is 5.9, and.fsmlwud is ~0.56. The shape of the LREE in this phase is not highly dependent on which normal samples are used in the calculation; the total range of LaN/ Sm, obtained in similar calculations is from 4.8 to 7.8. Pat- terns for the removed phase resemble REE compositions of
1A La Ce Nd SmEuGd Dy Er Yb
FIG. 9. Plot of REE-removal modeling results. Solid lines are pat- terns of sample 6. a normal sample, and sample 17. the anomalous sample with the highestfsmlNd. Dashed lines are patterns associated with phase removed. numbers are percent that phase needs to make up of the total source. If the removed phase has high LREE abun- dances (e.g.. IO5 X chondrite) it need only make up a small percentage (e.g.. 0.05%) of the original source. Shaded region is range in com- position for florencite, a sedimentary mineral developed in a weath- ering protile and reported by BANFIELD and EGGLETON (1989).
trace LREE-enriched minerals (e.g., rhabdophane, florencite,
and monazite) with slight negative Ce anomalies.
REE redistribution during weathering and transport vs. postdepositional redistribution
A microprobe study of a granite weathering profile by BANFIELD and EGGLETON (1989) reports evidence for dra- matic fractionation of the REE during early stages of weath-
ering. They observed LREE-phosphates (rhabdophane and florencite) replacing apatite in weathered portions of the rock. These phases are characterized by high abundances of the
LREE, and in many cases, extreme negative Ce anomalies (Fig. 9). They suggested that, during early stages of weath- ering, unstable LREE-enriched minerals in the unaltered granite (e.g., allanite) dissolve and the REE complex with apatite-derived phosphate to form LREE-phosphates. Upon
dissolution, Ce3+ oxidizes to Ce4+ and rapidly precipitates as Ce hydroxides, thus allowing the formation of negative Ce anomalies in the sedimentary phosphates. The majority of REEs in many igneous rocks reside in trace phases (e.g.,
GROMET and SILVER, 1983). During weathering, these phases may break down and new LREE-enriched phases may form which have an isotopic composition at the time of formation
similar to that ofthe parent rock. With regard to the Chelms- ford Formation, subsequent removal of that phase by chem- ical or physical means would produce a sediment with the REE composition of the anomalous samples.
Evidence that REEs may be redistributed and fractionated following deposition is present in a turbidite sequence from central Wales ( MILODOWSKI and ZALASIEWICZ, 1991), where sandstones and shales within some Bouma units have com- positions that are LREE-depleted relative to NASC (North American Shale Composite), and hemipelagic layers pre- served at the top of these units have complimentary LREE-
enriched patterns. Cerium anomalies are not well developed. The occurrence of monazite nodules in the hemipelagites suggests that the REEs from coarser sediment may have been released by dissolution of REE phases, transported upwards to the organic-rich sediment, and reprecipitated (MILO-
DOWSKI and ZALASIEWICZ, 1991). A similar process could be responsible for the composition of the Chelmsford For- mation, however, no REE patterns which compliment the anomalous samples are found. Pelagic units are rare within the Chelmsford Formation; thus, if this process occurred in the Chelmsford Formation samples. it may be that the REEs were redistributed prior to deposition of the next turbidite flow, which stripped the upper LREE-enriched layer.
If the REEs were removed during burial diagenesis of the
Chelmsford Formation, they would have to have been trans- ported in solution on scales larger than the size of a hand sample, since physical removal of a LREE-enriched phase would not be possible. The dissolution and transport of such large quantities of the REEs would require a massive volume of diagenetic fluid moving through the system. In addition, although removal of the REEs during diagenesis (or meta- morphism) cannot be excluded, Ce anomalies suggest a sur- ficial process in an oxidizing environment produced the REE composition of the Chelmsford Formation.

Alteration of e(Nd) and REEs in the Chelmsford Fm., Sudbury 939
Source heterogeneity and incomplete isotopic reequilihration
At 1800 Ma, the range in tNd for normal samples of the Chelmsford Formation is small. tEJEoO for the anomalous samples is more variable, however, and tends to be more negative. Three possible explanations arise from this obser-
vation: ( 1) The time of reequilibration is more recent than 1800
Ma. This may account for the more negative tly=bsoO values,
however, it will not explain the greater variability. A sample
with an fs,,,,~~ of -0.2 WOkS at the rate Of about 0.5 ENd units per 100 Ma, therefore, the discrepancy between the
sedimentation age and the time of reequilibration would be
quite large. Although post-depositional reequilibration cannot be ruled out, we do not prefer this mechanism because Ce
anomalies suggest a surficial process. Similarly, recent alter-
ation during weathering or sample preparation superimposed on the reequilibration event could account for the scatter and more negative values of t’=18” Nd . In order to minimize this possibility, we collected fresh samples and performed
replicate analyses. In addition, both anomalous and normal
samples were collected from similar outcrop types and were treated identically in the lab. Although this possibility cannot
be ruled out, neither is it likely.
(2) The original source for the anomalous samples was
only partially reequilibrated. If only a portion of the REEs in the source was rehomogenized, removed sedimentary phases would have the isotopic composition of the Nd in that portion of the rock (Fig. 8~). Thus, the composition of the remaining material would be shifted diagonally (Fig. 8e). In the case of the Chelmsford Formation samples, this requires that the rehomogenized REEs had a higher Sm/Nd and less negative tNd (dashed square, Fig. 8e). The subsequent removal of a low Sm/Nd sedimentary mineral from the whole-rock would shift the composition of the source towards a higher Sm/Nd and more negative tNd (solid arrows, Fig. 8e).
( 3) The source of the anomalous samples was more het- erogeneous than that of the normal samples. This is illustrated in Fig. 8f by the dashed arrows. Although the Chelmsford Formation is derived principally from Superior Province rocks, different units within the basin may have sampled dif- ferent regions with different geologies and slightly different Nd systematics.
Although the scenario described in (2) explains the com- position of the Chelmsford Formation, the path is convoluted and somewhat ad hoc. On the other hand, the analyzed sam- ples are coarse grained, and have substantial undisturbed de- trital minerals. It is unlikely that the Nd of the source of the anomalous samples was entirely reset, therefore, and the iso-
topic composition of the removed Nd could easily differ from that of the average sediment. Thus, we suggest that the scatter in, and more negative values of ~~~800 for the anomalous samples of the Chelmsford Formation is a result of isotopic variability within the provenance, and that incomplete iso- topic reequilibration may be a contributing factor.
Neodymium Isotopes and Sedimentary Provenance Studies
The Chelmsford Formation provides compelling evidence that the REE can be redistributed and Nd isotopes reset during
sedimentary processes. Nevertheless, Nd isotopes remain a
powerful provenance tool, and in this study provide strong
constraints on the source of the Chelmsford Formation. One
has to be concerned, however, about the indiscriminate use of Nd model ages to evaluate provenance. The coherence of Nd isotopes in a sedimentary system can be tested, and fur-
thermore, valuable provenance information can be extracted. The results presented here, however, indicate that such in-
formation is best extracted when ( 1) several samples from
the same sedimentary sequence are analyzed. It is not possible to fully evaluate the systematics of any isotopic system with
a single sample. In the Chelmsford Formation, it is the array
produced by several samples that allows us to recognize sed-
imentary redistribution. (2) Sm/Nd and Nd isotopes are ex-
amined simultaneously. Many studies rely on the use of Nd model ages, or alternatively, on plots of tNd vs. time without
consideration of the Sm/Nd or shape of the REE pattern. This does not readily allow the recognition of sedimentary redistribution. For example, with the exception of sample 17
( TDM = 4430 Ma), model ages for the anomalous samples
(3370 to 3590 Ma) may have been interpreted as a mixture of Early Archean and Superior Province crust. When ex-
amined infs,,,,.d - tNd space, however, it becomes clear that this is not possible, because the anomalous sample do not lie on a mixing array of Early Archean and Superior Province
crust (Fig. 6). In addition, we suggest that, in accordance
with the data presented here, sedimentary rocks with Sm/ Nd significantly different than average upper crustal values (j&d between -0.4 and -0.5), are suspect and should be examined closely for the effects of sedimentary redistribution of the REE.
Several questions remain and include: Why has this process only recently been recognized? How often does it occur? Provenance studies that present Nd isotope data in the ab- sence of REE patterns, or even in the absence of Sm/Nd measurements, are not suited to recognition of sedimentary REE redistribution, especially if they consist of few samples
that are widely scattered in space or time. It should be noted that studies that have recognized disturbance of the Nd iso- tope system have consisted of careful examination of REE patterns and Nd isotopes for several samples within a sedi- mentary sequence (e.g., ZHAO et al., 1992, BOCK et al., 1993).
In addition, many provenance studies are conducted on sedimentary rocks associated with larger sedimentary basins. Thus, although fractionation of the REEs may occur during
weathering, the homogenizing effects of large sampling areas may overwhelm these effects if they are local. In contrast, turbidites of the Chelmsford Formation were deposited quickly, and were dominantly derived from a single, nearby source terrane. Sedimentary environments such as associated with the Chelmsford Formation may provide ideal preser- vation conditions. As provenance studies on sedimentary
rocks from local basins associated with limited drainage basins become more common, it may be that sedimentary redistri- bution of the REE will become more widely recognized.
CONCLUSIONS
The Chelmsford Formation is a first-cycle sediment derived almost exclusively from rocks within the Superior Province.
940 D. K. McDaniel et al.
Petrographic data, major- and trace-element geochemistry,
and whole-rock Pb isotopes support this interpretation. Fur-
thermore, the Pb isotopic composition of feldspar populations
requires an undisturbed Superior Province source. The REE and Nd model ages ( TDM) for most of the samples from the base of the formation unambiguously show derivation from Superior Province rocks. Five samples from higher in the
stratigraphic section, however, have anomalously old model ages, and distinct REE patterns with pronounced positive Ce anomalies, and relative depletion of the LREEs.
It is interpreted that the REE composition and Nd isotope systematics of some samples from the Chelmsford Formation are the result of isotopic reequilibration and fractionation
and removal of Superior Province REEs at approximately
the time of deposition ( 1800 Ma). This is most readily achieved by partial rehomogenization of the REEs during
early stages of weathering and subsequent removal of a LREE- enriched sedimentary phase during transport and sedimen-
tation. This study demonstrates the need for caution in the ap-
plication of Nd isotopes alone to evaluate the source character of sedimentary rocks. In cases where the REEs of the source are being chemically redistributed, subsequent sedimentary processes can significantly modify Nd isotope systematics and Nd model ages may be erroneous. We conclude that simul- taneously plotting Sm/Nd and Nd isotope data for several
Samph3 from a sedimentary SCqUenCC On f&,,,~d Vs. cNd (Or
isochron) plots is required to correctly interpret Nd isotope data.
Acknowledgments-Grants from the National Science Foundation (EAR 8816386 and EAR 8957784) to S. M. McLennan funded this research. The manuscript was impioved by the insightful reviews of Peter Gromet, Carol Frost, H. Staudigel, and Jianxin Zhao. James Sevigny and Barbara Bock assisted in the collection of Nd isotope data and reviewed early drafts of the manuscript.
Editorial handling: S. R. Taylor
REFERENCES
BANFIELD J. F. and EGGLETON R. A. ( 1989) Apatite replacement and rare earth mobilization, fractionation, and fixation during weathering. CrapS Clay Mineral. 37, 113-127.
BOCK B., MCLENNAN S. M., and HANSON G. N. ( 1993) Rearrange- ment of REE’s in Austin Glen Fm. (Ord.), Ulster Co., NY. Geul. SW. Amer., Abstracts with Program, Northeastern Section 25, 5.
CAMERON A. E., SMITH D. H., and WALKER R. L. (1969) Mass spectrometry of nanogram-size samples of lead. Anal. Chem. 41, 525-526.
MILLER R. G., O’NIONS R. K.. HAMILTON P. J., and WELIN E. ( 1986) Crustal residence ages of elastic sediments, orogeny and crustal evolution. Chem. Geology! 57, 87-99.
MILODOWSKI A. E. and ZALASIEWICZ J. A. ( 199 I ) Redistribution of rare earth elements during diagenesis of turbidite/hemipelagite mudrock sequences of Llandovery age from Central Wales. In De- velopments in Sedimentary Provenance St1rdie.y (ed. A. C. MORTON, et al.); Geol. SW. Spec. Pahl. 57, 101-124.
NATHAN S. f 1976) Geochemistrv of the Greenland Grouo (Earlv Proterozoic), New Zealand. h;& Zealand J. Geol. Geoihis. 16, 683-706.
CANTIN R. and WALKER R. G. ( 1972) Was the Sudbury Basin circular during deposition of the Chelmsford Formation? Geol. Assoc. Canada Spec. Paper 10, 93- 10 1.
NELSON B. K. and DEPAOLO D. J. (1988) Comparison of isotopic and petrographic provenance indicators in sediments from tertiary conlinentai basins of New Mexico. J. Sediment. Petrol 58, 348- 57.
CARD K. D., GUPTA V. K., MCGRATH P. K., and GRANT F. S. ( 1984) The Sudbury structure: Its regional geological and geo- physical setting. In The Geology and Ore Deposits of the Sudbury Structure (ed. E. G. PYE et al.), pp. 25-44. Ontario Geological Survey Special Volume I.
NESBITT H. W. ( 1979) Mobility and fractionation of rare earth ele- ments during weathering of a granodiorite. Nature 279, 206-210.
ROUSELL D. H. ( 1972) The Chelmsford Formation of the Sudbury Basin-a Precambrian turbidite. Geol. Assoc. Canada Spec. Paper 10, 79-9 1.
FAGGART B. E., BASU A. R., and TATSUMOTO M. ( 1985) Origin of the Sudbury Complex by meteorite impact: neodymium isotopic evidence. Science 230, 436-44 I.
SHIREV S. B. and HANSON G. N. ( 1986) Mantle heterogeneity and crustal recycling in Archean granite-greenstone belts: Evidence from Nd Isotopes and trace elements in the Rainy Lake area, Superior Province. Ontario, Canada. Geochim. Cosmochim. Actu SO, 263 l- 2651.
FAIRBAIRN H. W., FAURE G., PINSON W. H., JR., and HURLEY STEIGER R. H. and JAGER E. (1977) Subcommission on geochro-
P. M. ( 1968) Rb-Sr whole-rock age of the Sudbury lopolith and basin sediments. Canadian J. Earth Sci. 5, 707-714.
FOLK R. L. ( 1980) Petrology of Sedimentary Rocks. Hemphill. GARI~PY C. and ALL~GRE C. J. f 1985 ) The lead isotone eeochemistrv
and geochronology of late-kinemaiic intrusives from the Abitibi greenstone belt, and the implications for late Archean crustal evo- lution. Geochim. Cosmochim. Acta 49, 2371-2383.
GOODWIN, A. M. ( 1991) Precambrian Geology: The Dynamic Evo- lution (?f the Continental Crust. Acad. Press.
GROMET L. P. and SILVER L. T. ( 1983) Rare earth element distri- butions among minerals in a granodiorite and their petrogenetic implications. Geochim. Caymochim. Acta 47, 925-939.
KROGH T. E., DAVIS D. W., and CORFU F. ( 1984) Precise U-Pb zircon and baddeleyite ages for the Sudbury area. In The Geolog), and Ore Deposits of the Sudburv Structure (ed. E. G. PYE et al.) pp. 43 l-446. Ontario Geol. Suri. Special Vol. I.
KROGH T. E., CORFU F., DAVIS D. W., DUNNING G. R., HEAMAN L. M., KAMO S. L., and MACHADO N. ( 1987) Precise U-Pb iso- topic ages of diabase dykes and mafic to ultramalic rocks using trace amounts of baddeleyite and zircon. In Majc Dyke Swarms (ed. H. C. HALLS and W. F. FAHRIG), pp. 147-152. Geological Association of Canada Special Paper 34.
MCBRIDE E. F. ( 1985) Diagenetic processes that affect provenance determinations in sandstone. In Provenance e/‘Arenites (ed. G. G. ZUFFA), pp. 95-l 13. D. Reidel Publ. Co.
MCCULLOCH M. T. and WASSERBURG G. J. ( 1978) Sm-Nd and Rb- Sr chronology of continental crust formation. Science 200, lOO3- 1011.
MCDANIEL D. K., HEMMING S. R., MCLENNAN S. M., and HANSON G. N. (1994) An integration of petrographic, geochemical and isotopic data in the provenance analysis of the Early Proterozoic Chelmsford Formation, Sudbury Basin, Ontario. J. Sediment. Pe- trol. (submitted).
MCLENNAN S. M. ( 1989) Rare earth elements in sedimentary rocks: influence of provenance and sedimentary processes. In Geochem- istry and Mineralogy of the Rare Earth Elements. (ed. B. R. LIPIN and G. A. MCKAY ); Rev. Mineral. 21, 169-196.
MCLENNAN S. M., FRYER B. J., and YOUNG G. M. (1979) Rare earth elements in Huronian (Lower Proterozoic) sedimentary rocks: composition and evolution of the post-Kenoran upper crust. Geochim. Cosmochim. Acta 43, 375-388.
MCLENNAN S. M., HEMMING S., MCDANIEL D. K., and HANSON G. N. ( 1993) Geochemical approaches to sedimentation, prove- nance and tectonics. In Processes Controlling the Composition ef Ciastic Sediments (ed. M. J. JOHNSSON and A. BASU): Gent. SOC. America Special Paper 284 (in press).

Alteration of c( Nd) and REEs in the Chelmsford Fm., Sudbury 941
nology: Convention on the use of decay constants in geo- and cosmochronology. Eurth Planet. Sci. Lett. 36, 359-362.
STERN R. A. and HANSN G. N. ( 1991) Archean high-Mg grano- diorite: a derivative of light rare earth element-enriched monzo- diorite of mantle origin. J. Petrol. 32, 201-238.
STERN R. A. and HANSON G. N. ( 1992) Origin of Archean lampro- phyre dykes. Superior Province. Canada: rare earth element and Nd-Sr isotopic evidence. Con(rih. Mineral. Petrol. 111, 5 15-526.
TAYLOR S. R. and MCLENNAN S. M. ( 1985) The Continental Crlrsl. itA Compo.si/ion and Evolutron Blackwell.
TAYLOR S. R. and MCLENNAN S. M. ( 1988) The significance of the rare earths in geochemistry and cosmochemistry. In Handbook on the Physics and Chemistr_v qfRare Earths (ed. K. A. GSCHNEIDNER and L. EYRING), pp. 485-580. Elsevier.
WALKER R. J., MORGAN J. W., NALDRETT A. J., LI C., and FASSETT J. D. ( I99 I ) Re-0s isotope systematics of Ni-Cu sulfide ores, Sud- bury Igneous Complex, Ontario: evidence for a major crustal com- ponent. Earth Planer. Science Letl. 105, 4 16-429.
WASSERBURG G. J., JACOBSEN S. B., DEPAOLO D. J., MCCULLOCH M. T., and WEN T. ( 198 I ) Precise determination of Sm/Nd ratios, Sm and Nd isotopic abundances in standard solutions. Geochim. Cosmochim. Acfa 45, 23 I l-2323.
YOUNG G. M. ( 1968) Sedimentary structures in Huronian rocks of Ontario. Pulaeopog. Pulaeoclimatol. 4, 125-l 53.
ZHAO J. X., MCCULLOCH M. T., and BENNETT V. C. (1992) Sm- Nd and U-Pb zircon isotopic constraints on the provenance of sediments from the Amadeus Basin, central Australia: Evidence for REE fractionation. Geochim Cosmochim. Acta 56, 92 l-940.