reservoir engineering studies in hugoton-panoma systems
TRANSCRIPT

Reservoir Engineering Studies Reservoir Engineering Studies in Hugotonin Hugoton--PanomaPanoma SystemsSystems
Saibal Bhattacharya, Martin Dubois, Saibal Bhattacharya, Martin Dubois, Alan P. Byrnes, John Alan P. Byrnes, John DovetonDoveton, and , and
Geoff Geoff BohlingBohling
Opinions expressed in this presentation are those of the authors and are not necessarily those of the project’s
sponsors

Statement of the ObviousStatement of the ObviousReservoir simulation provides nonReservoir simulation provides non--unique solutionsunique solutionsResults do not describe the reservoirResults do not describe the reservoir–– Primary Input Primary Input –– A reservoir A reservoir geomodelgeomodel–– Results provide insights to production/pressure responses Results provide insights to production/pressure responses
from wells located in the input from wells located in the input geomodelgeomodelObjective of this studyObjective of this study–– Build a consistent geoBuild a consistent geo--model for the Hugotonmodel for the Hugoton--PanomaPanoma
reservoir system by reservoir system by Integrating available Integrating available wirelinewireline log, core, log, core, petrophysicalpetrophysical, production , production and DST dataand DST data
–– Input geoInput geo--model into CMG’s IMEX Simulatormodel into CMG’s IMEX Simulator–– Study production and pressure responses from wells located in Study production and pressure responses from wells located in
the the geomodelgeomodel–– Compare simulator predicted results with historic recordsCompare simulator predicted results with historic records–– Identify Identify geomodelgeomodel modifications to improve history matchmodifications to improve history match
THIS IS A WORK IN PROGRESSTHIS IS A WORK IN PROGRESS

HUG PARENT (CH P) HUG PARENT (CH P) –– 9 9 wells (1950wells (1950--60s, 46060s, 460--465psi)465psi)
PANOMA (CG) PANOMA (CG) –– 10 wells 10 wells (1970s, 265 (1970s, 265 psipsi))
HUG INFILL (CH I) HUG INFILL (CH I) -- 99
Simulation Study Area –
28 wells
Science Well

Simulation Inputs – 9 Section 28 wells25 layer Model Layer permeability - Tensor upscaling (Petrel)–– Appropriate multipliers Appropriate multipliers –– Layer K close to that cal from DST Layer K close to that cal from DST
All wells were hydraulically fractured– Physical characterizations of hydraulic fractures not available– Fractures tend to increase well productivity– Well productivity factor (ff) used to model enhanced well productivity
ff = 1.0 – unfractured well– Starting ff = 6.0 assigned to all wells
Well-level ff modifications carried out during history matchWell naming convention– Chase Parent – Prefix P– Chase Infill – Prefix I– Council Grove – Prefix CG
Starting well completions– Chase Parent – Herrington-Paddock to L Fort Riley (L1 to L9)– Chase Infill – Herrington-Paddock to Wreford (L1 to L11)– Council Grove – A1 LM to B5 LM (L13 to L23)

Inputs – Upscaled K and Flow ConstraintsLayer K inputs (at SCIENCE well) into simulator
Layer Formation Upscaled K, md DST K, md Multiplier1 Hrngtn-Paddock 5.668 6.9 12 Krider 47.422 90.30 1.93 Odell 0.017 9.7* 1
Wnf SS4 Wnf LS 1.620 7.60 4.75 Gage 0.064 Not Tested 1.06 Towanda 1.666 1.20 1.07 B/TWND 1.859 Not Tested 1.08 FTRLY 0.948 0.43 1.09 L/FTRLY 0.019 0.001 1.010 B/FTRLY 0.039 0.1 1.011 WREFORD 0.107 0.5 4.712 A1_SH 0.001 Not Tested 1.013 A1_LM 0.023 3.141** 1.014 B1_SH 0.002 Not Tested 1.015 B1_LM 0.123 0.1 1.016 B2_SH 0.004 Not Tested 1.017 B2_LM 0.755 10.2 13.518 B3_SH 0.002 Not Tested 1.019 B3_LM 0.047 0.01 1.020 B4_SH 0.001 Not Tested 1.021 B4_LM 0.676 3.2 4.722 B5_SH 0.002 Not Tested 1.023 B5_LM 11.558 72.1 6.224 C_SH 0.002 Not Tested 125 C_LM 0.089 Not Tested 1
* Not representative** Not a very representative valueMay not need a multiplier
Flow constraints imposed on wells
All wells flowed under rate constrained till end of production
data, i.e., Jun 2003.
Thereafter, all wells flowed under constant BHP = 14.7 psi from Jul
2003 to Jan 2004.
The intent is to see if the simulator calculated production rates from Jul 2003 follow the same decline trend established by the previous history.

Pi = 460 psi (196 bcf), ff = 6 for all other P wells (ff = 2 at PTrot24) P wells fractured – Jan 1, 1960 History match - Chase Parent wells
Red – Sim Qg
Blue – His Qg
Green – Sim FBHP
Gold – His FTHP
Prod matched in all CH P wells. Sim cal BHP close to WHFP and follows trend closely. Prod spike from Jul 2003 in most wells - presence of excess
flow capacity.
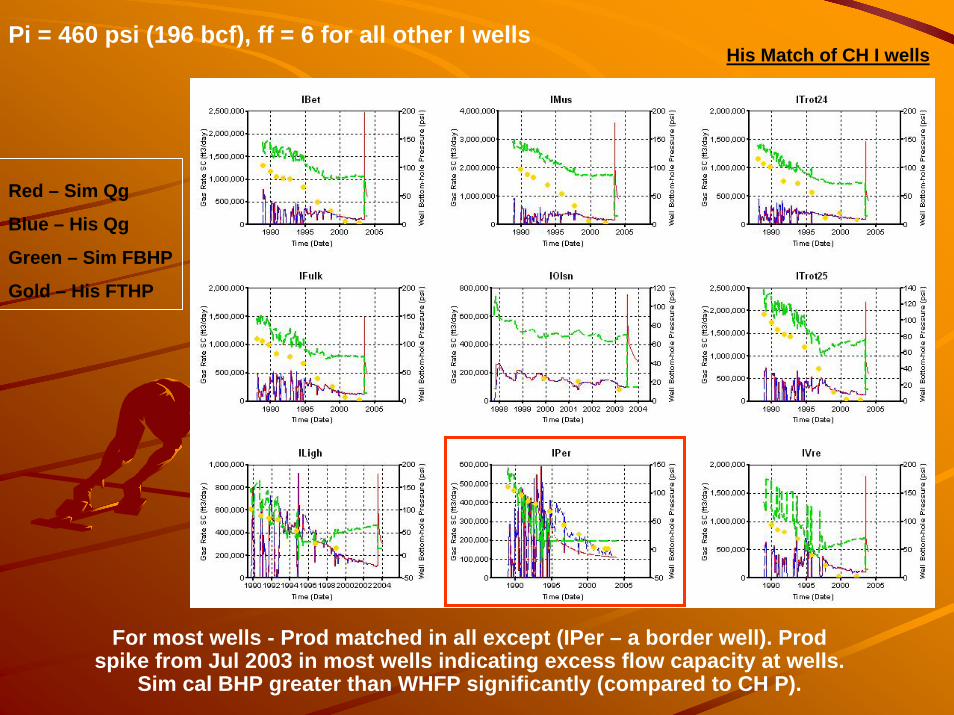
Pi = 460 psi (196 bcf), ff = 6 for all other I wellsHis Match of CH I wells
Red – Sim Qg
Blue – His Qg
Green – Sim FBHP
Gold – His FTHP
For most wells - Prod matched in all except (IPer – a border well). Prod spike from Jul 2003 in most wells indicating excess flow capacity at wells.
Sim cal BHP greater than WHFP significantly (compared to CH P).

Pi = 460 psi (196 bcf), ff = 6 for all other CG wells His Match of CG wells
Red – Sim Qg
Blue – His Qg
Prod could not be matched for any well
Increased layer K and Sw multiple times – unable to obtain production match
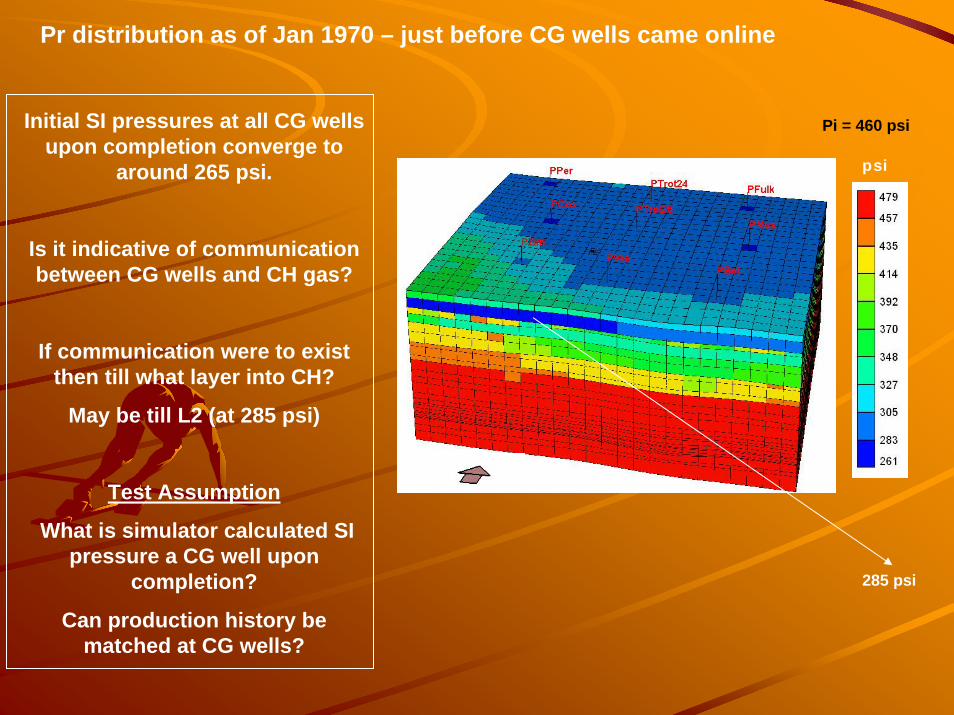
Pr distribution as of Jan 1970 – just before CG wells came online
Initial SI pressures at all CG wells upon completion converge to
around 265 psi.
Is it indicative of communication between CG wells and CH gas?
If communication were to exist then till what layer into CH?
May be till L2 (at 285 psi)
Test Assumption
What is simulator calculated SI pressure a CG well upon
completion?
Can production history be matched at CG wells?
Pi = 460 psi
psi
285 psi
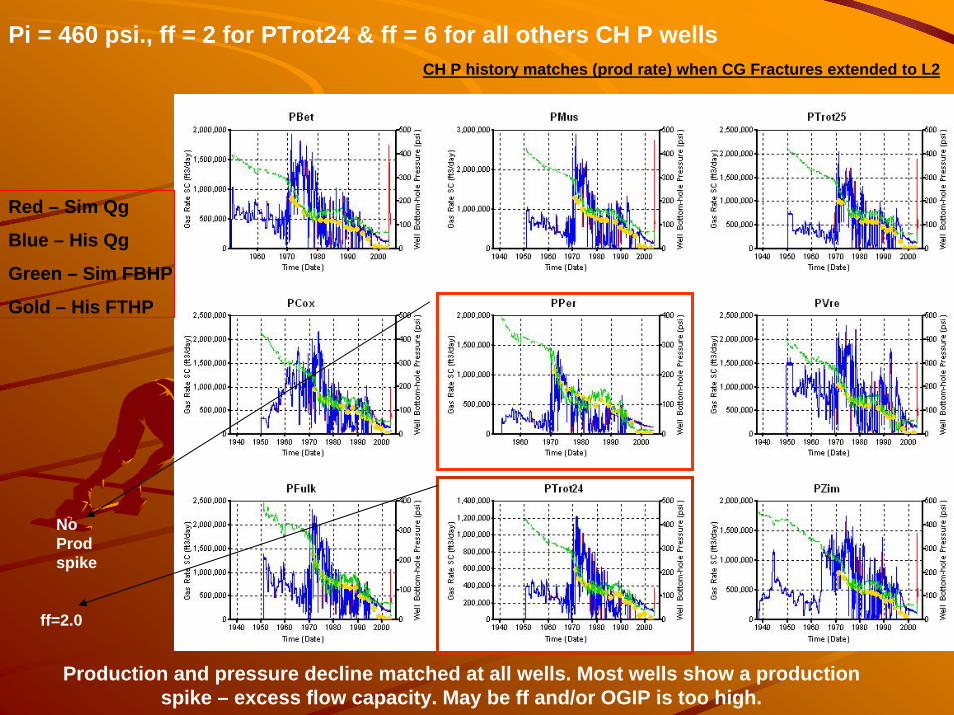
Pi = 460 psi., ff = 2 for PTrot24 & ff = 6 for all others CH P wellsCH P history matches (prod rate) when CG Fractures extended to L2
Red – Sim Qg
Blue – His Qg
Green – Sim FBHP
Gold – His FTHP
No Prod spike
ff=2.0
Production and pressure decline matched at all wells. Most wells show a production spike – excess flow capacity. May be ff and/or OGIP is too high.
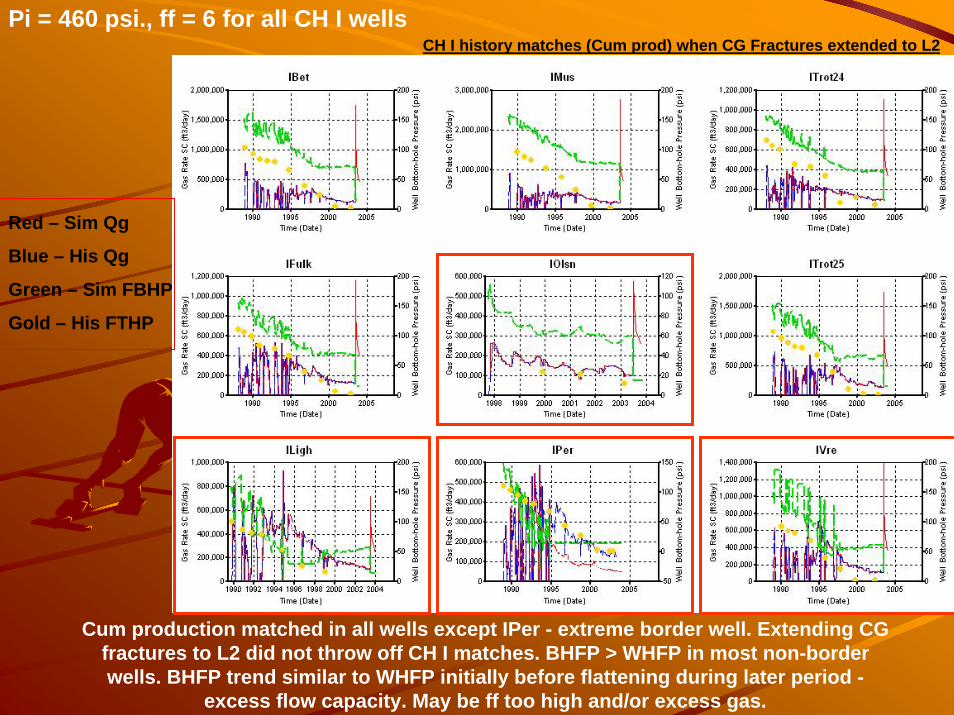
Cum production matched in all wells except IPer - extreme border well. Extending CG fractures to L2 did not throw off CH I matches. BHFP > WHFP in most non-border wells. BHFP trend similar to WHFP initially before flattening during later period -
excess flow capacity. May be ff too high and/or excess gas.
Pi = 460 psi., ff = 6 for all CH I wellsCH I history matches (Cum prod) when CG Fractures extended to L2
Red – Sim Qg
Blue – His Qg
Green – Sim FBHP
Gold – His FTHP
Replacementwell
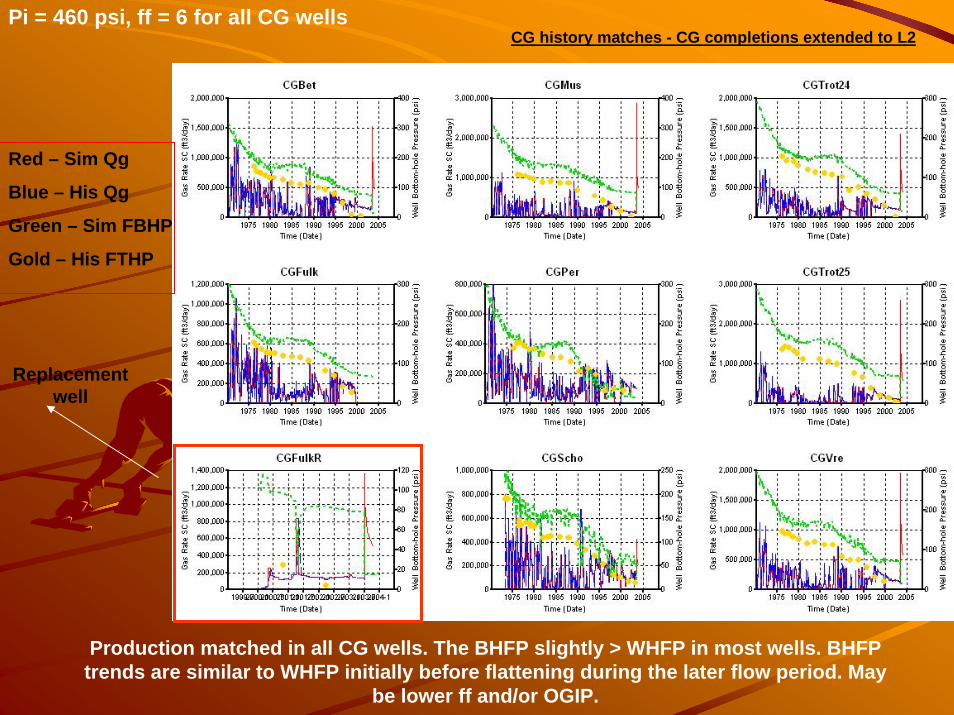
Pi = 460 psi, ff = 6 for all CG wellsCG history matches - CG completions extended to L2
Red – Sim Qg
Blue – His Qg
Green – Sim FBHP
Gold – His FTHP
Production matched in all CG wells. The BHFP slightly > WHFP in most wells. BHFP trends are similar to WHFP initially before flattening during the later flow period. May
be lower ff and/or OGIP.
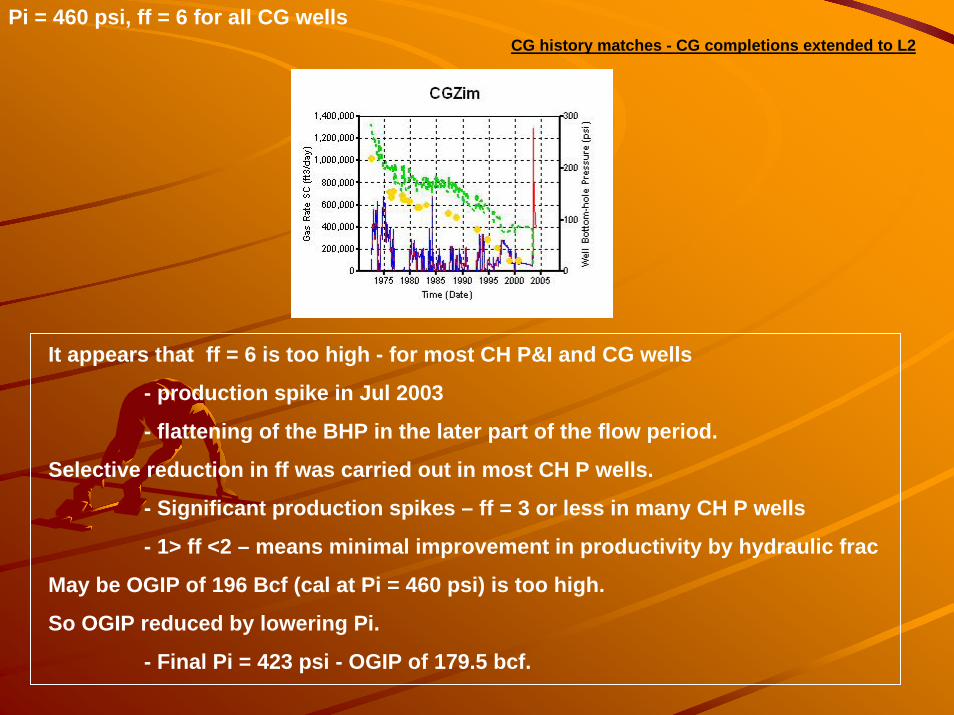
Pi = 460 psi, ff = 6 for all CG wellsCG history matches - CG completions extended to L2
It appears that ff = 6 is too high - for most CH P&I and CG wells
- production spike in Jul 2003
- flattening of the BHP in the later part of the flow period.
Selective reduction in ff was carried out in most CH P wells.
- Significant production spikes – ff = 3 or less in many CH P wells
- 1> ff <2 – means minimal improvement in productivity by hydraulic frac
May be OGIP of 196 Bcf (cal at Pi = 460 psi) is too high.
So OGIP reduced by lowering Pi.
- Final Pi = 423 psi - OGIP of 179.5 bcf.

Rate production history matched at all CH P wells and prod spike problem significantly reduced. BHFPs and WHFPs are close and lie on same
decline trends.
Pi = 423 psi, OGIP = 179.5 bcf
Ff for CH P wells adjusted around 6 (between 5 and 9)CH P history match - CG completions extend to L2
Red – Sim Qg
Blue – His Qg
Green – Sim FBHP
Gold – His FTHP

Border well
CG history match - CG completions extend to L2
Pi = 423 psi, OGIP = 179.5 bcf.
Ff for CG wells adjusted around 6 (between 3 and 8)
Red – Sim Qg
Blue – His Qg
Green – Sim FBHP
Gold – His FTHP
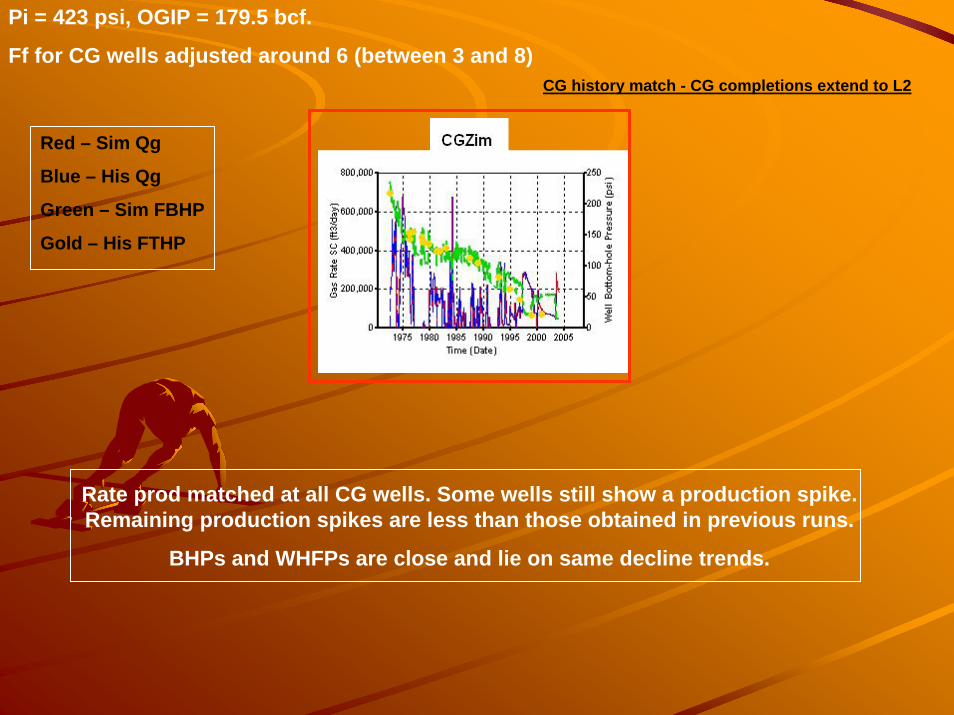
Rate prod matched at all CG wells. Some wells still show a production spike. Remaining production spikes are less than those obtained in previous runs.
BHPs and WHFPs are close and lie on same decline trends.
Pi = 423 psi, OGIP = 179.5 bcf.
Ff for CG wells adjusted around 6 (between 3 and 8)CG history match - CG completions extend to L2
Red – Sim Qg
Blue – His Qg
Green – Sim FBHP
Gold – His FTHP

Pi = 423 psi, OGIP = 179.5 bcf.
Ff for CH I wells adjusted around 6 (between 5 and 9)CH I history matches - CG completions extend to L2
Red – Sim Qg
Blue – His Qg
Green – Sim FBHP
Gold – His FTHP
Production matched in non-border CH I wells. Drainage area of BORDER wells extends outside the simulation area. Also, no significant production spikes in non border wells.
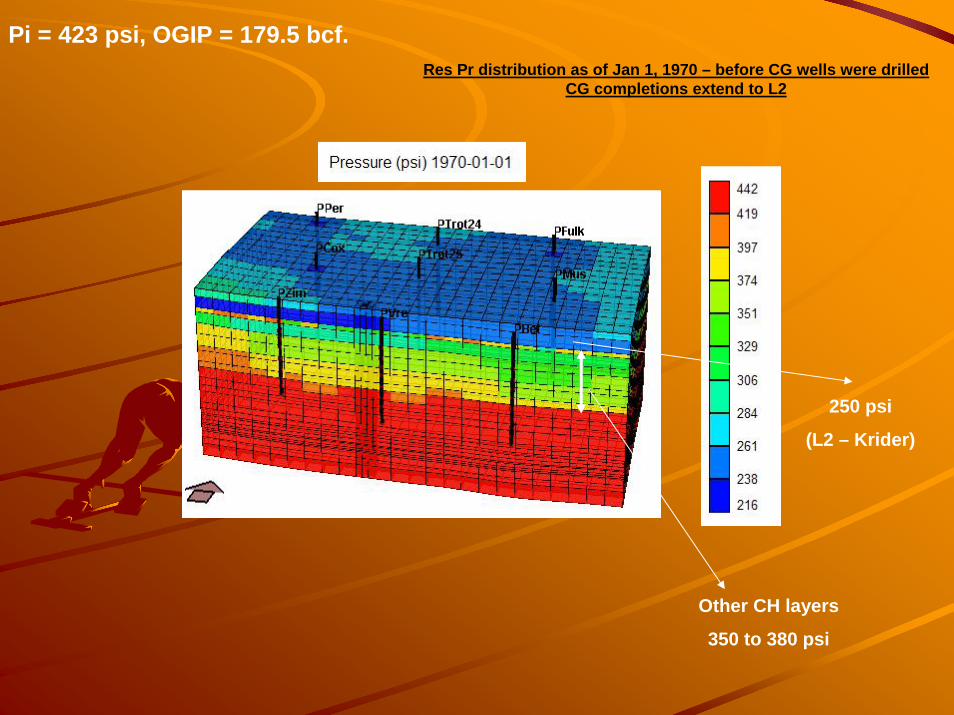
Pi = 423 psi, OGIP = 179.5 bcf.Res Pr distribution as of Jan 1, 1970 – before CG wells were drilled
CG completions extend to L2
250 psi
(L2 – Krider)
Other CH layers
350 to 380 psi

Pi = 423 psi, OGIP = 179.5 bcf
Test well – “SI Well”
- Completed on Jan 1, 1970.
- Refined grids locally
- Completed from L2 to L23.
- SI Well flowed for 1 day.
- SI BHP = 238 psi (ff = 1.0)
- SI BHP = 236 psi (ff = 6.0)
This is close to what has been typically recorded at CG wells upon completion in the study area.
SI pr at a hypothetical CG well –Jan 1970

Pi = 423 psi, OGIP = 179.5 bcfCG completions extend to L2
Pr distribution Jan 5, 1995 – Science well test date
psi

Pi = 423 psi, OGIP = 179.5 bcf
12 4
6
1011
1315
17
19
21238
9
050
100150200250300350400450
0 5 10 15 20 25 30
DST Pressure CG Compl L2
Compare Layer DST data at SCIENCE Well on Jan 5, 1995
Layer 9 – L/FTRLY Layer 21 – B4LMLayer 17 – B2LM
Despite matching CG production histories, B2LM and B4LM have not drained to the extent that the layer DST data indicate.
Is gas being drained from these layers by non-CG wells because prod from CG wells have already been matched in most cases?
Is there hydraulic communication that connect CH wells to CG layers?
Layer DST CG Compl L2Hrngtn-Paddock 1 120.3 81Krider 2 87.9 53Odell 3Wnf SSWnf LS 4 113.4 116Gage 5Towanda 6 187.0 201B/TWND 7FTRLY 8 229.9 224.4L/FTRLY 9 400.0 249B/FTRLY 10 398.4 356WREFORD 11 372.4 350A1_SH 12A1_LM 13 400.0 420B1_SH 14B1_LM 15 350.0 389B2_SH 16B2_LM 17 130.6 217B3_SH 18B3_LM 19 368.0 339B4_SH 20B4_LM 21 215.0 286B5_SH 22B5_LM 23 159.5 194C_SH 24C_LM 25
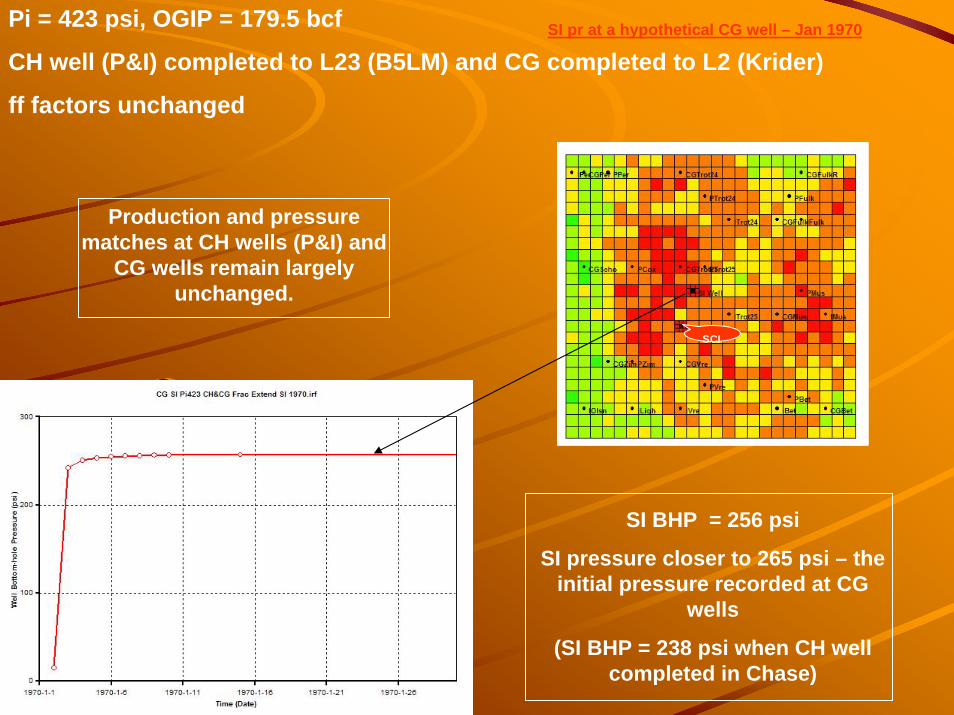
SI pr at a hypothetical CG well – Jan 1970Pi = 423 psi, OGIP = 179.5 bcf
CH well (P&I) completed to L23 (B5LM) and CG completed to L2 (Krider)
ff factors unchanged
Production and pressure matches at CH wells (P&I) and
CG wells remain largely unchanged.
SI Pr = 256 psi
SI BHP = 256 psi
SI pressure closer to 265 psi – the initial pressure recorded at CG
wells
(SI BHP = 238 psi when CH well completed in Chase)
SCI

12 4
6
1011
1315
17
19
21238
9
050
100150200250300350400450
0 5 10 15 20 25 30
DST Pressure CH Compl ExtLayer 9 is L/FrtRly – simulator calculates a lower pressure at this zone
Pi = 423 psi, OGIP = 179.5 bcf.
CH well (P&I) completed to L23 while CG completed to L2
ff factors unchanged Compare Layer DST data at Science Well on Jan 5, 1995Run 6 Run 7
Layer DST CG Compl L2 CH Compl ExtHrngtn-Paddock 1 120.3 81 93.6Krider 2 87.9 53 64Odell 3Wnf SSWnf LS 4 113.4 116 126.9Gage 5Towanda 6 187.0 201 212.1B/TWND 7FTRLY 8 229.9 224.4 232.2L/FTRLY 9 400.0 249 255.2B/FTRLY 10 398.4 356 347.7WREFORD 11 372.4 350 320.3A1_SH 12A1_LM 13 400.0 420 419.7B1_SH 14B1_LM 15 350.0 389 371B2_SH 16B2_LM 17 130.6 217 149B3_SH 18B3_LM 19 368.0 339 308.4B4_SH 20B4_LM 21 215.0 286 250.3B5_SH 22B5_LM 23 159.5 194 131C_SH 24C_LM 25
12
4
6
1011
1315
17
19
21238
9
050
100150200250300350400450
0 5 10 15 20 25 30
DST Pressure CG Compl L2
Extending CH completions into CG appear to a) improve layer pressure matches at the Science well, b) better simulate initial SI pressures at CG wells upon completion, and c) enables
production and pressure history matching at CH (P&I) and CG wells.
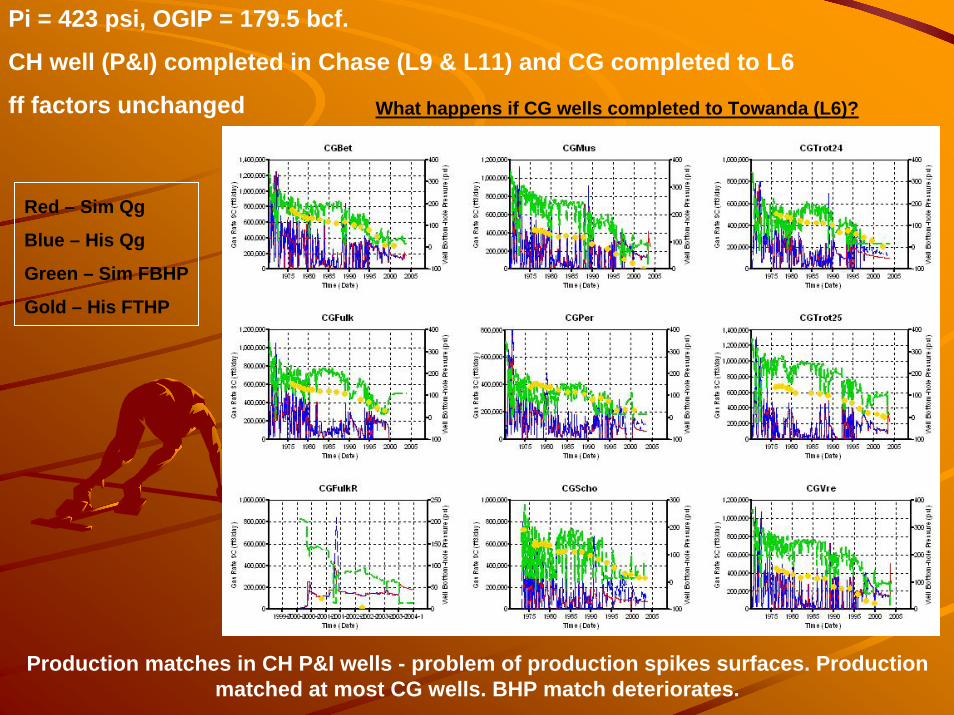
Pi = 423 psi, OGIP = 179.5 bcf.
CH well (P&I) completed in Chase (L9 & L11) and CG completed to L6
ff factors unchanged What happens if CG wells completed to Towanda (L6)?
Red – Sim Qg
Blue – His Qg
Green – Sim FBHP
Gold – His FTHP
Production matches in CH P&I wells - problem of production spikes surfaces. Production matched at most CG wells. BHP match deteriorates.
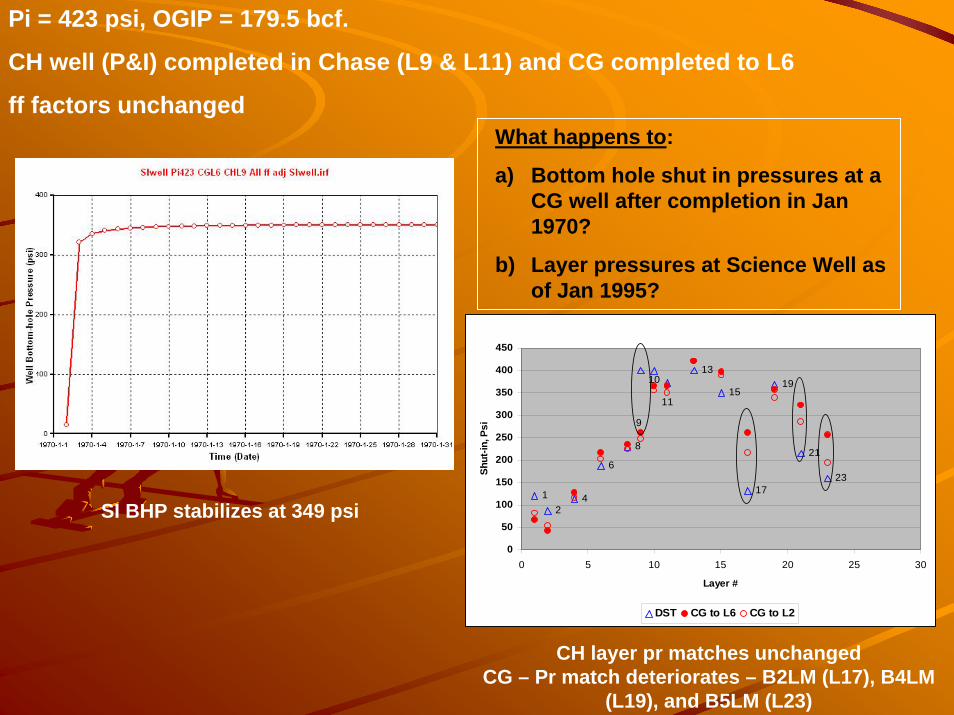
SI BHP stabilizes at 349 psi1
24
6
8
13
15
17
19
21
23
11
10
9
0
50
100
150
200
250
300
350
400
450
0 5 10 15 20 25 30
Layer #
Shut
-in, P
si
DST CG to L6 CG to L2
Pi = 423 psi, OGIP = 179.5 bcf.
CH well (P&I) completed in Chase (L9 & L11) and CG completed to L6
ff factors unchangedWhat happens to:
a) Bottom hole shut in pressures at a CG well after completion in Jan 1970?
b) Layer pressures at Science Well as of Jan 1995?
CH layer pr matches unchangedCG – Pr match deteriorates – B2LM (L17), B4LM
(L19), and B5LM (L23)
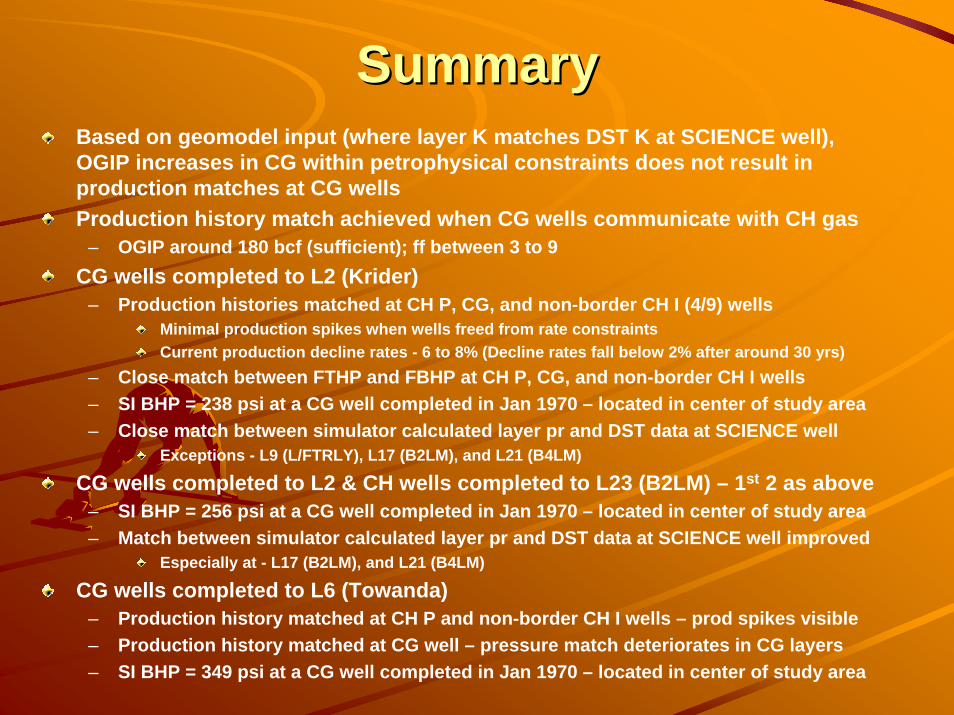
SummarySummaryBased on geomodel input (where layer K matches DST K at SCIENCE well), OGIP increases in CG within petrophysical constraints does not result in production matches at CG wells Production history match achieved when CG wells communicate with CH gas
– OGIP around 180 bcf (sufficient); ff between 3 to 9CG wells completed to L2 (Krider)
– Production histories matched at CH P, CG, and non-border CH I (4/9) wellsMinimal production spikes when wells freed from rate constraintsCurrent production decline rates - 6 to 8% (Decline rates fall below 2% after around 30 yrs)
– Close match between FTHP and FBHP at CH P, CG, and non-border CH I wells– SI BHP = 238 psi at a CG well completed in Jan 1970 – located in center of study area– Close match between simulator calculated layer pr and DST data at SCIENCE well
Exceptions - L9 (L/FTRLY), L17 (B2LM), and L21 (B4LM)
CG wells completed to L2 & CH wells completed to L23 (B2LM) – 1st 2 as above– SI BHP = 256 psi at a CG well completed in Jan 1970 – located in center of study area– Match between simulator calculated layer pr and DST data at SCIENCE well improved
Especially at - L17 (B2LM), and L21 (B4LM)
CG wells completed to L6 (Towanda)– Production history matched at CH P and non-border CH I wells – prod spikes visible– Production history matched at CG well – pressure match deteriorates in CG layers– SI BHP = 349 psi at a CG well completed in Jan 1970 – located in center of study area
AcknowledgementsAcknowledgementsWe thank our industry partners for their
support of the Hugoton Asset Management Project and their permission to share the
results of the study.
Anadarko Petroleum CorporationBP America Production Company
Cimarex Energy Co.ConocoPhillips Company
E.O.G. Resources Inc.Medicine Bow Energy Corporation
Osborn Heirs CompanyOXY USA, Inc.
Pioneer Natural Resources USA, Inc.