reservoir characterization applying seismic inversion
TRANSCRIPT
Citation: Othman AAA, Ewida HF, Fathi MM Ali and Embaby MMAA. Reservoir Characterization Applying Seismic Inversion Technique and Seismic Attributes for Komombo Basin. Austin J Earth Sci. 2017; 3(1): 1020.
Austin J Earth Sci - Volume 3 Issue 1 - 2017ISSN : 2380-0771 | www.austinpublishinggroup.com Othman AAA et al. © All rights are reserved
Austin Journal of Earth ScienceOpen Access
Abstract
Petroleum exploration is very difficult in Komombo basin due to the lack of information (Few wells and not cover the area). The present study aims to evaluate the Cretaceous reservoir represented by Abu Ballas (Aptian) and Six Hills (E. Cretaceous) Formations through the integration of available seismic and well data. The regional structural features are NW-SE based on depth structural contour maps constructed and the basin located at SE direction. Based on well data the stratigraphic section from basement to tertiary was intersected and penetrated. Stacked Seismic data alone cannot be used to predict reservoir properties. Therefore, Seismic inversion and attribute techniques were utilized to predict reservoir quality. Seismic inversion utilizes the seismic data, well logs, seismic velocity and interpreted horizons to generate impedance data. Distribute the acoustic impedance for reservoir rock (Abu Ballas and Six Hills Formations) through an applied seismic inversion technique, and through that detect the lithology for reservoir from the values of acoustic impedance. By integration seismic interpretation and seismic inversion, there are two leads with high quantities of oil (26 and 8.5 MMSTB in Six Hills E and Abu Ballas respectively). Seismic attributes were applied to detect structural and distribution of sandstone, shale and the distribution of relative acoustic impedance parameters in the area.
Keywords: Komombo basin; Seismic inversion; Seismic attributes
Introduction Komombo Basin Area covers an area of 186 km2 in the southern
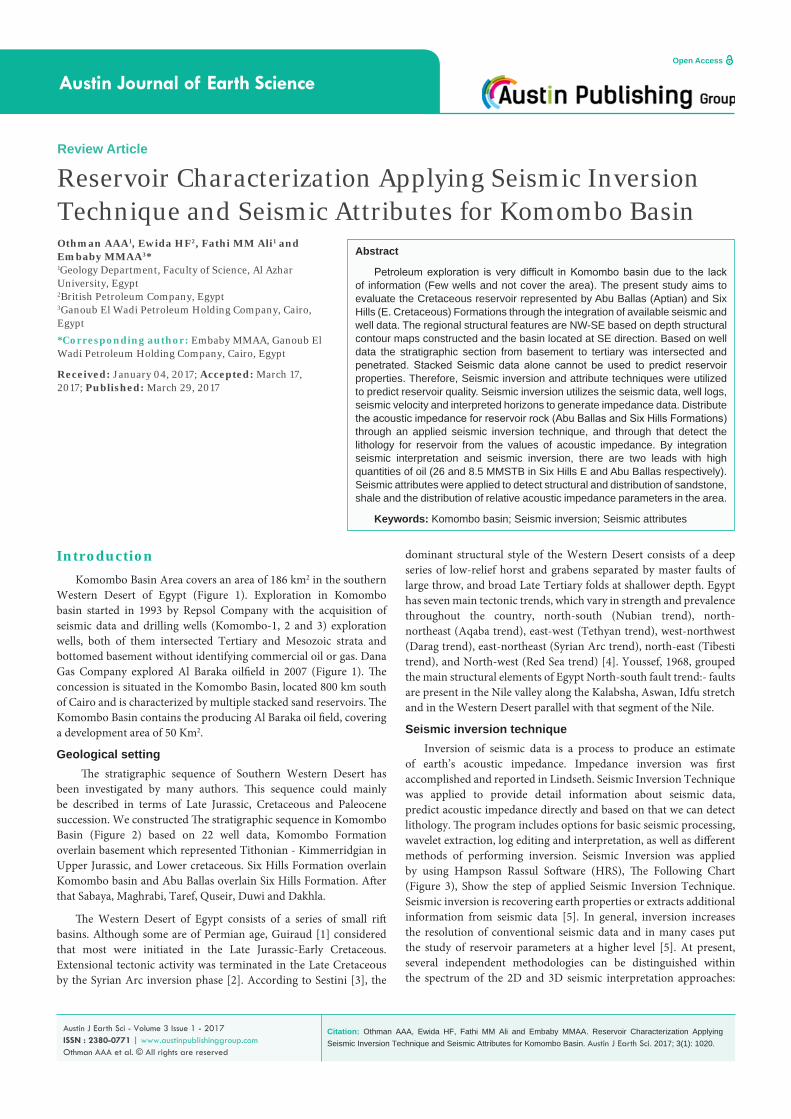
Western Desert of Egypt (Figure 1). Exploration in Komombo basin started in 1993 by Repsol Company with the acquisition of seismic data and drilling wells (Komombo-1, 2 and 3) exploration wells, both of them intersected Tertiary and Mesozoic strata and bottomed basement without identifying commercial oil or gas. Dana Gas Company explored Al Baraka oilfield in 2007 (Figure 1). The concession is situated in the Komombo Basin, located 800 km south of Cairo and is characterized by multiple stacked sand reservoirs. The Komombo Basin contains the producing Al Baraka oil field, covering a development area of 50 Km2.
Geological setting The stratigraphic sequence of Southern Western Desert has
been investigated by many authors. This sequence could mainly be described in terms of Late Jurassic, Cretaceous and Paleocene succession. We constructed The stratigraphic sequence in Komombo Basin (Figure 2) based on 22 well data, Komombo Formation overlain basement which represented Tithonian - Kimmerridgian in Upper Jurassic, and Lower cretaceous. Six Hills Formation overlain Komombo basin and Abu Ballas overlain Six Hills Formation. After that Sabaya, Maghrabi, Taref, Quseir, Duwi and Dakhla.
The Western Desert of Egypt consists of a series of small rift basins. Although some are of Permian age, Guiraud [1] considered that most were initiated in the Late Jurassic-Early Cretaceous. Extensional tectonic activity was terminated in the Late Cretaceous by the Syrian Arc inversion phase [2]. According to Sestini [3], the
Review Article
Reservoir Characterization Applying Seismic Inversion Technique and Seismic Attributes for Komombo BasinOthman AAA1, Ewida HF2, Fathi MM Ali1 and Embaby MMAA3*1Geology Department, Faculty of Science, Al Azhar University, Egypt2British Petroleum Company, Egypt3Ganoub El Wadi Petroleum Holding Company, Cairo, Egypt
*Corresponding author: Embaby MMAA, Ganoub El Wadi Petroleum Holding Company, Cairo, Egypt
Received: January 04, 2017; Accepted: March 17, 2017; Published: March 29, 2017
dominant structural style of the Western Desert consists of a deep series of low-relief horst and grabens separated by master faults of large throw, and broad Late Tertiary folds at shallower depth. Egypt has seven main tectonic trends, which vary in strength and prevalence throughout the country, north-south (Nubian trend), north-northeast (Aqaba trend), east-west (Tethyan trend), west-northwest (Darag trend), east-northeast (Syrian Arc trend), north-east (Tibesti trend), and North-west (Red Sea trend) [4]. Youssef, 1968, grouped the main structural elements of Egypt North-south fault trend:- faults are present in the Nile valley along the Kalabsha, Aswan, Idfu stretch and in the Western Desert parallel with that segment of the Nile.
Seismic inversion technique Inversion of seismic data is a process to produce an estimate
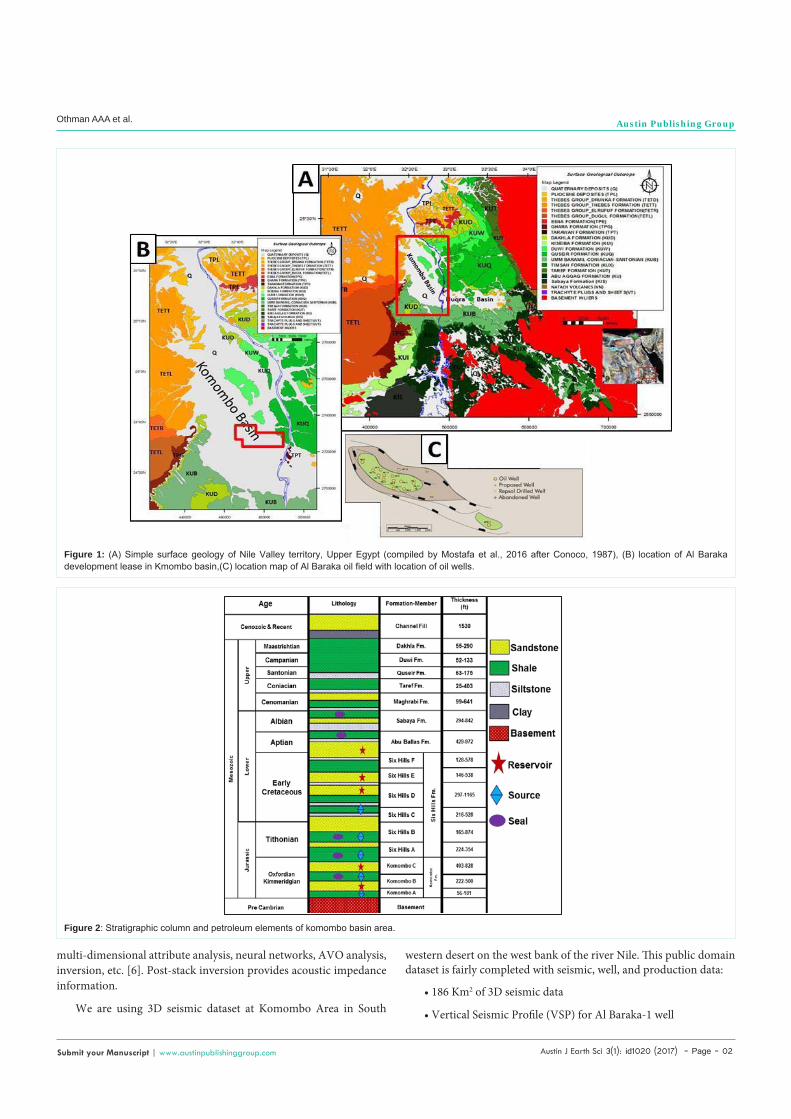
of earth’s acoustic impedance. Impedance inversion was first accomplished and reported in Lindseth. Seismic Inversion Technique was applied to provide detail information about seismic data, predict acoustic impedance directly and based on that we can detect lithology. The program includes options for basic seismic processing, wavelet extraction, log editing and interpretation, as well as different methods of performing inversion. Seismic Inversion was applied by using Hampson Rassul Software (HRS), The Following Chart (Figure 3), Show the step of applied Seismic Inversion Technique. Seismic inversion is recovering earth properties or extracts additional information from seismic data [5]. In general, inversion increases the resolution of conventional seismic data and in many cases put the study of reservoir parameters at a higher level [5]. At present, several independent methodologies can be distinguished within the spectrum of the 2D and 3D seismic interpretation approaches:
Austin J Earth Sci 3(1): id1020 (2017) - Page - 02
Othman AAA et al. Austin Publishing Group
Submit your Manuscript | www.austinpublishinggroup.com
multi-dimensional attribute analysis, neural networks, AVO analysis, inversion, etc. [6]. Post-stack inversion provides acoustic impedance information.
We are using 3D seismic dataset at Komombo Area in South
western desert on the west bank of the river Nile. This public domain dataset is fairly completed with seismic, well, and production data:
• 186 Km2 of 3D seismic data
• Vertical Seismic Profile (VSP) for Al Baraka-1 well
Figure 1: (A) Simple surface geology of Nile Valley territory, Upper Egypt (compiled by Mostafa et al., 2016 after Conoco, 1987), (B) location of Al Baraka development lease in Kmombo basin,(C) location map of Al Baraka oil field with location of oil wells.
Figure 2: Stratigraphic column and petroleum elements of komombo basin area.
Austin J Earth Sci 3(1): id1020 (2017) - Page - 03
Othman AAA et al. Austin Publishing Group
Submit your Manuscript | www.austinpublishinggroup.com
• Formation tops for wells, after that we make synthetic seismogram (Figure 4) and run the initial model (Figures 5 & 6), based on applied inversion we distribute the acoustic impedance
Acoustic Impedance (AI) Distribution for abu ballas formation
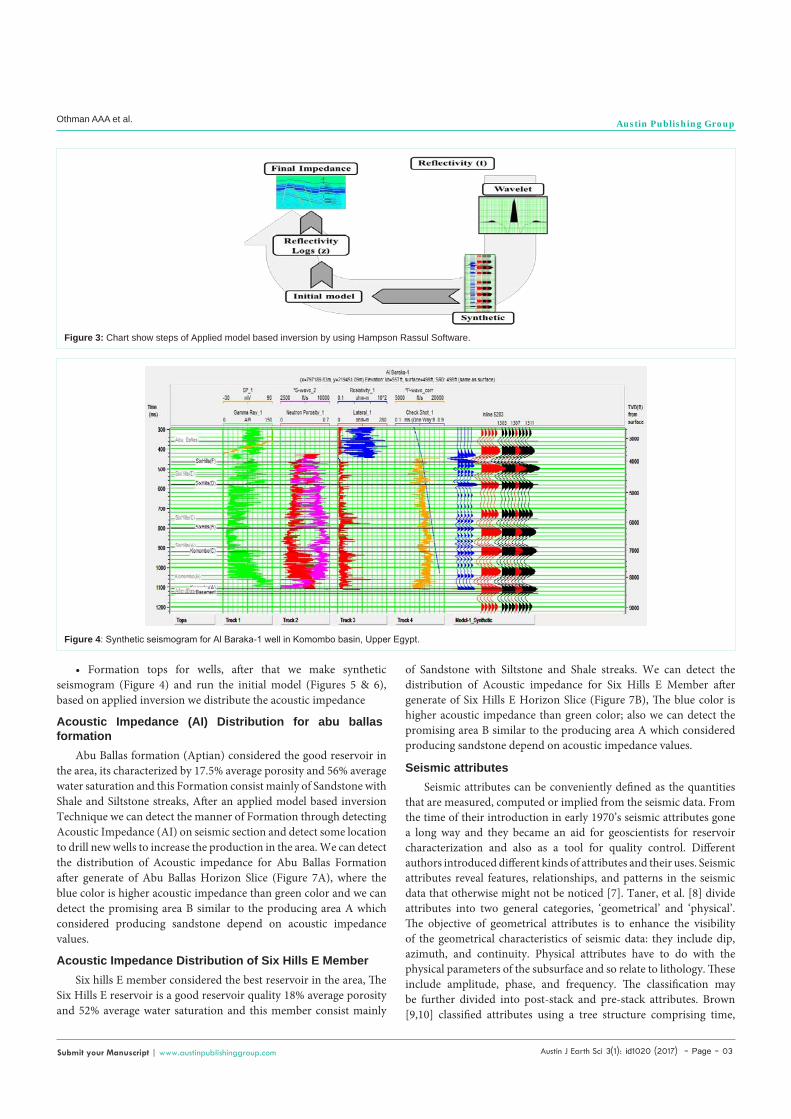
Abu Ballas formation (Aptian) considered the good reservoir in the area, its characterized by 17.5% average porosity and 56% average water saturation and this Formation consist mainly of Sandstone with Shale and Siltstone streaks, After an applied model based inversion Technique we can detect the manner of Formation through detecting Acoustic Impedance (AI) on seismic section and detect some location to drill new wells to increase the production in the area. We can detect the distribution of Acoustic impedance for Abu Ballas Formation after generate of Abu Ballas Horizon Slice (Figure 7A), where the blue color is higher acoustic impedance than green color and we can detect the promising area B similar to the producing area A which considered producing sandstone depend on acoustic impedance values.
Acoustic Impedance Distribution of Six Hills E Member Six hills E member considered the best reservoir in the area, The
Six Hills E reservoir is a good reservoir quality 18% average porosity and 52% average water saturation and this member consist mainly
of Sandstone with Siltstone and Shale streaks. We can detect the distribution of Acoustic impedance for Six Hills E Member after generate of Six Hills E Horizon Slice (Figure 7B), The blue color is higher acoustic impedance than green color; also we can detect the promising area B similar to the producing area A which considered producing sandstone depend on acoustic impedance values.
Seismic attributes Seismic attributes can be conveniently defined as the quantities
that are measured, computed or implied from the seismic data. From the time of their introduction in early 1970’s seismic attributes gone a long way and they became an aid for geoscientists for reservoir characterization and also as a tool for quality control. Different authors introduced different kinds of attributes and their uses. Seismic attributes reveal features, relationships, and patterns in the seismic data that otherwise might not be noticed [7]. Taner, et al. [8] divide attributes into two general categories, ‘geometrical’ and ‘physical’. The objective of geometrical attributes is to enhance the visibility of the geometrical characteristics of seismic data: they include dip, azimuth, and continuity. Physical attributes have to do with the physical parameters of the subsurface and so relate to lithology. These include amplitude, phase, and frequency. The classification may be further divided into post-stack and pre-stack attributes. Brown [9,10] classified attributes using a tree structure comprising time,
Figure 3: Chart show steps of Applied model based inversion by using Hampson Rassul Software.
Figure 4: Synthetic seismogram for Al Baraka-1 well in Komombo basin, Upper Egypt.
Austin J Earth Sci 3(1): id1020 (2017) - Page - 04
Othman AAA et al. Austin Publishing Group
Submit your Manuscript | www.austinpublishinggroup.com
amplitude, frequency and attenuation as the main branches, which further branch out into post-stack and pre-stack categories. Barnes [11] developed a classification of complex trace attributes depending on the relationship amongst different attributes and seismic data. We applied number of attributes in this study to detect the structural trend, sand shale ratio and acoustic impedance distribution.
Coherence attributes: It is a geometric attribute that highlights lateral change in seismic character and measures the similarity of
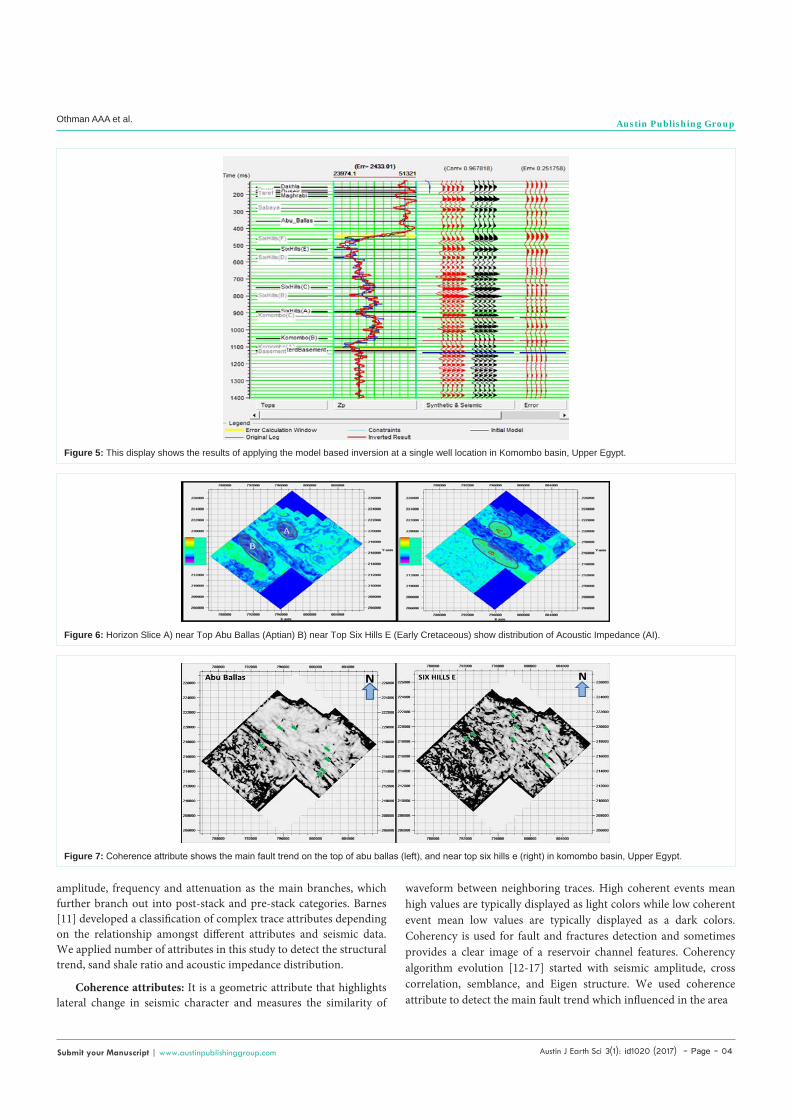
Figure 5: This display shows the results of applying the model based inversion at a single well location in Komombo basin, Upper Egypt.
Figure 6: Horizon Slice A) near Top Abu Ballas (Aptian) B) near Top Six Hills E (Early Cretaceous) show distribution of Acoustic Impedance (AI).
Figure 7: Coherence attribute shows the main fault trend on the top of abu ballas (left), and near top six hills e (right) in komombo basin, Upper Egypt.
waveform between neighboring traces. High coherent events mean high values are typically displayed as light colors while low coherent event mean low values are typically displayed as a dark colors. Coherency is used for fault and fractures detection and sometimes provides a clear image of a reservoir channel features. Coherency algorithm evolution [12-17] started with seismic amplitude, cross correlation, semblance, and Eigen structure. We used coherence attribute to detect the main fault trend which influenced in the area
Austin J Earth Sci 3(1): id1020 (2017) - Page - 05
Othman AAA et al. Austin Publishing Group
Submit your Manuscript | www.austinpublishinggroup.com
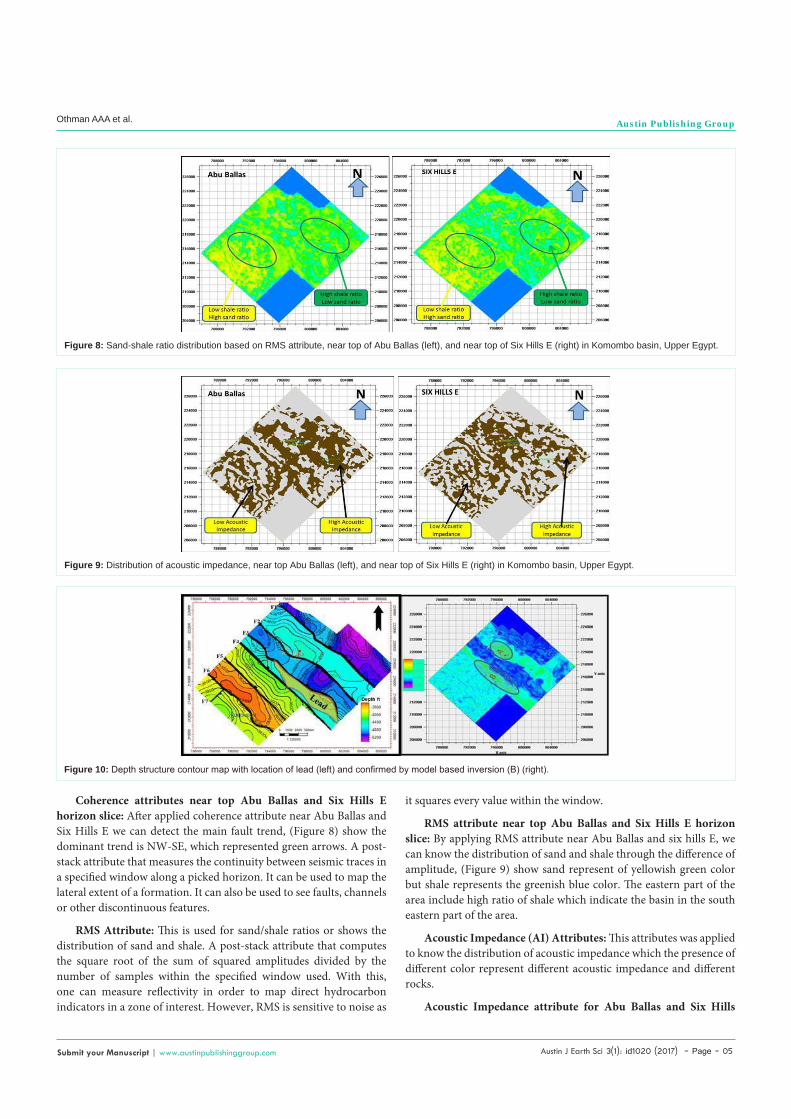
Coherence attributes near top Abu Ballas and Six Hills E horizon slice: After applied coherence attribute near Abu Ballas and Six Hills E we can detect the main fault trend, (Figure 8) show the dominant trend is NW-SE, which represented green arrows. A post-stack attribute that measures the continuity between seismic traces in a specified window along a picked horizon. It can be used to map the lateral extent of a formation. It can also be used to see faults, channels or other discontinuous features.
RMS Attribute: This is used for sand/shale ratios or shows the distribution of sand and shale. A post-stack attribute that computes the square root of the sum of squared amplitudes divided by the number of samples within the specified window used. With this, one can measure reflectivity in order to map direct hydrocarbon indicators in a zone of interest. However, RMS is sensitive to noise as
Figure 8: Sand-shale ratio distribution based on RMS attribute, near top of Abu Ballas (left), and near top of Six Hills E (right) in Komombo basin, Upper Egypt.
Figure 9: Distribution of acoustic impedance, near top Abu Ballas (left), and near top of Six Hills E (right) in Komombo basin, Upper Egypt.
it squares every value within the window.
RMS attribute near top Abu Ballas and Six Hills E horizon slice: By applying RMS attribute near Abu Ballas and six hills E, we can know the distribution of sand and shale through the difference of amplitude, (Figure 9) show sand represent of yellowish green color but shale represents the greenish blue color. The eastern part of the area include high ratio of shale which indicate the basin in the south eastern part of the area.
Acoustic Impedance (AI) Attributes: This attributes was applied to know the distribution of acoustic impedance which the presence of different color represent different acoustic impedance and different rocks.
Acoustic Impedance attribute for Abu Ballas and Six Hills
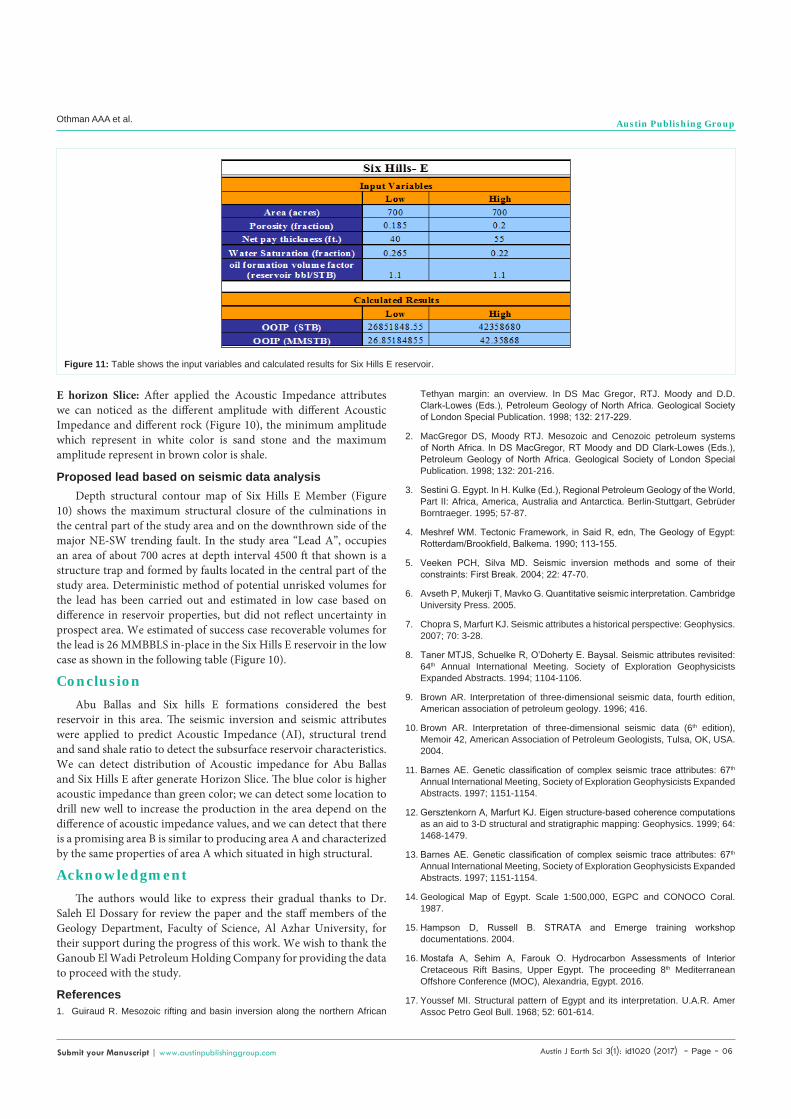
Figure 10: Depth structure contour map with location of lead (left) and confirmed by model based inversion (B) (right).
Austin J Earth Sci 3(1): id1020 (2017) - Page - 06
Othman AAA et al. Austin Publishing Group
Submit your Manuscript | www.austinpublishinggroup.com
E horizon Slice: After applied the Acoustic Impedance attributes we can noticed as the different amplitude with different Acoustic Impedance and different rock (Figure 10), the minimum amplitude which represent in white color is sand stone and the maximum amplitude represent in brown color is shale.
Proposed lead based on seismic data analysis Depth structural contour map of Six Hills E Member (Figure
10) shows the maximum structural closure of the culminations in the central part of the study area and on the downthrown side of the major NE-SW trending fault. In the study area “Lead A”, occupies an area of about 700 acres at depth interval 4500 ft that shown is a structure trap and formed by faults located in the central part of the study area. Deterministic method of potential unrisked volumes for the lead has been carried out and estimated in low case based on difference in reservoir properties, but did not reflect uncertainty in prospect area. We estimated of success case recoverable volumes for the lead is 26 MMBBLS in-place in the Six Hills E reservoir in the low case as shown in the following table (Figure 10).
Conclusion Abu Ballas and Six hills E formations considered the best
reservoir in this area. The seismic inversion and seismic attributes were applied to predict Acoustic Impedance (AI), structural trend and sand shale ratio to detect the subsurface reservoir characteristics. We can detect distribution of Acoustic impedance for Abu Ballas and Six Hills E after generate Horizon Slice. The blue color is higher acoustic impedance than green color; we can detect some location to drill new well to increase the production in the area depend on the difference of acoustic impedance values, and we can detect that there is a promising area B is similar to producing area A and characterized by the same properties of area A which situated in high structural.
Acknowledgment The authors would like to express their gradual thanks to Dr.
Saleh El Dossary for review the paper and the staff members of the Geology Department, Faculty of Science, Al Azhar University, for their support during the progress of this work. We wish to thank the Ganoub El Wadi Petroleum Holding Company for providing the data to proceed with the study.
References1. Guiraud R. Mesozoic rifting and basin inversion along the northern African
Figure 11: Table shows the input variables and calculated results for Six Hills E reservoir.
Tethyan margin: an overview. In DS Mac Gregor, RTJ. Moody and D.D. Clark-Lowes (Eds.), Petroleum Geology of North Africa. Geological Society of London Special Publication. 1998; 132: 217-229.
2. MacGregor DS, Moody RTJ. Mesozoic and Cenozoic petroleum systems of North Africa. In DS MacGregor, RT Moody and DD Clark-Lowes (Eds.), Petroleum Geology of North Africa. Geological Society of London Special Publication. 1998; 132: 201-216.
3. Sestini G. Egypt. In H. Kulke (Ed.), Regional Petroleum Geology of the World, Part II: Africa, America, Australia and Antarctica. Berlin-Stuttgart, Gebrüder Borntraeger. 1995; 57-87.
4. Meshref WM. Tectonic Framework, in Said R, edn, The Geology of Egypt: Rotterdam/Brookfield, Balkema. 1990; 113-155.
5. Veeken PCH, Silva MD. Seismic inversion methods and some of their constraints: First Break. 2004; 22: 47-70.
6. Avseth P, Mukerji T, Mavko G. Quantitative seismic interpretation. Cambridge University Press. 2005.
7. Chopra S, Marfurt KJ. Seismic attributes a historical perspective: Geophysics. 2007; 70: 3-28.
8. Taner MTJS, Schuelke R, O’Doherty E. Baysal. Seismic attributes revisited: 64th Annual International Meeting. Society of Exploration Geophysicists Expanded Abstracts. 1994; 1104-1106.
9. Brown AR. Interpretation of three-dimensional seismic data, fourth edition, American association of petroleum geology. 1996; 416.
10. Brown AR. Interpretation of three-dimensional seismic data (6th edition), Memoir 42, American Association of Petroleum Geologists, Tulsa, OK, USA. 2004.
11. Barnes AE. Genetic classification of complex seismic trace attributes: 67th Annual International Meeting, Society of Exploration Geophysicists Expanded Abstracts. 1997; 1151-1154.
12. Gersztenkorn A, Marfurt KJ. Eigen structure-based coherence computations as an aid to 3-D structural and stratigraphic mapping: Geophysics. 1999; 64: 1468-1479.
13. Barnes AE. Genetic classification of complex seismic trace attributes: 67th Annual International Meeting, Society of Exploration Geophysicists Expanded Abstracts. 1997; 1151-1154.
14. Geological Map of Egypt. Scale 1:500,000, EGPC and CONOCO Coral. 1987.
15. Hampson D, Russell B. STRATA and Emerge training workshop documentations. 2004.
16. Mostafa A, Sehim A, Farouk O. Hydrocarbon Assessments of Interior Cretaceous Rift Basins, Upper Egypt. The proceeding 8th Mediterranean Offshore Conference (MOC), Alexandria, Egypt. 2016.
17. Youssef MI. Structural pattern of Egypt and its interpretation. U.A.R. Amer Assoc Petro Geol Bull. 1968; 52: 601-614.