researching crowdsourcing to extend iot testbed ... · 4.4.1 a crowd-enabled scenario for efficient...
TRANSCRIPT
Researching crowdsourcing to extend IoT testbed infrastructure for
multidisciplinary experiments, with more end-user interactions,
flexibility, scalability, cost efficiency and societal added value
Grant agreement for: Collaborative project
Grant agreement no.: 610477
Start date of project: October 1st, 2013 (36 months duration)
Deliverable D7.4
Final Test Report
Contract Due Date 30/09/2016
Submission Date 01/11/2016
Version v1.0
Use of Resources This deliverable production is the result of Task 7.2 which has benefited from a collective effort of work from the partners of the consortium estimated to be about 7.91 PMs.
Responsible Partner Anna Ståhbröst (LTU)
Author List Anna Ståhlbröst (LTU), Josefin Lassinantti (LTU), Michael Nilsson (LTU), Anders Lundkvist (LTU), Theofanis Raptis (CTI), Panagiotis Alexandrou (CTI), Sotiris Nikoletseas (CTI), Christos-Spartakos Zachiotis (CTI), Sébastien Ziegler (MI), Cedric Crettaz (MI), Michael Hazan (MI), Aleksandra Rankov (DNET), Zolt Kemeny (DNET), Xenia Zioulvelou (SOTON). Frank McGroarty (SOTON)
Dissemination level PU
Keywords Internet of Things, Crowd sourcing, Lab, Use Case, test, results
Project Coordinator: Mandat International (MI)
Sébastien Ziegler <[email protected]>
D7.4 Final Test Report
Page 2 of 169
Abstract
This deliverable describes the different tests that have been performed during the third year
of the IoT Lab project in Task T7.2 Multidisciplinary tests and validation. This report continues
the work reported in D7.2 Intermediary integration and tests report. In this deliverable D7.4,
the results from two usability studies and five Use Case implementations and evaluations are
reported. The IoT Lab systems have been implemented on a university campus focusing on
energy savings, in a beer factory focusing on lightning, in a smart city context focusing on
environmental aspects and finally, in an open context focusing on accelerometer
measurements in order to test the logical flow in the system as well as the combination of the
different systems and their integration. Based on the results from these evaluations,
recommendations and guidelines for future tests are presented together with
recommendations for future approaches in order to elevate the results from the IoT Lab
project. The Letters of Intent from potential early adopters of IoT Lab systems are another
significant output of this Task and strengthen the possibilities for future success of the IoT Lab
system and Association. To guide the process of evaluations in different phases of the
project, we have based our approach on principles for evaluations stemming from design
science research since IoT Lab project is a design and development project that moves
between the different processes of building and evaluating. Based on these evaluations, a
suggestion for the future scope for IoT Lab is presented.
Acknowledgements
This deliverable is part of the IoT Lab European Research project which has received funding
from the European Union’s Seventh Framework Programme for research, technological
development and demonstration under Grant Agreement no 610477.
D7.4 Final Test Report
Page 3 of 169
Table of Contents
Abstract ................................................................................................................................2
Table of Contents .................................................................................................................3
Abbreviations and acronyms ..............................................................................................9
Executive Summary ........................................................................................................... 12
Introduction ................................................................................................................. 13 1
1.1 The IoT Lab project in brief ................................................................................. 13
1.2 Purpose and scope of the WP 7 ......................................................................... 14
1.3 Purpose and scope of the Task T7.2 ................................................................... 14
1.4 Purpose and scope of the current document ....................................................... 14
Tests and Evaluations in Design Research ............................................................... 16 2
2.1 Quick and Dirty tests and evaluations ................................................................. 19
2.2 Usability tests ..................................................................................................... 19
2.3 Heuristic Evaluation combined with “Think Aloud” ............................................... 20
2.4 Field Tests – Use Case implementations ............................................................ 21
Usability Test Process and Results ........................................................................... 22 3
3.1 General summary and reflections – Usability Study of TBaaS ............................ 22
3.2 General summary and reflections – Usability study of the app ............................ 23
Smart Energy Management and Comfort at University of Patras ............................ 26 4
4.1 University of Patras Case Description ................................................................. 27
4.1.1 Envisioned TBaaS Process and Requirements............................................27 4.1.2 Envisioned App Process and Requirements ................................................28
4.2 Test results ......................................................................................................... 29
4.2.1 Results from the TBaaS user process ........................................................29 4.3 Results from the App user process ..................................................................... 30
4.4 Lessons Learned and Future Recommendations ................................................ 31
4.4.1 A crowd-enabled scenario for efficient smart energy management ................31 4.4.2 Experimental set-up ..................................................................................31 4.4.3 Evaluation of results .................................................................................32 4.4.4 Future recommendations ..........................................................................35
Smart Energy Management and CO2 Monitoring in a Beer Factory ........................ 36 5
D7.4 Final Test Report
Page 4 of 169
5.1 Smart Energy Management and CO2 Monitoring in a Beer Factory Case
Description ....................................................................................................................... 36
5.2 Envisioned TBaaS process and Requirements ................................................... 37
Devices should be available in IoT Lab’s databases. ............................................... 37 1.
Devices should be functional. .................................................................................... 37 2.
Resources should not be publicly available (request from the company). ............. 37 3.
5.3 Test results ......................................................................................................... 37
5.3.1 Results from the TBaaS user process ........................................................38 5.4 Lessons Learned and Future Recommendations ................................................ 38
5.4.1 Identified challenges .................................................................................42 5.4.2 Opportunities ...........................................................................................42 5.4.3 Future recommendations ..........................................................................42
ekoNET Solutions for Air Pollution in Smart Cities Use Case .................................. 43 6
6.1 ekoNET Solutions for Air Pollution in Smart Cities Case Description ................... 43
6.2 Envisioned TBaaS Process and Requirements ................................................... 45
6.3 Envisioned process for the Participant and Requirements (APP) ........................ 48
6.4 Test results ......................................................................................................... 49
6.4.1 Data results from survey ...........................................................................49 6.4.2 Data results from experiment .....................................................................50 6.4.3 Merged data ............................................................................................50
6.5 Results from the TBaaS user process ................................................................. 52
6.6 Results from the App user process ..................................................................... 56
6.7 Identified challenges ........................................................................................... 56
Opportunities ................................................................................................................... 57
6.7.1 Future recommendations ..........................................................................57
Smart Hepia Case Description ................................................................................... 58 7
7.1.1 Envisioned TBaaS Process and Requirements............................................59 7.1.2 Envisioned App Process and Requirements ................................................59
7.2 Test results ......................................................................................................... 60
7.2.1 Results from the TBaaS user process ........................................................60 7.3 Results from the App user process ..................................................................... 61
7.3.1 Lessons learned and Future Recommendations ..........................................62 7.3.2 Future recommendations ..........................................................................62
Testing support for the social research application area – the Jumpology Use Case 8from LTU ............................................................................................................................. 64
8.1 Set-up of the Jumpology Pre-test – LTU ............................................................. 64
D7.4 Final Test Report
Page 5 of 169
8.1.1 Case setup description .............................................................................66 8.1.2 Lessons Learned and Future Recommendations .........................................68
8.2 Jumpology Field Test and Implementation .......................................................... 72
8.2.1 Test setup description ...............................................................................74 8.3 Envisioned TBaaS Process and Requirements ................................................... 74
8.3.1 Envisioned App Process and Requirements ................................................76 8.3.2 Test results ..............................................................................................77 8.3.3 Future recommendations ..........................................................................79
Early Adopters of IoT Lab ........................................................................................... 80 9
9.1 The Case of: “Fuel Poverty and Geriatric Mortality” ............................................ 80
9.1.1 Study Background ....................................................................................80 9.1.2 Study Aim and Objectives .........................................................................81 9.1.3 Location and participant recruitment ...........................................................81 9.1.4 Study Outcomes .......................................................................................82 9.1.5 Impact .....................................................................................................82 9.1.6 Study Timeframe ......................................................................................82
9.2 The Case of Organicity ....................................................................................... 83
9.3 The Case of SmartBuy........................................................................................ 84
Conclusions and Future Recommendations ............................................................. 85 10
10.1 Recommendations for Future Test Processes ..................................................... 89
10.2 A Possible Future Test Process Scenario ............................................................ 90
References and end-notes .......................................................................................... 92 11
Annex 1: IoT Lab TBaaS: Usability Evaluation ................................................................. 94
Annex 2: IoT Lab app: Usability Evaluation ................................................................... 110
Annex 3: IoT Lab Video Use Case–A usability and feasibility test ................................ 139
Annex 4: Discussion material: Crowd driven city growth ............................................. 147
Annex 5: Case specific requirements and test results from the Jumpology pre-test . 152
Annex 6: Letter of Intent to use the IoT Lab platform .................................................... 168
D7.4 Final Test Report
Page 6 of 169
Table of Figures
Figure 1: Usability Concept .................................................................................................. 19
Figure 2: Total energy consumption per day ......................................................................... 33
Figure 3: Comfort for Participant 1 ........................................................................................ 33
Figure 4: Comfort for Participant 2 ........................................................................................ 34
Figure 5: Comfort for Participant 3 ........................................................................................ 34
Figure 6: Budget spent over time .......................................................................................... 35
Figure 7: Luminance levels during the manual scenario ....................................................... 40
Figure 8: Luminance levels during the automated scenario. ................................................. 41
Figure 9: Total energy consumption per day. ........................................................................ 41
Figure 10: Total energy savings ........................................................................................... 42
Figure 11: A survey received by 2 phones defined with Research Code ‘Hepi021’ included in
the app settings .................................................................................................................... 49
Figure 12: Merging (a) socio economic profile of crowd participants with (b) their responses 50
Figure 13: Distribution of survey responses as well as data points from sensors on ekoNET
device ................................................................................................................................... 51
Figure 14: Air pollution data from sensors (top) and level of participants’ happiness from
survey (bottom) over time ..................................................................................................... 52
Figure 15: The parts of IoT Lab total functionality of the Jumpology case ............................. 65
Figure 16: Mobile phones labelled with their node numbers and specific test setup during the
pre-test ................................................................................................................................. 66
Figure 17: The TBaaS “Jumpology” Use Case process (number of identified requirements in
brackets) .............................................................................................................................. 67
Figure 18: The crowd participants “Jumpology” Use Case process (number of identified
requirements in brackets) ..................................................................................................... 68
Figure 19: Graph of data generated...................................................................................... 78
Figure 20: Graph generated ................................................................................................. 79
Figure 21: Shoreham, West Sussex (Telegraph, 2014) ........................................................ 81
Figure 22: OrganiCity scenario tool - https://scenarios.organicity.eu/ .................................... 83
Figure 23: IoT Lab Front Page .............................................................................................. 94
Figure 24: Sketch of suggestions for alternative layout of the front page (TBaaS usability test)
............................................................................................................................................. 96
Figure 25: My Profile Page ................................................................................................................. 97
Figure 26: Frontpage Get Inspired ........................................................................................ 98
D7.4 Final Test Report
Page 7 of 169
Figure 27: Front Page/ Ongoing research............................................................................. 99
Figure 28: Front page/Create a new research .................................................................... 100
Figure 29: Front page/ My research projects ...................................................................... 101
Figure 30: Front Page/My research projects/Research Dashboard .................................... 103
Figure 31: Front page/My research projects/Research Dashboard/Crowd interactions tab . 105
Figure 32: Sketch 1 (App usability test) .............................................................................. 136
Figure 33: Sketch 2 (App usability test) .............................................................................. 137
Figure 34: Sketch 3 (App usability test) .............................................................................. 138
Figure 35: Screen dump of exported survey data. .No socio-economic information is available
........................................................................................................................................... 164
Figure 36: Using a research code in creating a survey ....................................................... 165
Figure 37: Two phones that received a survey defined with a Research Code even though
one phone did not have a Research Code.......................................................................... 165
Figure 38: Example of over booked resources ................................................................... 167
D7.4 Final Test Report
Page 8 of 169
Table of Tables
Table 1: Planning the research phase, TBaaS ................................................................... 148
Table 2: Setting up the research phase, TBaaS activities ................................................... 149
Table 3: Setting up the research phase, Crowd Test Activities ........................................... 149
Table 4: Setting up the research phase, sensor test activities ............................................ 149
Table 5: Conducting the research phase ............................................................................ 150
Table 6: Analysing the results from the researcher phase .................................................. 150
Table 7: Performing complementary research phase ......................................................... 150
Table 8: Closing the research study phase ......................................................................... 151
D7.4 Final Test Report
Page 9 of 169
Abbreviations and acronyms
AB Advisory Board
ABC Attribute Based Credential
CA Consortium Agreement
CDT Centre for distance-spanning technology
CoAP Constrained Application Protocol
CODR Crowdsourced Online Dispute Resolution
ComSoc Communications Society
DG Data Group
DHCP Dynamic Host Configuration Protocol
DHT Distributed Hash Tables
DNS Domain Name System
DNSSec Domain Name System Security Extensions
DPA Data Protection Authorities
DPO Data Protection Officer
EC European Commission
EICTA European Information & Communications Technology Industry Association
ENISA European Union Agency for Network and Information Security
ENoLL European Network of Living Labs
ETSI European Telecommunications Standards Institute
EU European Union
EUI-64 64bit Extended Unique Identifier
FP7 Seventh Framework Programme
GA Grand Agreement
GA General Assembly
GPS Global Positioning System
H2020 Horizon 2020
HTTPS Hypertext Transfer Protocol Secure
ICT Information and Communication Technologies
ID Identifier
IEC International Electrotechnical Commission
IEEE Institute of Electrical and Electronics Engineers
IERC European Research Cluster on the Internet of Things
IETF Internet Engineering Task Force
IoT Internet of Things

D7.4 Final Test Report
Page 10 of 169
IP Internet Protocol
IPC Intellectual Property Committee
IPR Intellectual Property Rights
IPSEC Internet Protocol Security
IPv4 Internet Protocol version 4
IPv6 Internet Protocol version 6
ISO International Standards Organization
ISP Internet Service Provider
IT Information Technology
ITU International Telecommunication Union
KPI Key Performance Indicator
LSPI Legal, Security and Privacy Issues
MAC Media Access Control
MMA Mobile Marketing Association
MSc Master of Science
M2M Machine to Machine
NPD New Product Development
OASIS Organization for the Advancement of Structured Information Standards
OECD Organization for Economic Cooperation and Development
OS Operating System
OSN Online Social Network
PC Project Coordinator
PCP Partner Contact Person
PDPO Personal Data Protection Officer
PhD Doctor of Philosophy
PM Person Month
PMB Project Management Board
PO Project Officer
PPR Periodic Progress Report
PRAAT Privacy Risk Area Assessment Tool
P&T Post & Telecom
QoS Quality of Service
QoE Quality of Experience
RAND Reasonable and Non Discriminatory
RDI Research, Development and Innovation
RFC Request For Comments
D7.4 Final Test Report
Page 11 of 169
R&D Research & Development
SES Société Européenne des Satellites
SME Small Medium Enterprise
SMS Short Message Service
SOTA (or SoA) State Of the Art
SSL Secure Sockets Layer
TAM Technology Acceptance Model
TCP Transmission Control Protocol
TL Task Leader
TLS Transport Layer Security
Tor The Onion Router
TRL Technology Readiness Level
UN United Nations
UNCTAD United Nations Conference on Trade and Development
UPRAAT Universal Privacy Risk Area Assessment Tool
URL Uniform Resource Locator
US United States
VoIP Voice over Internet Protocol
WoT Web of Trust
WP Work Package
WPL Work Package Leader
W3C World Wide Web Consortium
XML Extensible Markup Language
D7.4 Final Test Report
Page 12 of 169
Executive Summary
This deliverable describes the different tests that has been performed during the third year of
the IoT Lab project in Task T7.2 Multidisciplinary tests and validation. This report continues
the work reported in D7.2 Intermediary integration and tests report. In this deliverable D7.4,
the results from two usability studies and five Use Case implementations and evaluations are
reported. The IoT Lab systems have been implemented on a university campus focusing on
energy savings, in a beer factory focusing on lightning, in a smart city context focusing on
environmental aspects and finally, in an open context focusing on accelerometer
measurements in order to test the logical flow in the system as well as the combination of the
different systems and their integration.
Based on the results from these evaluations, recommendations and guidelines for future tests
are presented together with recommendations for future approaches in order to elevate the
results from the IoT Lab project. The Letters of Intent from potential early adopters of IoT Lab
systems are another significant output of this Task and strengthen the possibilities for future
success of the IoT Lab system and Association. To guide the process of evaluations in
different phases of the project, we have based our approach on principles for evaluations
stemming from design science research since IoT Lab project is a design and development
project that moves between the different processes of building and evaluating. Based on
these evaluations, a suggestion for future scope for IoT Lab is presented in which IoT Lab
should be considered a research service focusing on supporting researchers in their process
of combining participatory sensing, surveys and stationary sensor research. In this way, the
researcher can use the IoT Lab tools in order to set up their experiments with a defined user
group that also can respond to a questionnaire.
D7.4 Final Test Report
Page 13 of 169
Introduction 1
In this deliverable, we will present the theoretical background of the final tests and
evaluations that have been carried out in real world contexts. We will give a presentation of
the process of each test Use Case and its results. Finally, we will present our
recommendations and guidelines for future tests.
1.1 The IoT Lab project in brief
IoT Lab is a European research project exploring the potential of crowdsourcing to extend
European IoT testbed infrastructure for multidisciplinary experiments with more end-user
interactions. It researches and develops:
1. Crowdsourcing mechanisms and tools enabling testbeds to use third parties resources
(such as mobile phones), and to interact with distributed users (the crowd). The
crowdsourcing enablers will address issues such as privacy by design, identity management,
security, reputation mechanisms, and data ownership.
2. Virtualization of crowdsourcing and testbed components by using a meta-layer with an
open interface, facilitating the integration and interaction with heterogeneous components. It
should ease data integration and reduce the cost of deployment in real environment.
3. Ubiquitous Interconnection and Cloudification of the testbeds resources. It will research the
potential of IPv6 and network virtualization to interconnect heterogeneous and distributed
resources through a Virtual IoT Network and will integrate them into the Cloud to provide an
on-line platform of crowdsourcing Testbed as a Service (TBaaS) available to the research
community.
4. End-user and societal value creation by analysing the potential end-users and
crowdsourcing participants to propose an optimized model for end-user adoption and societal
value creation.
5. “Crowdsourcing-driven research” as a new model in which the research can be initiated,
guided and assessed by the crowd. It will compare it to other models.
6. Economic dimension of crowdsourcing testbed, by analysing the potential markets and
business models able to monetize the provided resources with adequate incentives, in order
to optimize the exploitation, costs, profitability and economic sustainability of such testbeds. It
will also develop tools for future experiments.
7. Performing multidisciplinary experiments, including end-user driven experiments
through crowdsourcing, to assess the added value of such approach.
D7.4 Final Test Report
Page 14 of 169
The project will adopt a multidisciplinary approach and address issues such as privacy and
personal data protection. To achieve these ambitious goals, the consortium consists of seven
international academic or research partners and a SME that bring in expertise from
complementary research areas, including Information and Communication Technologies,
End-user interaction, and Economics.
1.2 Purpose and scope of the WP 7
This Work package’s main roles are to support and validate the integration of the components
and resources developed by the other WPs and to perform various multidisciplinary tests and
analyse their results.
1.3 Purpose and scope of the Task T7.2
In this Task, the partners will perform several tests demonstrating the added value of the IoT
Lab platform. The tests will exploit the Use Cases identified by WP1 which have been
enriched and adapted to the work progress of the project. These tests will demonstrate the
crowdsourcing and the multidisciplinary potentials of the IoT lab platform. The results of the
test will be compiled and analysed into a comprehensive report, with guidelines and
recommendations for future tests.
1.4 Purpose and scope of the current document
The aim of this document in to report on the different Use Cases that have been carried out in
this Task. Tests have been carried out in three cycles and this deliverable focuses on the last
cycle of the final year of the project. In previous studies, the focus has first been on
understanding the concept of IoT Lab from a user perspective, which has been reported in
deliverables D5.1 Evaluation framework including end-user evaluation tools and methods and
D5.2 End user sustainability report, including socio-economic analysis and best-practices. It
has also been tested from a functional view which has been reported in D7.2 Intermediary
integration and tests report for Y2.
The first round of our tests focused on usability testing in both the TBaaS and the mobile
application. In the second round, five different Use Cases were performed: the Beer Factory
case, University of Patras, Smart Hepia, EkoBus, and Jumpology 1 and 2. These Use Cases
were selected from D1.1 Initial IoT Lab end-user requirements report and also because they
ensured that all the different aspects of the IoT Lab system would be tested in real-world
contexts along with potential future users. Adding to this, we tested the Jumpology case, a
multi-disciplinary Use Case which had not been considered in previous requirement
D7.4 Final Test Report
Page 15 of 169
engineering processes. We have also identified future collaborations and potential early
adopters of the system, which offers great opportunities for future usage and sustainable
development.
D7.4 Final Test Report
Page 16 of 169
Tests and Evaluations in Design Research 2
Evaluation of designed artefacts is a central and critical part of design processes and is
primarily concerned with evaluation of design outputs and design artefacts and together with
the process of building the artefact, evaluation is one of two key activities that constitute
design research (Venable et al., 2016). In the IoT Lab project, a lot of effort and time has
been put into the continuous building and evaluation of the platform and the mobile
application. In this deliverable, we will report on the results from the evaluation activities. The
process of evaluation is critical to design research and requires researchers to demonstrate
utility, quality and efficacy of a design artefact using well-established evaluation methods. The
artefacts must be analysed based on their use and performance as possible explanations for
changes (hopefully improvements) in the behaviour of the systems as well as of people.
There is a tight linkage between evaluation and the design itself and this arises from the
impact of evaluations on design thinking. Without rigorous tests and evaluations, there would
only be a theorizing of the artefact without any evidence that is actually works. Evaluations in
design research have a wider scope than ordinary practices of design because its context
includes research goals. In an ordinary design project without scientific aims, evaluation is
focused on the artefact in the context of the utility it contributes to its environment (Hevner et
al., 2004). In a design research project, evaluation must also regard the design and the
artefact in the context of the knowledge it contributes. Since such a build and evaluate cycle
seeks to deliver both environmental utility and additional knowledge, the evaluation approach
not only needs to address the quality of the artefact utility, but also the quality of its
knowledge outcomes. This dual purpose of evaluation means that, if design research is to
live up to its label as science, the evaluation should be relevant, rigorous and scientific
(Venable et al., 2016). That is also the reason why this theoretical section was added to
strengthen the research aspects of the artefacts and to identify new emerging knowledge
which can contribute to recommendations and further development of these type of testbed
artefacts.
But how should such evaluations be designed and conducted as part of a design research
project? What structure, strategies and methods can be used to support the evaluation? How
can the evaluation process be designed to be both effective (rigorous) and efficient (using
resources effective)? Usually in literature, there is an underlying assumption that only one
type of evaluation will be necessary to demonstrate both the artefact’s utility, fitness or
usefulness, as well as any design principle or theory employed in the artefact’s construction
(Venable et al., 2016). This is naturally not true. Furthermore, the cyclical nature of many
D7.4 Final Test Report
Page 17 of 169
design research processes usually requires different evaluation strategies at different phases
in the process. In the IoT Lab project, we evaluated the idea of the system and the basic
design of the system in Y1 and focused on understanding potential users’ needs, values and
requirements. In Y2, the focus of the tests and evaluations was on the usability, user
satisfaction, and functionality of the IoT Lab system. While in Y3, we started with identifying
bugs, testing the usability of the systems from a logical flow perspective of the system as a
whole, and ended the year with real world implementations in different field pilots focused on
evaluating the functionality, utility, and usefulness of the IoT Lab system in real world
exposure situations where its users used and assessed the system based on their
experiences.
Remenyi & Sherwood-Smith (2012) has identified two important categories of evaluations as
firstly, formative vs. summative evaluation, and secondly ex ante vs. ex post evaluations.
Formative or summative evaluations refer to why we evaluate, that is the functional purpose
of the evaluation. A formative evaluation focus on producing empirically based interpretations
that provide the basis for a successful action in enhancing the design of the evaluand.
Summative evaluations focus on producing empirically based interpretations that provide a
basis for creating shared meanings about the evaluand in the face of different contexts.
Summative evaluations are more focused on the results, while formative evaluations are
often used to measure improvements as the design progresses. In the IoT Lab project, we
have done several evaluations of the formative character, contributing to the further
development of the different systems such as TBaaS and the mobile application respectively.
It is also important to decide when to evaluate, that is the Ex-ante or Ex-post evaluation. This
distinction arises from the timing of the evaluation processes. Ex-ante evaluations are often
used to support decisions about whether or not to acquire or develop technology, which is the
focus in IoT Lab project. Ex post evaluations are an assessment of the value of the
implemented system after it has been acquired or implemented based on both non-financial
and financial measures (Venable et al., 2016). This is outside the scope of the IoT Lab
project.
There are many reasons why we should evaluate a designed artefact or an ensemble of
artefacts. First, we usually perform evaluations to assess how well the artefact answers to its
purpose, which in IoT Lab is to support sensor based research questions including
participant’s, virtual and stationary sensors. An evaluation can also have the purpose of
comparing different systems with each other, which is not the case in our project. A third
purpose of evaluations can be the utility of an artefact which is a complex concept that
includes many different aspects beyond the simple achievements of the artefacts purpose.
D7.4 Final Test Report
Page 18 of 169
Artefacts can be evaluated in terms of functionality, completeness, consistency, accuracy,
performance, reliability, usability, usefulness, scalability, fit to organization, fit to process, and
other relevant quality attributes. The evaluation can also have the purpose of exploring why a
design works or not. And last, an evaluation can also focus on the assessing the unintended
consequences of the design. In the IoT Lab project, the aim has been to cover most of these
aspects on our evaluations and user engagement activities.
When designing evaluation studies, it is also important to understand the paradigm of the
evaluation which can be either naturalistic or artificial (Venable, 2006). Naturalistic
evaluations explore the performance of a designed solution in the real-world environment.
With this approach, the evaluation embraces the complexity that exists in real-world contexts
with human practices. This evaluation approach is always empirical and tends towards
interpretivism. These evaluations usually include methods such as case studies, field studies,
field experiments, surveys, ethnography and action research. In the IoT Lab project, we have
done field experiments in this testing cycle, while in the previous test cycles, the nature of the
tests were more of an artificial character where the systems were put to test in more
controlled contexts. The pathway sought and followed in design research projects can take
different forms based on the needs and resources available in the project. This gives rise to
different strategies. In general, there are four different strategies that can be applied in design
research projects; Quick and simple, Human Risk & Effectiveness, Technical Risks & Efficacy
and Purely Technical Artefact tests (Venable et al., 2016). In this project, we have applied a
human risk approach looking for human aspects of the technology, the purely technical
artefact test searching for bugs and preparing for field trials, as well as the technical risks and
efficacy approach focusing on identifying technical functionalities and their influence on
efficacy. Hence, the evaluation strategy in IoT Lab can be considered as a hybrid approach.
In the IoT Lab project, the evaluations that have been carried out covers most of these
purposes except the comparison of different similar solutions, since we are not aware of any
similar system. Hence, the aim of this deliverable is to shed light on the different purposes
and based on that, present our guidelines and recommendations for future tests.
In the area of interaction design, a number of IT-system evaluation methods have been
developed. Preece et al (2002) divides the different methods into different evaluation
paradigms that often are related to certain discipline and each containing different
techniques. They identify four different paradigms; quick and dirty evaluations, usability
testing, field studies and predictive evaluation. In the IoT Lab project, we have used usability
tests, quick and dirty tests and field studies as part of our naturalistic evaluation paradigm.
D7.4 Final Test Report
Page 19 of 169
2.1 Quick and Dirty tests and evaluations
In the quick and dirty evaluation paradigm, the focus is to get feedback from users to
confirm that the product is in line with user needs. This kind of evaluations can be
performed at any stage during the development cycle and the emphasis is to get fast
input versus carefully documented findings.
2.2 Usability tests
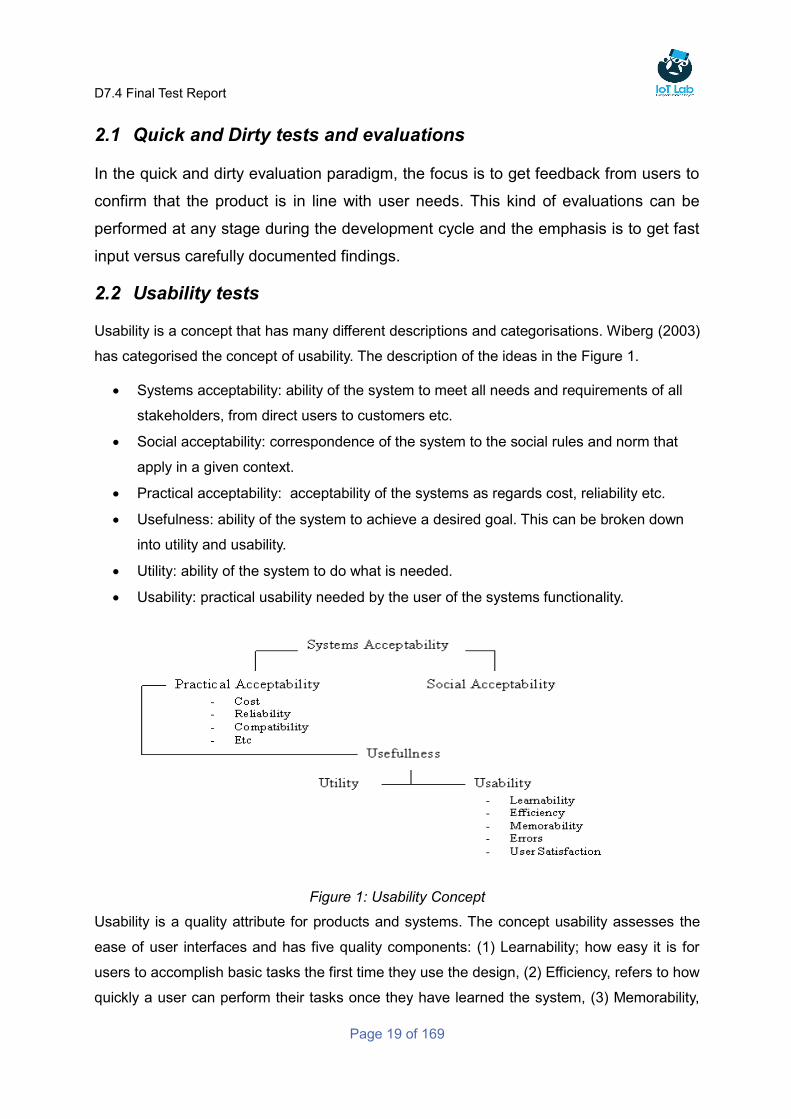
Usability is a concept that has many different descriptions and categorisations. Wiberg (2003)
has categorised the concept of usability. The description of the ideas in the Figure 1.
Systems acceptability: ability of the system to meet all needs and requirements of all
stakeholders, from direct users to customers etc.
Social acceptability: correspondence of the system to the social rules and norm that
apply in a given context.
Practical acceptability: acceptability of the systems as regards cost, reliability etc.
Usefulness: ability of the system to achieve a desired goal. This can be broken down
into utility and usability.
Utility: ability of the system to do what is needed.
Usability: practical usability needed by the user of the systems functionality.
Figure 1: Usability Concept
Usability is a quality attribute for products and systems. The concept usability assesses the
ease of user interfaces and has five quality components: (1) Learnability; how easy it is for
users to accomplish basic tasks the first time they use the design, (2) Efficiency, refers to how
quickly a user can perform their tasks once they have learned the system, (3) Memorability,
D7.4 Final Test Report
Page 20 of 169
refers to how easily the users can re-establish proficiency after not using the design for a
while, (4) Errors means how many errors users make, how easily they can recover from the
errors and how severe the errors are (5) Satisfaction, how pleasant the user think it is to use
the design (Nielsen, 2003).
Another definition of usability is presented by Rubin (Rubin, 1994). He states that there is no
broadly recognised definition that is accepted among professionals in the usability
community. But it is generally accepted that an operational definition of usability includes one
or more of the following four factors:
1. Usefulness: this is concerned with to which degree a product enables a user to
achieve his or her goals, and is an assessment of the users’ motivation for using the
product at all.
2. Effectiveness (ease of use): this factor is usually measured with quantitative
measures such as performance or error rate.
3. Learnability: this factor has to do with the users’ ability to operate the system to
some defined level of competence after some predetermined amount and
period of training.
4. Attitude (likability): attitude refers to the user’s perceptions, feelings and
opinions of the product. This is usually captured on both written and oral
interrogation.
2.3 Heuristic Evaluation combined with “Think Aloud”
Expert based tests and evaluation techniques (such as heuristic evaluation and cognitive
walk through) are well known methods that facilitate a quick and dirty approach to tests.
Heuristic evaluation in particular has been widely accepted and investigated due to its
efficiency in detecting most usability flaws (75-80% with a limited investment of time and
resources, usually 3-5 experts are needed (Nielsen, 2003).
In this test, we gathered data about critical and non-critical bugs and their subjective
evaluation of the systems. The use goals established were grade of performance, correctly
performed tasks as well as attitudes towards the system. To facilitate the evaluation of the
system, there are a number of usability principles that can be used and these principles have
also guided our test. The principles can be described as follows:
1. Visibility of system status: keep the user informed about what is going on in the
system by giving appropriate feedback at the right time.
D7.4 Final Test Report
Page 21 of 169
2. Match the system and the real world: talk the user’s language and terms.
3. User control and freedom: make it possible for the user to, in a simple way, finish the
activity they are currently doing by giving them exits.
4. Consistency and standards: avoid making the user confused by using different
terminology for activities that mean the same thing.
5. Assist the user to discover and recover from faults: use a simple language that easily
describe what has gone wrong and how they can solve it.
6. Prevent faults: When it is possible, prevent the user from doing wrong actions.
7. Recognition rather than memory: make objects, activities and options visible.
8. Flexibility and effective use: design the system so that users with different levels of
maturity and knowledge can use the system effectively.
9. Aesthetics and minimal design: avoid the use of information that is irrelevant or
seldom used.
10. Help and documentation: provide information that is easy to find and gives concrete
help.
For the mobile application, the evaluation criteria based on recommendations by Bertini et al
(2009) was added.
11. Ease of input, screen readability and glance ability: Mobile systems should provide
easy ways to input data, possibly reducing or avoiding the need for the user to use
both hands. Screen content should be easy to read and navigate through
notwithstanding different light conditions. Ideally, the mobile user should be able to
quickly get the crucial information from the system by glancing at it.
2.4 Field Tests – Use Case implementations
This style takes the evaluator and the tester out into the real world environment in order to
observe the system in action. This approach has its pros and cons, such as a high level of
ambient noise, greater levels of movement and constant interruptions which all make field
observations difficult. The open nature of the situation means that you will observe how the
system behaves and used in its real world context, which might provide insights that would
have been missed in a laboratory setting. In addition, some activities taking days or months
are impossible to study in a laboratory. On balance, field observation is preferable to
laboratory studies as it allows us to study the system behaviour as it occurs in actual use.
Even interruptions are important as these will expose behaviours both of the system and of
the user. However, we should remember that even in field observation, the subjects are likely
to be influenced by the presence of the researcher and his/her equipment (Dix et al., 1998).
D7.4 Final Test Report
Page 22 of 169
Usability Test Process and Results 3
This evaluation is inspired by the methods of cognitive walkthrough and the use of common
usability heuristics and provides reflections on things that can improve the users’ interaction
with the IoT Lab app. This work should be considered as a quick overview of the current
prototype.
3.1 General summary and reflections – Usability Study of TBaaS
This usability test of the TBaaS system was carried out in February 2016 with 5 potential end-
users according to recommendations. In parallel to the user tests, an expert test (heuristic
evaluation) was also carried out in order to cover as many usability aspect as possible , see
Appendix 1 for more details. For the user tests, the users were requested to set up a test in
the TBaaS according to the assumption that they represented a municipality. The different
phases the research went through were:
1. Planning the research
2. Setting up the research
3. Conducting the research
4. Analysing the results from the research
5. Performing complementary research
6. Closing the research studies
In all these phases, the researchers performed a number of activities that should be
supported by TBaaS. Based on the results from this usability study, there were a few aspects
that needed to be designed into the system to strengthen its performance. The lessons
learned were:
It is not so clear for the researcher what is possible to accomplish with TBaaS without
registering and becoming a member. The webpage is a mix between a project
webpage and the “service” webpage, and much information about what is possible to
do is located in a video on the webpage, which is far from optimal. Here, we
suggested that the offering of the IoT Lab should be clearly stated on the starting
page and a suggested formulation was presented
It should be possible for researchers to add their own resources to the testbed and
thus contributing both to the expansion of TBaaS as well as their own research. This
has also been implemented in the latest version of TBaaS.
The idea and problem definition area needs to be more developed, giving the
opportunity for researchers to get more inspired and to understand the idea in depth.
D7.4 Final Test Report
Page 23 of 169
Researchers usually have a good view of their field, hence they need a thorough
understanding of what the suggested idea is focusing on.
In summary, the TBaaS system offers opportunities to support sensor based research
projects, but needs to be further elaborated on and refined to make the offering and usability
of the system better. These improvements was documented in detail in the outcome of the
expert usability test.
3.2 General summary and reflections – Usability study of the app
This test was carried out in February and March 2016 together with potential end-users with
the aim to identify usability issues that needs to be solved in future versions of the
application. In general, the current version of the app reveals some overall challenges that is
not only a design problem but adheres to some high-level strategic unclarity, which easily
happens before design and functions can be tested. For more details, see Appendix 2. These
challenges are:
● TBaaS and app discrepancy in focus: While the web service for researchers is
focused on bringing in data to a research project (the key aim/focus), with rather low
interaction with/awareness of users contribution, the current design of the application
focuses on the idea generation of the crowd. This creates a discrepancy between
these two worlds, a gap that needs to be bridged. A suggestion to solve this issue
was to change the appeared key aim of the app to be “contribution to research” (via
research participation and idea generation) and clarify in the TBaaS that the ideas
comes from the crowd and enable communication between these two worlds.
● TBaaS and app discrepancy in “informed consent”: The fact that users have to agree
to let IoT Lab use data from their phone from the moment they download the app
becomes a usability problem (and probably also a problem for ethics and privacy). At
the same time, as a researcher, you get very little or no information about the
“informed consent” reality of the user. This is a gap today and needs to be handled.
● Discussions with social science users also reveal that doing research on people in a
business company context is likely to render higher requirements on privacy, that is,
these respondents might be restrained by company rules on permitting access to
mobiles that contain company information such as correspondence, and access
points to internal systems, etc.
● Lack of (direct) communication between researchers and crowd: even though this
issue is based on technical and privacy difficulties, it still needs to be mentioned as a
D7.4 Final Test Report
Page 24 of 169
usability problem given the initial thought about what IoT Lab was supposed to
accomplish. This is also related to research ethics, where the contributors in the
crowd should have the opportunity to easily get in contact with the researcher leading
the project. If the tool is used as a research tool in which the researcher has contact
with the crowd by other means than the application, these issues can be solved in
other ways.
● Socio-economical profile needs a remembering function: when the app user
downloads the apps, he/she is supposed to fill in a socio-economical profile that
relates to the “list of participants” in TBaaS; that is, a list from which the researcher
chooses which crowd-participants to send a survey to. However, there is an option to
skip the profile and after that, the users are never asked again. There should be a
status marker or some kind of notification that prompts the users to complete the
profile. Also, to connect the profile to the use of other functions, needs to be
considered or maybe it shouldn’t be possible to join as long as the profile is not
complete. Also, the socio-economical profiles does not seem to be saved.
● The different parts of a research projects needs to be gathered in the app in relation
to a project. Here experiments, surveys, ideas, and recommendations should be
combined to create a project as a whole. This approach would also make it possible
for the crowd to see which parts of the project they have fulfilled or not. For example,
if a research project contains both a collection of passive data (called experiments)
from a person’s mobile phone (e.g. geo position) as well as occasional surveys to
complement the passive data, these two “items” ends up in different places in the app
without a clear understanding that they actually are part of the same research project.
If a person only participates in one project that will most likely cause little
disturbances, but the layout could better support scalability for participating in multiple
projects. It is of vital importance that the users clearly understand what activities
belong to the same projects and that they can follow their progress.
● Users without an account: If the app for various reasons is removed from the phone,
the personal profile disappears and any on-going data collection will be terminated.
Even if the app can be downloaded again, the lack of a user account will make it
impossible to connect the former profile to the new one in order to produce data. If the
researcher can’t correlate a data stream to the same person, the data will be of less
use for the researcher.
D7.4 Final Test Report
Page 25 of 169
● Scalability implications: When evaluating the application, we have identified some
challenges when it comes to scaling up the user experience. First, the difficulty to filter
either the research projects or “My surveys” which causes a risk in the content in the
app. This results in the user to become overwhelmed with information, if it considers
that there are 50 different experiments ongoing in the application. This will also make
it more challenging for the user to control their efforts and share data to different
projects.
Using the application for research projects offers great opportunities for sensor based
research on a case-by-case basis. In this way, researchers can invite the contributing
crowd to share their data as one part of a greater project. The application will also make it
possible for the crowd to participate in citizen science projects in an easy way that was
not possible before.
D7.4 Final Test Report
Page 26 of 169
Smart Energy Management and Comfort at University of 4
Patras
By: Panagiotis Alexandrou, Sotiris Nikoletseas, Theofanis Raptis, and Christos-Spartakos
Zachiotis
This current Use Case was implemented through a collaboration of the CTI team from IoT
Lab with participants from the University of Patras (UPatras). UPatras was founded in the city
of Patras, Greece in 1964. The University is a two-city campus, situated both in Patras and
Agrinion, Greece. It is the third largest University in Greece based on the student body, the
faculty members, administrative personnel, number of departments, and accredited student
titles. UPatras includes 24 departments, with a large number of sectors and consequently a
great range of disciplines, which operate 112 laboratories and 14 fully equipped clinics.
UPatras has 28,727 Undergraduate and 3,959 Postgraduate students, a total of 727 faculty
members, 146 teaching and technical staff and 457 administrative personnel. (data of
September 2013). Besides its distinguished path in education, UPatras has excelled in the
fields of Basic and Applied Research. It has acquired international prominence for pioneering
wide ranging research in areas such as Environment, Health, Biotechnology, Mechanics,
Electronics, Informatics and Basic Science. A number of the departments, laboratories and
clinics have been designated as Centres of Excellence, on the basis of international
assessment. The University of Patras has a reputation for quality and innovative research
and presents an effective participation in a plethora of research projects, scientific
organizations, and research groups together with its educational and research work, the rich
campus life of UPatras, attracts many candidate students every year as their first and
foremost choice for their higher degree studies.
More specifically, the participants were staff members of the Computer Engineering and
Informatics Department (CEID). CEID was founded in 1979 and is essentially the leading
department in the field of Computer Technology, Informatics and Communications in Greece.
In a short time, CEID has developed into one of the best University departments in Greece
with a large number of candidates every year and is involved in teaching and research in
Science and Technology of Computers and the study of their applications. The Department
provided the CTI team with a specific set of office premises within the building of CEID, as
well as access to several smartphones of which the users served as participants for this Use
Case.
D7.4 Final Test Report
Page 27 of 169
The Use Case was successfully tested in cooperation with the Building Manager of University
of Patras and CTI’s Engineering team of IoT Lab. The participants were notified of the
necessary steps required for their participation in the Use Case. They downloaded the
smartphone app and filled a unique project number given to them by the organizers. The
Building Manager proceeded with registering in the platform. He discovered the mobile
devices via the use of the project code and registered the lights and location sensors. He also
discovered and registered the sensors responsible for the monitoring and actuation of the
building. He ran two scenarios, one manually and one automated, with the purpose of
comparing the total energy consumption in each, and consequently measure the
effectiveness of the IoT Lab platform.
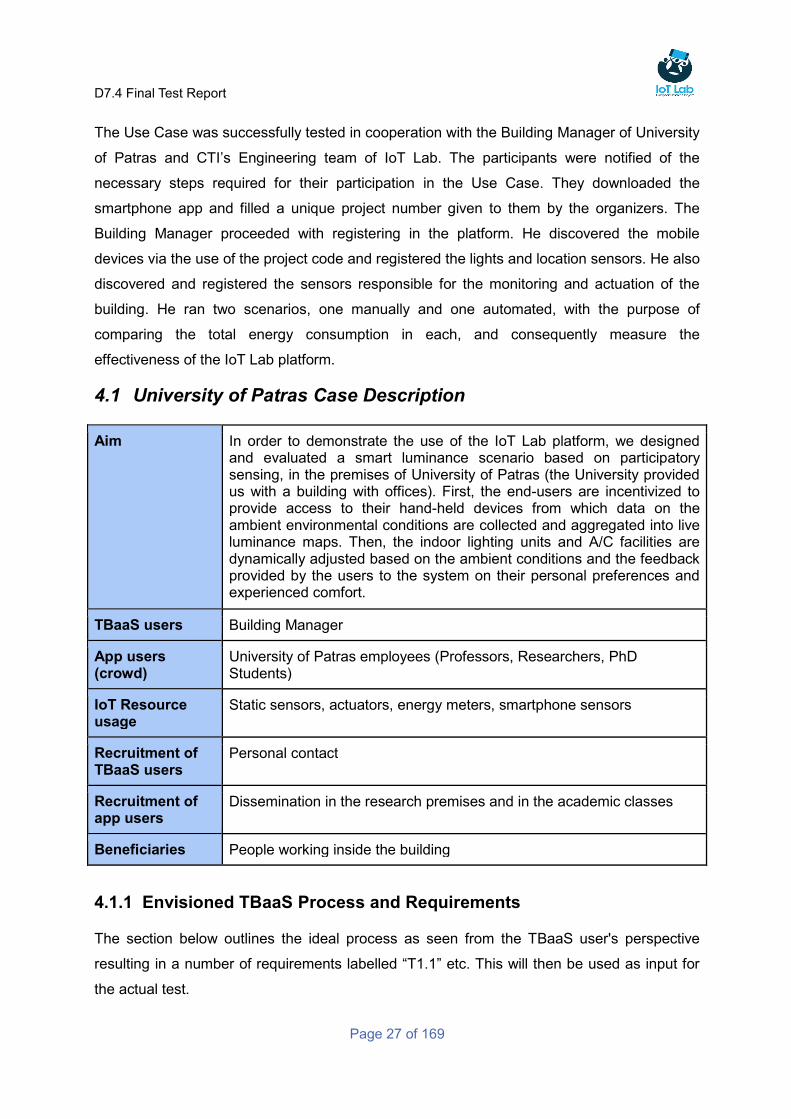
4.1 University of Patras Case Description
Aim In order to demonstrate the use of the IoT Lab platform, we designed and evaluated a smart luminance scenario based on participatory sensing, in the premises of University of Patras (the University provided us with a building with offices). First, the end-users are incentivized to provide access to their hand-held devices from which data on the ambient environmental conditions are collected and aggregated into live luminance maps. Then, the indoor lighting units and A/C facilities are dynamically adjusted based on the ambient conditions and the feedback provided by the users to the system on their personal preferences and experienced comfort.
TBaaS users Building Manager
App users (crowd)
University of Patras employees (Professors, Researchers, PhD Students)
IoT Resource usage
Static sensors, actuators, energy meters, smartphone sensors
Recruitment of TBaaS users
Personal contact
Recruitment of app users
Dissemination in the research premises and in the academic classes
Beneficiaries People working inside the building
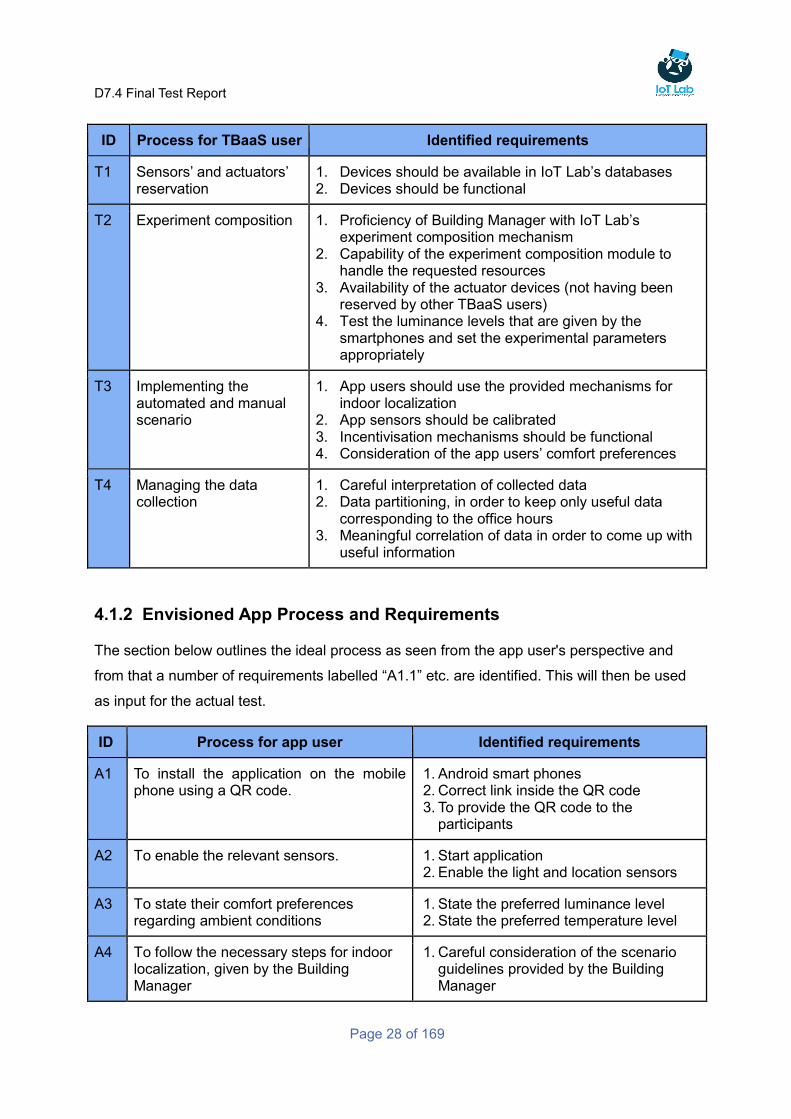
4.1.1 Envisioned TBaaS Process and Requirements
The section below outlines the ideal process as seen from the TBaaS user's perspective
resulting in a number of requirements labelled “T1.1” etc. This will then be used as input for
the actual test.
D7.4 Final Test Report
Page 28 of 169
ID Process for TBaaS user Identified requirements
T1 Sensors’ and actuators’ reservation
1. Devices should be available in IoT Lab’s databases 2. Devices should be functional
T2 Experiment composition 1. Proficiency of Building Manager with IoT Lab’s experiment composition mechanism
2. Capability of the experiment composition module to handle the requested resources
3. Availability of the actuator devices (not having been reserved by other TBaaS users)
4. Test the luminance levels that are given by the smartphones and set the experimental parameters appropriately
T3 Implementing the automated and manual scenario
1. App users should use the provided mechanisms for indoor localization
2. App sensors should be calibrated 3. Incentivisation mechanisms should be functional 4. Consideration of the app users’ comfort preferences
T4 Managing the data collection
1. Careful interpretation of collected data 2. Data partitioning, in order to keep only useful data
corresponding to the office hours 3. Meaningful correlation of data in order to come up with
useful information
4.1.2 Envisioned App Process and Requirements
The section below outlines the ideal process as seen from the app user's perspective and
from that a number of requirements labelled “A1.1” etc. are identified. This will then be used
as input for the actual test.
ID Process for app user Identified requirements
A1 To install the application on the mobile phone using a QR code.
1. Android smart phones 2. Correct link inside the QR code 3. To provide the QR code to the
participants
A2 To enable the relevant sensors. 1. Start application 2. Enable the light and location sensors
A3 To state their comfort preferences regarding ambient conditions
1. State the preferred luminance level 2. State the preferred temperature level
A4 To follow the necessary steps for indoor localization, given by the Building Manager
1. Careful consideration of the scenario guidelines provided by the Building Manager
D7.4 Final Test Report
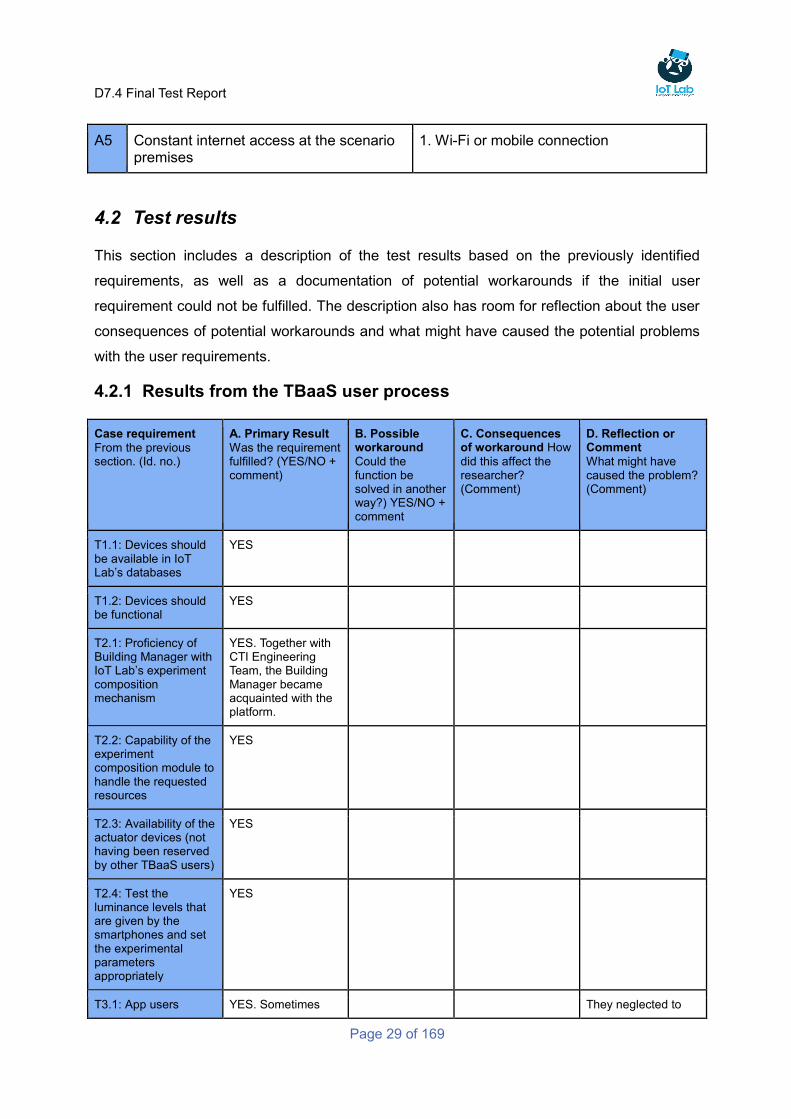
Page 29 of 169
A5 Constant internet access at the scenario premises
1. Wi-Fi or mobile connection
4.2 Test results
This section includes a description of the test results based on the previously identified
requirements, as well as a documentation of potential workarounds if the initial user
requirement could not be fulfilled. The description also has room for reflection about the user
consequences of potential workarounds and what might have caused the potential problems
with the user requirements.
4.2.1 Results from the TBaaS user process
Case requirement
From the previous section. (Id. no.)
A. Primary Result
Was the requirement fulfilled? (YES/NO + comment)
B. Possible workaround
Could the function be solved in another way?) YES/NO + comment
C. Consequences of workaround How
did this affect the researcher? (Comment)
D. Reflection or Comment
What might have caused the problem? (Comment)
T1.1: Devices should be available in IoT Lab’s databases
YES
T1.2: Devices should be functional
YES
T2.1: Proficiency of Building Manager with IoT Lab’s experiment composition mechanism
YES. Together with CTI Engineering Team, the Building Manager became acquainted with the platform.
T2.2: Capability of the experiment composition module to handle the requested resources
YES
T2.3: Availability of the actuator devices (not having been reserved by other TBaaS users)
YES
T2.4: Test the luminance levels that are given by the smartphones and set the experimental parameters appropriately
YES
T3.1: App users YES. Sometimes They neglected to
D7.4 Final Test Report
Page 30 of 169
should use the provided mechanisms for indoor localization
users were not localized in a correct way.
follow the proper instructions.
T3.2: App sensors should be calibrated
NO. Each smartphone device has a different light sensor.
YES. Construct an experiment which measures the same lighting conditions via different devices. Then construct a table correlating the different measurements with each other.
Extra work before the experiment initialization. Results’ precision affected.
Each different smartphone sensor returns different light values than another one.
T3.3: Incentivisation mechanisms should be functional
YES. They were still under development during the execution of the Use Case.
YES. Development of an ad hoc incentivisation method by the CTI Engineering Team.
Researcher did not use the official IoT Lab Incentivisation Module.
Incentive mechanisms still under development.
T3.4: Consideration of the app users’ comfort preferences
YES
T4.1: Careful interpretation of collected data
YES
T4.2: Data partitioning, in order to keep only useful data corresponding to the office hours
YES
T4.3: Meaningful correlation of data in order to come up with useful information
YES
4.3 Results from the App user process
Case requirement From
the previous section. (Id. no.)
A. Primary Result
Was the requirement fulfilled? (YES/NO + comment)
B. Possible workaround
Could the function be solved in another way?) YES/NO + comment
C. Consequences of workaround
How did this affect the researcher? (Comment)
A1.1: Android smart phones
YES. Some users had iPhones.
NO. IPhones not supported.
Some users did not take part in the experiments.
A1.2: Correct link inside the QR code
YES
A1.3: To provide the QR code to the participants
YES
A2.1: Start application YES
D7.4 Final Test Report
Page 31 of 169
A2.2: Enable the light and location sensors
YES
A3.1: State the preferred luminance level
YES. Participants got informed beforehand about the meaning of Lux Metric System.
A3.2: State the preferred temperature level
YES
A4.1: Careful consideration of the scenario guidelines provided by the Building Manager
NO. Sometimes users were not localized in a correct way.
YES. Intense reminders Extra work
A5.1: Wi-Fi or mobile connection
YES
4.4 Lessons Learned and Future Recommendations
4.4.1 A crowd-enabled scenario for efficient smart energy management
In order to demonstrate the capabilities offered by the IoT Lab platform, we developed a
smart energy management scenario that incorporates participatory sensing mechanisms. In
this scenario, the system tries to optimize the operation of indoor units that consume energy
in terms of energy efficiency and user satisfiability via participatory sensing practices. First,
the participants are incentivised to provide access to their hand-held devices from which data
on the ambient environmental conditions are collected and aggregated into live luminance
maps. Then, the indoor lighting units and A/C facilities are dynamically adjusted based on the
ambient conditions and the feedback provided by the participants to the system based their
personal preferences and experienced comfort.
4.4.2 Experimental set-up
The building space was virtually partitioned into 4 areas, each one mapped to an on/off light
control unit. Additionally, the experiment controlled a central HVAC unit. The smartphone
application was used by 11 participants (students, professors, researchers, all of them
agnostic about the system). We ran two scenarios in a span of 6 days each (Tuesday to
Sunday). In the first scenario (manual), the system was not operational, and the participants
were handling the devices of the room on their own, just like a normal day in the office. In the
second scenario (automated), the system was operational and the devices were being
operated according to the experiment defined by the Building Manager in the IoT Lab
platform. The exact days that the experiments were conducted were 30/8/2016-04/09/2016
(manual) and 06/09/2016 -11/09/2016 (automated).
D7.4 Final Test Report
Page 32 of 169
The system could locate the participants and their movement within the 4 partitioned areas.
Each participant’s phone, after he/she accepted to join the experiment, was periodically
polled with a frequency of 10 minutes to provide light readings of his/her current location in
exchange for some budget defined by the corresponding incentive policy. The budget
designed for this Use Case was the collection of virtual points. Based on the sensor readings
of the smartphones, and the participants’ preferred luminance level, the lighting of the area
was adjusted. Also, their presence triggered the actuation of the HVAC unit. Apart from using
the smartphone app for the lights actuation, participants followed their daily office routine.
We used two incentive policies: (1) the Flat Incentive which is a simple strategy used as a
baseline for the evaluation of the other strategies in which the system distributes the available
budget over the set of people based on the number of the polled measurements, and (2)
Location-aware Incentive in which the system is constantly aware of the location of each
person inside the premises. In this strategy, the system distributes the budget based on the
number of people in each tile in addition to the number of measurements.
4.4.3 Evaluation of results
For the performance evaluation of the efficiency of the overall system, we utilized several
performance metrics that capture different aspects of the IoT Lab and the participatory
sensing components of the testbed facility.
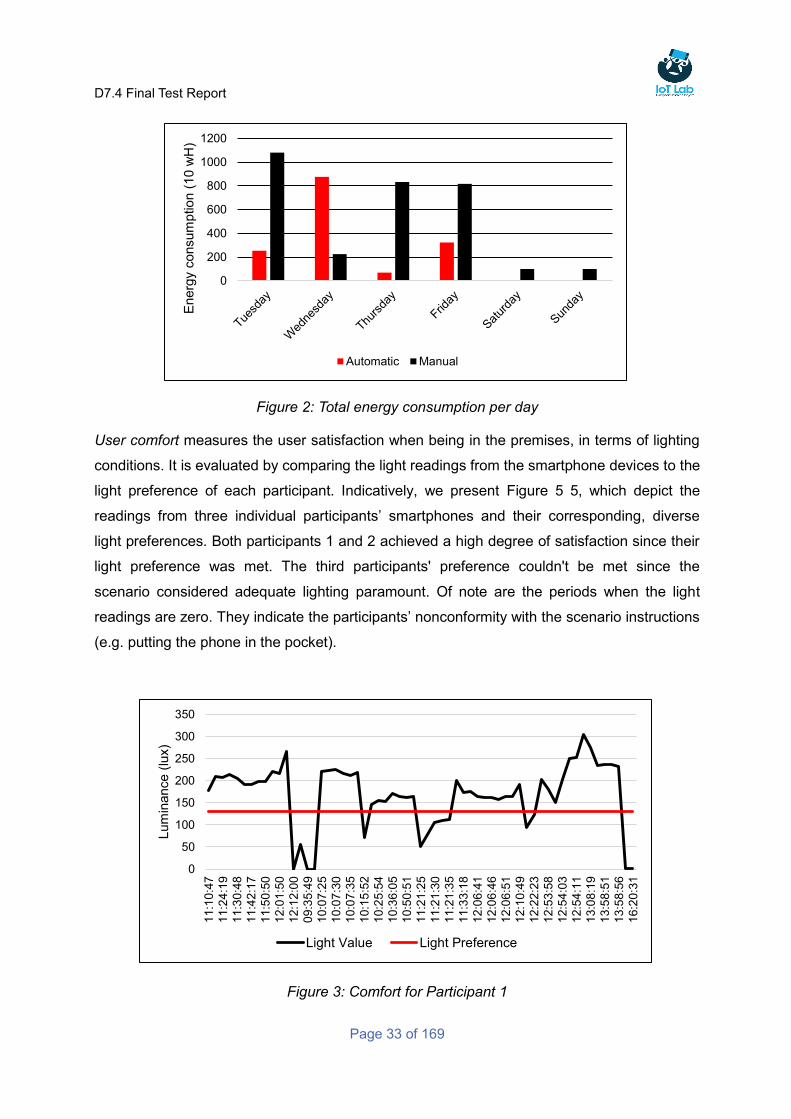
Energy Consumption measures the total energy spent by the participants while using the
building. Figure 2 shows the energy consumption for the manual and automated use of the
premises. The consumption is indicated in groups according to the consumptions of each
specific day. The automated scenario performed much better in all days (except Wednesday)
saving 52% of energy in total. On Wednesday, we noticed a larger than normal user
participation and activity in the premises. This is apparent in the sharp increase of budget
distribution to the participants on that day, as viewed in Figure 6. An interesting remark, is
that the automated scenario saved energy also during the weekend, when the manual
scenario kept some devices open (a participant forgot to close a light).
D7.4 Final Test Report
Page 33 of 169
Figure 2: Total energy consumption per day
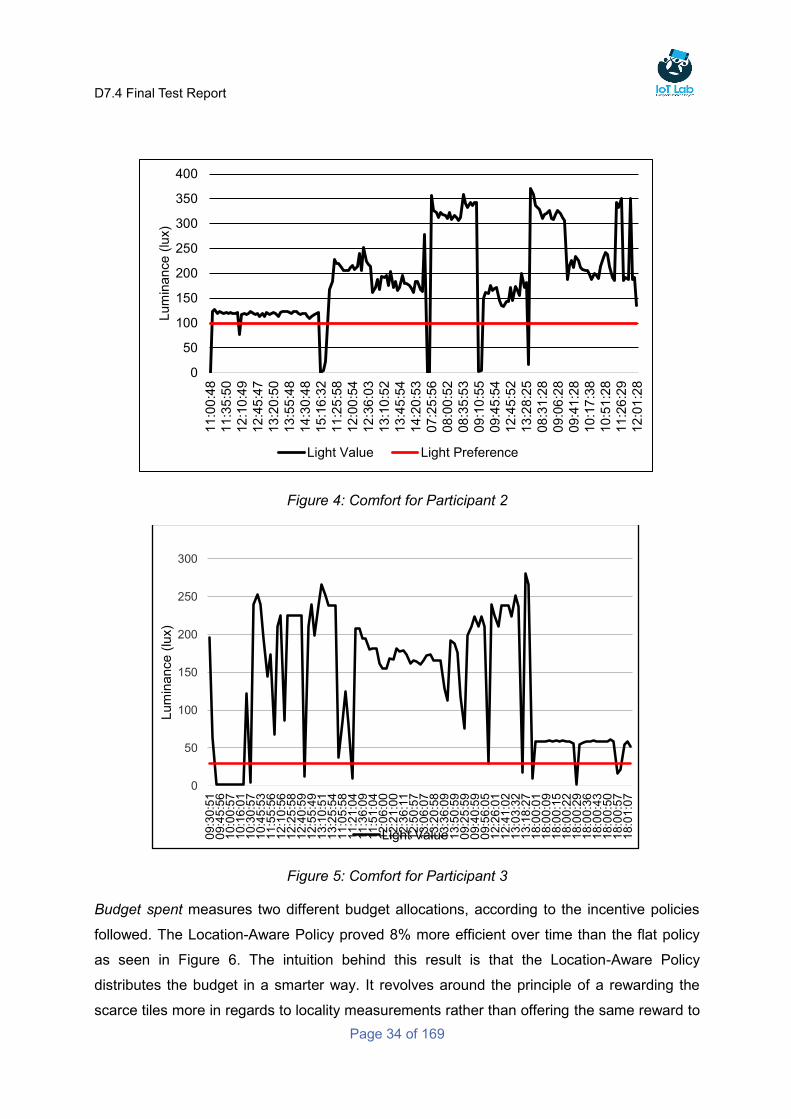
User comfort measures the user satisfaction when being in the premises, in terms of lighting
conditions. It is evaluated by comparing the light readings from the smartphone devices to the
light preference of each participant. Indicatively, we present Figure 5 5, which depict the
readings from three individual participants’ smartphones and their corresponding, diverse
light preferences. Both participants 1 and 2 achieved a high degree of satisfaction since their
light preference was met. The third participants' preference couldn't be met since the
scenario considered adequate lighting paramount. Of note are the periods when the light
readings are zero. They indicate the participants’ nonconformity with the scenario instructions
(e.g. putting the phone in the pocket).
Figure 3: Comfort for Participant 1
0
200
400
600
800
1000
1200
Energ
y consum
ption (
10 w
H)
Automatic Manual
0
50
100
150
200
250
300
350
11:1
0:4
7
11:2
4:1
9
11:3
0:4
8
11:4
2:1
7
11:5
0:5
0
12:0
1:5
0
12:1
2:0
0
09:3
5:4
9
10:0
7:2
5
10:0
7:3
0
10:0
7:3
5
10:1
5:5
2
10:2
5:5
4
10:3
6:0
5
10:5
0:5
1
11:2
1:2
5
11:2
1:3
0
11:2
1:3
5
11:3
3:1
8
12:0
6:4
1
12:0
6:4
6
12:0
6:5
1
12:1
0:4
9
12:2
2:2
3
12:5
3:5
8
12:5
4:0
3
12:5
4:1
1
13:0
8:1
9
13:5
8:5
1
13:5
8:5
6
16:2
0:3
1
Lum
inance (
lux)
Light Value Light Preference
D7.4 Final Test Report
Page 34 of 169
Figure 4: Comfort for Participant 2
Figure 5: Comfort for Participant 3
Budget spent measures two different budget allocations, according to the incentive policies
followed. The Location-Aware Policy proved 8% more efficient over time than the flat policy
as seen in Figure 6. The intuition behind this result is that the Location-Aware Policy
distributes the budget in a smarter way. It revolves around the principle of a rewarding the
scarce tiles more in regards to locality measurements rather than offering the same reward to
0
50
100
150
200
250
300
350
400
11
:00
:48
11
:35
:50
12
:10
:49
12
:45
:47
13
:20
:50
13
:55
:48
14
:30
:48
15
:16
:32
11
:25
:58
12
:00
:54
12
:36
:03
13
:10
:52
13
:45
:54
14
:20
:53
07
:25
:56
08
:00
:52
08
:35
:53
09
:10
:55
09
:45
:54
12
:45
:52
13
:28
:25
08
:31
:28
09
:06
:28
09
:41
:28
10
:17
:38
10
:51
:28
11
:26
:29
12
:01
:28
Lum
inance (
lux)
Light Value Light Preference
0
50
100
150
200
250
300
09:3
0:5
10
9:4
5:5
61
0:0
0:5
71
0:1
6:0
11
0:3
0:5
71
0:4
5:5
31
1:5
5:5
61
2:1
0:5
61
2:2
5:5
81
2:4
0:5
91
2:5
5:4
91
3:1
0:5
11
3:2
5:5
41
1:0
5:5
81
1:2
1:0
41
1:3
6:0
91
1:5
1:0
41
2:0
6:0
01
2:2
1:0
01
2:3
6:1
11
2:5
0:5
71
3:0
6:0
71
3:2
0:5
81
3:3
6:0
91
3:5
0:5
90
9:2
5:5
90
9:4
0:5
90
9:5
6:0
51
2:2
6:0
11
2:4
1:0
21
3:0
3:3
21
3:1
8:2
71
8:0
0:0
11
8:0
0:0
91
8:0
0:1
51
8:0
0:2
21
8:0
0:2
91
8:0
0:3
61
8:0
0:4
31
8:0
0:5
01
8:0
0:5
71
8:0
1:0
7
Lum
inance (
lux)
Light Value

D7.4 Final Test Report
Page 35 of 169
all measurements. For example, if an area is occupied by one participant, the participant will
be rewarded with a budget portion of 1. However, if an area is occupied by 4 participants,
then each one will be offered a budget portion of 0.25, resulting in a lower budget
expenditure.
Figure 6: Budget spent over time
The challenge relates to: (e.g. a certain functionality, a process, or specific aspects such as e.g. privacy)
Different devices that are being represented as same resources, need to be calibrated in different ways (smartphone sensors).
Physical set up of an IoT testbed.
Engagement, briefing and training of end-users.
The opportunity relates to: (e.g. a certain functionality, a process, or specific aspects such as e.g. privacy)
Use case can be applied to larger building. Good scalability.
Opportunities for efficient energy saving and user comfort.
Crowdsensing makes the process more personalized
4.4.4 Future recommendations
Bi-directional communication and online feedback from the users.
0
100
200
300
400
500
600
700
800
Tuesday Wednesday Thursday Friday Saturday Sunday
Budget
poin
ts
Flat Incentive Location Aware Incentive
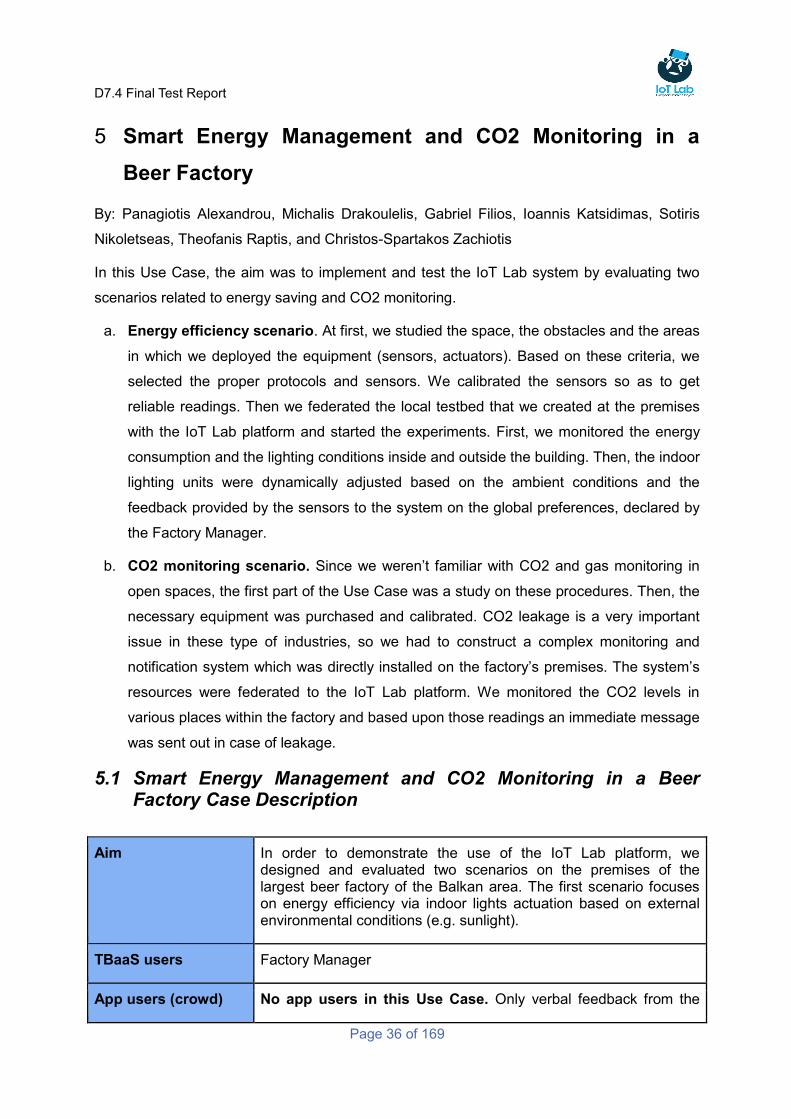
D7.4 Final Test Report
Page 36 of 169
Smart Energy Management and CO2 Monitoring in a 5
Beer Factory
By: Panagiotis Alexandrou, Michalis Drakoulelis, Gabriel Filios, Ioannis Katsidimas, Sotiris
Nikoletseas, Theofanis Raptis, and Christos-Spartakos Zachiotis
In this Use Case, the aim was to implement and test the IoT Lab system by evaluating two
scenarios related to energy saving and CO2 monitoring.
a. Energy efficiency scenario. At first, we studied the space, the obstacles and the areas
in which we deployed the equipment (sensors, actuators). Based on these criteria, we
selected the proper protocols and sensors. We calibrated the sensors so as to get
reliable readings. Then we federated the local testbed that we created at the premises
with the IoT Lab platform and started the experiments. First, we monitored the energy
consumption and the lighting conditions inside and outside the building. Then, the indoor
lighting units were dynamically adjusted based on the ambient conditions and the
feedback provided by the sensors to the system on the global preferences, declared by
the Factory Manager.
b. CO2 monitoring scenario. Since we weren’t familiar with CO2 and gas monitoring in
open spaces, the first part of the Use Case was a study on these procedures. Then, the
necessary equipment was purchased and calibrated. CO2 leakage is a very important
issue in these type of industries, so we had to construct a complex monitoring and
notification system which was directly installed on the factory’s premises. The system’s
resources were federated to the IoT Lab platform. We monitored the CO2 levels in
various places within the factory and based upon those readings an immediate message
was sent out in case of leakage.
5.1 Smart Energy Management and CO2 Monitoring in a Beer Factory Case Description
Aim In order to demonstrate the use of the IoT Lab platform, we designed and evaluated two scenarios on the premises of the largest beer factory of the Balkan area. The first scenario focuses on energy efficiency via indoor lights actuation based on external environmental conditions (e.g. sunlight).
TBaaS users Factory Manager
App users (crowd) No app users in this Use Case. Only verbal feedback from the
D7.4 Final Test Report
Page 37 of 169
employees who were on the premises during the Use Case run.
IoT Resource usage Static sensors, actuators, energy meters, gateways
Recruitment of TbaaS users
Personal contact with the Factory Manager, through the Engineering Team of the factory, based on previous collaborations in the context of other projects.
Recruitment of app users
No app users in this Use Case
Beneficiaries Factory Manager and people working inside the building.
5.2 Envisioned TBaaS process and Requirements
The section below outlines the ideal process as seen from the TBaaS user's perspective and
from that a number of requirements labelled “T1.1” etc. are identified. This will then be used
as input for the actual test.
ID. Process for TBaaS user Identified requirements
T1 Sensors’ and actuators’ reservation
Devices should be available in IoT Lab’s 1.databases.
Devices should be functional. 2. Resources should not be publicly available 3.
(request from the company).
T2 Experiment composition 1. Proficiency of Factory Manager with IoT Lab’s experiment composition mechanism.
2. Capability of the experiment composition module to handle the requested resources.
3. Test the luminance levels that are given by the sensors and set the experimental parameters appropriately.
T3 Implementing the two scenario
1. Sensors should be calibrated. 2. Efficient battery management of the devices.
T4 Managing the data collection
1. Careful interpretation of collected data. 2. Meaningful correlation of data in order to come
up with useful information.
5.3 Test results
This section includes a description of the test results based on the previously identified
requirements, and a documentation of potential workarounds if the initial user requirement
could not be fulfilled. The description also has room for reflection about the user
D7.4 Final Test Report
Page 38 of 169
consequences of potential workarounds and what might have caused the potential problems
with the user requirements.
5.3.1 Results from the TBaaS user process
Case requirement From the previous section (ID no.)
A. Primary Result Was the requirement fulfilled? (YES/NO + comment)
T1.1: Devices should be available in IoT Lab’s databases
YES
T1.2: Devices should be functional YES
T1.3: Resources should not be publicly available (request from the company)
YES.
T2.1: Proficiency of Factory Manager with IoT Lab’s experiment composition mechanism
YES. Together with CTI Engineering Team, the Factory Manager became acquainted with the platform.
T2.2: Capability of the experiment composition module to handle the requested resources
YES
T2.3: Test the luminance levels that are given by the sensors and set the experimental parameters appropriately
YES
T3.1: Sensors should be calibrated YES
T3.2: Efficient battery management of the devices YES
T4.1: Careful interpretation of collected data YES
T4.2: Meaningful correlation of data in order to come up with useful information
YES
5.4 Lessons Learned and Future Recommendations
A scenario for efficient smart energy management
In order to demonstrate the capabilities offered by the IoT Lab platform, we developed a
smart energy management scenario in an industrial environment. In this scenario, the system
tries to optimize the operation of indoor light units in terms of energy efficiency. The light units
are controlled by actuators that serve also as resources in the IoT Lab platform. They are
dynamically adjusted based on the ambient lighting conditions. Two dedicated sensors are
providing input to the system regarding the ambient conditions.
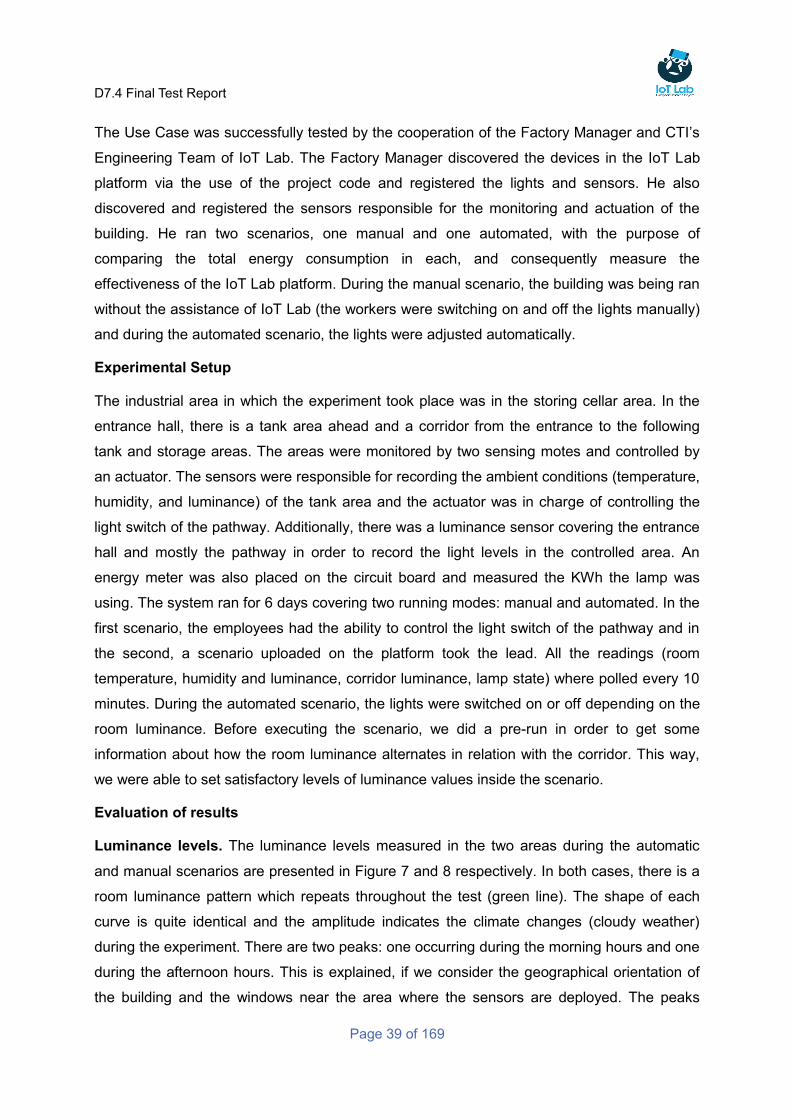
D7.4 Final Test Report
Page 39 of 169
The Use Case was successfully tested by the cooperation of the Factory Manager and CTI’s
Engineering Team of IoT Lab. The Factory Manager discovered the devices in the IoT Lab
platform via the use of the project code and registered the lights and sensors. He also
discovered and registered the sensors responsible for the monitoring and actuation of the
building. He ran two scenarios, one manual and one automated, with the purpose of
comparing the total energy consumption in each, and consequently measure the
effectiveness of the IoT Lab platform. During the manual scenario, the building was being ran
without the assistance of IoT Lab (the workers were switching on and off the lights manually)
and during the automated scenario, the lights were adjusted automatically.
Experimental Setup
The industrial area in which the experiment took place was in the storing cellar area. In the
entrance hall, there is a tank area ahead and a corridor from the entrance to the following
tank and storage areas. The areas were monitored by two sensing motes and controlled by
an actuator. The sensors were responsible for recording the ambient conditions (temperature,
humidity, and luminance) of the tank area and the actuator was in charge of controlling the
light switch of the pathway. Additionally, there was a luminance sensor covering the entrance
hall and mostly the pathway in order to record the light levels in the controlled area. An
energy meter was also placed on the circuit board and measured the KWh the lamp was
using. The system ran for 6 days covering two running modes: manual and automated. In the
first scenario, the employees had the ability to control the light switch of the pathway and in
the second, a scenario uploaded on the platform took the lead. All the readings (room
temperature, humidity and luminance, corridor luminance, lamp state) where polled every 10
minutes. During the automated scenario, the lights were switched on or off depending on the
room luminance. Before executing the scenario, we did a pre-run in order to get some
information about how the room luminance alternates in relation with the corridor. This way,
we were able to set satisfactory levels of luminance values inside the scenario.
Evaluation of results
Luminance levels. The luminance levels measured in the two areas during the automatic
and manual scenarios are presented in Figure 7 and 8 respectively. In both cases, there is a
room luminance pattern which repeats throughout the test (green line). The shape of each
curve is quite identical and the amplitude indicates the climate changes (cloudy weather)
during the experiment. There are two peaks: one occurring during the morning hours and one
during the afternoon hours. This is explained, if we consider the geographical orientation of
the building and the windows near the area where the sensors are deployed. The peaks
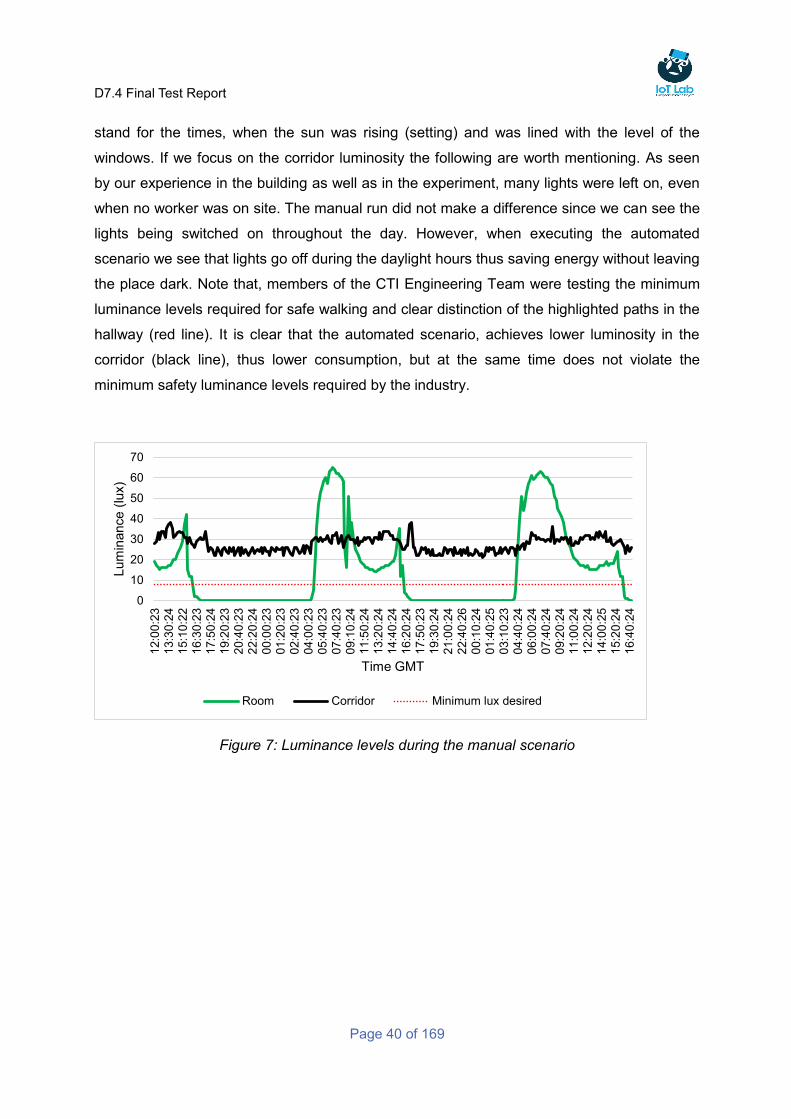
D7.4 Final Test Report
Page 40 of 169
stand for the times, when the sun was rising (setting) and was lined with the level of the
windows. If we focus on the corridor luminosity the following are worth mentioning. As seen
by our experience in the building as well as in the experiment, many lights were left on, even
when no worker was on site. The manual run did not make a difference since we can see the
lights being switched on throughout the day. However, when executing the automated
scenario we see that lights go off during the daylight hours thus saving energy without leaving
the place dark. Note that, members of the CTI Engineering Team were testing the minimum
luminance levels required for safe walking and clear distinction of the highlighted paths in the
hallway (red line). It is clear that the automated scenario, achieves lower luminosity in the
corridor (black line), thus lower consumption, but at the same time does not violate the
minimum safety luminance levels required by the industry.
Figure 7: Luminance levels during the manual scenario
0
10
20
30
40
50
60
70
12:0
0:2
31
3:3
0:2
41
5:1
0:2
21
6:3
0:2
31
7:5
0:2
41
9:2
0:2
32
0:4
0:2
32
2:2
0:2
40
0:0
0:2
30
1:2
0:2
30
2:4
0:2
30
4:0
0:2
30
5:4
0:2
30
7:4
0:2
30
9:1
0:2
41
1:5
0:2
41
3:2
0:2
41
4:4
0:2
41
6:2
0:2
41
7:5
0:2
31
9:3
0:2
42
1:0
0:2
42
2:4
0:2
60
0:1
0:2
40
1:4
0:2
50
3:1
0:2
30
4:4
0:2
40
6:0
0:2
40
7:4
0:2
40
9:2
0:2
41
1:0
0:2
41
2:2
0:2
41
4:0
0:2
51
5:2
0:2
41
6:4
0:2
4
Lum
inance (
lux)
Time GMT
Room Corridor Minimum lux desired
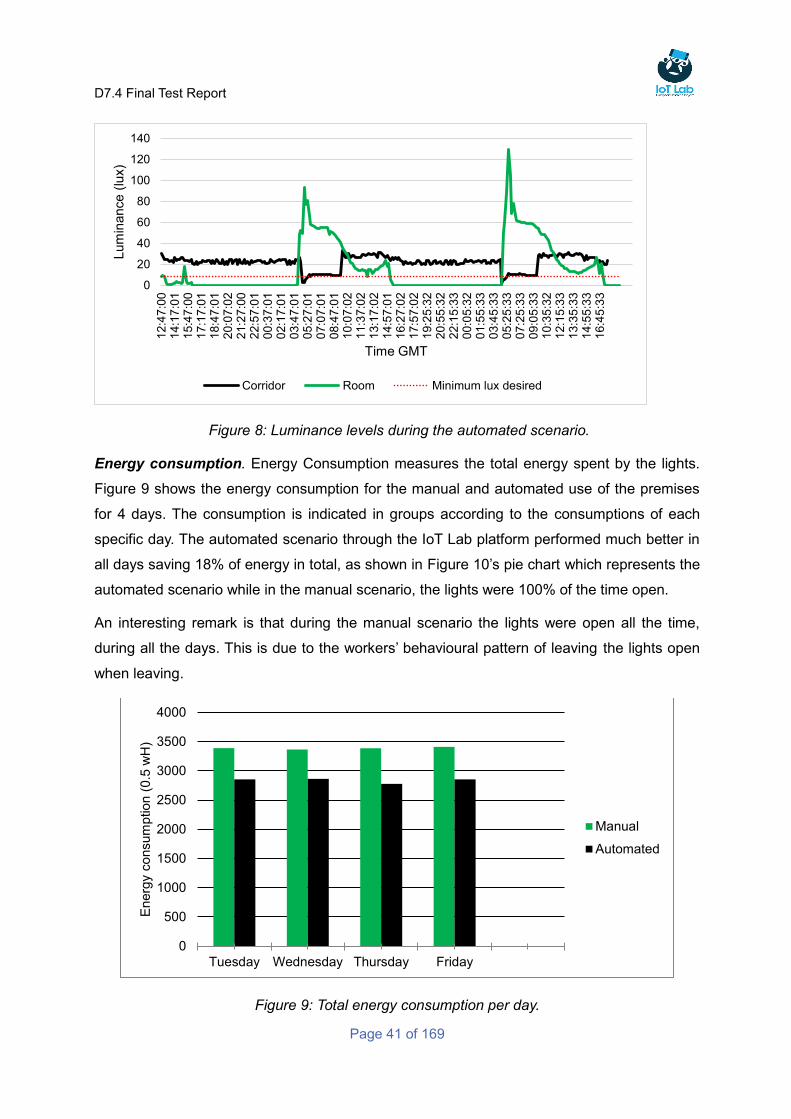
D7.4 Final Test Report
Page 41 of 169
Figure 8: Luminance levels during the automated scenario.
Energy consumption. Energy Consumption measures the total energy spent by the lights.
Figure 9 shows the energy consumption for the manual and automated use of the premises
for 4 days. The consumption is indicated in groups according to the consumptions of each
specific day. The automated scenario through the IoT Lab platform performed much better in
all days saving 18% of energy in total, as shown in Figure 10’s pie chart which represents the
automated scenario while in the manual scenario, the lights were 100% of the time open.
An interesting remark is that during the manual scenario the lights were open all the time,
during all the days. This is due to the workers’ behavioural pattern of leaving the lights open
when leaving.
Figure 9: Total energy consumption per day.
0
20
40
60
80
100
120
140
12:4
7:0
01
4:1
7:0
11
5:4
7:0
01
7:1
7:0
11
8:4
7:0
12
0:0
7:0
22
1:2
7:0
02
2:5
7:0
10
0:3
7:0
10
2:1
7:0
10
3:4
7:0
10
5:2
7:0
10
7:0
7:0
10
8:4
7:0
11
0:0
7:0
21
1:3
7:0
21
3:1
7:0
21
4:5
7:0
11
6:2
7:0
21
7:5
7:0
21
9:2
5:3
22
0:5
5:3
22
2:1
5:3
30
0:0
5:3
20
1:5
5:3
30
3:4
5:3
30
5:2
5:3
30
7:2
5:3
30
9:0
5:3
31
0:3
5:3
21
2:1
5:3
31
3:3
5:3
31
4:5
5:3
31
6:4
5:3
3
Lum
inance (
lux)
Time GMT
Corridor Room Minimum lux desired
0
500
1000
1500
2000
2500
3000
3500
4000
Tuesday Wednesday Thursday Friday
Energ
y consum
ption (
0.5
wH
)
Manual
Automated
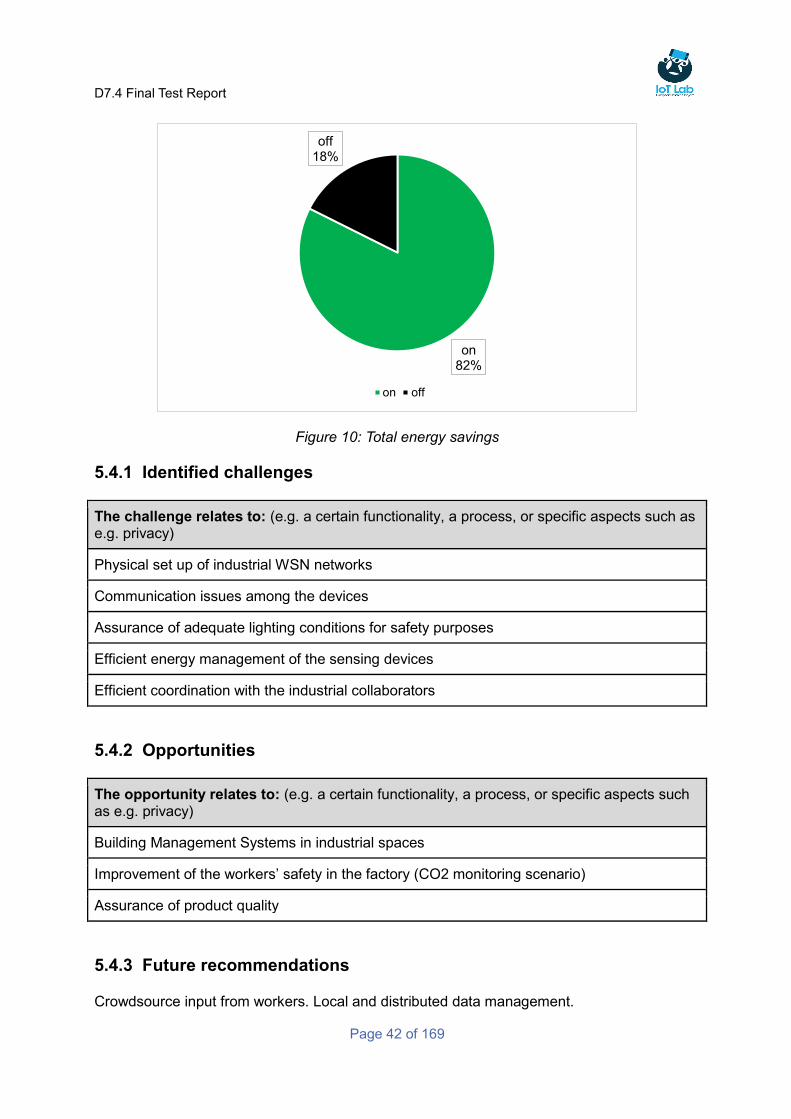
D7.4 Final Test Report
Page 42 of 169
Figure 10: Total energy savings
5.4.1 Identified challenges
The challenge relates to: (e.g. a certain functionality, a process, or specific aspects such as e.g. privacy)
Physical set up of industrial WSN networks
Communication issues among the devices
Assurance of adequate lighting conditions for safety purposes
Efficient energy management of the sensing devices
Efficient coordination with the industrial collaborators
5.4.2 Opportunities
The opportunity relates to: (e.g. a certain functionality, a process, or specific aspects such as e.g. privacy)
Building Management Systems in industrial spaces
Improvement of the workers’ safety in the factory (CO2 monitoring scenario)
Assurance of product quality
5.4.3 Future recommendations
Crowdsource input from workers. Local and distributed data management.
on 82%
off 18%
on off
D7.4 Final Test Report
Page 43 of 169
ekoNET Solutions for Air Pollution in Smart Cities Use 6
Case
By: Zolt Kemeny and Aleksandra Rankov
The test set up process in this Use Case is in 2 stages.
Stage 1 refers to the crowd interaction section of TBaaS: researchers provided the survey
questions for the crowd participants, in which there was an option for the participant to
voluntarily report GPS location at the time of the survey submission. The survey was
implemented by the LimeSurvey.
Stage 2 refers to the IoT interaction section of TBaaS: researchers created an experiment
involving ekoNET sensors for environmental monitoring that were mounted on city buses.
The experiment was setup to collect real time data on atmospheric and pollution
parameters in the city to the platform database. Data was collected in pre-set sampling
intervals.
We had an initial idea on how to set up the entire Use Case, however, we had to balance the
data quantity vs quality by playing with different data sampling rates. In addition, we had to
monitor regularly resources and check if the data was returned in set intervals. Once the
survey was created, several tests were done to ensure all data was being received back to
the database and could be related to the socio-economic profile of the person who sent it.
The smartphone devices used for testing and during the experiment setup were: HTC Desire
526G dual sim, BLU LIFE PLAY and Samsung gt-i8190.
6.1 ekoNET Solutions for Air Pollution in Smart Cities Case Description
Aim This Use Case which is set outdoor in the city of Novi Sad aims to understand the correlation between the geo-localised environmental data in the city. This data is collected by a bus mounted with ekoNET devices and receives geo-localised inputs from the crowd on their perception of the air quality as well as on their happiness level which is all collected through a simple survey. The crowd socio economic profile is also taken into account.
TBaaS users 1-2 researchers (Zolt and Aleksandra) within the IoT technology domain and with processing data skills. One account in TBaaS was used.
App users (crowd) For the test purposes during the preparation phase of the Use Case, there were 2 internal people that helped test the mobile app side of the system and its communication with TBaaS. Mobile phones used where Samsung and HTC.
D7.4 Final Test Report
Page 44 of 169
In the real Use Case, 57 people took part in an experiment. The experiment lasted for 2 weeks and the target was to receive at least 50 responses. People engaged as crowd participants had different socio economic profile and different level of computer and mobile phone users’ skills.
IoT Resource usage Surveys with the crowd and experiments including portable testbeds (IoT resources).
Recruitment of TbaaS users
People working on IoT Lab project were TBaaS users setting up the experiment.
Recruitment of app users
The Use Case was targeting citizens on Novi Sad and it was advertised through various channels:
Social networks (Twitter and Facebook) in both Serbian and English
Websites of DunavNET and IoT Lab
Emails to Serbian partners on other projects
Through MobiWallet project channels
Emails to friends
Emails to colleagues within the company
Personal Facebook accounts (voluntary) Clear description of the Use Case objectives with detailed instructions on how to take part were provided to the people. Anyone interested in taking part in the Use Case installed the mobile app and included the Research Code (more details provided below). This automatically put them in a group that was easily filtered by the researcher using the TBaaS and thus engaged in the Use Case.
Beneficiaries Local administration – to learn about localities within the city mostly affected by pollution and to learn about the people’s perception of pollution and thus take actions to reduce it in the city.
Local people/crowd who can benefit through actions of local administrations to reduce pollution in the city.
Note: In the next experiment run, as part of incentive scheme each completed survey will contribute towards a small donation to a local charity thus making a step forward towards a happier city.
D7.4 Final Test Report
Page 45 of 169
6.2 Envisioned TBaaS Process and Requirements
The section below outlines the ideal process as seen from the TBaaS user's perspective and
from that a number of requirements labelled “T.1.1” etc. are identified. This was then used as
input for the actual test.
ID. Process for TBaaS user Identified requirements
T1 Preparing Data Collection: Reservations and experiment compositions:
1. IoT interaction part: A researcher as a TBaaS user creates the research project including all necessary details about it. He or she then makes the reservation of resources that will be engaged in the experiment (IoT interaction part). Upon completion of resources reservation, the researcher can start with the experiment composition that includes the short description of an experiment and then provisioning of resources that will be engaged (from the list of reserved resources) by setting up the experiment duration, sampling frequency, condition (If This Then That scenario), outcome and action.
1. Crowd interaction part: Researcher first creates the survey within the LimeSurvey tool hosted by IoT Lab web server. The next step is the creation of the participants’ list which is supported with the wizard that enables filtering of users based on different criteria. As mentioned above in the section Recruitment of App users, various communication channels have been used to spread information about the Use Case and gain as large as possible a group of participants. This information also prompted interested crowd participants to include the specific Research Code within their mobile app settings so that they can be easily found and involved in the experiment as anonymous crowd participants. Once the participants’ list is created, the Send Survey wizard is activated and sends the selected survey from LimeSurvey to all participants on the
1. IoT interaction part: To be able to reserve all required resources.
2. IoT interaction part: To be able to setup an experiment with these resources in the test phase using different setting parameters and use this set up for the real experiment.
3. Crowd interaction part: To be able to engage all participants that wish to take part in this experiment through the Research Code based filter.
4. Crowd interaction part: To ensure that survey appears within the app if the Research Code is included.
5. Crowd interaction part: To ensure that during the active time of the experiment, as soon as a new crowd participant joins the research by entering the Research Code, the specific survey appears on his/her list of surveys.
D7.4 Final Test Report
Page 46 of 169
participants’ list. A small group of internal participants then check if notification was received and if the survey appeared on the list of surveys within the app on each of the used mobile phones. They also completed the survey and the researcher checked if all the responses have been received and if the information about the GPS location was also stored within the survey data on Lime Survey.
T2 Activating the project: The researcher designates the research project as public when wishing to have it visible/available on a public site of the Website among other public ongoing researches as well as in the mobile app. Basic information about this research is then available to everyone. The experiment created runs automatically for a pre-set period of time and with a pre-set sampling frequency. With selected type of resources, it is possible to run more than one experiment with different sampling frequency and different time frame. The survey is available on mobile applications of users belonging to the created participants’ list to which the survey was sent. This list is updated every day with new users found via the Research Code to which the survey was resent.
1. To enable setting the research as public (default is private) and have it appearing on both the Website and mobile app.
2. To be able to filter participants based on different criteria including the Research Code.
3. To be able to collect the GPS location through the survey.
T3 Doing and handling the crowd outreach: The researcher created an invitation (initially using an email) that is sent out to colleagues in the company and business partners that have been identified as stakeholders/beneficiaries of such type of Use Case. This information is also used for creating posts on social networks and Websites (especially the local ones and in the Serbian language). The researcher also uses the same Research Code to filter the users who opted to take part in this research which can change over time. It is also possible to send an additional information through notification functionality available on TBaaS to the selected group of people
1. Be able to send out an invitation from outside the TBaaS which links to the project.
2. Be able to add the same information to the project profile in TBaaS as what was sent out in the invitation.
3. Be able to see how many people have joined the project.
4. Be able to communicate with the people that have joined the project.
5. To be able to relate the survey responses to socio-economic profile of participants.
6. To be able to extract the location of the participant at the time of the survey submission and relate it later with other data collected at the same locations.
D7.4 Final Test Report
Page 47 of 169
just by including the Research Code in the filter available.
T4 Managing the Data Collection: IoT interactions: During the experiment execution time, the researcher can monitor data collection and if any problem or lack of data emerges, the researcher can run another experiment which results can be used for
the final analysis. Crowd interactions: During the data collection period, the researcher sees how many participants are active and are filling the surveys and experiments properly. In case of having problems with the data, the researcher can communicate with participants via the notification system or invite new participants.
1. Be able to monitor the data collection and react to any problem that appears.
2. Be able to communicate with the participants.
3. Be able to add new surveys and experiments to the research project during the ongoing test period.
4. Be able to add more people to the tests that can be separated from the earlier invited people.
T5 Performing the Data Analysis: After the data collection period has ended, the researcher engages in the following activities: Views the stats about the data collection to see if enough data was collected (or if more data needs to be collected) and to gain an overview of the project. Downloading the collected data to the computer or to another storage device. This assumes the following: • Extracting IoT data from pordescription
testbeds (cvs). • Extracting the survey responses from
LimeSurvey (containing responses to questions and GPS location data).
• Extracting socio-economic profile of participants sending responses.
• Merging all data, socio-economic profile of participants with their responses collected at specific time and location and ekoNET sensors’ data at those times/locations.
• Doing data analysis in Excel.
1. Be able to view statistics about how many participants concluded the survey and if they provided all answers including the GPS location.
2. Be able to see stats about dropout frequency and other stats.
3. Be able to download selected datasets, which should include all data from each participant (socio-economic profile, survey results) as well as experimental sensor data).
4. Be able to merge all the data and start data analysis in Excel based on an average computer knowledge.
D7.4 Final Test Report
Page 48 of 169
6.3 Envisioned process for the Participant and Requirements (APP)
The description below outlines the ideal process as seen from the app user's perspective and
from that a number of requirements labelled “A1.1” etc. are identified. This will then be used
as input for the actual test.
ID. Process for app user Identified requirements
A1 Being invited and deciding to join: The person receives an invitation, which describes the test, and is contacted via some social networks that the person is a member of or via email. The invitation sounds interesting and since the person fits the described target group, he/she decides to download the app. For this person it is important that any privacy rights are respected since he/she wants to be in control and values his/her integrity.
1. Be able to download the app (and find the research project without problems).
2. Be able to find information about the research project.
3. Be able to control participation in the selected research project by including the project related Research Code in the app settings.
4. Be able to fill in the socio-economic profile and understand why this is important.
5. Be able to switch the GPS location ON before sending the survey in order to provide a better quality survey response.
A2 Participating in the research: After downloading the app, the person reads about required settings and upon receiving the survey can provide the answers at any time during the experiment running. Upon responding to the survey, the person can clearly see in the app that the required participation is complete, but that the project itself is still running and that more assignments might appear. In this concrete Use Case, each participant can respond to the survey more than once and it is valid for this concrete experiment.
1. To be able to fill in the survey received that was sent by the researcher through TBaaS.
2. To be able to switch the GPS location sensor on before sending the survey response.
A3 Afterwards: After the research project is closed, information about the research results can be found.
1. Be able to see the project results following the project completion.
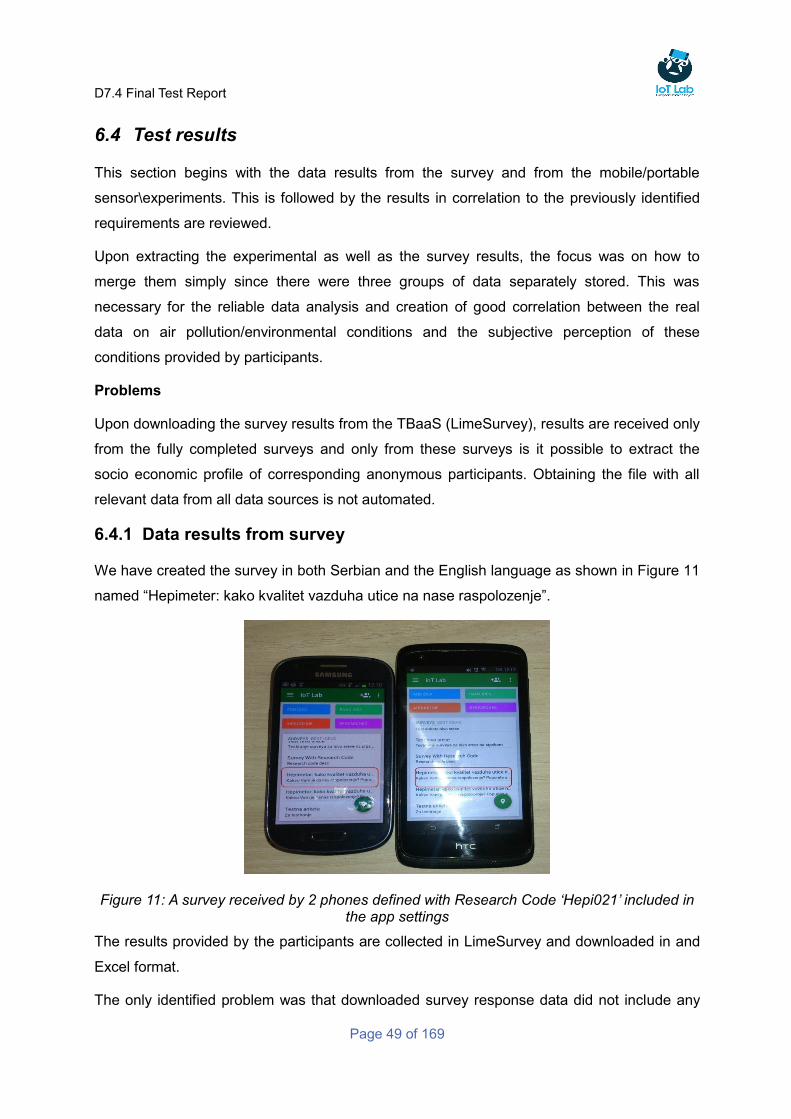
D7.4 Final Test Report
Page 49 of 169
6.4 Test results
This section begins with the data results from the survey and from the mobile/portable
sensor\experiments. This is followed by the results in correlation to the previously identified
requirements are reviewed.
Upon extracting the experimental as well as the survey results, the focus was on how to
merge them simply since there were three groups of data separately stored. This was
necessary for the reliable data analysis and creation of good correlation between the real
data on air pollution/environmental conditions and the subjective perception of these
conditions provided by participants.
Problems
Upon downloading the survey results from the TBaaS (LimeSurvey), results are received only
from the fully completed surveys and only from these surveys is it possible to extract the
socio economic profile of corresponding anonymous participants. Obtaining the file with all
relevant data from all data sources is not automated.
6.4.1 Data results from survey
We have created the survey in both Serbian and the English language as shown in Figure 11
named “Hepimeter: kako kvalitet vazduha utice na nase raspolozenje”.
Figure 11: A survey received by 2 phones defined with Research Code ‘Hepi021’ included in the app settings
The results provided by the participants are collected in LimeSurvey and downloaded in and
Excel format.
The only identified problem was that downloaded survey response data did not include any
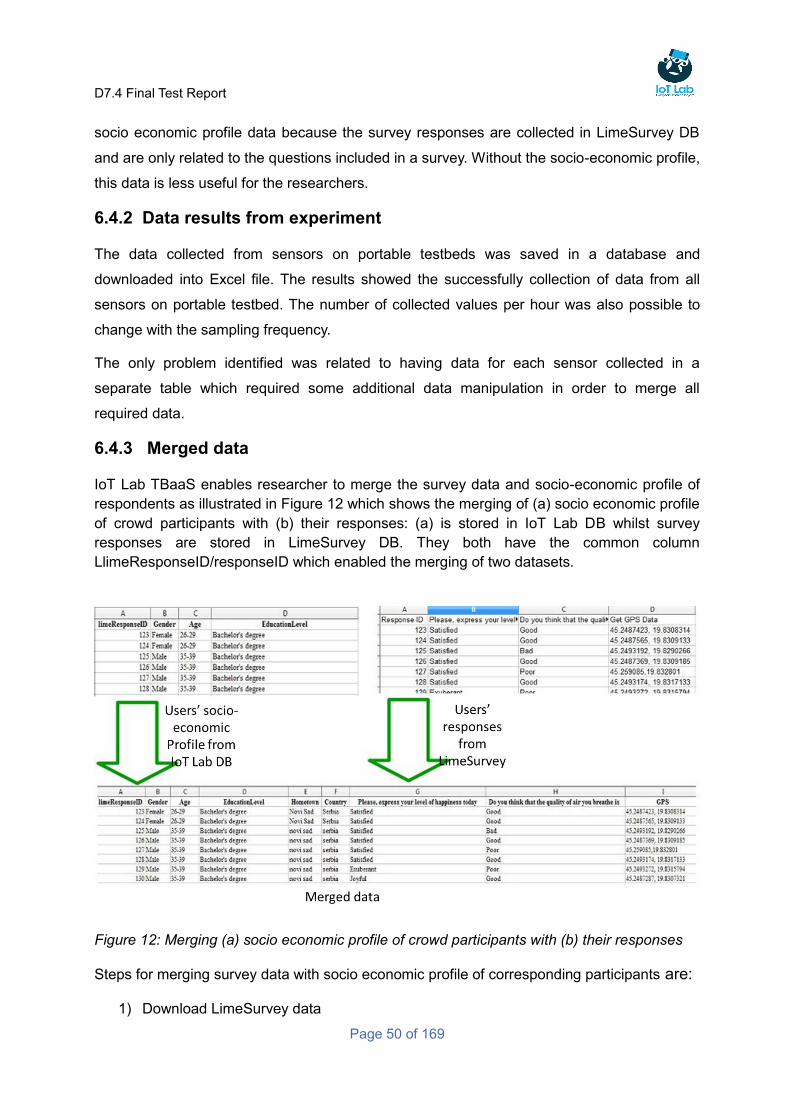
D7.4 Final Test Report
Page 50 of 169
socio economic profile data because the survey responses are collected in LimeSurvey DB
and are only related to the questions included in a survey. Without the socio-economic profile,
this data is less useful for the researchers.
6.4.2 Data results from experiment
The data collected from sensors on portable testbeds was saved in a database and
downloaded into Excel file. The results showed the successfully collection of data from all
sensors on portable testbed. The number of collected values per hour was also possible to
change with the sampling frequency.
The only problem identified was related to having data for each sensor collected in a
separate table which required some additional data manipulation in order to merge all
required data.
6.4.3 Merged data
IoT Lab TBaaS enables researcher to merge the survey data and socio-economic profile of
respondents as illustrated in Figure 12 which shows the merging of (a) socio economic profile
of crowd participants with (b) their responses: (a) is stored in IoT Lab DB whilst survey
responses are stored in LimeSurvey DB. They both have the common column
LlimeResponseID/responseID which enabled the merging of two datasets.
Figure 12: Merging (a) socio economic profile of crowd participants with (b) their responses
Steps for merging survey data with socio economic profile of corresponding participants are:
1) Download LimeSurvey data
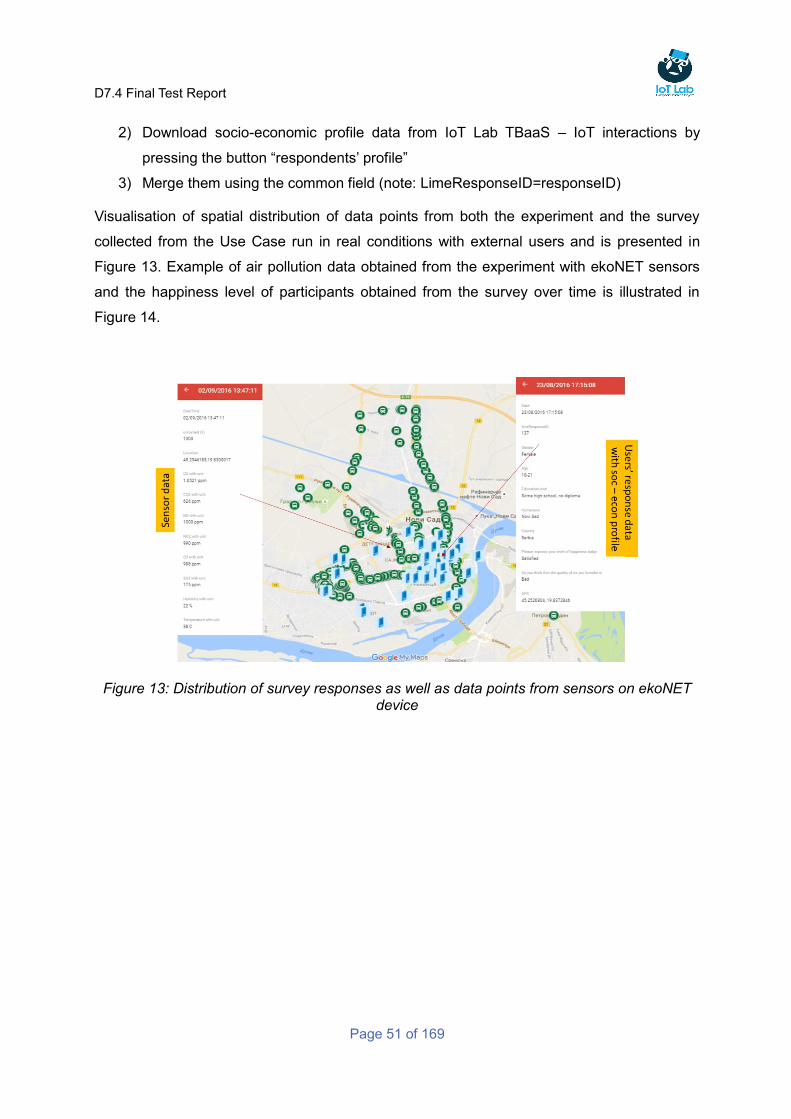
D7.4 Final Test Report
Page 51 of 169
2) Download socio-economic profile data from IoT Lab TBaaS – IoT interactions by
pressing the button “respondents’ profile”
3) Merge them using the common field (note: LimeResponseID=responseID)
Visualisation of spatial distribution of data points from both the experiment and the survey
collected from the Use Case run in real conditions with external users and is presented in
Figure 13. Example of air pollution data obtained from the experiment with ekoNET sensors
and the happiness level of participants obtained from the survey over time is illustrated in
Figure 14.
Figure 13: Distribution of survey responses as well as data points from sensors on ekoNET device
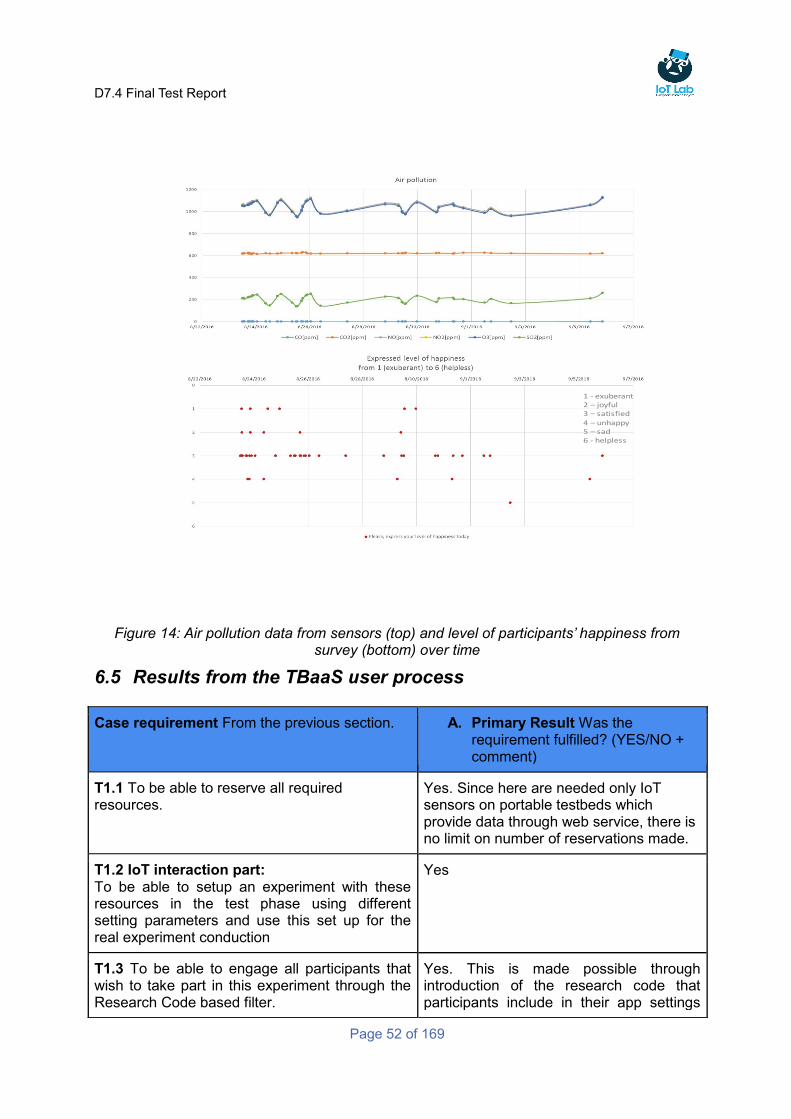
D7.4 Final Test Report
Page 52 of 169
Figure 14: Air pollution data from sensors (top) and level of participants’ happiness from survey (bottom) over time
6.5 Results from the TBaaS user process
Case requirement From the previous section. A. Primary Result Was the requirement fulfilled? (YES/NO + comment)
T1.1 To be able to reserve all required resources.
Yes. Since here are needed only IoT sensors on portable testbeds which provide data through web service, there is no limit on number of reservations made.
T1.2 IoT interaction part: To be able to setup an experiment with these resources in the test phase using different setting parameters and use this set up for the real experiment conduction
Yes
T1.3 To be able to engage all participants that wish to take part in this experiment through the Research Code based filter.
Yes. This is made possible through introduction of the research code that participants include in their app settings
1 - exuberant2 – joyful3 – satisfied4 – unhappy5 – sad6 - helpless
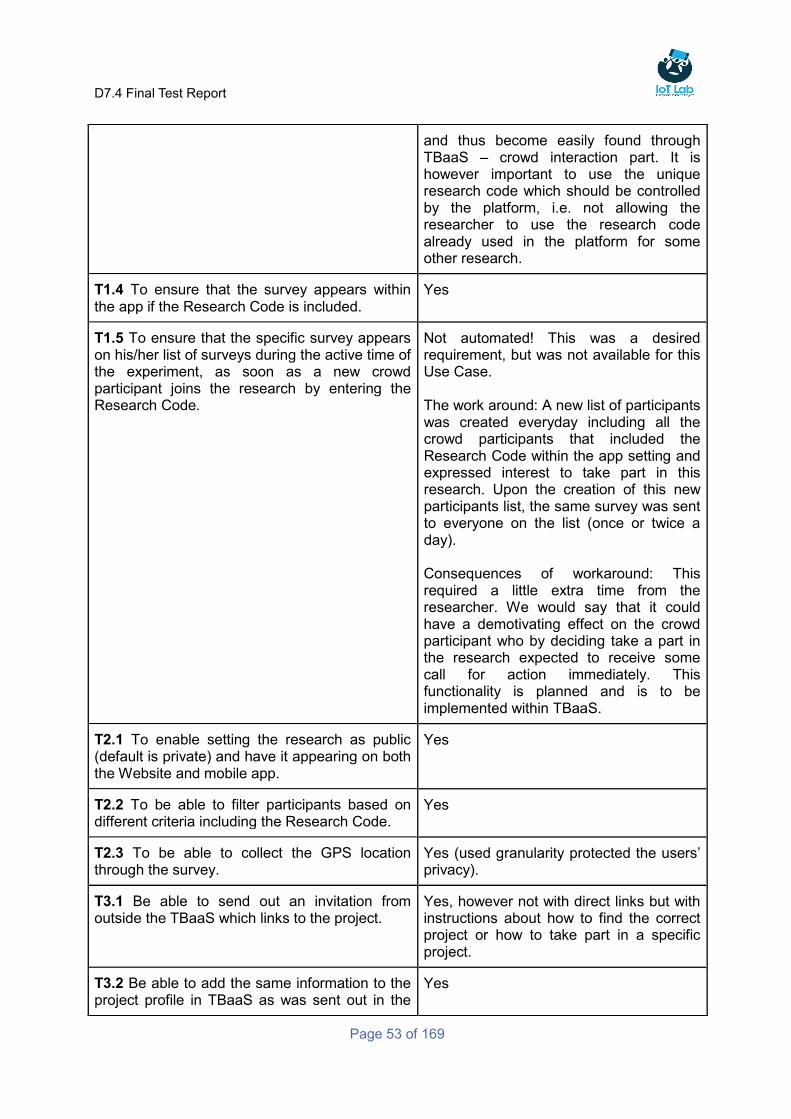
D7.4 Final Test Report
Page 53 of 169
and thus become easily found through TBaaS – crowd interaction part. It is however important to use the unique research code which should be controlled by the platform, i.e. not allowing the researcher to use the research code already used in the platform for some other research.
T1.4 To ensure that the survey appears within the app if the Research Code is included.
Yes
T1.5 To ensure that the specific survey appears on his/her list of surveys during the active time of the experiment, as soon as a new crowd participant joins the research by entering the Research Code.
Not automated! This was a desired requirement, but was not available for this Use Case. The work around: A new list of participants was created everyday including all the crowd participants that included the Research Code within the app setting and expressed interest to take part in this research. Upon the creation of this new participants list, the same survey was sent to everyone on the list (once or twice a day). Consequences of workaround: This required a little extra time from the researcher. We would say that it could have a demotivating effect on the crowd participant who by deciding take a part in the research expected to receive some call for action immediately. This functionality is planned and is to be implemented within TBaaS.
T2.1 To enable setting the research as public (default is private) and have it appearing on both the Website and mobile app.
Yes
T2.2 To be able to filter participants based on different criteria including the Research Code.
Yes
T2.3 To be able to collect the GPS location through the survey.
Yes (used granularity protected the users’ privacy).
T3.1 Be able to send out an invitation from outside the TBaaS which links to the project.
Yes, however not with direct links but with instructions about how to find the correct project or how to take part in a specific project.
T3.2 Be able to add the same information to the project profile in TBaaS as was sent out in the
Yes
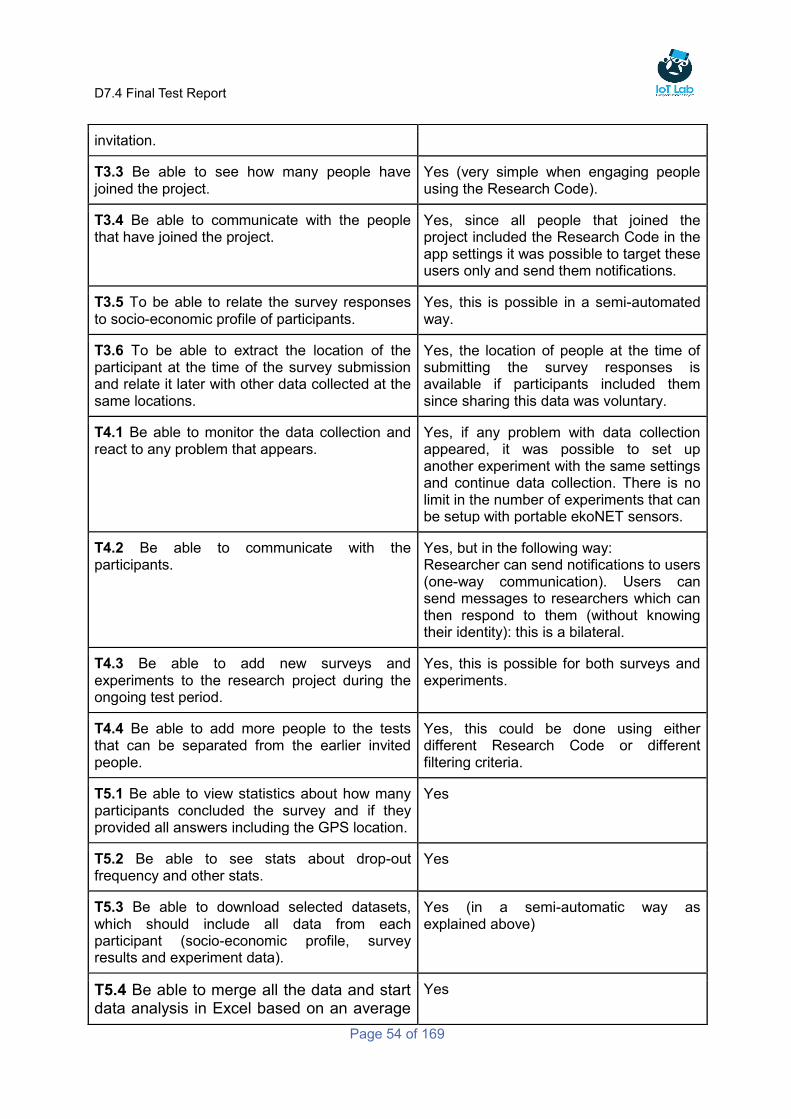
D7.4 Final Test Report
Page 54 of 169
invitation.
T3.3 Be able to see how many people have joined the project.
Yes (very simple when engaging people using the Research Code).
T3.4 Be able to communicate with the people that have joined the project.
Yes, since all people that joined the project included the Research Code in the app settings it was possible to target these users only and send them notifications.
T3.5 To be able to relate the survey responses to socio-economic profile of participants.
Yes, this is possible in a semi-automated way.
T3.6 To be able to extract the location of the participant at the time of the survey submission and relate it later with other data collected at the same locations.
Yes, the location of people at the time of submitting the survey responses is available if participants included them since sharing this data was voluntary.
T4.1 Be able to monitor the data collection and react to any problem that appears.
Yes, if any problem with data collection appeared, it was possible to set up another experiment with the same settings and continue data collection. There is no limit in the number of experiments that can be setup with portable ekoNET sensors.
T4.2 Be able to communicate with the participants.
Yes, but in the following way: Researcher can send notifications to users (one-way communication). Users can send messages to researchers which can then respond to them (without knowing their identity): this is a bilateral.
T4.3 Be able to add new surveys and experiments to the research project during the ongoing test period.
Yes, this is possible for both surveys and experiments.
T4.4 Be able to add more people to the tests that can be separated from the earlier invited people.
Yes, this could be done using either different Research Code or different filtering criteria.
T5.1 Be able to view statistics about how many participants concluded the survey and if they provided all answers including the GPS location.
Yes
T5.2 Be able to see stats about drop-out frequency and other stats.
Yes
T5.3 Be able to download selected datasets, which should include all data from each participant (socio-economic profile, survey results and experiment data).
Yes (in a semi-automatic way as explained above)
T5.4 Be able to merge all the data and start data analysis in Excel based on an average
Yes
D7.4 Final Test Report
Page 55 of 169
computer knowledge.
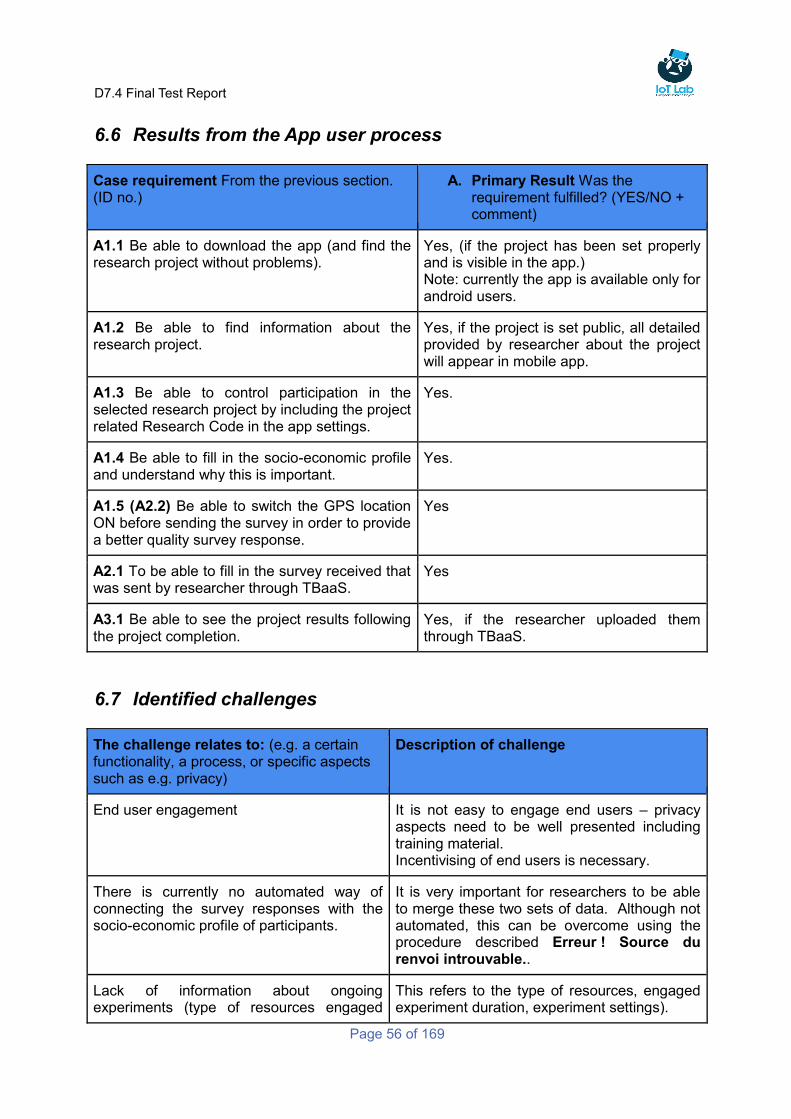
D7.4 Final Test Report
Page 56 of 169
6.6 Results from the App user process
Case requirement From the previous section. (ID no.)
A. Primary Result Was the requirement fulfilled? (YES/NO + comment)
A1.1 Be able to download the app (and find the research project without problems).
Yes, (if the project has been set properly and is visible in the app.) Note: currently the app is available only for android users.
A1.2 Be able to find information about the research project.
Yes, if the project is set public, all detailed provided by researcher about the project will appear in mobile app.
A1.3 Be able to control participation in the selected research project by including the project related Research Code in the app settings.
Yes.
A1.4 Be able to fill in the socio-economic profile and understand why this is important.
Yes.
A1.5 (A2.2) Be able to switch the GPS location ON before sending the survey in order to provide a better quality survey response.
Yes
A2.1 To be able to fill in the survey received that was sent by researcher through TBaaS.
Yes
A3.1 Be able to see the project results following the project completion.
Yes, if the researcher uploaded them through TBaaS.
6.7 Identified challenges
The challenge relates to: (e.g. a certain functionality, a process, or specific aspects such as e.g. privacy)
Description of challenge
End user engagement It is not easy to engage end users – privacy aspects need to be well presented including training material. Incentivising of end users is necessary.
There is currently no automated way of connecting the survey responses with the socio-economic profile of participants.
It is very important for researchers to be able to merge these two sets of data. Although not automated, this can be overcome using the procedure described Erreur ! Source du renvoi introuvable..
Lack of information about ongoing experiments (type of resources engaged
This refers to the type of resources, engaged experiment duration, experiment settings).
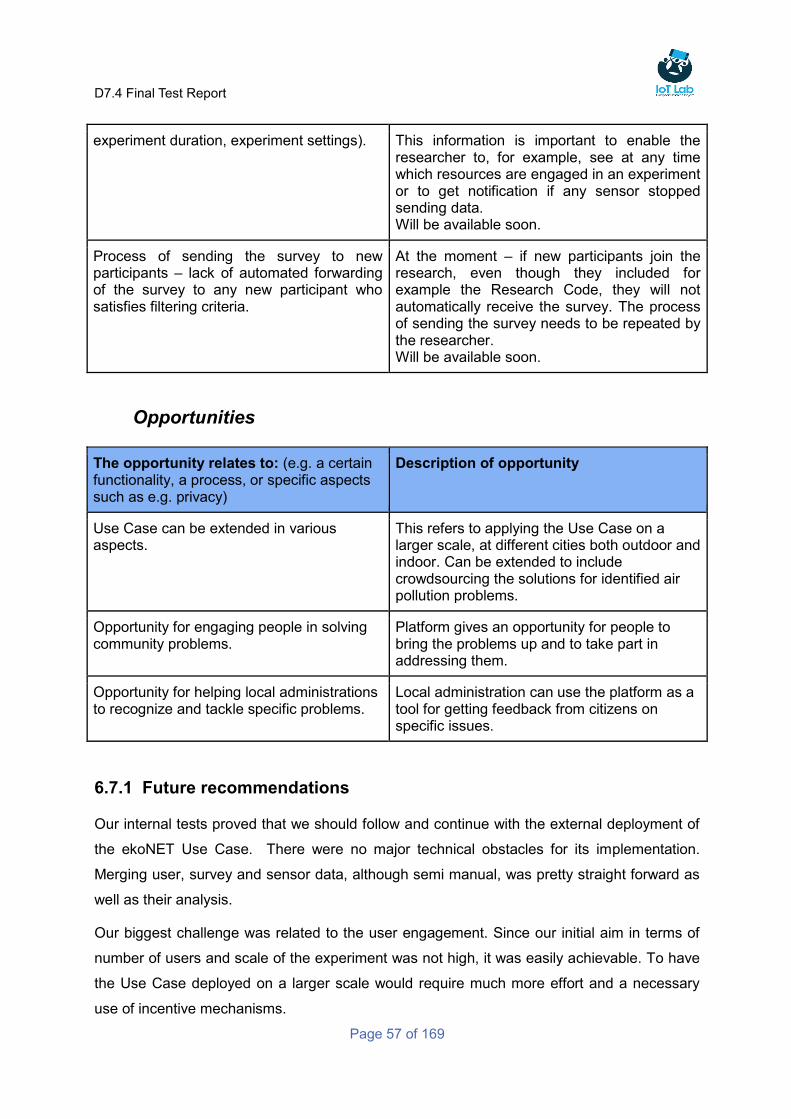
D7.4 Final Test Report
Page 57 of 169
experiment duration, experiment settings). This information is important to enable the researcher to, for example, see at any time which resources are engaged in an experiment or to get notification if any sensor stopped sending data. Will be available soon.
Process of sending the survey to new participants – lack of automated forwarding of the survey to any new participant who satisfies filtering criteria.
At the moment – if new participants join the research, even though they included for example the Research Code, they will not automatically receive the survey. The process of sending the survey needs to be repeated by the researcher. Will be available soon.
Opportunities
The opportunity relates to: (e.g. a certain functionality, a process, or specific aspects such as e.g. privacy)
Description of opportunity
Use Case can be extended in various aspects.
This refers to applying the Use Case on a larger scale, at different cities both outdoor and indoor. Can be extended to include crowdsourcing the solutions for identified air pollution problems.
Opportunity for engaging people in solving community problems.
Platform gives an opportunity for people to bring the problems up and to take part in addressing them.
Opportunity for helping local administrations to recognize and tackle specific problems.
Local administration can use the platform as a tool for getting feedback from citizens on specific issues.
6.7.1 Future recommendations
Our internal tests proved that we should follow and continue with the external deployment of
the ekoNET Use Case. There were no major technical obstacles for its implementation.
Merging user, survey and sensor data, although semi manual, was pretty straight forward as
well as their analysis.
Our biggest challenge was related to the user engagement. Since our initial aim in terms of
number of users and scale of the experiment was not high, it was easily achievable. To have
the Use Case deployed on a larger scale would require much more effort and a necessary
use of incentive mechanisms.
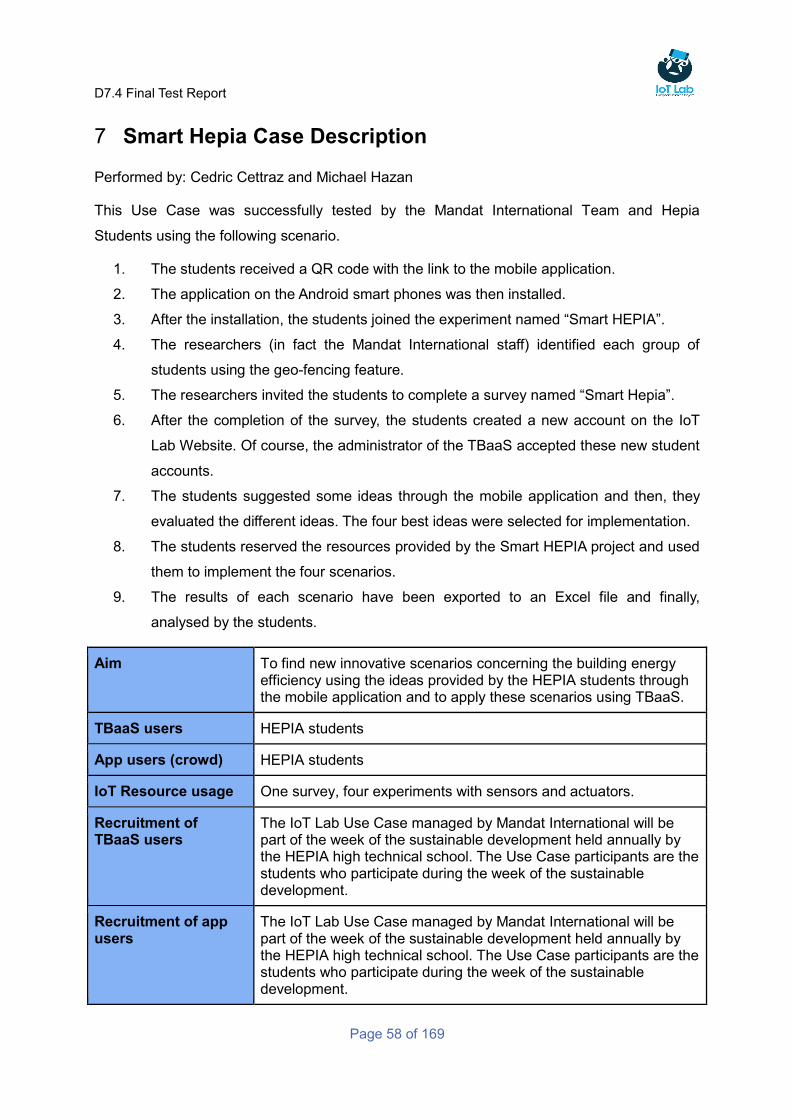
D7.4 Final Test Report
Page 58 of 169
Smart Hepia Case Description 7
Performed by: Cedric Cettraz and Michael Hazan
This Use Case was successfully tested by the Mandat International Team and Hepia
Students using the following scenario.
1. The students received a QR code with the link to the mobile application.
2. The application on the Android smart phones was then installed.
3. After the installation, the students joined the experiment named “Smart HEPIA”.
4. The researchers (in fact the Mandat International staff) identified each group of
students using the geo-fencing feature.
5. The researchers invited the students to complete a survey named “Smart Hepia”.
6. After the completion of the survey, the students created a new account on the IoT
Lab Website. Of course, the administrator of the TBaaS accepted these new student
accounts.
7. The students suggested some ideas through the mobile application and then, they
evaluated the different ideas. The four best ideas were selected for implementation.
8. The students reserved the resources provided by the Smart HEPIA project and used
them to implement the four scenarios.
9. The results of each scenario have been exported to an Excel file and finally,
analysed by the students.
Aim To find new innovative scenarios concerning the building energy efficiency using the ideas provided by the HEPIA students through the mobile application and to apply these scenarios using TBaaS.
TBaaS users HEPIA students
App users (crowd) HEPIA students
IoT Resource usage One survey, four experiments with sensors and actuators.
Recruitment of TBaaS users
The IoT Lab Use Case managed by Mandat International will be part of the week of the sustainable development held annually by the HEPIA high technical school. The Use Case participants are the students who participate during the week of the sustainable development.
Recruitment of app users
The IoT Lab Use Case managed by Mandat International will be part of the week of the sustainable development held annually by the HEPIA high technical school. The Use Case participants are the students who participate during the week of the sustainable development.
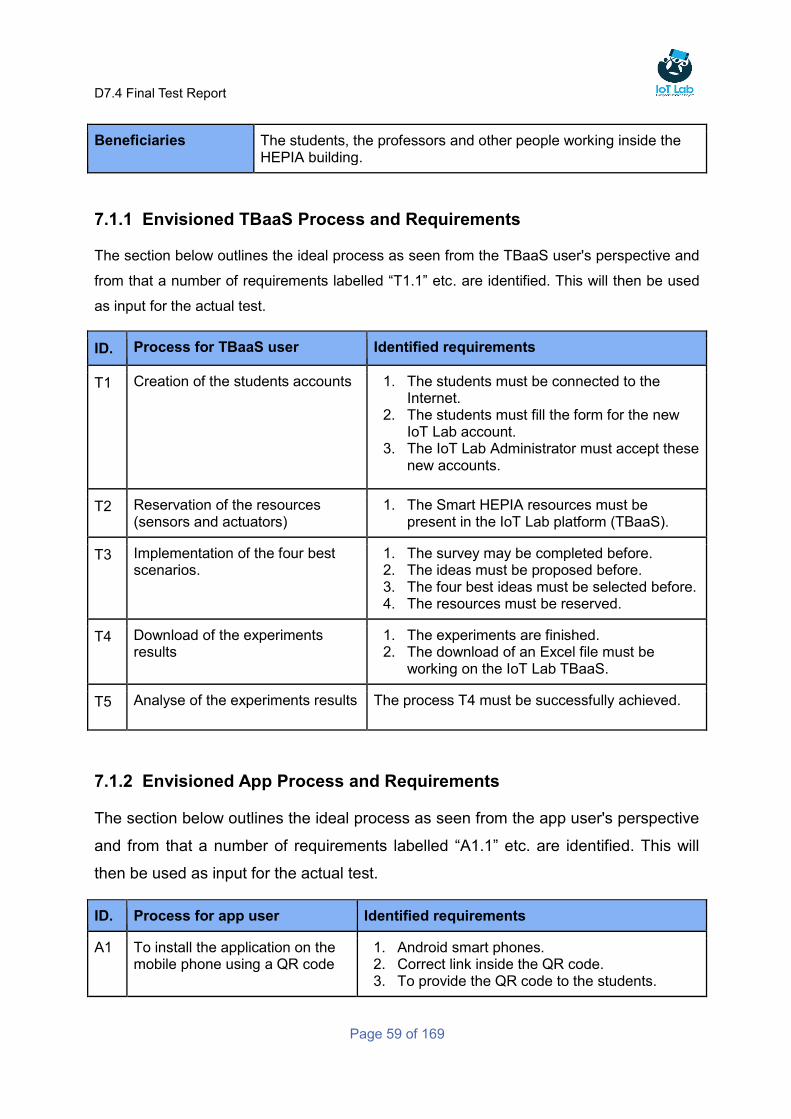
D7.4 Final Test Report
Page 59 of 169
Beneficiaries The students, the professors and other people working inside the HEPIA building.
7.1.1 Envisioned TBaaS Process and Requirements
The section below outlines the ideal process as seen from the TBaaS user's perspective and
from that a number of requirements labelled “T1.1” etc. are identified. This will then be used
as input for the actual test.
ID. Process for TBaaS user Identified requirements
T1 Creation of the students accounts 1. The students must be connected to the Internet.
2. The students must fill the form for the new IoT Lab account.
3. The IoT Lab Administrator must accept these new accounts.
T2 Reservation of the resources (sensors and actuators)
1. The Smart HEPIA resources must be present in the IoT Lab platform (TBaaS).
T3 Implementation of the four best scenarios.
1. The survey may be completed before. 2. The ideas must be proposed before. 3. The four best ideas must be selected before. 4. The resources must be reserved.
T4 Download of the experiments results
1. The experiments are finished. 2. The download of an Excel file must be
working on the IoT Lab TBaaS.
T5 Analyse of the experiments results The process T4 must be successfully achieved.
7.1.2 Envisioned App Process and Requirements
The section below outlines the ideal process as seen from the app user's perspective
and from that a number of requirements labelled “A1.1” etc. are identified. This will
then be used as input for the actual test.
ID. Process for app user Identified requirements
A1 To install the application on the mobile phone using a QR code
1. Android smart phones. 2. Correct link inside the QR code. 3. To provide the QR code to the students.

D7.4 Final Test Report
Page 60 of 169
A2 To join the “Smart HEPIA” experiment
1. The process A1 must be successfully achieved.
2. The “Smart HEPIA” experiment must be already created.
A3 Identification of the groups of students using the geo-fencing feature
1. The students’ smartphones must be connected to the Internet.
2. The IoT Lab mobile application should be running.
3. The localisation must be activated on each smartphone through the Android settings.
4. The localisation must be activated on the IoT Lab mobile application.
5. The geo-fencing feature must be working.
A4 Invitation for the “Smart Hepia” survey
1. The survey must be already created. 2. A list of the users (the students in fact) must
be created. 3. The survey must be pushed to the students.
A5 Ideas suggestions and best ideas selection
1. Process A1 achieved successfully. 2. Ideas submission feature working. 3. Ideas ranking feature working.
A6 Completion of the survey by the students
1. The process A4 must be successfully achieved.
7.2 Test results
This section includes a description of the test results based on the previously identified
requirements, as well as a documentation of potential workarounds if the initial user
requirement could not be fulfilled. The description also has room for reflection about the user
consequences of potential workarounds and what might have caused the potential problems
with the user requirements.
7.2.1 Results from the TBaaS user process
Case requirement
From the previous section. (Id. no.)
A. Primary Result
Was the requirement fulfilled? (YES/NO + comment)
B. Possible workaround
Could the function be solved in another way?) YES/NO + comment
C. Consequences of workaround
How did this affect the researcher? (Comment)
D. Reflection/Comment
What might have caused the problem? (Comment)
T1.1 YES. But it depends on the students and of the network administrators.
To check the Internet connection with HEPIA network administrators.
T1.2 YES.
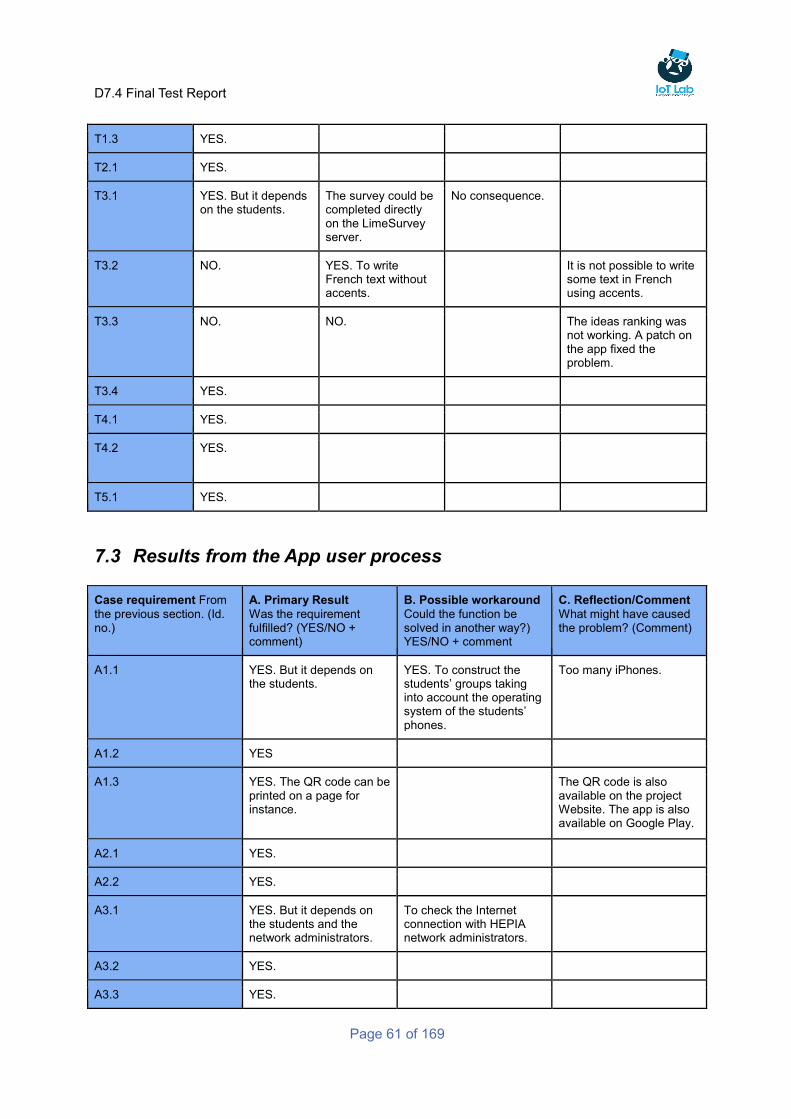
D7.4 Final Test Report
Page 61 of 169
T1.3 YES.
T2.1 YES.
T3.1 YES. But it depends on the students.
The survey could be completed directly on the LimeSurvey server.
No consequence.
T3.2 NO. YES. To write French text without accents.
It is not possible to write some text in French using accents.
T3.3 NO. NO. The ideas ranking was not working. A patch on the app fixed the problem.
T3.4 YES.
T4.1 YES.
T4.2 YES.
T5.1 YES.
7.3 Results from the App user process
Case requirement From
the previous section. (Id. no.)
A. Primary Result
Was the requirement fulfilled? (YES/NO + comment)
B. Possible workaround
Could the function be solved in another way?) YES/NO + comment
C. Reflection/Comment
What might have caused the problem? (Comment)
A1.1 YES. But it depends on the students.
YES. To construct the students’ groups taking into account the operating system of the students’ phones.
Too many iPhones.
A1.2 YES
A1.3 YES. The QR code can be printed on a page for instance.
The QR code is also available on the project Website. The app is also available on Google Play.
A2.1 YES.
A2.2 YES.
A3.1 YES. But it depends on the students and the network administrators.
To check the Internet connection with HEPIA network administrators.
A3.2 YES.
A3.3 YES.

D7.4 Final Test Report
Page 62 of 169
A3.4 YES.
A3.5 YES.
A4.1 YES.
A4.2 YES. The list of students must be done on the fly.
A4.3 YES.
A5.1 YES.
A5.2 NO. YES. To write French text without accents.
It is not possible to write some text in French using accents.
A5.3 NO. NO. The ideas ranking was not working. A patch on the app fixed the problem.
7.3.1 Lessons learned and Future Recommendations
This section describes the lessons learned from the Use Case and the future
recommendations for a successful IoT Lab implementation.
The challenge relates to: (e.g. a certain functionality, a process, or specific aspects such as e.g. privacy)
Description of challenge
Geo-fencing
Cancellation of an experimentation How to cancel a running experimentation which was not well configured?
Cancellation of a resource reservation How to cancel a resource reservation with bad end time?
The opportunity relates to: (e.g. a certain functionality, a process, or specific aspects such as e.g. privacy)
Description of opportunity
Application of scenarios concerning the energy efficiency in an old large building.
Depending on the scenarios, new ideas could emerge to reduce the consumption inside the HEPIA building.
7.3.2 Future recommendations
To continue to improve the IoT Lab platform, in particular the mobile application and TBaaS.
D7.4 Final Test Report
Page 63 of 169
A useful recommendation is to improve the Administrator part of the Website to permit a
testbed owner to cancel undesired resource reservations and experiments made by the
researchers.
The experiment results page should be improved to show both the measurements and what
actions were taken (for example, if the luminance is not enough in a room, the blinds are
opened) if the conditions are met. In this case, the results contain the value of the luminance
and the new state of the blinds. For the mobile application, the French support should be
improved to include the accents.
For the Exit button to leave the app, the effect should be to completely stop the app, and not
let it run in the background. To improve the dissemination of the mobile application, the
application should be written for other operating systems (Apple IOS, etc.).
The students have given feedbacks about the IoT Lab TBaaS and the mobile application. The
TBaaS doesn’t provide enough functionalities compared to the students’ complex scenarios.
For the students, the current version of the TBaaS has too much limitations for their
advanced scenarios. The TBaaS GUI is not actually sufficient in term of user friendliness
because the practical explanations for the users are missing; the students think that a
description of each step of the experiment composition should be added on the TBaaS.
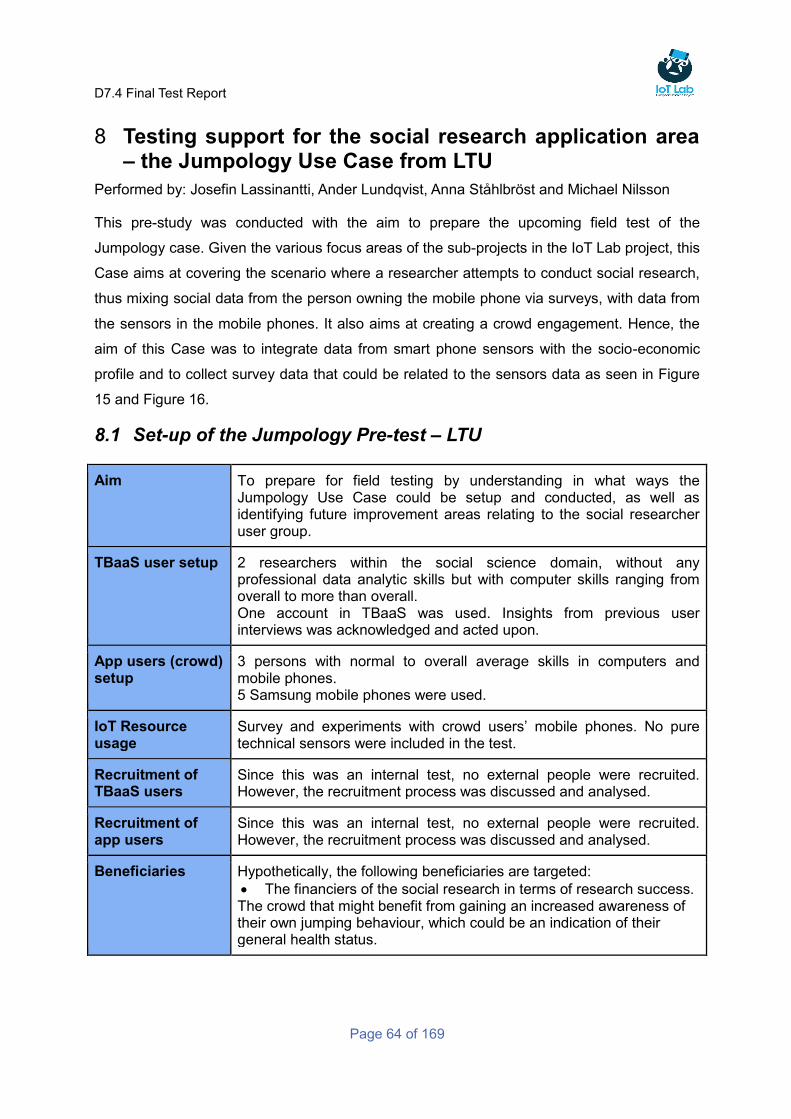
D7.4 Final Test Report
Page 64 of 169
Testing support for the social research application area 8– the Jumpology Use Case from LTU
Performed by: Josefin Lassinantti, Ander Lundqvist, Anna Ståhlbröst and Michael Nilsson
This pre-study was conducted with the aim to prepare the upcoming field test of the
Jumpology case. Given the various focus areas of the sub-projects in the IoT Lab project, this
Case aims at covering the scenario where a researcher attempts to conduct social research,
thus mixing social data from the person owning the mobile phone via surveys, with data from
the sensors in the mobile phones. It also aims at creating a crowd engagement. Hence, the
aim of this Case was to integrate data from smart phone sensors with the socio-economic
profile and to collect survey data that could be related to the sensors data as seen in Figure
15 and Figure 16.
8.1 Set-up of the Jumpology Pre-test – LTU
Aim To prepare for field testing by understanding in what ways the Jumpology Use Case could be setup and conducted, as well as identifying future improvement areas relating to the social researcher user group.
TBaaS user setup 2 researchers within the social science domain, without any professional data analytic skills but with computer skills ranging from overall to more than overall. One account in TBaaS was used. Insights from previous user interviews was acknowledged and acted upon.
App users (crowd) setup
3 persons with normal to overall average skills in computers and mobile phones. 5 Samsung mobile phones were used.
IoT Resource usage
Survey and experiments with crowd users’ mobile phones. No pure technical sensors were included in the test.
Recruitment of TBaaS users
Since this was an internal test, no external people were recruited. However, the recruitment process was discussed and analysed.
Recruitment of app users
Since this was an internal test, no external people were recruited. However, the recruitment process was discussed and analysed.
Beneficiaries Hypothetically, the following beneficiaries are targeted:
The financiers of the social research in terms of research success. The crowd that might benefit from gaining an increased awareness of their own jumping behaviour, which could be an indication of their general health status.
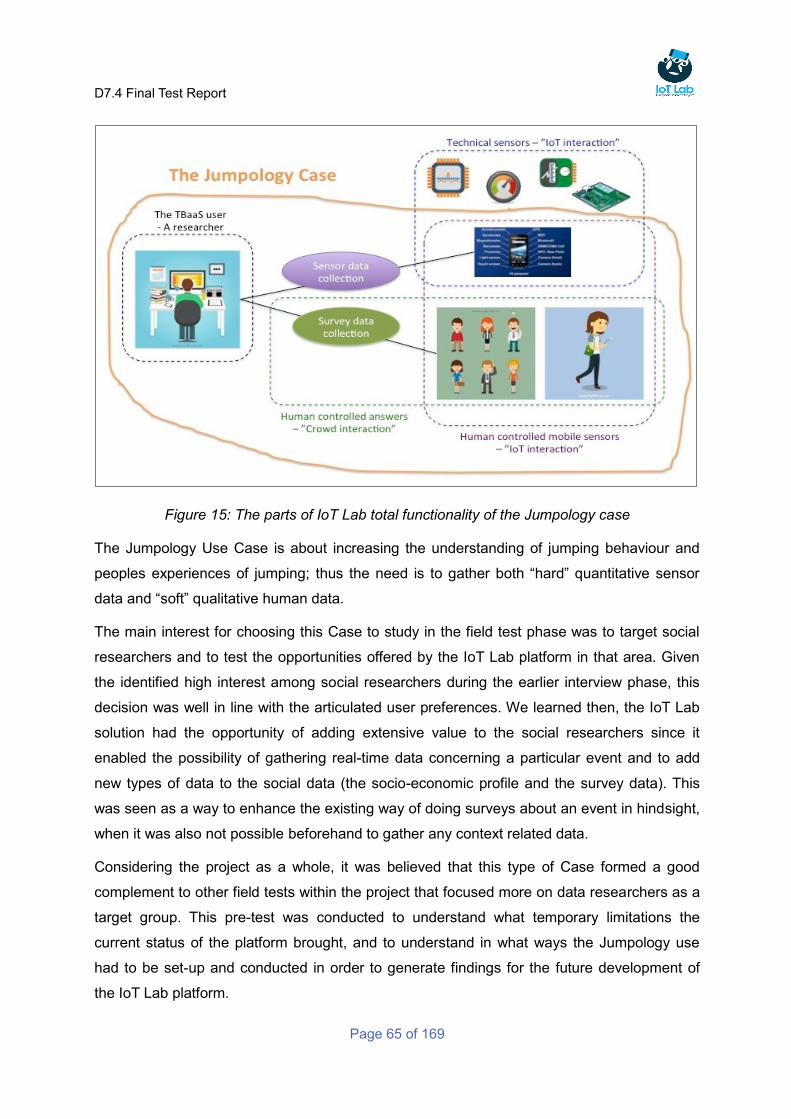
D7.4 Final Test Report
Page 65 of 169
Figure 15: The parts of IoT Lab total functionality of the Jumpology case
The Jumpology Use Case is about increasing the understanding of jumping behaviour and
peoples experiences of jumping; thus the need is to gather both “hard” quantitative sensor
data and “soft” qualitative human data.
The main interest for choosing this Case to study in the field test phase was to target social
researchers and to test the opportunities offered by the IoT Lab platform in that area. Given
the identified high interest among social researchers during the earlier interview phase, this
decision was well in line with the articulated user preferences. We learned then, the IoT Lab
solution had the opportunity of adding extensive value to the social researchers since it
enabled the possibility of gathering real-time data concerning a particular event and to add
new types of data to the social data (the socio-economic profile and the survey data). This
was seen as a way to enhance the existing way of doing surveys about an event in hindsight,
when it was also not possible beforehand to gather any context related data.
Considering the project as a whole, it was believed that this type of Case formed a good
complement to other field tests within the project that focused more on data researchers as a
target group. This pre-test was conducted to understand what temporary limitations the
current status of the platform brought, and to understand in what ways the Jumpology use
had to be set-up and conducted in order to generate findings for the future development of
the IoT Lab platform.
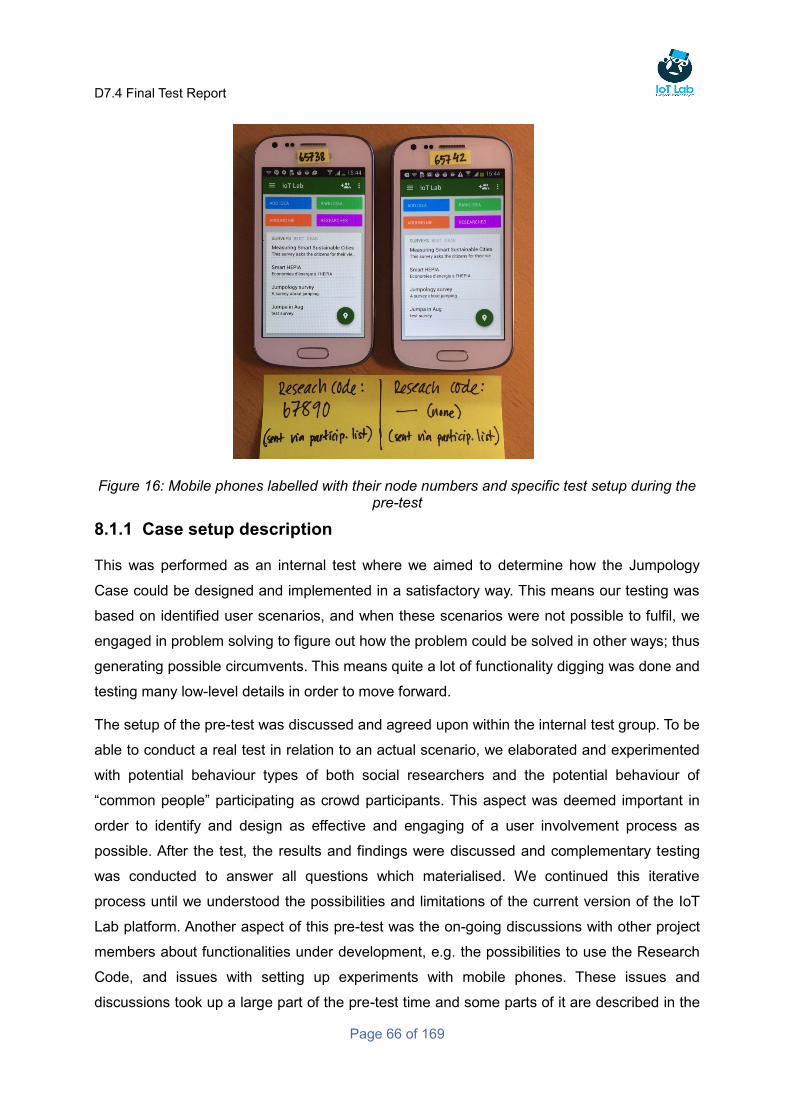
D7.4 Final Test Report
Page 66 of 169
Figure 16: Mobile phones labelled with their node numbers and specific test setup during the pre-test
8.1.1 Case setup description
This was performed as an internal test where we aimed to determine how the Jumpology
Case could be designed and implemented in a satisfactory way. This means our testing was
based on identified user scenarios, and when these scenarios were not possible to fulfil, we
engaged in problem solving to figure out how the problem could be solved in other ways; thus
generating possible circumvents. This means quite a lot of functionality digging was done and
testing many low-level details in order to move forward.
The setup of the pre-test was discussed and agreed upon within the internal test group. To be
able to conduct a real test in relation to an actual scenario, we elaborated and experimented
with potential behaviour types of both social researchers and the potential behaviour of
“common people” participating as crowd participants. This aspect was deemed important in
order to identify and design as effective and engaging of a user involvement process as
possible. After the test, the results and findings were discussed and complementary testing
was conducted to answer all questions which materialised. We continued this iterative
process until we understood the possibilities and limitations of the current version of the IoT
Lab platform. Another aspect of this pre-test was the on-going discussions with other project
members about functionalities under development, e.g. the possibilities to use the Research
Code, and issues with setting up experiments with mobile phones. These issues and
discussions took up a large part of the pre-test time and some parts of it are described in the
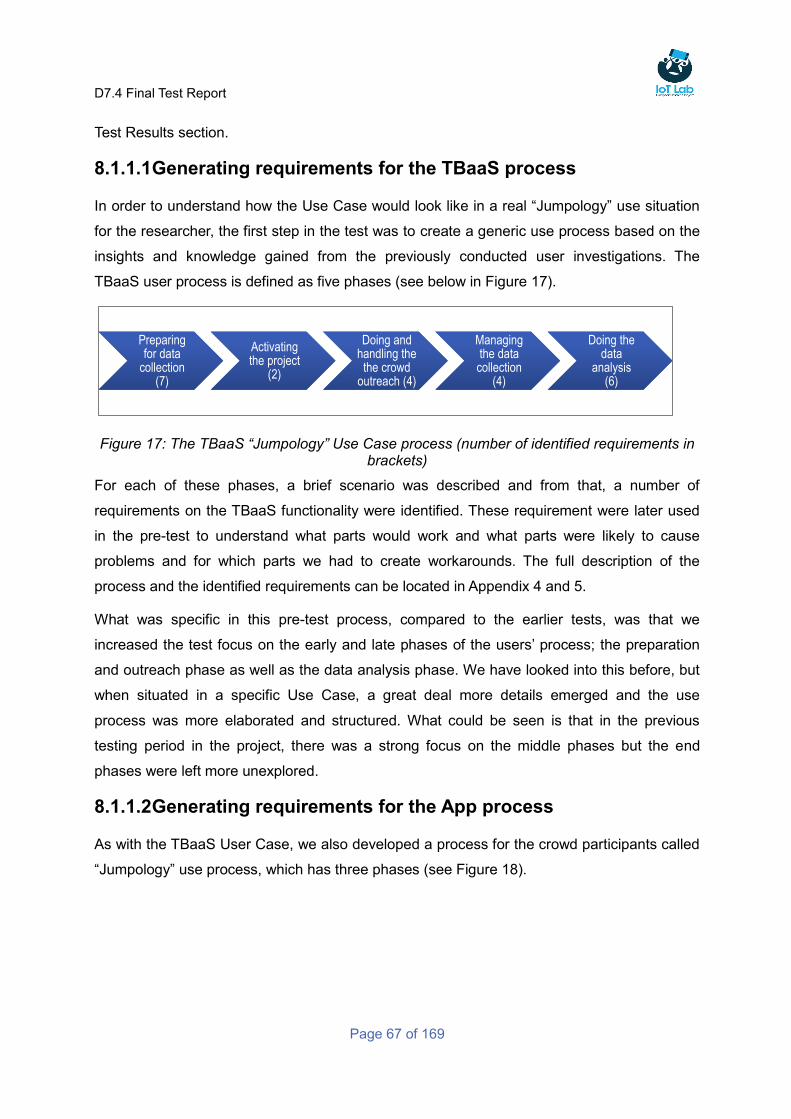
D7.4 Final Test Report
Page 67 of 169
Test Results section.
8.1.1.1 Generating requirements for the TBaaS process
In order to understand how the Use Case would look like in a real “Jumpology” use situation
for the researcher, the first step in the test was to create a generic use process based on the
insights and knowledge gained from the previously conducted user investigations. The
TBaaS user process is defined as five phases (see below in Figure 17).
Figure 17: The TBaaS “Jumpology” Use Case process (number of identified requirements in brackets)
For each of these phases, a brief scenario was described and from that, a number of
requirements on the TBaaS functionality were identified. These requirement were later used
in the pre-test to understand what parts would work and what parts were likely to cause
problems and for which parts we had to create workarounds. The full description of the
process and the identified requirements can be located in Appendix 4 and 5.
What was specific in this pre-test process, compared to the earlier tests, was that we
increased the test focus on the early and late phases of the users’ process; the preparation
and outreach phase as well as the data analysis phase. We have looked into this before, but
when situated in a specific Use Case, a great deal more details emerged and the use
process was more elaborated and structured. What could be seen is that in the previous
testing period in the project, there was a strong focus on the middle phases but the end
phases were left more unexplored.
8.1.1.2 Generating requirements for the App process
As with the TBaaS User Case, we also developed a process for the crowd participants called
“Jumpology” use process, which has three phases (see Figure 18).
Preparing for data
collection (7)
Preparing for data
collection (7)
Activating the project
(2)
Activating the project
(2)
Doing and handling the
the crowd outreach (4)
Doing and handling the
the crowd outreach (4)
Managing the data
collection (4)
Managing the data
collection (4)
Doing the data
analysis (6)
Doing the data
analysis (6)
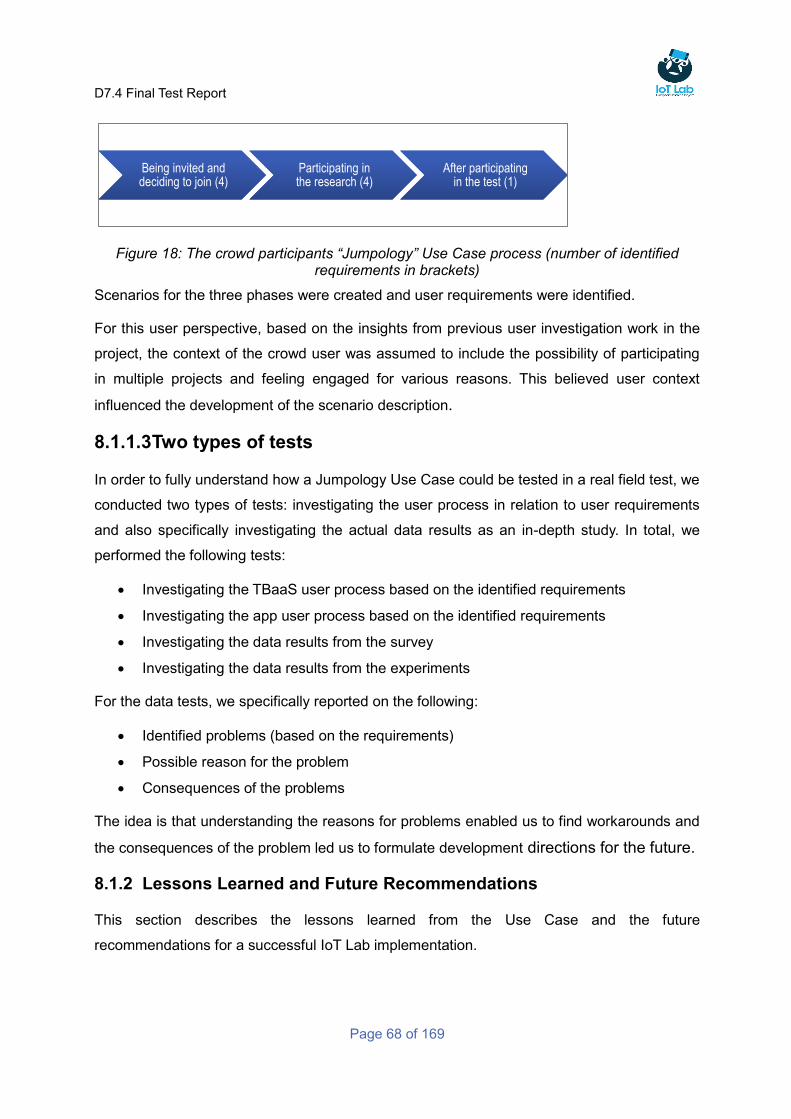
D7.4 Final Test Report
Page 68 of 169
Figure 18: The crowd participants “Jumpology” Use Case process (number of identified requirements in brackets)
Scenarios for the three phases were created and user requirements were identified.
For this user perspective, based on the insights from previous user investigation work in the
project, the context of the crowd user was assumed to include the possibility of participating
in multiple projects and feeling engaged for various reasons. This believed user context
influenced the development of the scenario description.
8.1.1.3 Two types of tests
In order to fully understand how a Jumpology Use Case could be tested in a real field test, we
conducted two types of tests: investigating the user process in relation to user requirements
and also specifically investigating the actual data results as an in-depth study. In total, we
performed the following tests:
Investigating the TBaaS user process based on the identified requirements
Investigating the app user process based on the identified requirements
Investigating the data results from the survey
Investigating the data results from the experiments
For the data tests, we specifically reported on the following:
Identified problems (based on the requirements)
Possible reason for the problem
Consequences of the problems
The idea is that understanding the reasons for problems enabled us to find workarounds and
the consequences of the problem led us to formulate development directions for the future.
8.1.2 Lessons Learned and Future Recommendations
This section describes the lessons learned from the Use Case and the future
recommendations for a successful IoT Lab implementation.
Being invited and deciding to join (4) Being invited and deciding to join (4)
Participating in the research (4) Participating in the research (4)
After participating in the test (1)
After participating in the test (1)
D7.4 Final Test Report
Page 69 of 169
8.1.2.1 Input to performing the Jumpology Use Case field test
Our internal test reveal that it is possible to conduct a larger scale Jumpology case, however,
there are a number of workarounds that needs to be done which are listed below. In
particular, the engagement of non-registered users proved to be challenging as well the later
data analysis.
The functionality “Research Code” needs to be used in order to reach non-registered
users. This also means that we will be sidestepping the research project support in
the app, i.e., the users will not need to join a project in the app.
The outreach process has to be intertwined with the crowd users participating
process. That is, the researcher has to send out the invitation first with a statement
that they need to download the app and fill in their socio-economic profile and make
sure the sensors are shared, at a certain point in time. After that, the researcher can
identify the crowd users’ mobiles phones and launch the experiment, which enables
the crowd participant to do the jumping. However, we see that there is a risk that the
user will not follow the instructions and starts the jumping immediately, which will
render “lost data”. Also, long instructions tend to be perceived as a high threshold and
thus can negatively affect the will to join the experiment.
Data analysis will be limited and probably require technical skills and administrator
access. Data analysis will not be possible to conduct satisfactory since the socio-
economic profile cannot be correlated to either the survey data or the data from the
mobile phones.
System capacity cannot handle high speed jumping data. Even though the
experiments were set on collecting data every second (which is almost a low
frequency when it comes to jumping), in practice that meant collecting data about
every two seconds.
Tentative communication with the crowd participants. Since it is not possible to
receive any messages from the crowd participants but only be able to send messages
to them, any communication needs to be done through the Facebook outreach
channel.
Other challenges are the researchers’ possibilities of monitoring and controlling the process,
as well as practical challenges with doing the data analysis. These matters were discussed
and fed into the actual implementation of the Jumpology field-testing, as well as into the more
general report on identified future challenges and opportunities for the IoT Lab platform.
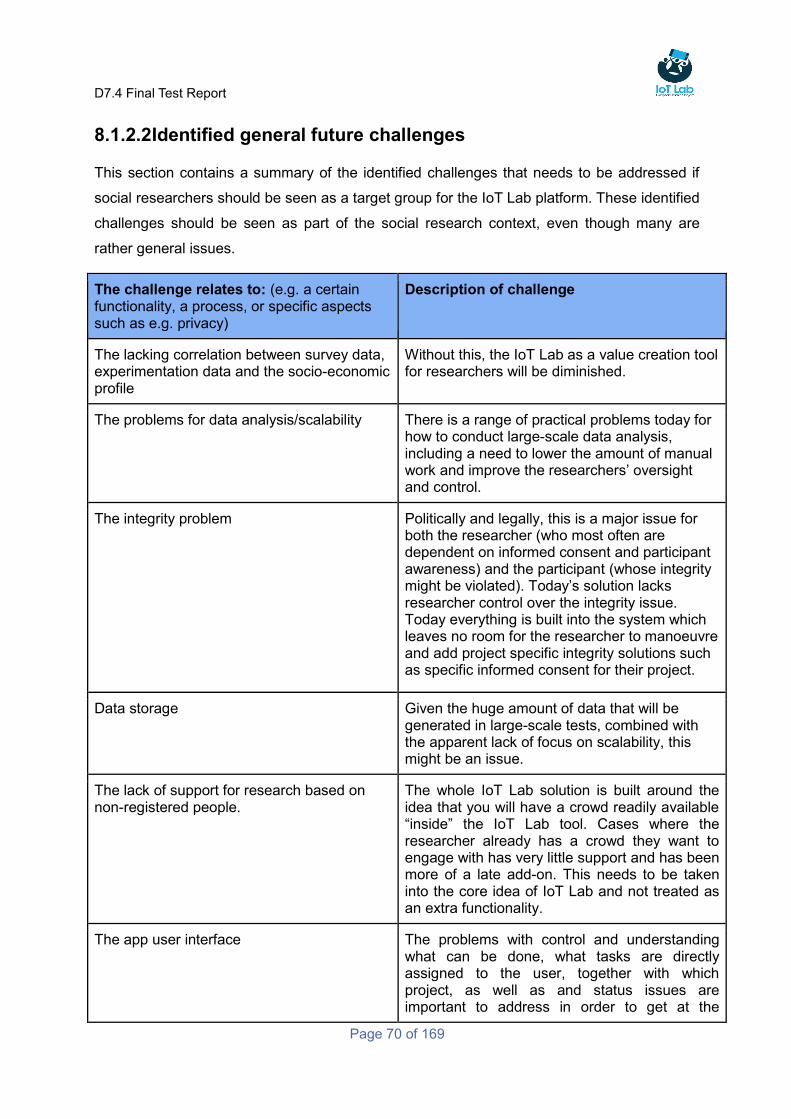
D7.4 Final Test Report
Page 70 of 169
8.1.2.2 Identified general future challenges
This section contains a summary of the identified challenges that needs to be addressed if
social researchers should be seen as a target group for the IoT Lab platform. These identified
challenges should be seen as part of the social research context, even though many are
rather general issues.
The challenge relates to: (e.g. a certain functionality, a process, or specific aspects such as e.g. privacy)
Description of challenge
The lacking correlation between survey data, experimentation data and the socio-economic profile
Without this, the IoT Lab as a value creation tool for researchers will be diminished.
The problems for data analysis/scalability There is a range of practical problems today for how to conduct large-scale data analysis, including a need to lower the amount of manual work and improve the researchers’ oversight and control.
The integrity problem Politically and legally, this is a major issue for both the researcher (who most often are dependent on informed consent and participant awareness) and the participant (whose integrity might be violated). Today’s solution lacks researcher control over the integrity issue. Today everything is built into the system which leaves no room for the researcher to manoeuvre and add project specific integrity solutions such as specific informed consent for their project.
Data storage Given the huge amount of data that will be generated in large-scale tests, combined with the apparent lack of focus on scalability, this might be an issue.
The lack of support for research based on non-registered people.
The whole IoT Lab solution is built around the idea that you will have a crowd readily available “inside” the IoT Lab tool. Cases where the researcher already has a crowd they want to engage with has very little support and has been more of a late add-on. This needs to be taken into the core idea of IoT Lab and not treated as an extra functionality.
The app user interface The problems with control and understanding what can be done, what tasks are directly assigned to the user, together with which project, as well as and status issues are important to address in order to get at the
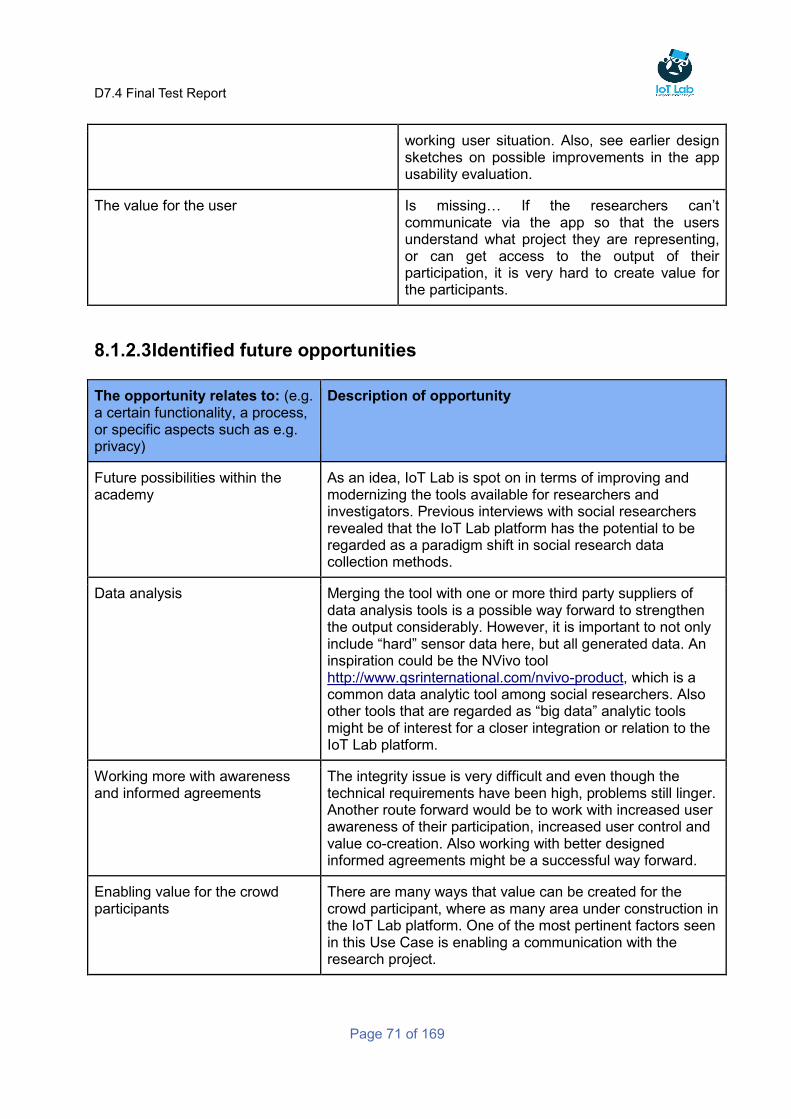
D7.4 Final Test Report
Page 71 of 169
working user situation. Also, see earlier design sketches on possible improvements in the app usability evaluation.
The value for the user Is missing… If the researchers can’t communicate via the app so that the users understand what project they are representing, or can get access to the output of their participation, it is very hard to create value for the participants.
8.1.2.3 Identified future opportunities
The opportunity relates to: (e.g. a certain functionality, a process, or specific aspects such as e.g. privacy)
Description of opportunity
Future possibilities within the academy
As an idea, IoT Lab is spot on in terms of improving and modernizing the tools available for researchers and investigators. Previous interviews with social researchers revealed that the IoT Lab platform has the potential to be regarded as a paradigm shift in social research data collection methods.
Data analysis Merging the tool with one or more third party suppliers of data analysis tools is a possible way forward to strengthen the output considerably. However, it is important to not only include “hard” sensor data here, but all generated data. An inspiration could be the NVivo tool http://www.qsrinternational.com/nvivo-product, which is a common data analytic tool among social researchers. Also other tools that are regarded as “big data” analytic tools might be of interest for a closer integration or relation to the IoT Lab platform.
Working more with awareness and informed agreements
The integrity issue is very difficult and even though the technical requirements have been high, problems still linger. Another route forward would be to work with increased user awareness of their participation, increased user control and value co-creation. Also working with better designed informed agreements might be a successful way forward.
Enabling value for the crowd participants
There are many ways that value can be created for the crowd participant, where as many area under construction in the IoT Lab platform. One of the most pertinent factors seen in this Use Case is enabling a communication with the research project.
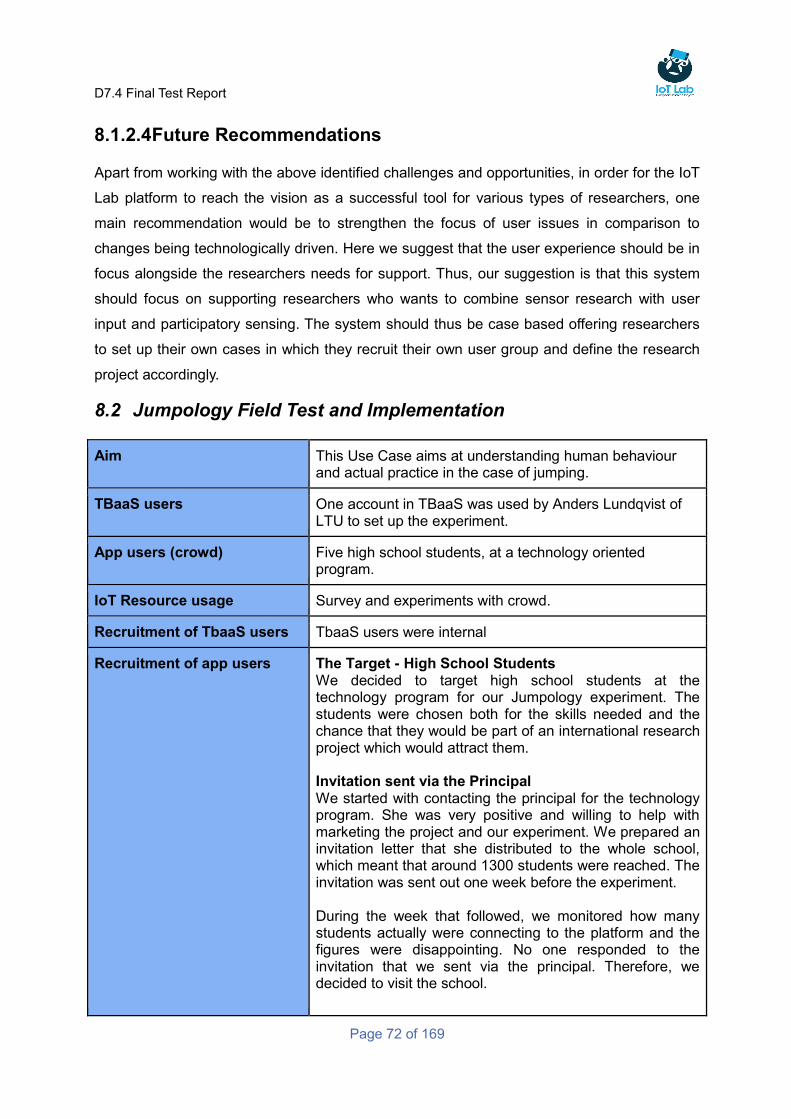
D7.4 Final Test Report
Page 72 of 169
8.1.2.4 Future Recommendations
Apart from working with the above identified challenges and opportunities, in order for the IoT
Lab platform to reach the vision as a successful tool for various types of researchers, one
main recommendation would be to strengthen the focus of user issues in comparison to
changes being technologically driven. Here we suggest that the user experience should be in
focus alongside the researchers needs for support. Thus, our suggestion is that this system
should focus on supporting researchers who wants to combine sensor research with user
input and participatory sensing. The system should thus be case based offering researchers
to set up their own cases in which they recruit their own user group and define the research
project accordingly.
8.2 Jumpology Field Test and Implementation
Aim This Use Case aims at understanding human behaviour and actual practice in the case of jumping.
TBaaS users One account in TBaaS was used by Anders Lundqvist of LTU to set up the experiment.
App users (crowd) Five high school students, at a technology oriented program.
IoT Resource usage Survey and experiments with crowd.
Recruitment of TbaaS users TbaaS users were internal
Recruitment of app users The Target - High School Students We decided to target high school students at the technology program for our Jumpology experiment. The students were chosen both for the skills needed and the chance that they would be part of an international research project which would attract them. Invitation sent via the Principal We started with contacting the principal for the technology program. She was very positive and willing to help with marketing the project and our experiment. We prepared an invitation letter that she distributed to the whole school, which meant that around 1300 students were reached. The invitation was sent out one week before the experiment. During the week that followed, we monitored how many students actually were connecting to the platform and the figures were disappointing. No one responded to the invitation that we sent via the principal. Therefore, we decided to visit the school.
D7.4 Final Test Report
Page 73 of 169
Visiting the School On Friday, 100 invitation letters were printed out and a stand at the main square of the high school with a roll up explaining who we were was made. We started “harassing” students. It took us only a few minutes to realize what the main problem was. We estimate that somewhere around 9 out of 10 had an iPhone, and those with an Android were the majority boys. The students had seen the letter their principal sent out. Some also asked, “What do I get?” when we invited them to participate in a European research project via this “large scale” test. Additional Activities Late Friday, we made some last attempts by posting the invitation on Facebook to our friends, but that had no effect. The outcome of our work was five (5!) users connecting to the platform. There are several possible reasons for the disappointing result but the most obvious ones are:
Very few potential users had Android
Installation of the app failed, for any reason
Some installed the app but did not do it right, e.g. forgot to enter the Research Code
Some listened to our invitation but hesitated, thinking this is contributing to “big brother” watching you. They did not want to do that?
People are “tired/afraid/not willing” to participate in tests on free basis?
Concerning the question about Android vs iPhone it should be noted that the market in Sweden differs from the market in Europe, and most of the rest of the world. In a few countries in the world IoS is the top mobile operating system, Sweden is one of them (the others are Norway, Australia and USA). Therefore, the outcome could be better somewhere else in Europe. Aiming for a Second Round We also wanted to test and see if we could attract a crowd mainly by inviting them to participate without having incentives or any relation to them. Hence, we planned to do second round of the Jumpology Case. In this round, we posted an invitation at a Facebook site (“Helvetes jävla mobiltelefon, åhh nu funkar den”) having 63 556 members, where we reached 3279 people with our invitation to contribute to science by shaking their phone. We also posted it on a Facebook page (“Digital tjänsteutveckling”) for our candidate programme students with 140 members, reaching 39 and we posted the invitation with instructions at the LTU web and at our own Facebook walls. Hence, the invitations reached at least
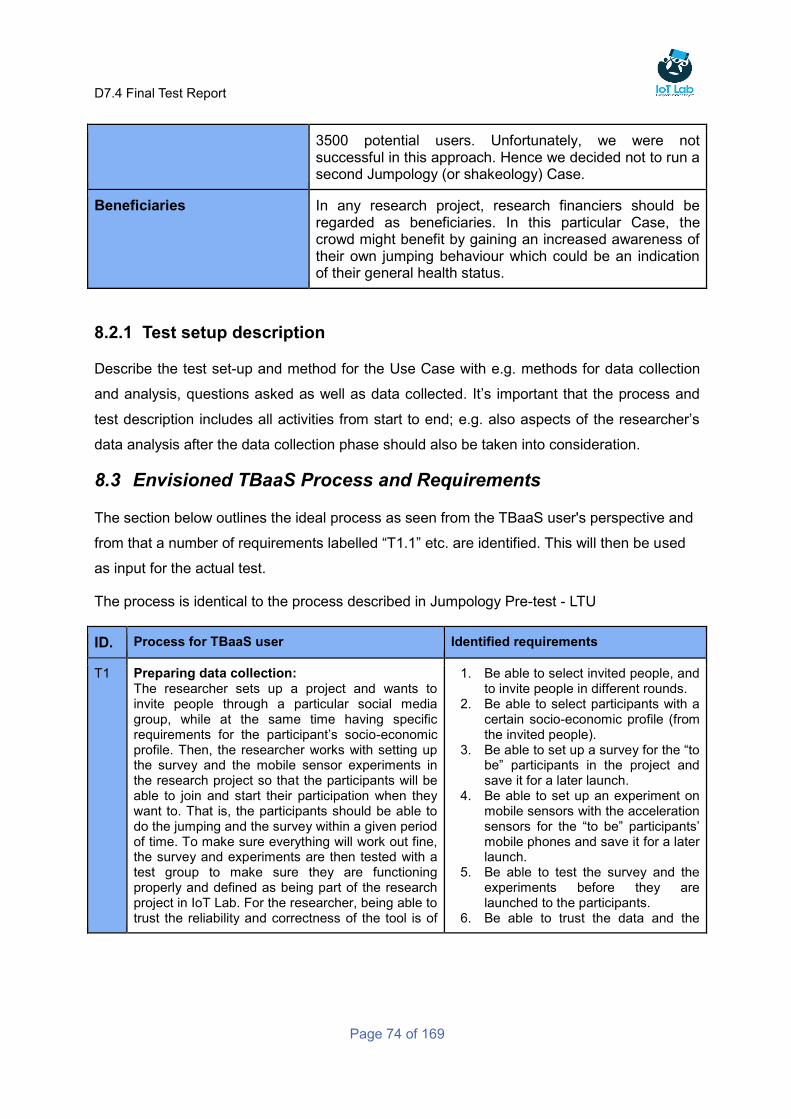
D7.4 Final Test Report
Page 74 of 169
3500 potential users. Unfortunately, we were not successful in this approach. Hence we decided not to run a second Jumpology (or shakeology) Case.
Beneficiaries In any research project, research financiers should be regarded as beneficiaries. In this particular Case, the crowd might benefit by gaining an increased awareness of their own jumping behaviour which could be an indication of their general health status.
8.2.1 Test setup description
Describe the test set-up and method for the Use Case with e.g. methods for data collection
and analysis, questions asked as well as data collected. It’s important that the process and
test description includes all activities from start to end; e.g. also aspects of the researcher’s
data analysis after the data collection phase should also be taken into consideration.
8.3 Envisioned TBaaS Process and Requirements
The section below outlines the ideal process as seen from the TBaaS user's perspective and
from that a number of requirements labelled “T1.1” etc. are identified. This will then be used
as input for the actual test.
The process is identical to the process described in Jumpology Pre-test - LTU
ID. Process for TBaaS user Identified requirements
T1 Preparing data collection: The researcher sets up a project and wants to invite people through a particular social media group, while at the same time having specific requirements for the participant’s socio-economic profile. Then, the researcher works with setting up the survey and the mobile sensor experiments in the research project so that the participants will be able to join and start their participation when they want to. That is, the participants should be able to do the jumping and the survey within a given period of time. To make sure everything will work out fine, the survey and experiments are then tested with a test group to make sure they are functioning properly and defined as being part of the research project in IoT Lab. For the researcher, being able to trust the reliability and correctness of the tool is of
1. Be able to select invited people, and to invite people in different rounds.
2. Be able to select participants with a certain socio-economic profile (from the invited people).
3. Be able to set up a survey for the “to be” participants in the project and save it for a later launch.
4. Be able to set up an experiment on mobile sensors with the acceleration sensors for the “to be” participants’ mobile phones and save it for a later launch.
5. Be able to test the survey and the experiments before they are launched to the participants.
6. Be able to trust the data and the
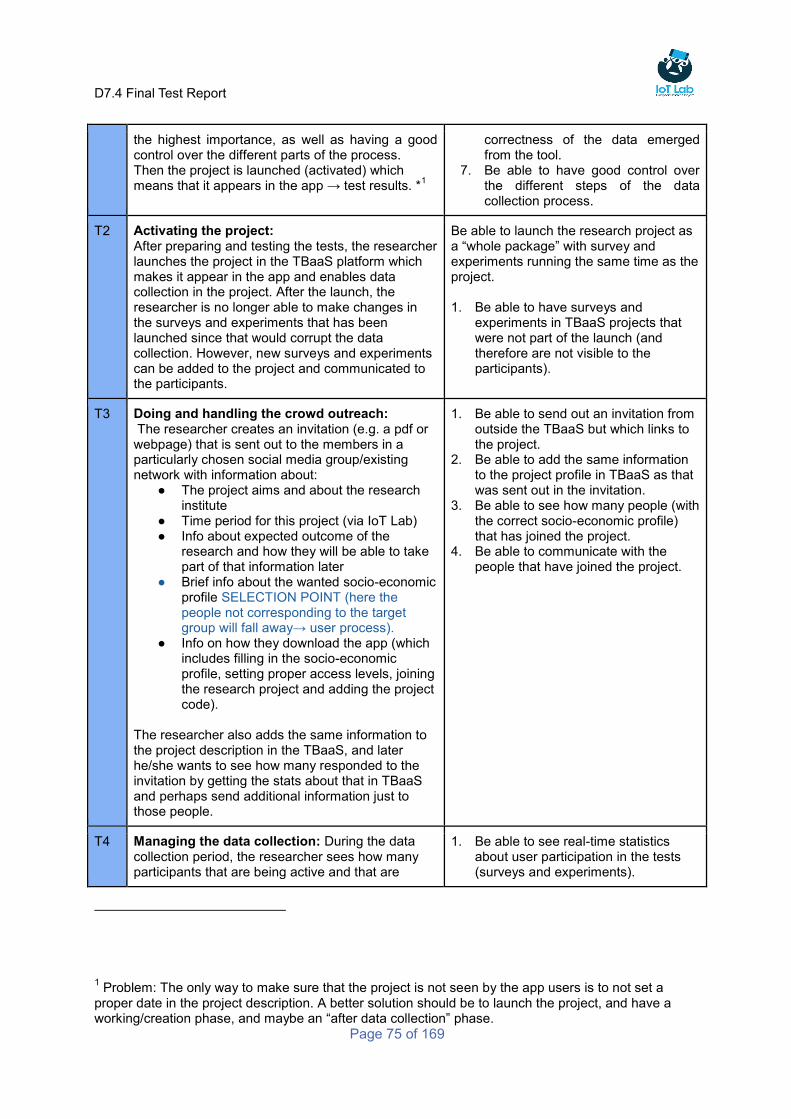
D7.4 Final Test Report
Page 75 of 169
the highest importance, as well as having a good control over the different parts of the process. Then the project is launched (activated) which means that it appears in the app → test results. *
1
correctness of the data emerged from the tool.
7. Be able to have good control over the different steps of the data collection process.
T2 Activating the project: After preparing and testing the tests, the researcher launches the project in the TBaaS platform which makes it appear in the app and enables data collection in the project. After the launch, the researcher is no longer able to make changes in the surveys and experiments that has been launched since that would corrupt the data collection. However, new surveys and experiments can be added to the project and communicated to the participants.
Be able to launch the research project as a “whole package” with survey and experiments running the same time as the project. 1. Be able to have surveys and
experiments in TBaaS projects that were not part of the launch (and therefore are not visible to the participants).
T3 Doing and handling the crowd outreach: The researcher creates an invitation (e.g. a pdf or webpage) that is sent out to the members in a particularly chosen social media group/existing network with information about:
● The project aims and about the research institute
● Time period for this project (via IoT Lab) ● Info about expected outcome of the
research and how they will be able to take part of that information later
● Brief info about the wanted socio-economic profile SELECTION POINT (here the people not corresponding to the target group will fall away→ user process).
● Info on how they download the app (which includes filling in the socio-economic profile, setting proper access levels, joining the research project and adding the project code).
The researcher also adds the same information to the project description in the TBaaS, and later he/she wants to see how many responded to the invitation by getting the stats about that in TBaaS and perhaps send additional information just to those people.
1. Be able to send out an invitation from outside the TBaaS but which links to the project.
2. Be able to add the same information to the project profile in TBaaS as that was sent out in the invitation.
3. Be able to see how many people (with the correct socio-economic profile) that has joined the project.
4. Be able to communicate with the people that have joined the project.
T4 Managing the data collection: During the data collection period, the researcher sees how many participants that are being active and that are
1. Be able to see real-time statistics about user participation in the tests (surveys and experiments).
1 Problem: The only way to make sure that the project is not seen by the app users is to not set a
proper date in the project description. A better solution should be to launch the project, and have a working/creation phase, and maybe an “after data collection” phase.
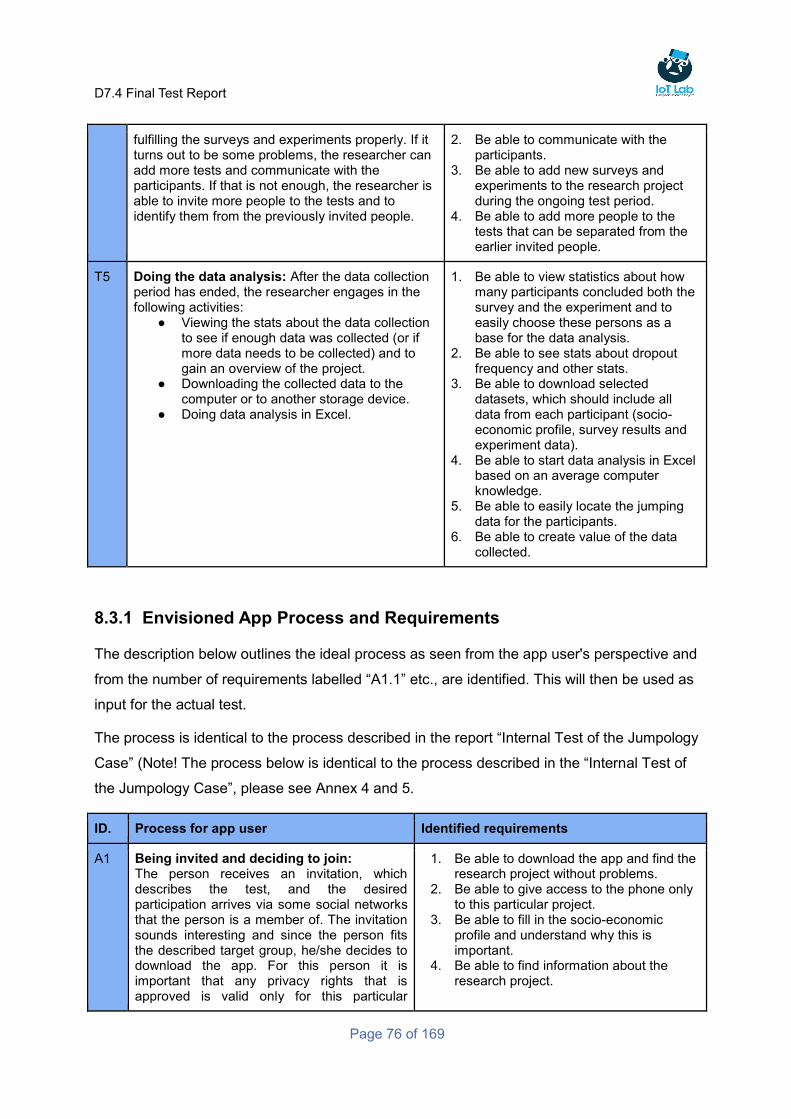
D7.4 Final Test Report
Page 76 of 169
fulfilling the surveys and experiments properly. If it turns out to be some problems, the researcher can add more tests and communicate with the participants. If that is not enough, the researcher is able to invite more people to the tests and to identify them from the previously invited people.
2. Be able to communicate with the participants.
3. Be able to add new surveys and experiments to the research project during the ongoing test period.
4. Be able to add more people to the tests that can be separated from the earlier invited people.
T5 Doing the data analysis: After the data collection period has ended, the researcher engages in the following activities:
● Viewing the stats about the data collection to see if enough data was collected (or if more data needs to be collected) and to gain an overview of the project.
● Downloading the collected data to the computer or to another storage device.
● Doing data analysis in Excel.
1. Be able to view statistics about how many participants concluded both the survey and the experiment and to easily choose these persons as a base for the data analysis.
2. Be able to see stats about dropout frequency and other stats.
3. Be able to download selected datasets, which should include all data from each participant (socio-economic profile, survey results and experiment data).
4. Be able to start data analysis in Excel based on an average computer knowledge.
5. Be able to easily locate the jumping data for the participants.
6. Be able to create value of the data collected.
8.3.1 Envisioned App Process and Requirements
The description below outlines the ideal process as seen from the app user's perspective and
from the number of requirements labelled “A1.1” etc., are identified. This will then be used as
input for the actual test.
The process is identical to the process described in the report “Internal Test of the Jumpology
Case” (Note! The process below is identical to the process described in the “Internal Test of
the Jumpology Case”, please see Annex 4 and 5.
ID. Process for app user Identified requirements
A1 Being invited and deciding to join: The person receives an invitation, which describes the test, and the desired participation arrives via some social networks that the person is a member of. The invitation sounds interesting and since the person fits the described target group, he/she decides to download the app. For this person it is important that any privacy rights that is approved is valid only for this particular
1. Be able to download the app and find the research project without problems.
2. Be able to give access to the phone only to this particular project.
3. Be able to fill in the socio-economic profile and understand why this is important.
4. Be able to find information about the research project.
D7.4 Final Test Report
Page 77 of 169
project since he/she likes to be in control and values his/her integrity.
A2 Participating in the research: After downloading the app, the person reads about what is required to do and starts doing what is requested (doing some jumping and answering a survey) at a time when it is suitable. After performing the activities, the person can clearly see in the app that the required participation is complete, and the project itself is still running and that more assignments might appear.
1. Be able to start the participation in the test at a time that the participant chooses (but within a defined time period).
2. Be able to start the participation only after the access is granted to the acceleration sensor and the socio-economical profile is filled in correctly.
3. Be able to see the status of their participation in the project, as well as see the status of the research project.
4. Be able to receive information from the research project.
A3 Afterwards: After the research project is closed, the person receives a message from the project with a thanks for the engagement and information about how to gain understanding about the research results.
1. Be able to receive messages from the project after the project has ended.
8.3.2 Test results
This section includes a description of the test results based on the previously identified
requirements, as well as a documentation of potential workarounds if the initial user
requirement could not be fulfilled.
8.3.2.1 Results from the TBaaS user process
All results from the internal test are valid in this experiment and we can add also the following
general remarks.
The start and end time in TBaaS that were given to the users was not possible to set
because data would not have been generated. We have found a workaround in that if
we set the start time 24 hours prior to the intended start time and end the time 24
hours after the intended time, the data would then be generated from the time the test
was initiated in TBaaS and between 5,5 to 26,5 hours (different for all mobiles).
We could see that five users installed the app and entered the Research Code that
they were given, but only three mobiles generated data. We were not able to see or
find out who or why did not generate the data.
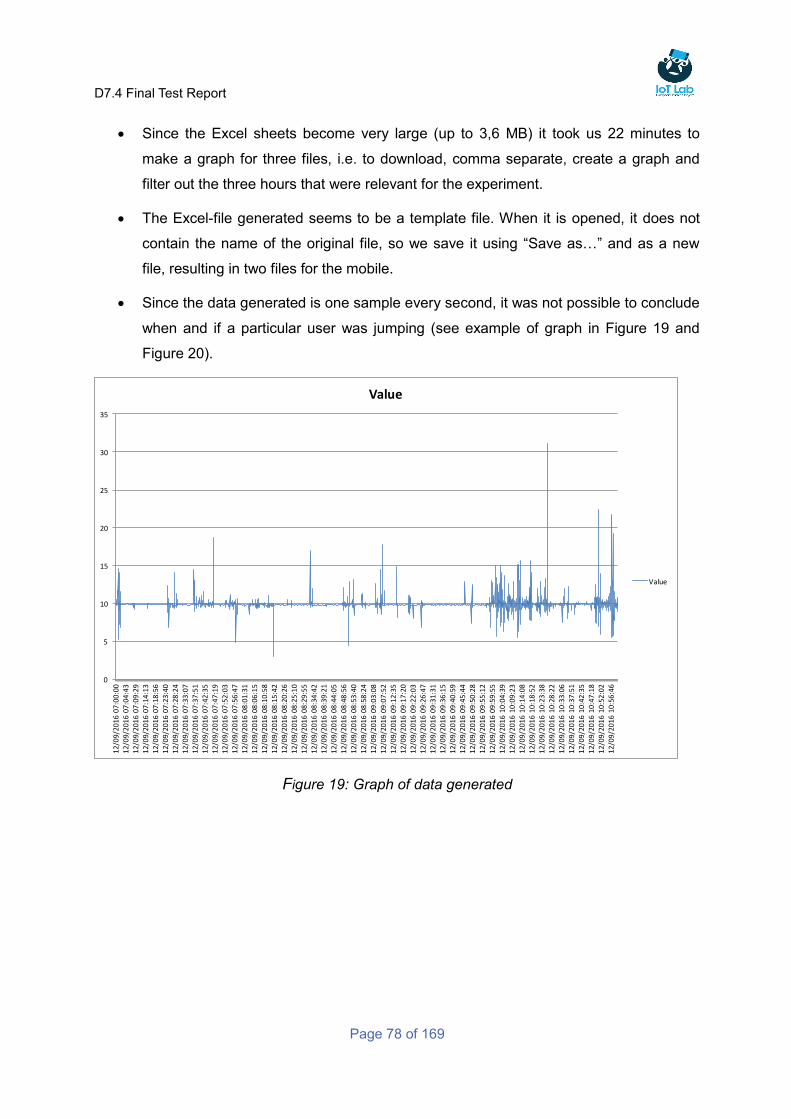
D7.4 Final Test Report
Page 78 of 169
Since the Excel sheets become very large (up to 3,6 MB) it took us 22 minutes to
make a graph for three files, i.e. to download, comma separate, create a graph and
filter out the three hours that were relevant for the experiment.
The Excel-file generated seems to be a template file. When it is opened, it does not
contain the name of the original file, so we save it using “Save as…” and as a new
file, resulting in two files for the mobile.
Since the data generated is one sample every second, it was not possible to conclude
when and if a particular user was jumping (see example of graph in Figure 19 and
Figure 20).
Figure 19: Graph of data generated
0
5
10
15
20
25
30
35
12/09/201607:00:00
12/09/201607:04:43
12/09/201607:09:29
12/09/201607:14:13
12/09/201607:18:56
12/09/201607:23:40
12/09/201607:28:24
12/09/201607:33:07
12/09/201607:37:51
12/09/201607:42:35
12/09/201607:47:19
12/09/201607:52:03
12/09/201607:56:47
12/09/201608:01:31
12/09/201608:06:15
12/09/201608:10:58
12/09/201608:15:42
12/09/201608:20:26
12/09/201608:25:10
12/09/201608:29:55
12/09/201608:34:42
12/09/201608:39:21
12/09/201608:44:05
12/09/201608:48:56
12/09/201608:53:40
12/09/201608:58:24
12/09/201609:03:08
12/09/201609:07:52
12/09/201609:12:35
12/09/201609:17:20
12/09/201609:22:03
12/09/201609:26:47
12/09/201609:31:31
12/09/201609:36:15
12/09/201609:40:59
12/09/201609:45:44
12/09/201609:50:28
12/09/201609:55:12
12/09/201609:59:55
12/09/201610:04:39
12/09/201610:09:23
12/09/201610:14:08
12/09/201610:18:52
12/09/201610:23:38
12/09/201610:28:22
12/09/201610:33:06
12/09/201610:37:51
12/09/201610:42:35
12/09/201610:47:18
12/09/201610:52:02
12/09/201610:56:46
Value
Value
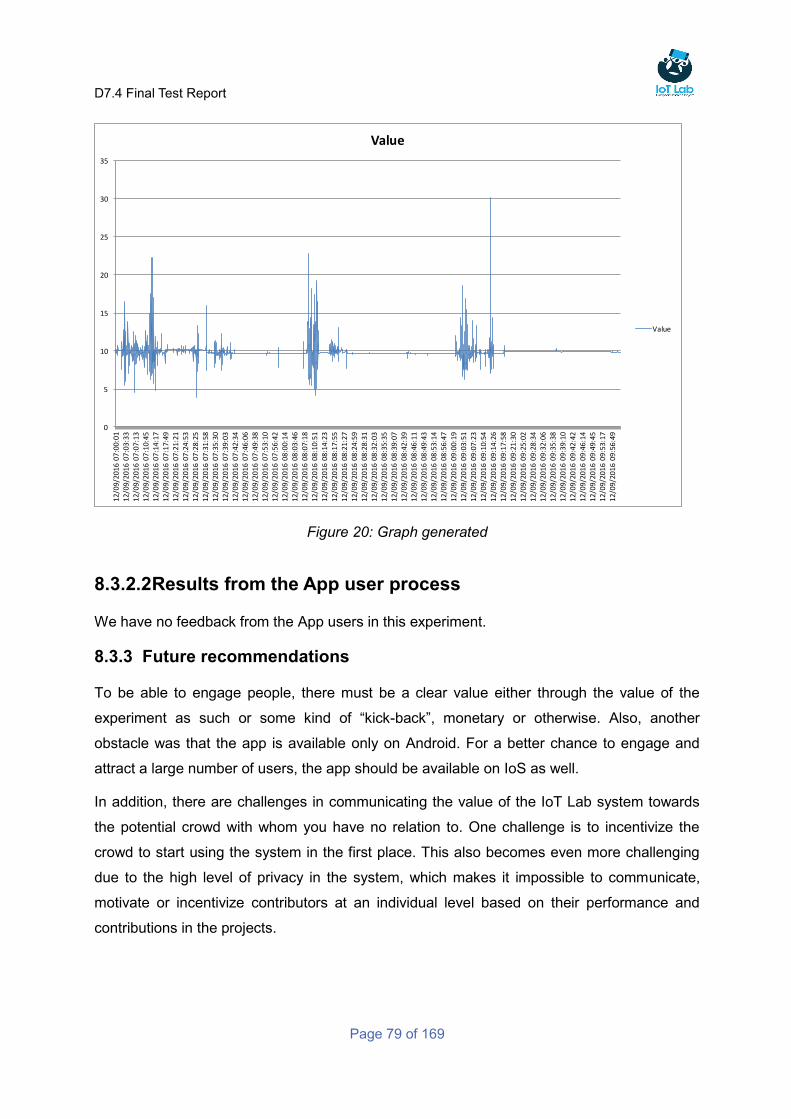
D7.4 Final Test Report
Page 79 of 169
Figure 20: Graph generated
8.3.2.2 Results from the App user process
We have no feedback from the App users in this experiment.
8.3.3 Future recommendations
To be able to engage people, there must be a clear value either through the value of the
experiment as such or some kind of “kick-back”, monetary or otherwise. Also, another
obstacle was that the app is available only on Android. For a better chance to engage and
attract a large number of users, the app should be available on IoS as well.
In addition, there are challenges in communicating the value of the IoT Lab system towards
the potential crowd with whom you have no relation to. One challenge is to incentivize the
crowd to start using the system in the first place. This also becomes even more challenging
due to the high level of privacy in the system, which makes it impossible to communicate,
motivate or incentivize contributors at an individual level based on their performance and
contributions in the projects.
0
5
10
15
20
25
30
35
12/09/201607:00:01
12/09/201607:03:33
12/09/201607:07:13
12/09/201607:10:45
12/09/201607:14:17
12/09/201607:17:49
12/09/201607:21:21
12/09/201607:24:53
12/09/201607:28:25
12/09/201607:31:58
12/09/201607:35:30
12/09/201607:39:03
12/09/201607:42:34
12/09/201607:46:06
12/09/201607:49:38
12/09/201607:53:10
12/09/201607:56:42
12/09/201608:00:14
12/09/201608:03:46
12/09/201608:07:18
12/09/201608:10:51
12/09/201608:14:23
12/09/201608:17:55
12/09/201608:21:27
12/09/201608:24:59
12/09/201608:28:31
12/09/201608:32:03
12/09/201608:35:35
12/09/201608:39:07
12/09/201608:42:39
12/09/201608:46:11
12/09/201608:49:43
12/09/201608:53:14
12/09/201608:56:47
12/09/201609:00:19
12/09/201609:03:51
12/09/201609:07:23
12/09/201609:10:54
12/09/201609:14:26
12/09/201609:17:58
12/09/201609:21:30
12/09/201609:25:02
12/09/201609:28:34
12/09/201609:32:06
12/09/201609:35:38
12/09/201609:39:10
12/09/201609:42:42
12/09/201609:46:14
12/09/201609:49:45
12/09/201609:53:17
12/09/201609:56:49
Value
Value
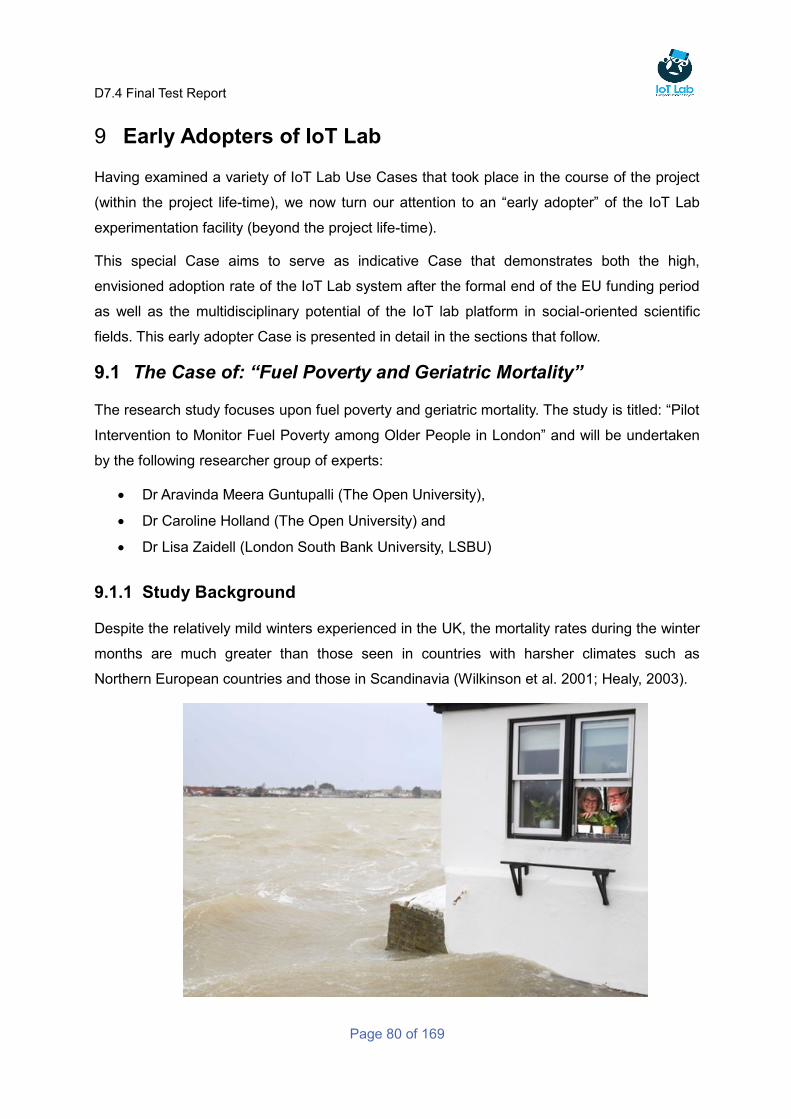
D7.4 Final Test Report
Page 80 of 169
Early Adopters of IoT Lab 9
Having examined a variety of IoT Lab Use Cases that took place in the course of the project
(within the project life-time), we now turn our attention to an “early adopter” of the IoT Lab
experimentation facility (beyond the project life-time).
This special Case aims to serve as indicative Case that demonstrates both the high,
envisioned adoption rate of the IoT Lab system after the formal end of the EU funding period
as well as the multidisciplinary potential of the IoT lab platform in social-oriented scientific
fields. This early adopter Case is presented in detail in the sections that follow.
9.1 The Case of: “Fuel Poverty and Geriatric Mortality”
The research study focuses upon fuel poverty and geriatric mortality. The study is titled: “Pilot
Intervention to Monitor Fuel Poverty among Older People in London” and will be undertaken
by the following researcher group of experts:
Dr Aravinda Meera Guntupalli (The Open University),
Dr Caroline Holland (The Open University) and
Dr Lisa Zaidell (London South Bank University, LSBU)
9.1.1 Study Background
Despite the relatively mild winters experienced in the UK, the mortality rates during the winter
months are much greater than those seen in countries with harsher climates such as
Northern European countries and those in Scandinavia (Wilkinson et al. 2001; Healy, 2003).
D7.4 Final Test Report
Page 81 of 169
Figure 21: Shoreham, West Sussex (Telegraph, 2014)
Over one million pensioners live in poverty in the UK (DWP, 2014a; DWP, 2014b), and around
2.4 million pensioner households may be living in fuel poverty2 (NPC, 2011). As the impact of
fuel poverty is greater on people aged 65 and above (Age UK, 2011a; Marmot Review team,
2011), therefore, this project will focus on that group.
The project will pilot a highly innovative, technology-based intervention system, using a
recently created Android phone application (http://www.iotlab.eu/) that monitors room
temperature, which was developed with the support of EU FP7 funding.
9.1.2 Study Aim and Objectives
This pilot study will provide evidence of whether this intervention has the potential for wider
application in alleviating the worst consequences of fuel poverty among the elderly, and will
identify multiple dimensions of fuel poverty using local primary data – also incorporating
secondary data, if available.
9.1.3 Location and participant recruitment
Based in South London where one of the applicants collaborates with Local Authorities in the
Boroughs of Lambeth and Southwark, this pilot will use the IoT Lab mobile app temperature-
monitoring sensor/ IoT mote, and in addition to regular follow-ups by phone, to monitor fuel
poverty.
IoT Lab mobile app usage
The IoT Lab app can utilise the phone as a gateway to collect temperature data from an IoT
mote through Bluetooth for example. In addition, the IoT Lab app could be used to collect
user feedbacks (i.e., survey) and eventually accelerometer data to indicate the activity of the
user, (i.e., motion).
The pilot intervention will involve a small purposive sample of six participants, comprised of
men and women over 70 (at least two >80 years old) and who are living alone and therefore,
likely to be at higher poverty risk (Guntupalli, 2014). Participants will be identified and
recruited through above Local Authorities contacts. Participants will receive regular phone
2 Fuel poverty is defined as the situation of an individual or household spending 10% or more of their
income on heating fuel.
D7.4 Final Test Report
Page 82 of 169
calls from the project consultant to discuss the impact of fuel costs on their budget, their
general well-being, and adaptation strategies, such as fuel payment (Lloyd, 2013).
In addition to the follow up calls each participant will be interviewed at least twice, to gather
qualitative information on fuel and other expenditure, and their coping strategies, in order to
gauge the potential role of our technology-based support in the mitigation of poverty
experiences. Participants will be asked to record their weekly expenditure and any difficulties
they face regarding accessibility and affordability, for two months.
9.1.4 Study Outcomes
By the end of the study, we will have:
a) Generated a scoping document for a larger follow-on project,
b) Explored secondary data on fuel poverty in these boroughs, and
c) Produced a policy report, combining evidence from the literature review and primary
data, and will incorporate secondary data, if available.
If the pilot is successful, we will schedule further collaborative meetings with the local
authorities and relevant third sector organisations, in order to scale up the intervention as a
larger follow-on project to be submitted for national-funding (i.e., ESRC) and/or EU funding.
9.1.5 Impact
This research is novel in its development of a technology-based intervention and analytical
platform, allowing new ideas to address fuel poverty alleviation. Immediate benefit to
participants is anticipated through better knowledge gained during the pilot intervention.
The potential impact of a larger study is to identify pathways to alleviate poverty on a wider
scale, by integrating monitoring of temperature with weekly telephone discussions, and
strategies may be developed to address the issue of fuel poverty in later life.
9.1.6 Study Timeframe
The envisioned research study timeframe is as follows:
Month 1: Submission of ethics application;
Month 2- 4: 2-month pilot starts, including literature review and exploration of
secondary data;
Month 5: Data collection complete;
Month 6-7: Interview analysis and preparation of scoping document and policy report;
Month 8: Submission of policy report.
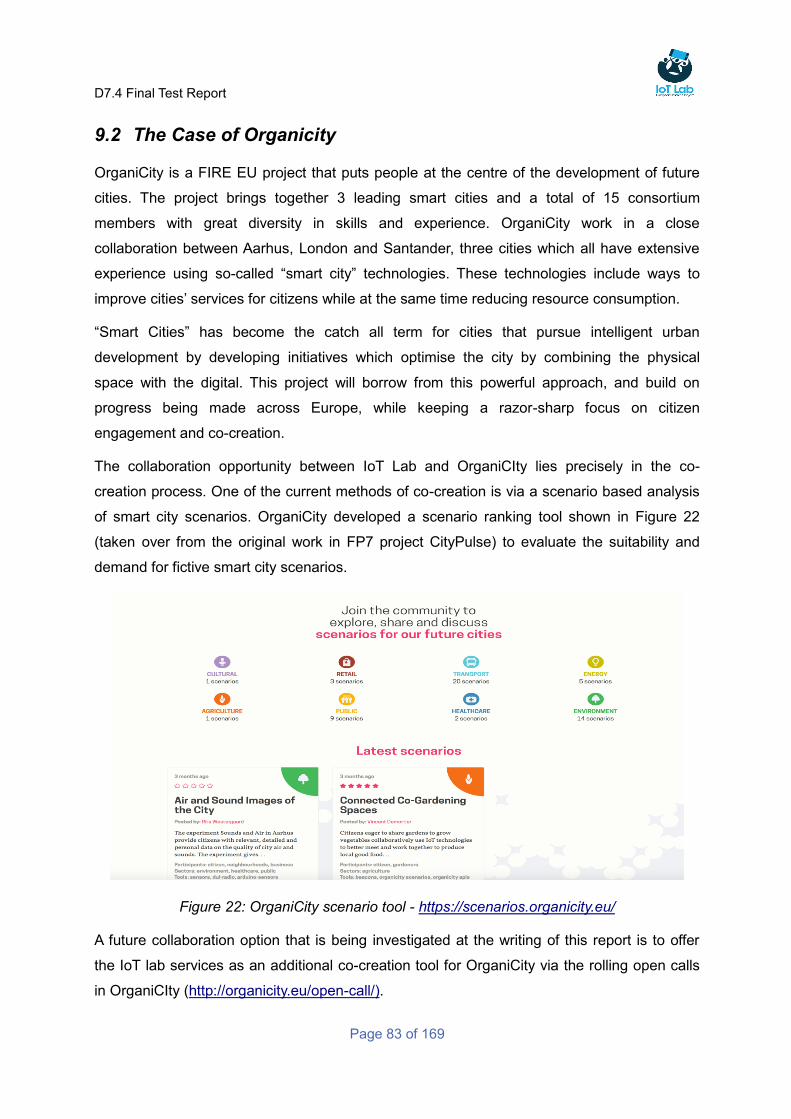
D7.4 Final Test Report
Page 83 of 169
9.2 The Case of Organicity
OrganiCity is a FIRE EU project that puts people at the centre of the development of future
cities. The project brings together 3 leading smart cities and a total of 15 consortium
members with great diversity in skills and experience. OrganiCity work in a close
collaboration between Aarhus, London and Santander, three cities which all have extensive
experience using so-called “smart city” technologies. These technologies include ways to
improve cities’ services for citizens while at the same time reducing resource consumption.
“Smart Cities” has become the catch all term for cities that pursue intelligent urban
development by developing initiatives which optimise the city by combining the physical
space with the digital. This project will borrow from this powerful approach, and build on
progress being made across Europe, while keeping a razor-sharp focus on citizen
engagement and co-creation.
The collaboration opportunity between IoT Lab and OrganiCIty lies precisely in the co-
creation process. One of the current methods of co-creation is via a scenario based analysis
of smart city scenarios. OrganiCity developed a scenario ranking tool shown in Figure 22
(taken over from the original work in FP7 project CityPulse) to evaluate the suitability and
demand for fictive smart city scenarios.
Figure 22: OrganiCity scenario tool - https://scenarios.organicity.eu/
A future collaboration option that is being investigated at the writing of this report is to offer
the IoT lab services as an additional co-creation tool for OrganiCity via the rolling open calls
in OrganiCIty (http://organicity.eu/open-call/).
D7.4 Final Test Report
Page 84 of 169
9.3 The Case of SmartBuy
SmartBuy is a FIRE EU project aiming at providing an e-commerce solution for small local
retailers, focused on those that do not intend to open a web-shop but instead will keep the
physical store as the focal point of their future business. The project is a fairly small and a
focused Innovation Action with four consortium members of which two are SMEs providing IT-
solutions and two universities. The project started Jan 1st, 2016 and will run for 24 months.
During this time the SmartBuy platform will be developed taking advantage of available
infrastructures provided by OrganiCity project, IoT Innovation Lab and enablers from the
FIWARE framework. The platform will be validated through piloting activities, in the first cycle
in Sweden (Luleå) and Greece (Patras) and in a second cycle also in London, Aarhus and
Santander, three cities already collaborating in the OrganiCity project.
Through the SmartBuy platform, small, local retailers will be able to have presence on the
Internet and through geo-location and advanced marketing tools offer their products to
qualified potential customers that are nearby and with a high probability willing to buy their
products.
In the SmartBuy project plans, it is described how the project will take advantage of results
from, amongst other initiatives, IoT Innovation Lab and more specifically an “infrastructure
measuring smartphones presence in the area”. This is mentioned as a result that will
provided to SmartBuy. Hence, there is a clear collaboration opportunity between SmartBuy
and IoT Lab and results from IoT Lab are already being considered as the SmartBuy platform
is being developed.
D7.4 Final Test Report
Page 85 of 169
Conclusions and Future Recommendations 10
In conclusion, the added benefits of the IoT system are related to different perspectives, new
research questions, citizen science and sharing of resources as follows:
It a system that has the potential to revolutionise social science research since it
offers a possibility to investigate new and interesting aspects where participatory
sensor data are connected to humans in their specific context. This approach has the
potential to add new and deepened insight for researchers.
The IoT Lab system give benefits for research since it stimulates new research
questions related to real life situations and context, and potentials that has not been
possible to investigate in an effective and efficient way earlier such as understanding
movement patterns in a city dependent on weather conditions, age, socio-economy,
etc. In addition, having IoT Lab system as a research tool gives researchers an
opportunity to receive insights from citizens willing to contribute to science while they
are in a specific context.
The IoT Lab system gives researchers a service in which they get access to sensor
data without having to install the sensors themselves. This offers great opportunities
for new research avenues and more effective research.
The IoT Lab system facilitates researchers to share resources between each other in
terms of, e.g. sensor installations in the testbed.
The IoT Lab system offers citizens a way to share their ideas on potential research
questions that are interesting from their perspective. The citizens can also be involved
in research projects which strengthens the democratic nature of the research which
stimulates citizens’ engagement and commitment to research. Due to this trend in
society with citizen scientists wanting to contribute to research projects, the IoT Lab
system becomes an important tool in this mission.
The Incentivising System implemented in the system allows citizens to give to
charities which can give them a feeling of fulfilment and the charities will benefit since
they will get more sponsors.
Based on the lessons learned from the implementation process and usage processes in the
different cases there are some conclusions and future recommendations that needs to be
taken into consideration to facilitate the future success of the IoT Lab system. The future
recommendations will be related both to the system as such and also to crowd motivators.
The IoT Lab system is a very well equipped system for sensor data research (including both
D7.4 Final Test Report
Page 86 of 169
participatory and stationary sensors) in combination with survey data. Having the sensors as
the starting point, the researcher can set up projects with a defined crowd from which the
researcher can control and collect sensor data from. This means, for instance, that a
researcher might want to collect sensor data from a building, knowing that the sensors she or
he are collecting data from is within that specific building. Today, individuals’ privacy is well
protected in the system due to the Research Code and they can share their sensor data for a
specific time period with a specific researcher without being recognized as an individual by
the researcher. When the project ends and the data has been collected, the participants
should be deleted from the system. With this approach, the participants’ sensors need to be
connected to one project and not be available for any other researcher in the TBaaS system.
With this approach, the researcher can also combine participatory sensing with e.g. building
sensors (e.g. luminance and humidity), hence having a richer data in their research project.
The IoT Lab system becomes a research service for sensor based research with this
approach, where a combination of human insights and sensor data is available.
One conclusion is thus that the current form of the system should focus on supporting sensor
based research with participant input through surveys within a defined project with a known
crowd and context. In this case-by-case approach, the can interact with the potential
contributors in the context and encourage them to download the application and contribute to
a research project. Hence, the system will be driven by researchers and within defined
research projects. With this approach, we can see many benefits and opportunities. For
instance, it will be a research service in which the researcher will be in control of the process
and receive input from the contributors (who will be selected and invited based on the
researcher’s criterions). In this way, it will be a tool that contributors install and use for a
particular project and after it has ended, they can uninstall the application and stop sharing
their data.
The current set-up of the system includes some challenges that needs to be addressed to
strengthen the possibilities of the IoT Lab system and in the following a description and
discussion of some of them are given. Dependent on the future path for the system, we argue
that some challenges are more easily met than others. These challenges will relate to both
technology and privacy and also to crowd motivators, starting with the technology as such.
The limitation of having the app as an Android application limits some of the participation in
the research project. Today, Android has about 80% versus iPhone’s about 18% of the market
share, however, in the contexts in which our Use Cases has been implemented, not having
an iPhone app has been a clear limitation.
There are other challenges as well that need to be handled when working on research
D7.4 Final Test Report
Page 87 of 169
projects and development of applications, foremost among them, the users increasing
unwillingness to download prototype applications. Today, users are more careful about what
they download to their phone and they are also less interested in research projects. It is
increasingly hard to engage people in research projects since there are so many different
competing options such as crowd-sourcing, crowd-funding and sharing economy that also
seeks their attention and contribution in general.
When it comes to privacy and motivation of the crowd, the design of the IoT Lab system
offers some challenges on how to motivate people to participate. It is known that people
engage in crowdsourcing activities for four main reasons; fun, fame, fortune and fulfilment. In
the current version of the IoT Lab system, none of these motivators are apparent and fulfilled
by the system. For instance, fun is the most important factor for people participation in any
research activity. Here the researcher has a strong role in encouraging people to participate
in his/her research project. Also, the gamification aspect of the Incentive System that will be
implemented will also contribute to the motivator of having fun while contributing. A potential
aspect of fun could have been to push back sensor data showing the user the data from their
sensors in different graphs. Hence, one recommendation is to consider this in future versions
of the system and to find ways to solve this with the current level of privacy, which might
become demanding.
Another aspect of motivation is fame, with the current level of privacy in the system, it is
challenging to find ways to fulfil this motivator. In this instance, potential ways could have
been to give participants visibility based on how much they contribute to the different projects.
For instance, to state that “(Alias) have contributed with XX amount of data to the yy project”,
or to have a list of top contributors in the system as a whole. With the current level of privacy,
this motivation is not possible, hence it is important to find other ways to provide fame without
revealing their user name, location, data sharing, or ideas. Hence, one recommendation is to
find ways to have competitions, compensation or collaboration without revealing users alias
and contributions.
The aspect of motivation is fortune, which refers to contributors’ opportunity to earn money
with their data. This motivator will be met when the future Incentive System is implemented
either that contributors themselves make a “fortune” or by their contributions, they can
contribute with monetary incentives to others by giving to charity. Hence, the fortune
motivator can be fulfilled in future versions of the system if that type of Incentive System is
implemented and if the defined level of privacy is upheld. Based on that, one
recommendation is to find ways to support contributors in building a fortune, either for
themselves or to others. As with the other motivators, this can be directly linked to the
D7.4 Final Test Report
Page 88 of 169
research project that is suggested via the IoT Lab system in itself. It can for instance be that
by sharing their temperature sensor data, they contributed to saving energy for the company
they work for or similar approaches. To conclude, fortune can be made in different ways
without compromising contributors’ privacy.
The fulfilment motivator is an aspect which the IoT Lab system has great potential to achieve.
Fulfilment in this context means that the contributors wants to feel good about themselves
and their participation in the research projects suggested by IoT Lab. Here, feedback
becomes a very important fact where the contributors must be informed about the effects
from their contribution. It can be on a group level, which ensure that contributors´ privacy are
intact. Also fulfilment can be related to the research projects as such, where it can be
motivating if the contributors can follow their contribution in relation to the projects. This
means they can see when a specific experiment in the project is fulfilled or when the surveys
has been answered. Therefore, a recommendation is to ensure that the results from the
different research projects are fed back to the contributors in some way in order to show the
tasks the contributors have fulfilled in an explicit manner.
To further push for contributors’ motivation could also be beneficial to make it easier for the
crowd to join a project they are interested in and to let the communication flow between the
researcher and the crowd more easily. This is of course a challenge due to the high level of
privacy in the system, which makes it difficult for a researcher to interact with the crowd
based on their input or to answer questions personally.
Below are our recommendations for the Future, in order to maximise the benefit of IoT Lab as
a platform for research and experimentaiton.
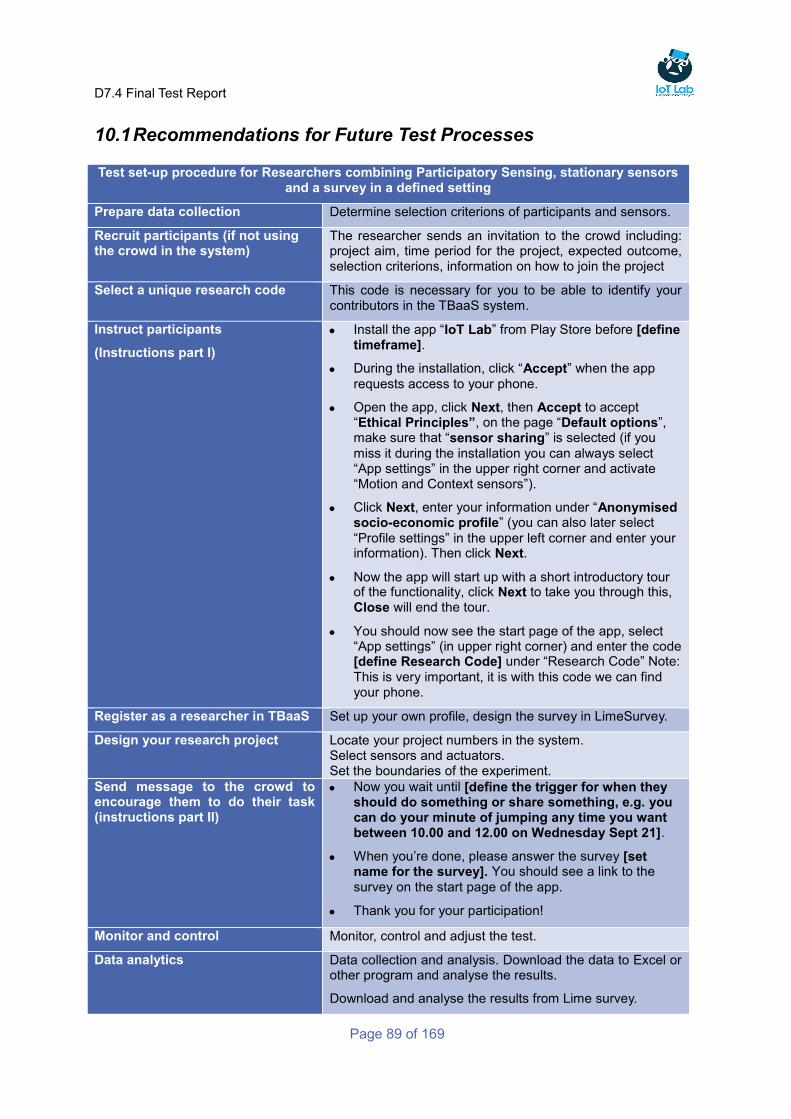
D7.4 Final Test Report
Page 89 of 169
10.1 Recommendations for Future Test Processes
Test set-up procedure for Researchers combining Participatory Sensing, stationary sensors and a survey in a defined setting
Prepare data collection Determine selection criterions of participants and sensors.
Recruit participants (if not using the crowd in the system)
The researcher sends an invitation to the crowd including: project aim, time period for the project, expected outcome, selection criterions, information on how to join the project
Select a unique research code This code is necessary for you to be able to identify your contributors in the TBaaS system.
Instruct participants
(Instructions part I)
Install the app “IoT Lab” from Play Store before [define timeframe].
During the installation, click “Accept” when the app
requests access to your phone.
Open the app, click Next, then Accept to accept “Ethical Principles”, on the page “Default options”, make sure that “sensor sharing” is selected (if you
miss it during the installation you can always select “App settings” in the upper right corner and activate “Motion and Context sensors”).
Click Next, enter your information under “Anonymised socio-economic profile” (you can also later select
“Profile settings” in the upper left corner and enter your information). Then click Next.
Now the app will start up with a short introductory tour of the functionality, click Next to take you through this, Close will end the tour.
You should now see the start page of the app, select “App settings” (in upper right corner) and enter the code [define Research Code] under “Research Code” Note:
This is very important, it is with this code we can find your phone.
Register as a researcher in TBaaS Set up your own profile, design the survey in LimeSurvey.
Design your research project Locate your project numbers in the system. Select sensors and actuators. Set the boundaries of the experiment.
Send message to the crowd to encourage them to do their task (instructions part II)
Now you wait until [define the trigger for when they should do something or share something, e.g. you can do your minute of jumping any time you want between 10.00 and 12.00 on Wednesday Sept 21].
When you’re done, please answer the survey [set name for the survey]. You should see a link to the
survey on the start page of the app.
Thank you for your participation!
Monitor and control Monitor, control and adjust the test.
Data analytics Data collection and analysis. Download the data to Excel or other program and analyse the results.
Download and analyse the results from Lime survey.
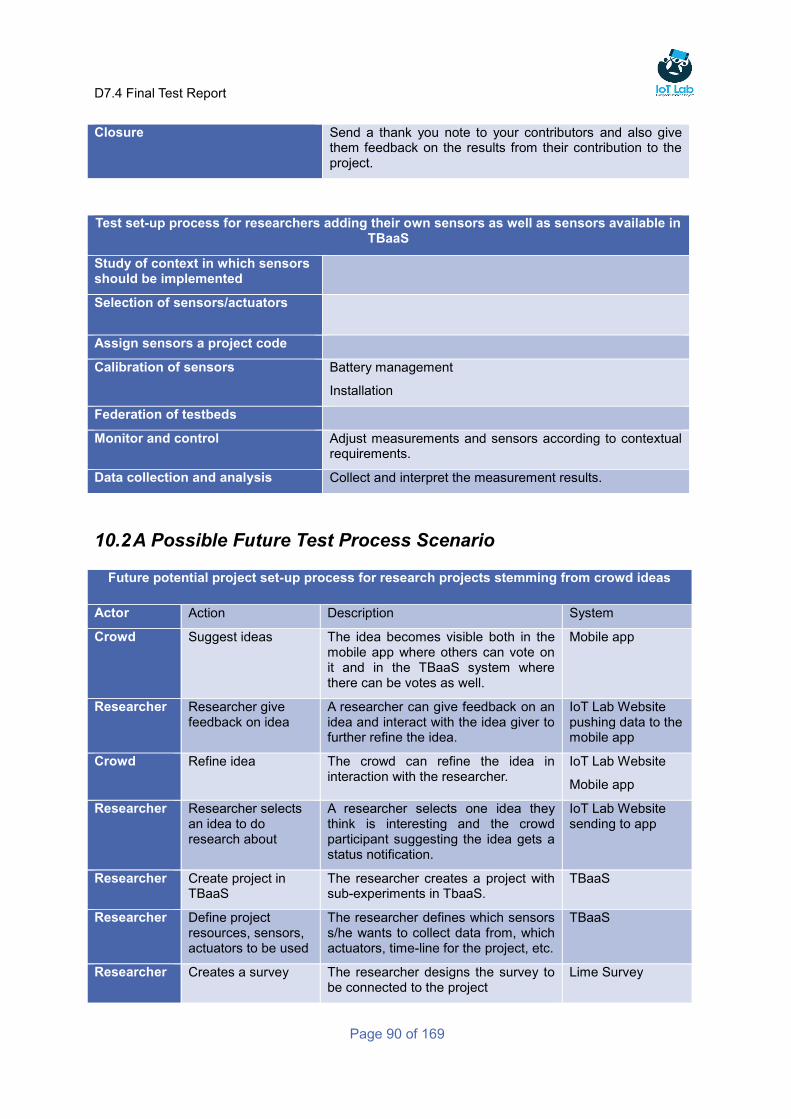
D7.4 Final Test Report
Page 90 of 169
Closure Send a thank you note to your contributors and also give them feedback on the results from their contribution to the project.
Test set-up process for researchers adding their own sensors as well as sensors available in TBaaS
Study of context in which sensors should be implemented
Selection of sensors/actuators
Assign sensors a project code
Calibration of sensors Battery management
Installation
Federation of testbeds
Monitor and control Adjust measurements and sensors according to contextual requirements.
Data collection and analysis Collect and interpret the measurement results.
10.2 A Possible Future Test Process Scenario
Future potential project set-up process for research projects stemming from crowd ideas
Actor Action Description System
Crowd Suggest ideas The idea becomes visible both in the mobile app where others can vote on it and in the TBaaS system where there can be votes as well.
Mobile app
Researcher Researcher give feedback on idea
A researcher can give feedback on an idea and interact with the idea giver to further refine the idea.
IoT Lab Website pushing data to the mobile app
Crowd Refine idea The crowd can refine the idea in interaction with the researcher.
IoT Lab Website
Mobile app
Researcher Researcher selects an idea to do research about
A researcher selects one idea they think is interesting and the crowd participant suggesting the idea gets a status notification.
IoT Lab Website sending to app
Researcher Create project in TBaaS
The researcher creates a project with sub-experiments in TbaaS.
TBaaS
Researcher Define project resources, sensors, actuators to be used
The researcher defines which sensors s/he wants to collect data from, which actuators, time-line for the project, etc.
TBaaS
Researcher Creates a survey The researcher designs the survey to be connected to the project
Lime Survey
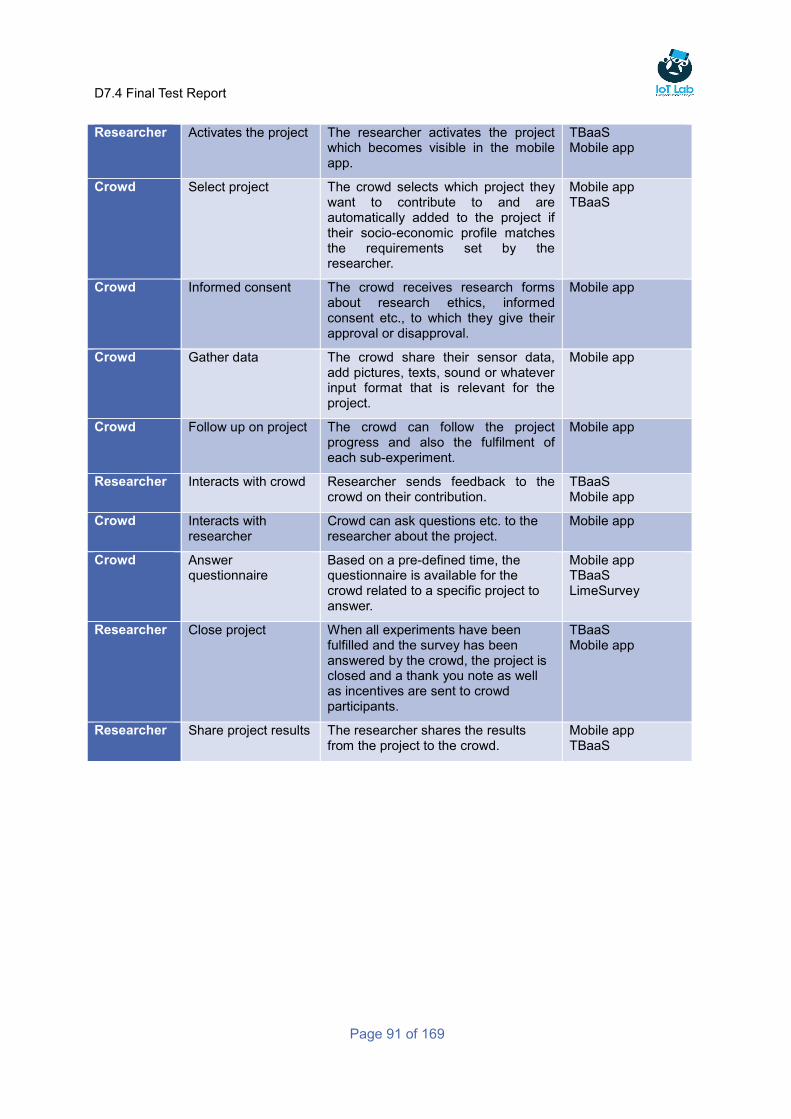
D7.4 Final Test Report
Page 91 of 169
Researcher Activates the project The researcher activates the project which becomes visible in the mobile app.
TBaaS Mobile app
Crowd Select project The crowd selects which project they want to contribute to and are automatically added to the project if their socio-economic profile matches the requirements set by the researcher.
Mobile app TBaaS
Crowd Informed consent The crowd receives research forms about research ethics, informed consent etc., to which they give their approval or disapproval.
Mobile app
Crowd Gather data The crowd share their sensor data, add pictures, texts, sound or whatever input format that is relevant for the project.
Mobile app
Crowd Follow up on project The crowd can follow the project progress and also the fulfilment of each sub-experiment.
Mobile app
Researcher Interacts with crowd Researcher sends feedback to the crowd on their contribution.
TBaaS Mobile app
Crowd Interacts with researcher
Crowd can ask questions etc. to the researcher about the project.
Mobile app
Crowd Answer questionnaire
Based on a pre-defined time, the questionnaire is available for the crowd related to a specific project to answer.
Mobile app TBaaS LimeSurvey
Researcher Close project When all experiments have been fulfilled and the survey has been answered by the crowd, the project is closed and a thank you note as well as incentives are sent to crowd participants.
TBaaS Mobile app
Researcher Share project results The researcher shares the results from the project to the crowd.
Mobile app TBaaS
D7.4 Final Test Report
Page 92 of 169
References and end-notes 11
Age UK. (2011). Living on a low income in later life [online]. Available from:
http://www.ageuk.org.uk/Documents/EN-GB/For-
professionals/Research/Living_on_a_low_income_full_report.pdf?dtrk=true.
Bertini, E., Catarci, T., Dix, A., Gabrelli, S., Kimani, S. and Santucci, G. (2009). Appropriating Heuristic
Evaluation for Mobile Computing. International Journal of Mobile Human Computer Interaction,
Vol. 1, No. 1, pp.20-41.
Dix, A., Finlay, J., Abowd, G. and Beale, R. (1998). Human-Computer Interaction. 2 ed. Europe:
Prentice Hall
Healy, J.D. (2003). ‘Excess winter mortality in Europe: a cross country analysis identifying key risk
factors’. Journal of Epidemiology and Community Health. 57, (10), p784 -789
DWP: Department for Work & Pensions. (2014a). Households Below Average Income [online].
Available from:
https://www.gov.uk/government/uploads/system/uploads/attachment_data/file/325416/households
-below-average-income-1994-1995-2012-2013.pdf [Accessed on 13th November 2014]
DWP: Department for Work & Pensions. (2014b). DWP Winter Fuel Payment Bulletin 2014. [online].
Available from:
https://www.gov.uk/government/uploads/system/uploads/attachment_data/file/355384/First_Relea
se_Sept14_final.pdf
Guntupalli (2014) Fuel or food? A new slant on 'Healthy Choices': Policy Brief: Policy Commission,
Southampton.
Hevner, A. R., March, S. T., Park, J. and Ram, S. (2004). Design Science in Information Systems
Research MIS Quarterly, Vol. 28, No., pp.75-105.
Lloyd, J. (2013) Cold Enough: Excess Winter Deaths, Winter Fuel Payments and the UK’s problem
with the cold [online]. Available from: http://strategicsociety.org.uk/wp-
content/uploads/2013/03/Cold-Enough-Excess-Winter-Deaths-Winter-Fuel-Payments-and-the-
UKs-problem-with-the-cold.pdf.
Marmot Review Team (2011) The Health Impacts of Cold Homes and Fuel Poverty. [online]. Available
from: http://www.foe.co.uk/sites/default/files/downloads/cold_homes_health.pdf.
National Pensioners Convention (2011). Hills Fuel Poverty Review [online]. Available from:
http://npcuk.org/wp-content/uploads/2011/09/NPC-submission-to-the-Hills-Fuel-Poverty-
Review.doc.
Nielsen, J. (2005). Usability 101: Introduction to Usability. Jacob Nielsens Alertbox 2003 [cited 2005-
09-06 2005]. Available from http://useit.com/alertbox/20030825.html.
D7.4 Final Test Report
Page 93 of 169
Preece, J., Rogers, Y. and Sharp, H. (2002). Interaction Design: Beyond Human-Computer Interaction.
New York: Wiley.
Remenyi, D. and Sherwood-Smith, M. (2012). It Investment: Making a Business Case: Routledge.
Rubin, J. (1994). Handbook of Usability Testing - How to Plan, Design and Conduct Effective Tests.
New York: John Wiley & Sons Inc.
Venable, J., Pries-Heje, J. and Baskerville, R. (2016). Feds: A Framework for Evaluation in Design
Science Research. European Journal of Information Systems, Vol. 25, No. 1, pp.77-89.
Venable, J. R., (2006). A Framework for Design Science Research Activities. In proceedings of 2006
Information Resource Managment Association International Conference, 1344, M, K.-P.
Wilkinson, P., Landon, M., Armstrong., Stever, S., McKee, M. and Fletcher, T. (2001). Cold Comfort:
The social and environmental determinants of excess winter deaths in England, 1986 – 96.
[online]. Available from: http://www.jrf.org.uk/sites/files/jrf/jr101-determinants-winter-deaths.pdf.
Wiberg, C. (2003). A Measure of Fun, Extending the Scope of Web Usability. Doctoral Thesis,
Department of Informatics Umeå University, Umeå.
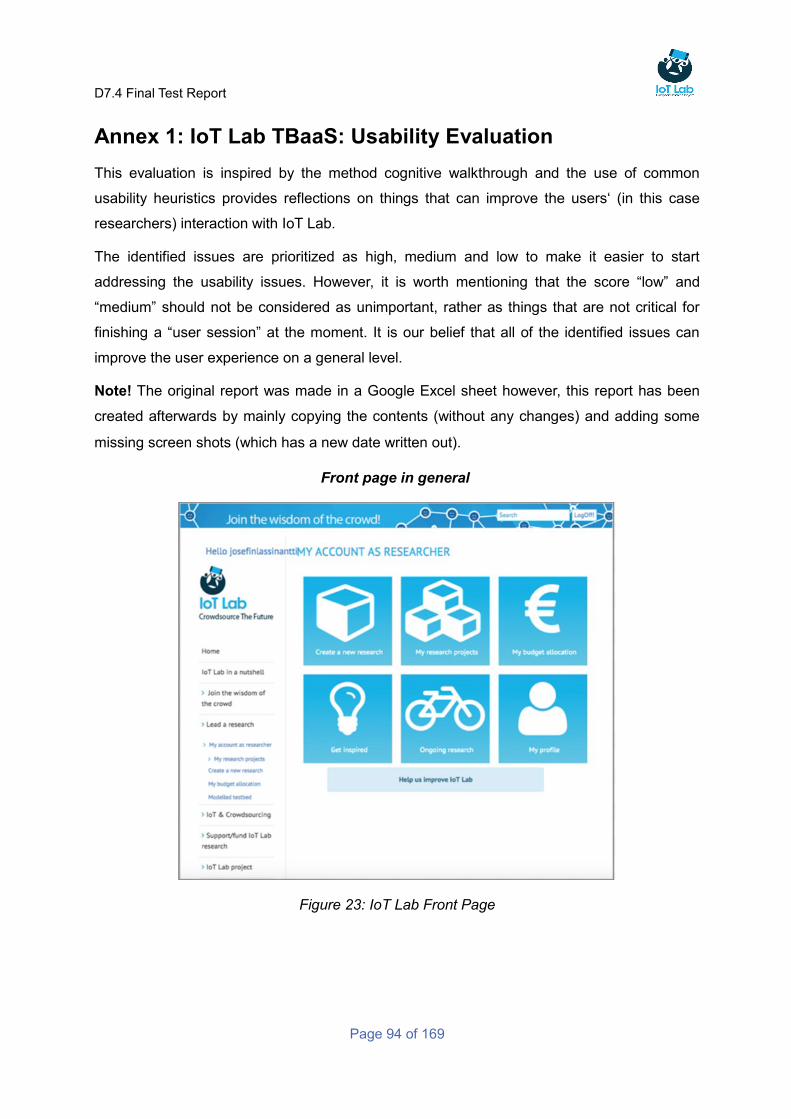
D7.4 Final Test Report
Page 94 of 169
Annex 1: IoT Lab TBaaS: Usability Evaluation
This evaluation is inspired by the method cognitive walkthrough and the use of common
usability heuristics provides reflections on things that can improve the users‘ (in this case
researchers) interaction with IoT Lab.
The identified issues are prioritized as high, medium and low to make it easier to start
addressing the usability issues. However, it is worth mentioning that the score “low” and
“medium” should not be considered as unimportant, rather as things that are not critical for
finishing a “user session” at the moment. It is our belief that all of the identified issues can
improve the user experience on a general level.
Note! The original report was made in a Google Excel sheet however, this report has been
created afterwards by mainly copying the contents (without any changes) and adding some
missing screen shots (which has a new date written out).
Front page in general
Figure 23: IoT Lab Front Page
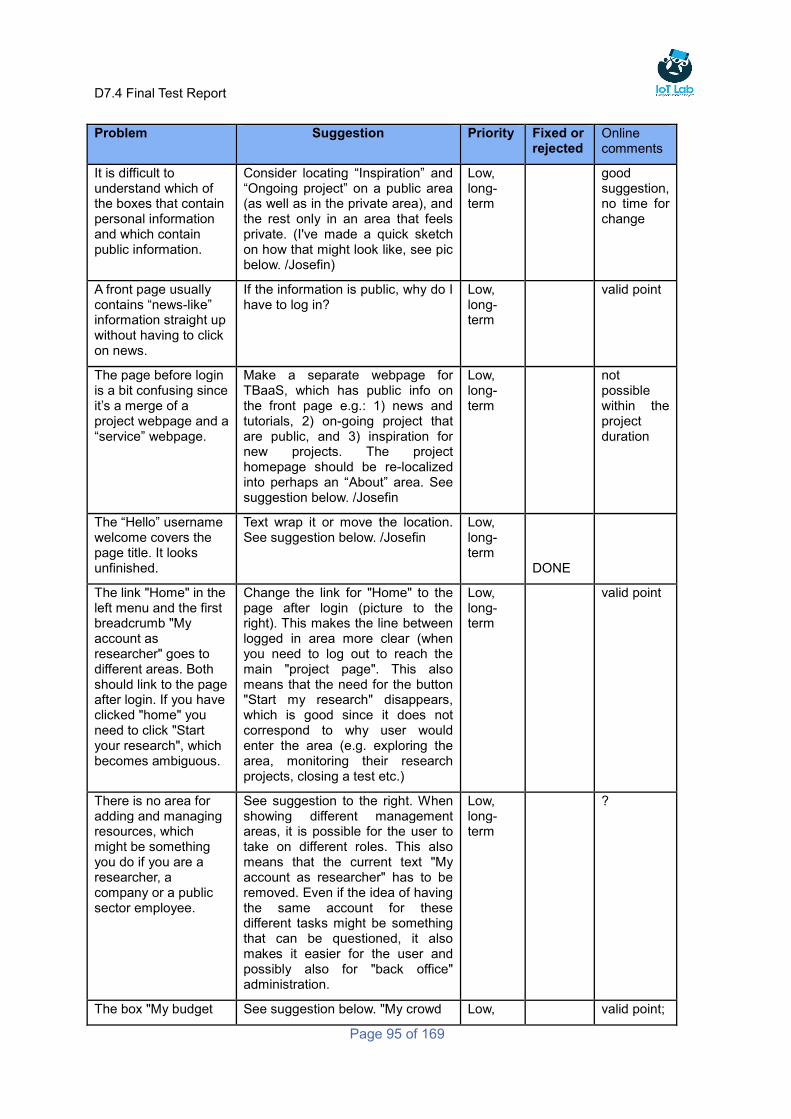
D7.4 Final Test Report
Page 95 of 169
Problem Suggestion Priority Fixed or rejected
Online comments
It is difficult to understand which of the boxes that contain personal information and which contain public information.
Consider locating “Inspiration” and “Ongoing project” on a public area (as well as in the private area), and the rest only in an area that feels private. (I've made a quick sketch on how that might look like, see pic below. /Josefin)
Low, long-term
good suggestion, no time for change
A front page usually contains “news-like” information straight up without having to click on news.
If the information is public, why do I have to log in?
Low, long-term
valid point
The page before login is a bit confusing since it’s a merge of a project webpage and a “service” webpage.
Make a separate webpage for TBaaS, which has public info on the front page e.g.: 1) news and tutorials, 2) on-going project that are public, and 3) inspiration for new projects. The project homepage should be re-localized into perhaps an “About” area. See suggestion below. /Josefin
Low, long-term
not possible within the project duration
The “Hello” username welcome covers the page title. It looks unfinished.
Text wrap it or move the location. See suggestion below. /Josefin
Low, long-term
DONE
The link "Home" in the left menu and the first breadcrumb "My account as researcher" goes to different areas. Both should link to the page after login. If you have clicked "home" you need to click "Start your research", which becomes ambiguous.
Change the link for "Home" to the page after login (picture to the right). This makes the line between logged in area more clear (when you need to log out to reach the main "project page". This also means that the need for the button "Start my research" disappears, which is good since it does not correspond to why user would enter the area (e.g. exploring the area, monitoring their research projects, closing a test etc.)
Low, long-term
valid point
There is no area for adding and managing resources, which might be something you do if you are a researcher, a company or a public sector employee.
See suggestion to the right. When showing different management areas, it is possible for the user to take on different roles. This also means that the current text "My account as researcher" has to be removed. Even if the idea of having the same account for these different tasks might be something that can be questioned, it also makes it easier for the user and possibly also for "back office" administration.
Low, long-term
?
The box "My budget See suggestion below. "My crowd Low, valid point;
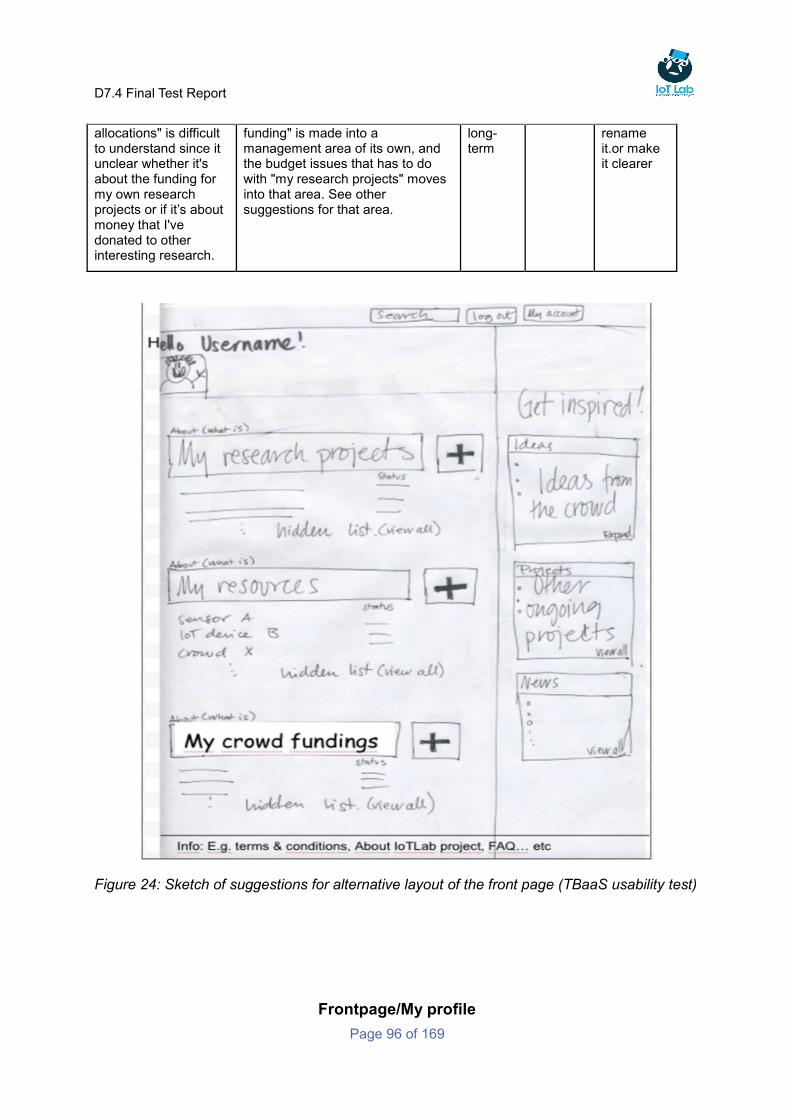
D7.4 Final Test Report
Page 96 of 169
allocations" is difficult to understand since it unclear whether it's about the funding for my own research projects or if it’s about money that I've donated to other interesting research.
funding" is made into a management area of its own, and the budget issues that has to do with "my research projects" moves into that area. See other suggestions for that area.
long-term
rename it.or make it clearer
Figure 24: Sketch of suggestions for alternative layout of the front page (TBaaS usability test)
Frontpage/My profile
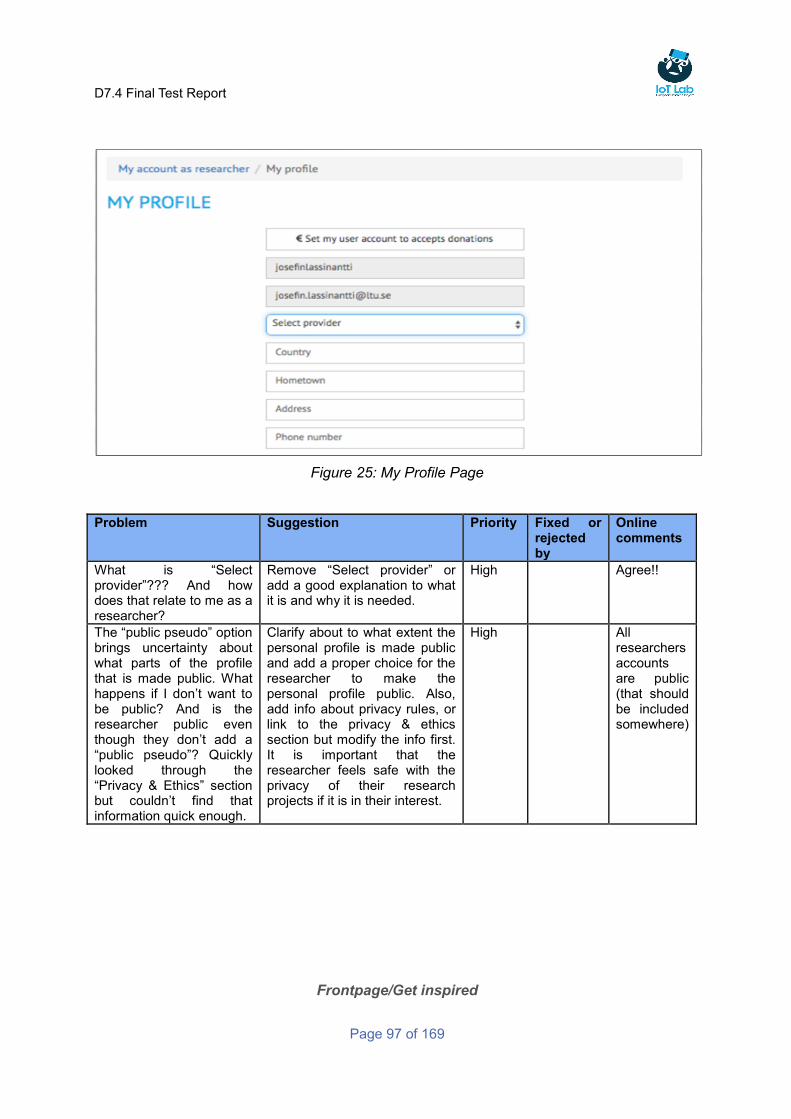
D7.4 Final Test Report
Page 97 of 169
Figure 25: My Profile Page
Problem Suggestion Priority Fixed or rejected by
Online comments
What is “Select provider”??? And how does that relate to me as a researcher?
Remove “Select provider” or add a good explanation to what it is and why it is needed.
High
Agree!!
The “public pseudo” option brings uncertainty about what parts of the profile that is made public. What happens if I don’t want to be public? And is the researcher public even though they don’t add a “public pseudo”? Quickly looked through the “Privacy & Ethics” section but couldn’t find that information quick enough.
Clarify about to what extent the personal profile is made public and add a proper choice for the researcher to make the personal profile public. Also, add info about privacy rules, or link to the privacy & ethics section but modify the info first. It is important that the researcher feels safe with the privacy of their research projects if it is in their interest.
High
All researchers accounts are public (that should be included somewhere)
Frontpage/Get inspired
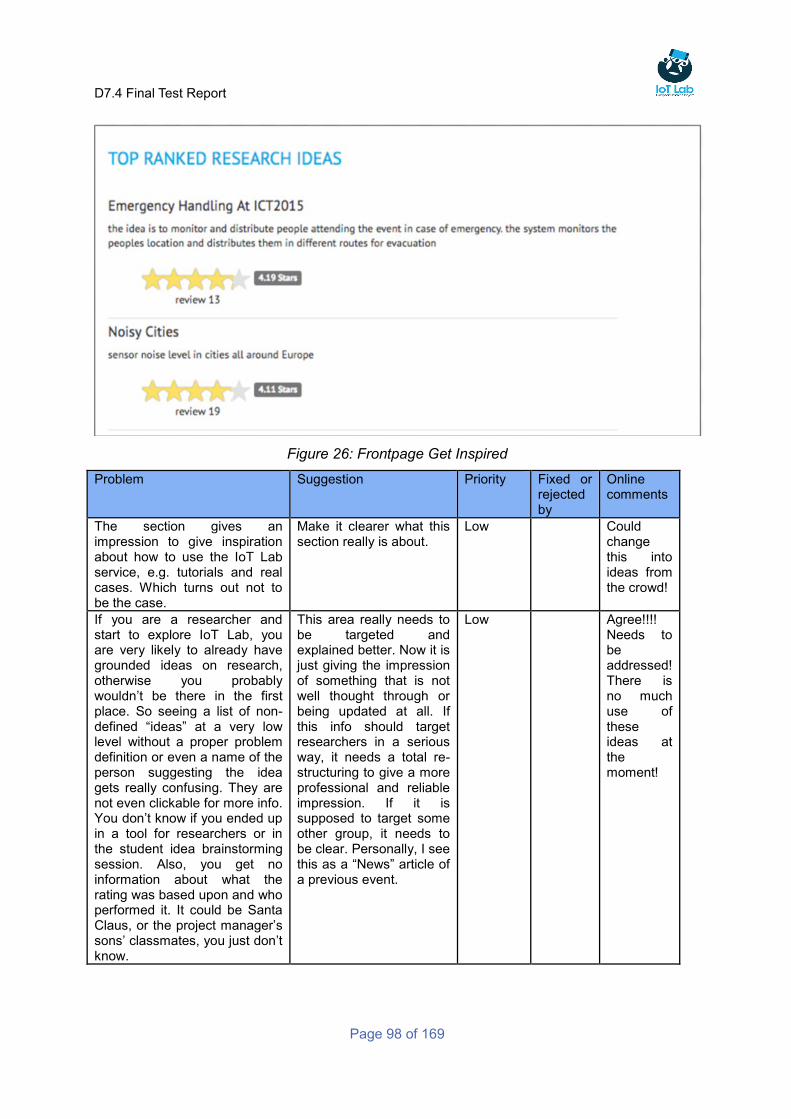
D7.4 Final Test Report
Page 98 of 169
Figure 26: Frontpage Get Inspired
Problem Suggestion Priority Fixed or rejected by
Online comments
The section gives an impression to give inspiration about how to use the IoT Lab service, e.g. tutorials and real cases. Which turns out not to be the case.
Make it clearer what this section really is about.
Low
Could change this into ideas from the crowd!
If you are a researcher and start to explore IoT Lab, you are very likely to already have grounded ideas on research, otherwise you probably wouldn’t be there in the first place. So seeing a list of non-defined “ideas” at a very low level without a proper problem definition or even a name of the person suggesting the idea gets really confusing. They are not even clickable for more info. You don’t know if you ended up in a tool for researchers or in the student idea brainstorming session. Also, you get no information about what the rating was based upon and who performed it. It could be Santa Claus, or the project manager’s sons’ classmates, you just don’t know.
This area really needs to be targeted and explained better. Now it is just giving the impression of something that is not well thought through or being updated at all. If this info should target researchers in a serious way, it needs a total re-structuring to give a more professional and reliable impression. If it is supposed to target some other group, it needs to be clear. Personally, I see this as a “News” article of a previous event.
Low
Agree!!!! Needs to be addressed! There is no much use of these ideas at the moment!
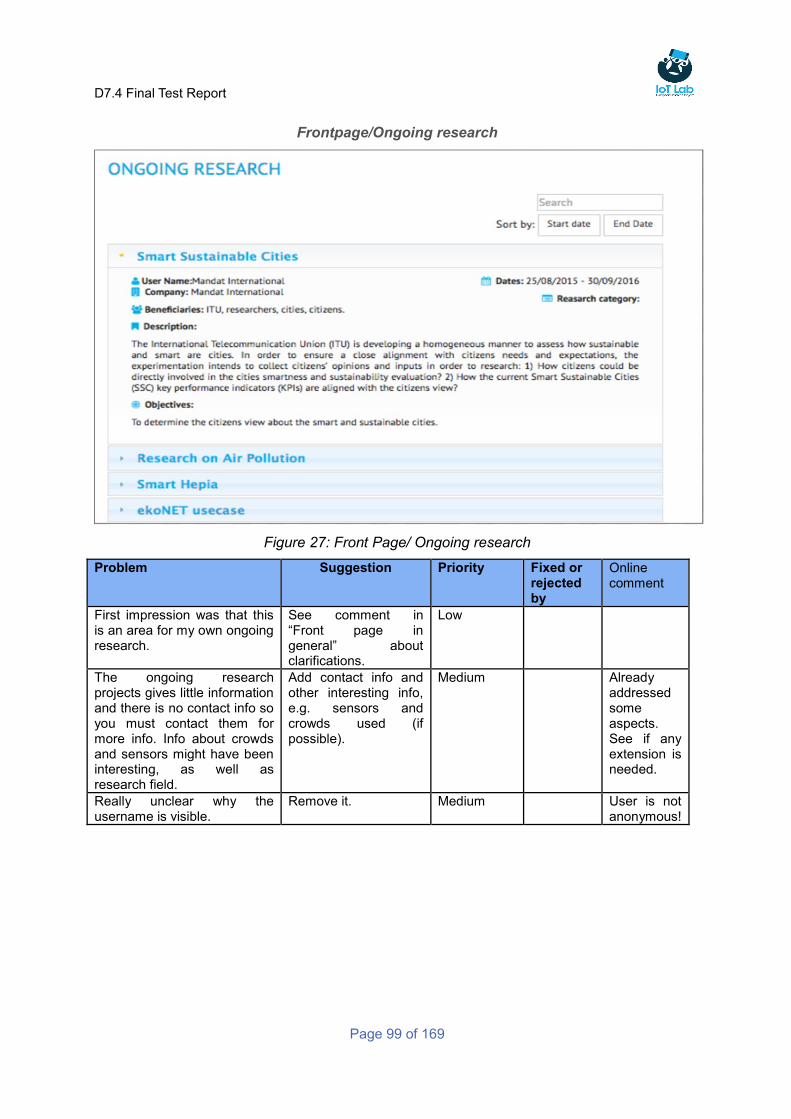
D7.4 Final Test Report
Page 99 of 169
Frontpage/Ongoing research
Figure 27: Front Page/ Ongoing research
Problem Suggestion Priority Fixed or rejected by
Online comment
First impression was that this is an area for my own ongoing research.
See comment in “Front page in general” about clarifications.
Low
The ongoing research projects gives little information and there is no contact info so you must contact them for more info. Info about crowds and sensors might have been interesting, as well as research field.
Add contact info and other interesting info, e.g. sensors and crowds used (if possible).
Medium
Already addressed some aspects. See if any extension is needed.
Really unclear why the username is visible.
Remove it. Medium
User is not anonymous!
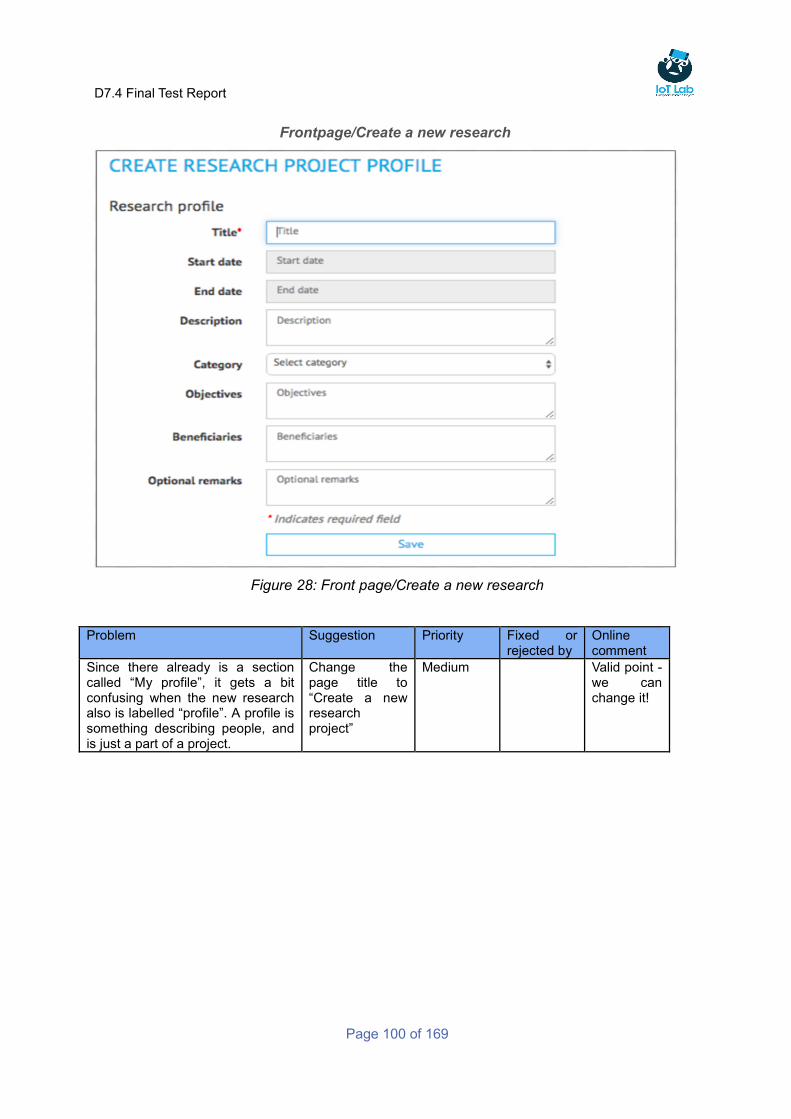
D7.4 Final Test Report
Page 100 of 169
Frontpage/Create a new research
Figure 28: Front page/Create a new research
Problem Suggestion Priority Fixed or rejected by
Online comment
Since there already is a section called “My profile”, it gets a bit confusing when the new research also is labelled “profile”. A profile is something describing people, and is just a part of a project.
Change the page title to “Create a new research project”
Medium
Valid point - we can change it!
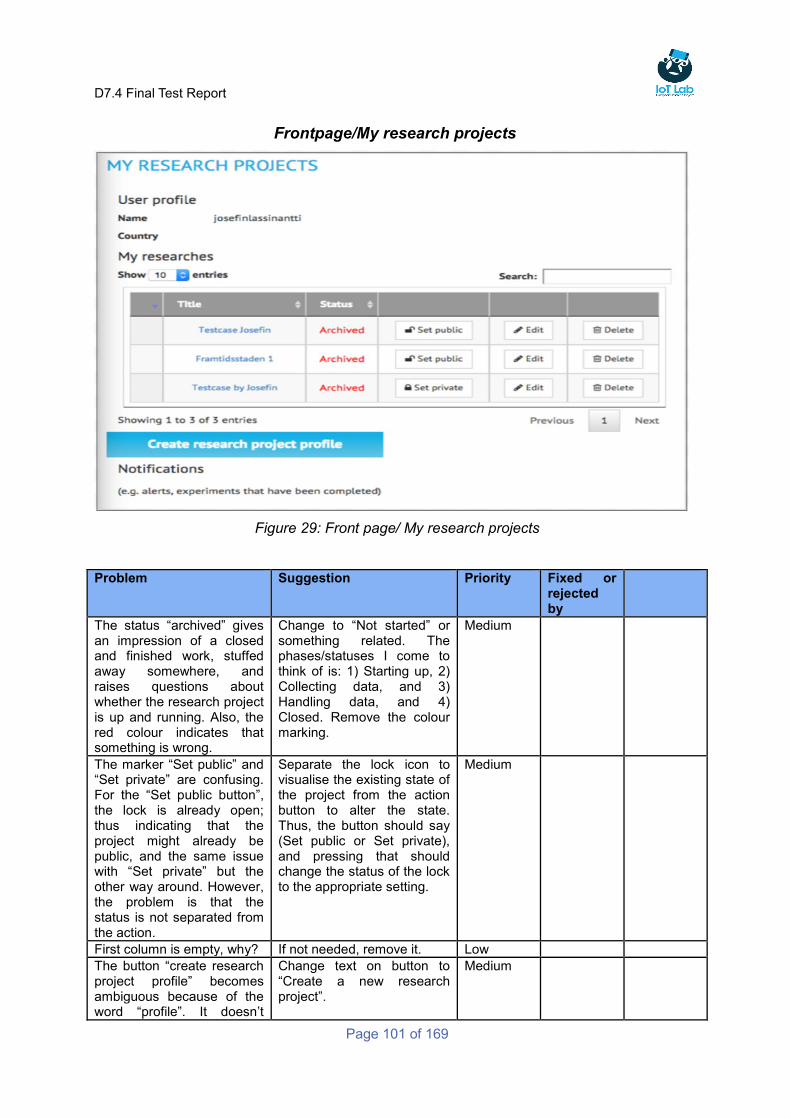
D7.4 Final Test Report
Page 101 of 169
Frontpage/My research projects
Figure 29: Front page/ My research projects
Problem Suggestion Priority Fixed or rejected by
The status “archived” gives an impression of a closed and finished work, stuffed away somewhere, and raises questions about whether the research project is up and running. Also, the red colour indicates that something is wrong.
Change to “Not started” or something related. The phases/statuses I come to think of is: 1) Starting up, 2) Collecting data, and 3) Handling data, and 4) Closed. Remove the colour marking.
Medium
The marker “Set public” and “Set private” are confusing. For the “Set public button”, the lock is already open; thus indicating that the project might already be public, and the same issue with “Set private” but the other way around. However, the problem is that the status is not separated from the action.
Separate the lock icon to visualise the existing state of the project from the action button to alter the state. Thus, the button should say (Set public or Set private), and pressing that should change the status of the lock to the appropriate setting.
Medium
First column is empty, why? If not needed, remove it. Low
The button “create research project profile” becomes ambiguous because of the word “profile”. It doesn’t
Change text on button to “Create a new research project”.
Medium
D7.4 Final Test Report
Page 102 of 169
align with the title of the page saying “My research projects”.
Given the vast amount of work behind a research project, a delete button here almost feels disrespectful.
Consider whether the delete button could be replaced by something resembling a slightly intelligent “closing procedure” accessed from within the project, that makes sure that e.g. data is saved/exported, a report is generated etc.
Low
Meta info about the projects, e.g. dates and persons involved are missing (even though the researcher know it does not work yet). Number of data collections would be interesting, and the researcher wants to open up the entire project or click edit to see this info.
Consider to add one or several columns with some meta information.
Low
At the top, the breadcrumbs states: “My account as a researcher/…” sounding like the researchers profile or some account area the researcher haven’t seen yet, but it links to the start page.
Change to “Home page” or “Start page”.
Medium
Notifications are now located at the bottom of the page, which presents two problems: 1) they won’t be seen if the list of projects are too long, and 2) they are not correlated to the actual project.
Consider removing the current solution and instead add a notification column to the project list. Notifications should then be located far right or far left I think. If many notifications, a notification window can be opened.
Medium
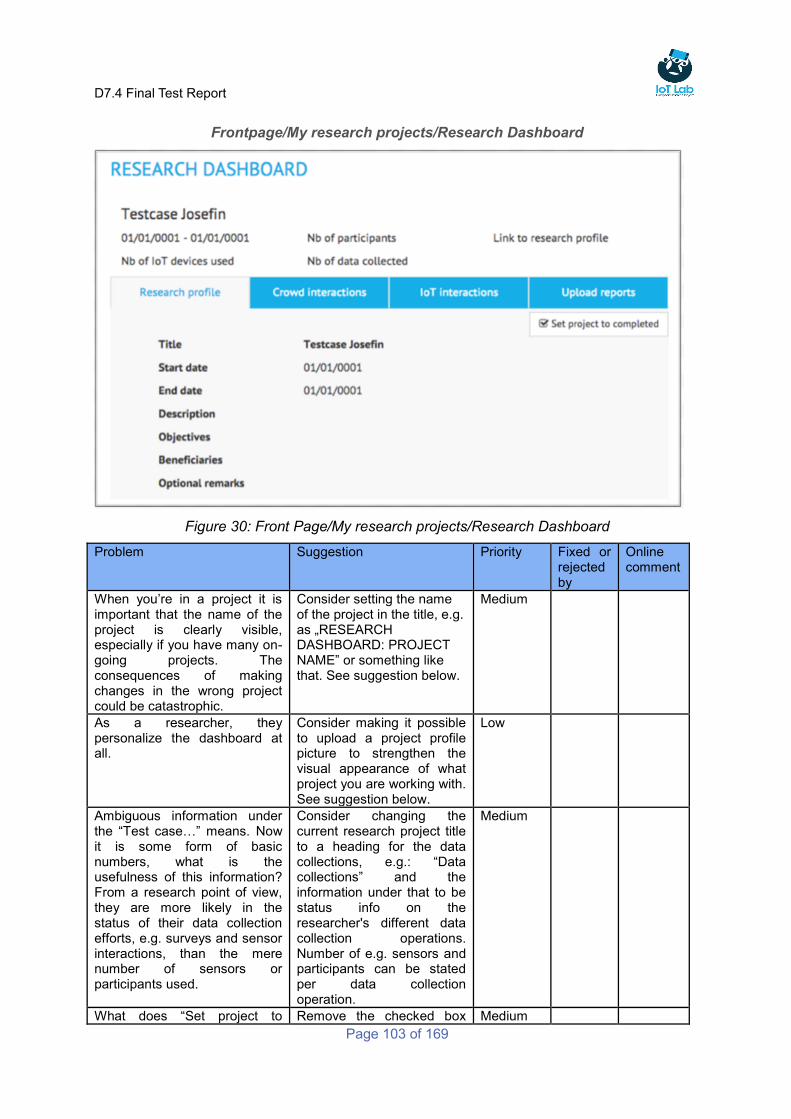
D7.4 Final Test Report
Page 103 of 169
Frontpage/My research projects/Research Dashboard
Figure 30: Front Page/My research projects/Research Dashboard
Problem Suggestion Priority Fixed or rejected by
Online comment
When you’re in a project it is important that the name of the project is clearly visible, especially if you have many on-going projects. The consequences of making changes in the wrong project could be catastrophic.
Consider setting the name of the project in the title, e.g. as „RESEARCH DASHBOARD: PROJECT NAME” or something like that. See suggestion below.
Medium
As a researcher, they personalize the dashboard at all.
Consider making it possible to upload a project profile picture to strengthen the visual appearance of what project you are working with. See suggestion below.
Low
Ambiguous information under the “Test case…” means. Now it is some form of basic numbers, what is the usefulness of this information? From a research point of view, they are more likely in the status of their data collection efforts, e.g. surveys and sensor interactions, than the mere number of sensors or participants used.
Consider changing the current research project title to a heading for the data collections, e.g.: “Data collections” and the information under that to be status info on the researcher's different data collection operations. Number of e.g. sensors and participants can be stated per data collection operation.
Medium
What does “Set project to Remove the checked box Medium
D7.4 Final Test Report
Page 104 of 169
completed” mean? icon in the button. (For a more long-term solution, I would recommend looking into a proper procedure/wizard for closing a research project.)
The “Link to research profile” is almost invisible since it appears to be part of the data collection table. Also it doesn’t work!
Fix the link, make it into a proper button named “Edit research profile” move it to the “Research profile tab, at the top.
High
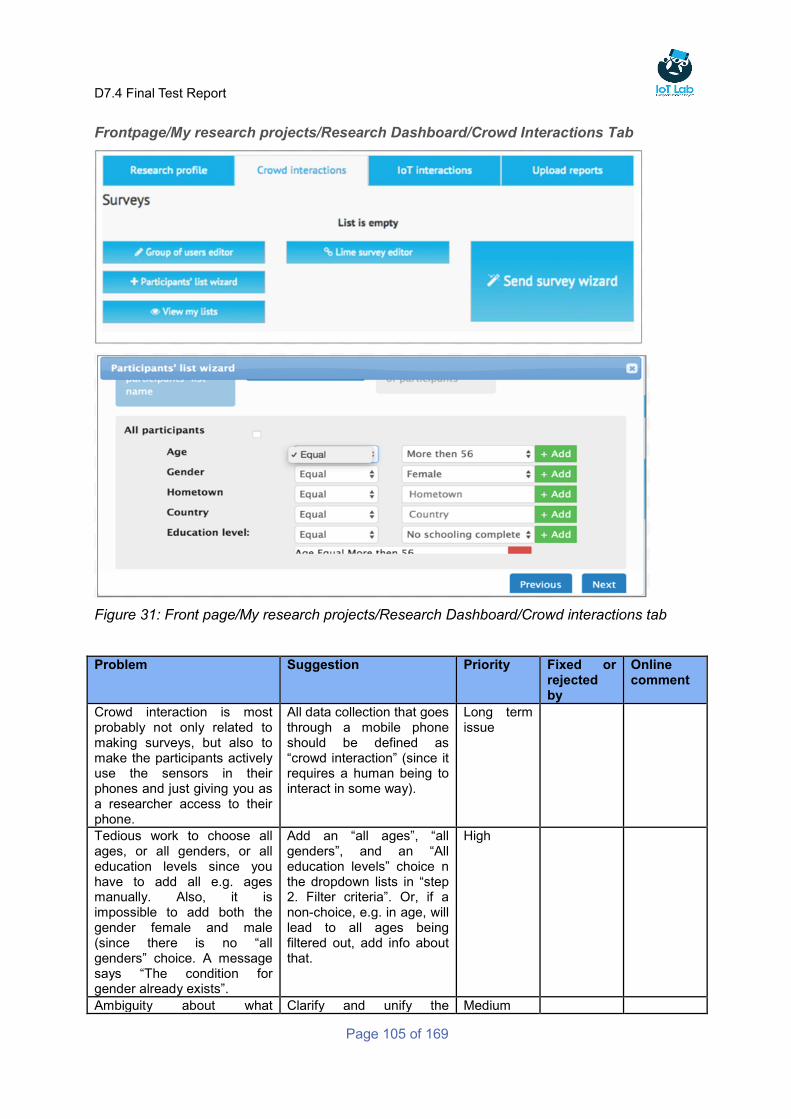
D7.4 Final Test Report
Page 105 of 169
Frontpage/My research projects/Research Dashboard/Crowd Interactions Tab
Figure 31: Front page/My research projects/Research Dashboard/Crowd interactions tab
Problem Suggestion Priority Fixed or rejected by
Online comment
Crowd interaction is most probably not only related to making surveys, but also to make the participants actively use the sensors in their phones and just giving you as a researcher access to their phone.
All data collection that goes through a mobile phone should be defined as “crowd interaction” (since it requires a human being to interact in some way).
Long term issue
Tedious work to choose all ages, or all genders, or all education levels since you have to add all e.g. ages manually. Also, it is impossible to add both the gender female and male (since there is no “all genders” choice. A message says “The condition for gender already exists”.
Add an “all ages”, “all genders”, and an “All education levels” choice n the dropdown lists in “step 2. Filter criteria”. Or, if a non-choice, e.g. in age, will lead to all ages being filtered out, add info about that.
High
Ambiguity about what Clarify and unify the Medium
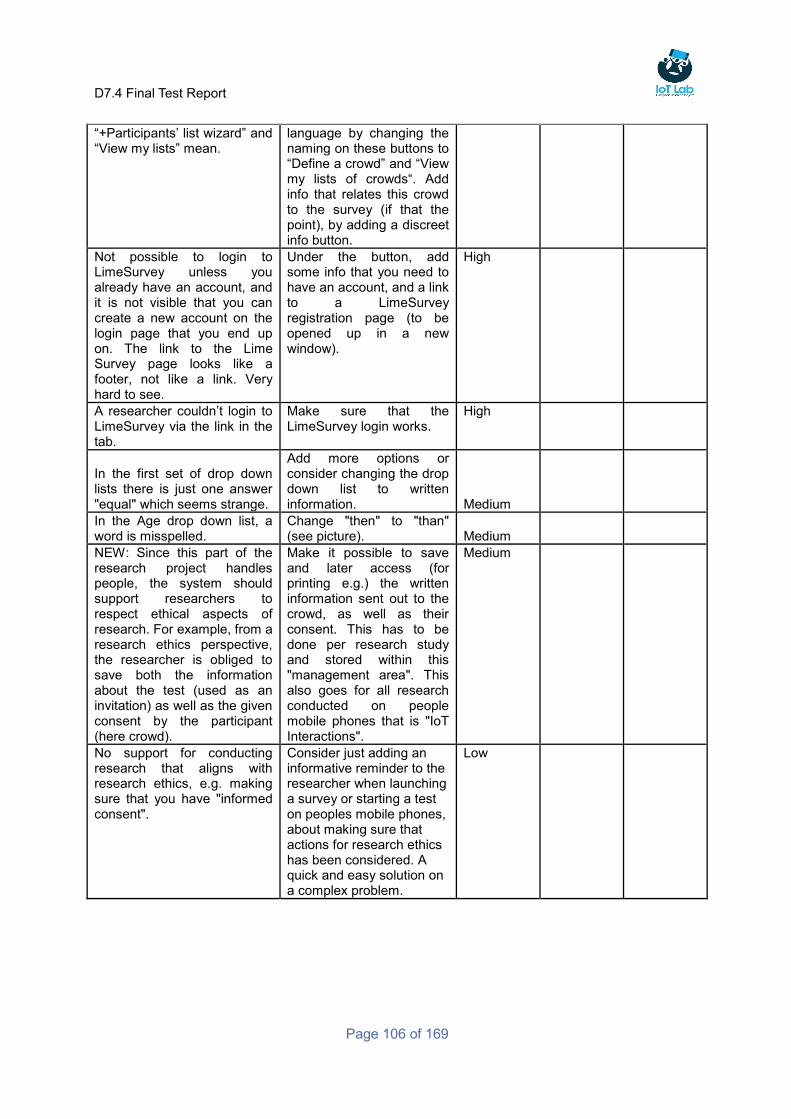
D7.4 Final Test Report
Page 106 of 169
“+Participants’ list wizard” and “View my lists” mean.
language by changing the naming on these buttons to “Define a crowd” and “View my lists of crowds“. Add info that relates this crowd to the survey (if that the point), by adding a discreet info button.
Not possible to login to LimeSurvey unless you already have an account, and it is not visible that you can create a new account on the login page that you end up on. The link to the Lime Survey page looks like a footer, not like a link. Very hard to see.
Under the button, add some info that you need to have an account, and a link to a LimeSurvey registration page (to be opened up in a new window).
High
A researcher couldn’t login to LimeSurvey via the link in the tab.
Make sure that the LimeSurvey login works.
High
In the first set of drop down lists there is just one answer "equal" which seems strange.
Add more options or consider changing the drop down list to written information. Medium
In the Age drop down list, a word is misspelled.
Change "then" to "than" (see picture). Medium
NEW: Since this part of the research project handles people, the system should support researchers to respect ethical aspects of research. For example, from a research ethics perspective, the researcher is obliged to save both the information about the test (used as an invitation) as well as the given consent by the participant (here crowd).
Make it possible to save and later access (for printing e.g.) the written information sent out to the crowd, as well as their consent. This has to be done per research study and stored within this "management area". This also goes for all research conducted on people mobile phones that is "IoT Interactions".
Medium
No support for conducting research that aligns with research ethics, e.g. making sure that you have "informed consent".
Consider just adding an informative reminder to the researcher when launching a survey or starting a test on peoples mobile phones, about making sure that actions for research ethics has been considered. A quick and easy solution on a complex problem.
Low
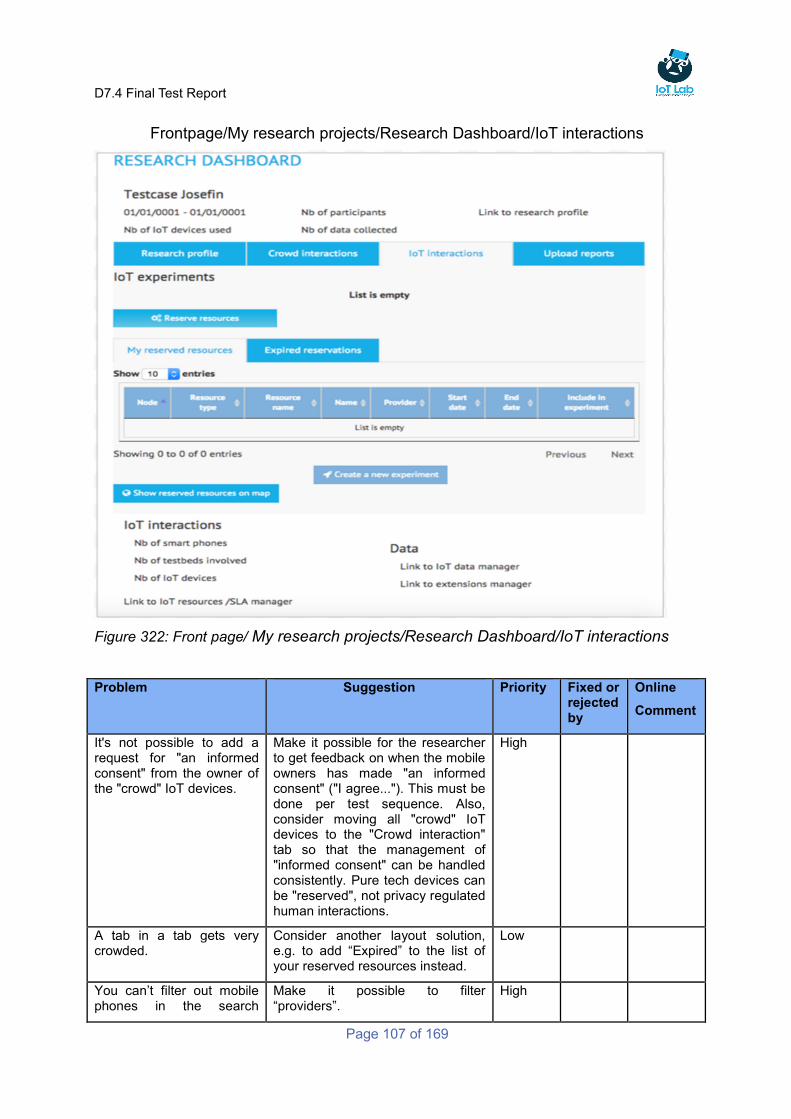
D7.4 Final Test Report
Page 107 of 169
Frontpage/My research projects/Research Dashboard/IoT interactions
Figure 322: Front page/ My research projects/Research Dashboard/IoT interactions
Problem Suggestion Priority Fixed or rejected by
Online
Comment
It's not possible to add a request for "an informed consent" from the owner of the "crowd" IoT devices.
Make it possible for the researcher to get feedback on when the mobile owners has made "an informed consent" ("I agree..."). This must be done per test sequence. Also, consider moving all "crowd" IoT devices to the "Crowd interaction" tab so that the management of "informed consent" can be handled consistently. Pure tech devices can be "reserved", not privacy regulated human interactions.
High
A tab in a tab gets very crowded.
Consider another layout solution, e.g. to add “Expired” to the list of your reserved resources instead.
Low
You can’t filter out mobile phones in the search
Make it possible to filter “providers”.
High
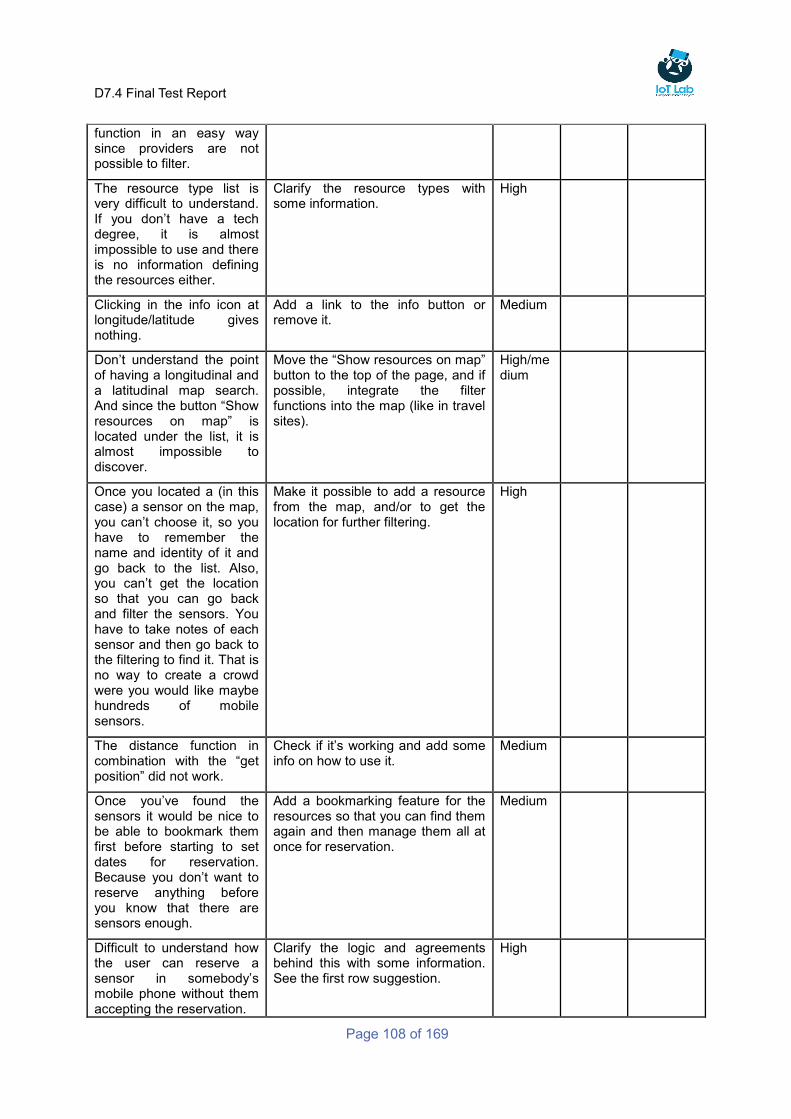
D7.4 Final Test Report
Page 108 of 169
function in an easy way since providers are not possible to filter.
The resource type list is very difficult to understand. If you don’t have a tech degree, it is almost impossible to use and there is no information defining the resources either.
Clarify the resource types with some information.
High
Clicking in the info icon at longitude/latitude gives nothing.
Add a link to the info button or remove it.
Medium
Don’t understand the point of having a longitudinal and a latitudinal map search. And since the button “Show resources on map” is located under the list, it is almost impossible to discover.
Move the “Show resources on map” button to the top of the page, and if possible, integrate the filter functions into the map (like in travel sites).
High/medium
Once you located a (in this case) a sensor on the map, you can’t choose it, so you have to remember the name and identity of it and go back to the list. Also, you can’t get the location so that you can go back and filter the sensors. You have to take notes of each sensor and then go back to the filtering to find it. That is no way to create a crowd were you would like maybe hundreds of mobile sensors.
Make it possible to add a resource from the map, and/or to get the location for further filtering.
High
The distance function in combination with the “get position” did not work.
Check if it’s working and add some info on how to use it.
Medium
Once you’ve found the sensors it would be nice to be able to bookmark them first before starting to set dates for reservation. Because you don’t want to reserve anything before you know that there are sensors enough.
Add a bookmarking feature for the resources so that you can find them again and then manage them all at once for reservation.
Medium
Difficult to understand how the user can reserve a sensor in somebody’s mobile phone without them accepting the reservation.
Clarify the logic and agreements behind this with some information. See the first row suggestion.
High
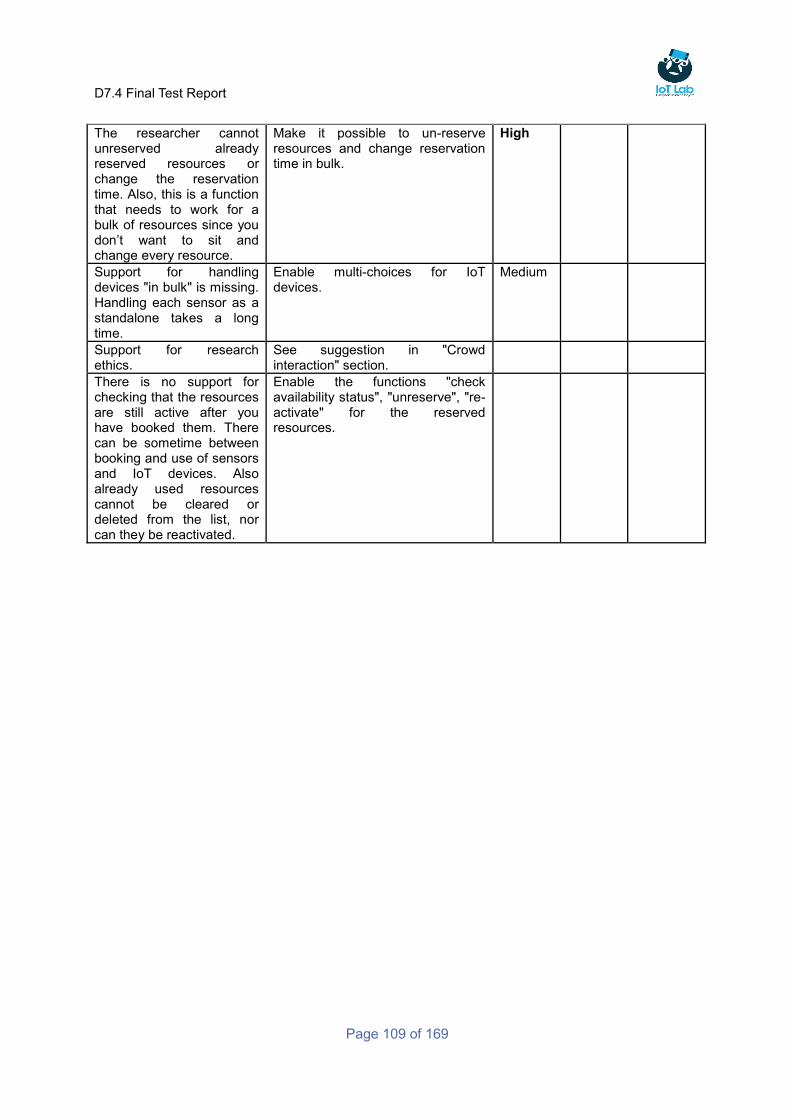
D7.4 Final Test Report
Page 109 of 169
The researcher cannot unreserved already reserved resources or change the reservation time. Also, this is a function that needs to work for a bulk of resources since you don’t want to sit and change every resource.
Make it possible to un-reserve resources and change reservation time in bulk.
High
Support for handling devices "in bulk" is missing. Handling each sensor as a standalone takes a long time.
Enable multi-choices for IoT devices.
Medium
Support for research ethics.
See suggestion in "Crowd interaction" section.
There is no support for checking that the resources are still active after you have booked them. There can be sometime between booking and use of sensors and IoT devices. Also already used resources cannot be cleared or deleted from the list, nor can they be reactivated.
Enable the functions "check availability status", "unreserve", "re-activate" for the reserved resources.
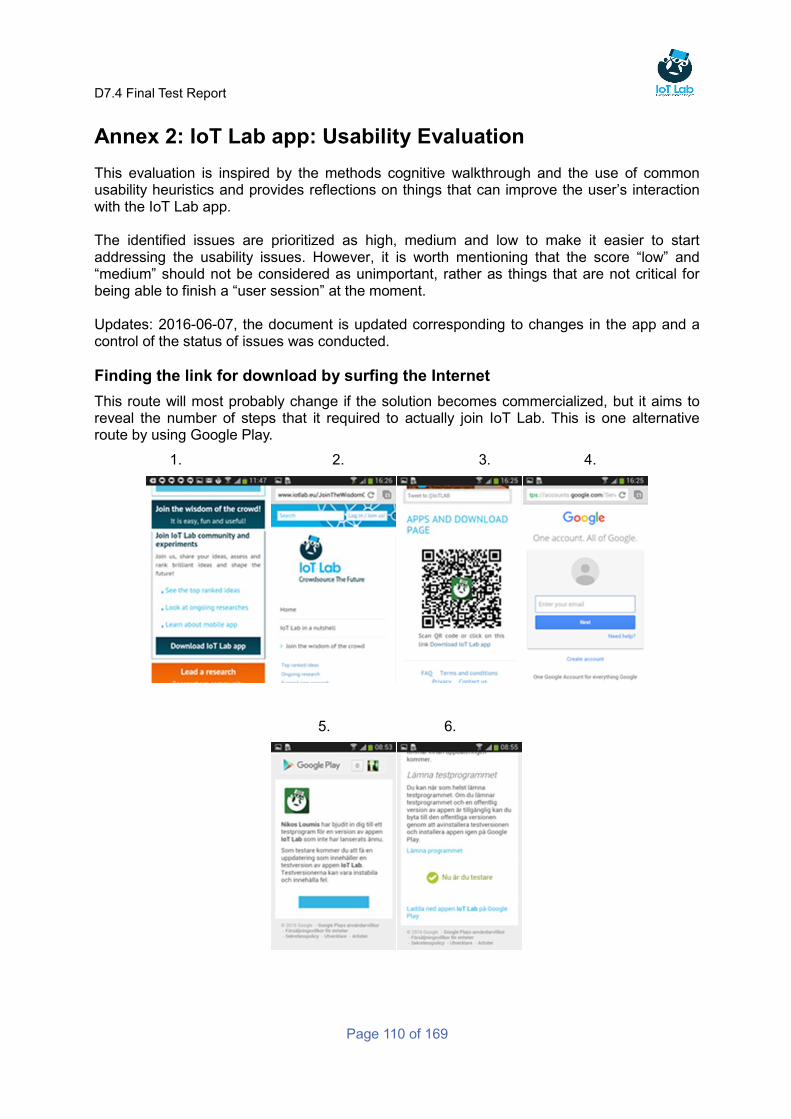
D7.4 Final Test Report
Page 110 of 169
Annex 2: IoT Lab app: Usability Evaluation
This evaluation is inspired by the methods cognitive walkthrough and the use of common usability heuristics and provides reflections on things that can improve the user’s interaction with the IoT Lab app. The identified issues are prioritized as high, medium and low to make it easier to start addressing the usability issues. However, it is worth mentioning that the score “low” and “medium” should not be considered as unimportant, rather as things that are not critical for being able to finish a “user session” at the moment. Updates: 2016-06-07, the document is updated corresponding to changes in the app and a control of the status of issues was conducted.
Finding the link for download by surfing the Internet
This route will most probably change if the solution becomes commercialized, but it aims to reveal the number of steps that it required to actually join IoT Lab. This is one alternative route by using Google Play.
1. 2. 3. 4.
5. 6.
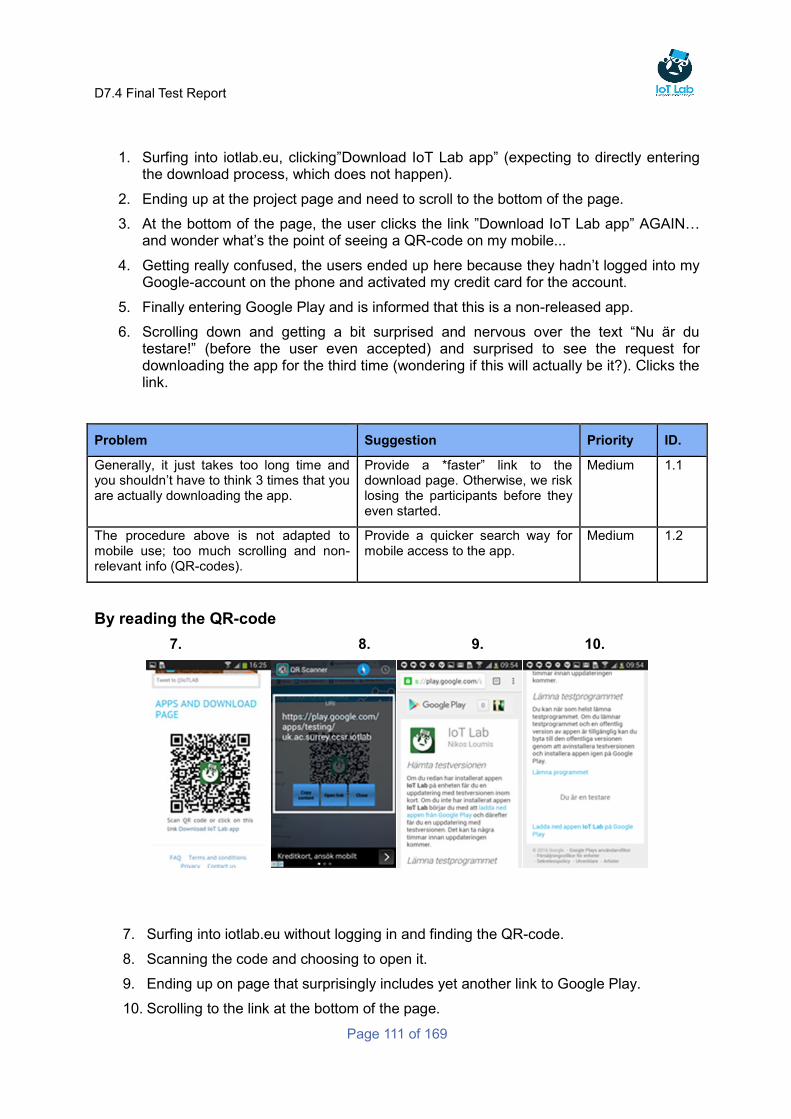
D7.4 Final Test Report
Page 111 of 169
1. Surfing into iotlab.eu, clicking”Download IoT Lab app” (expecting to directly entering the download process, which does not happen).
2. Ending up at the project page and need to scroll to the bottom of the page.
3. At the bottom of the page, the user clicks the link ”Download IoT Lab app” AGAIN… and wonder what’s the point of seeing a QR-code on my mobile...
4. Getting really confused, the users ended up here because they hadn’t logged into my Google-account on the phone and activated my credit card for the account.
5. Finally entering Google Play and is informed that this is a non-released app.
6. Scrolling down and getting a bit surprised and nervous over the text “Nu är du testare!” (before the user even accepted) and surprised to see the request for downloading the app for the third time (wondering if this will actually be it?). Clicks the link.
Problem Suggestion Priority ID.
Generally, it just takes too long time and you shouldn’t have to think 3 times that you are actually downloading the app.
Provide a *faster” link to the download page. Otherwise, we risk losing the participants before they even started.
Medium 1.1
The procedure above is not adapted to mobile use; too much scrolling and non-relevant info (QR-codes).
Provide a quicker search way for mobile access to the app.
Medium 1.2
By reading the QR-code
7. 8. 9. 10.
7. Surfing into iotlab.eu without logging in and finding the QR-code.
8. Scanning the code and choosing to open it.
9. Ending up on page that surprisingly includes yet another link to Google Play.
10. Scrolling to the link at the bottom of the page.
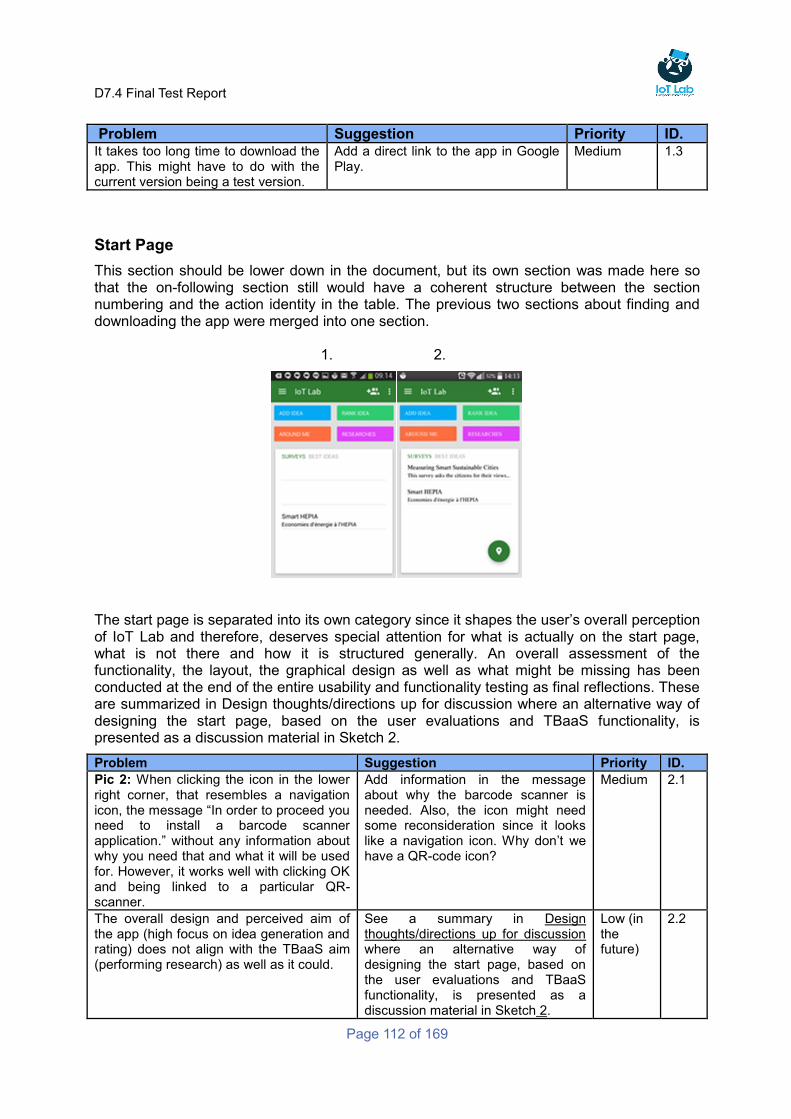
D7.4 Final Test Report
Page 112 of 169
Problem Suggestion Priority ID. It takes too long time to download the app. This might have to do with the current version being a test version.
Add a direct link to the app in Google Play.
Medium 1.3
Start Page
This section should be lower down in the document, but its own section was made here so that the on-following section still would have a coherent structure between the section numbering and the action identity in the table. The previous two sections about finding and downloading the app were merged into one section. 1. 2.
The start page is separated into its own category since it shapes the user’s overall perception of IoT Lab and therefore, deserves special attention for what is actually on the start page, what is not there and how it is structured generally. An overall assessment of the functionality, the layout, the graphical design as well as what might be missing has been conducted at the end of the entire usability and functionality testing as final reflections. These are summarized in Design thoughts/directions up for discussion where an alternative way of designing the start page, based on the user evaluations and TBaaS functionality, is presented as a discussion material in Sketch 2.
Problem Suggestion Priority ID.
Pic 2: When clicking the icon in the lower right corner, that resembles a navigation icon, the message “In order to proceed you need to install a barcode scanner application.” without any information about why you need that and what it will be used for. However, it works well with clicking OK and being linked to a particular QR-scanner.
Add information in the message about why the barcode scanner is needed. Also, the icon might need some reconsideration since it looks like a navigation icon. Why don’t we have a QR-code icon?
Medium 2.1
The overall design and perceived aim of the app (high focus on idea generation and rating) does not align with the TBaaS aim (performing research) as well as it could.
See a summary in Design thoughts/directions up for discussion where an alternative way of designing the start page, based on the user evaluations and TBaaS functionality, is presented as a discussion material in Sketch 2.
Low (in the future)
2.2
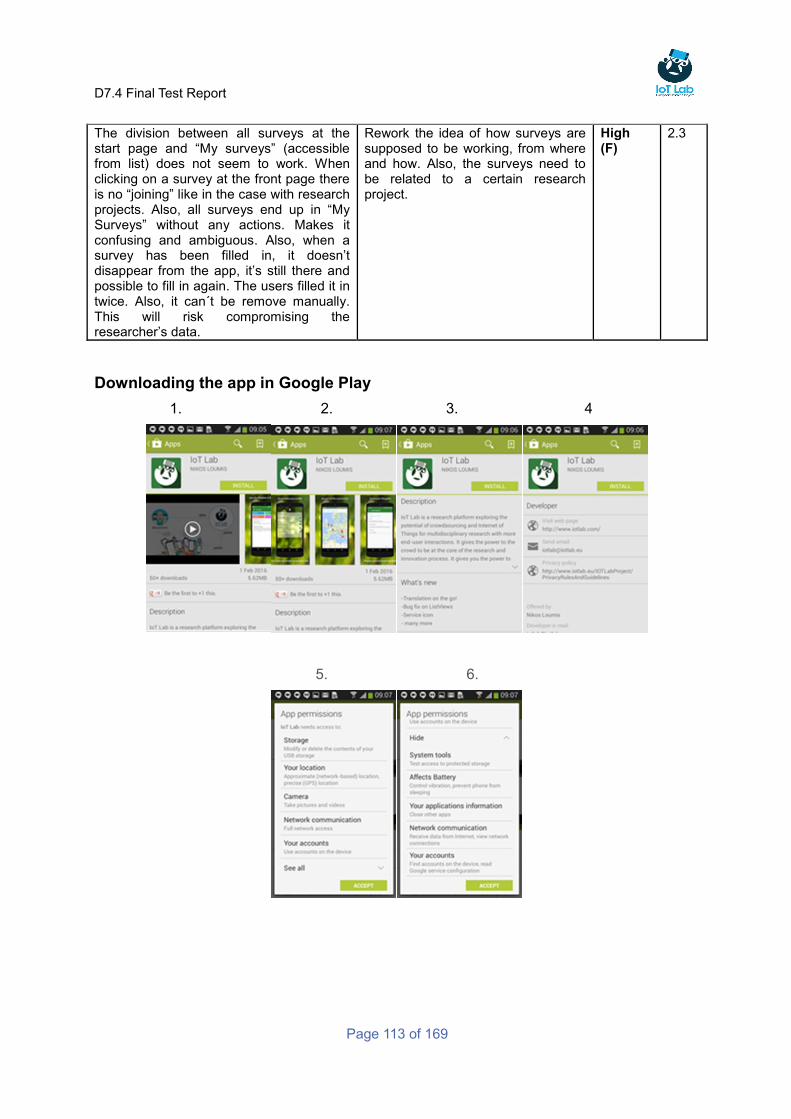
D7.4 Final Test Report
Page 113 of 169
The division between all surveys at the start page and “My surveys” (accessible from list) does not seem to work. When clicking on a survey at the front page there is no “joining” like in the case with research projects. Also, all surveys end up in “My Surveys” without any actions. Makes it confusing and ambiguous. Also, when a survey has been filled in, it doesn’t disappear from the app, it’s still there and possible to fill in again. The users filled it in twice. Also, it can´t be remove manually. This will risk compromising the researcher’s data.
Rework the idea of how surveys are supposed to be working, from where and how. Also, the surveys need to be related to a certain research project.
High (F)
2.3
Downloading the app in Google Play
1. 2. 3. 4
5. 6.
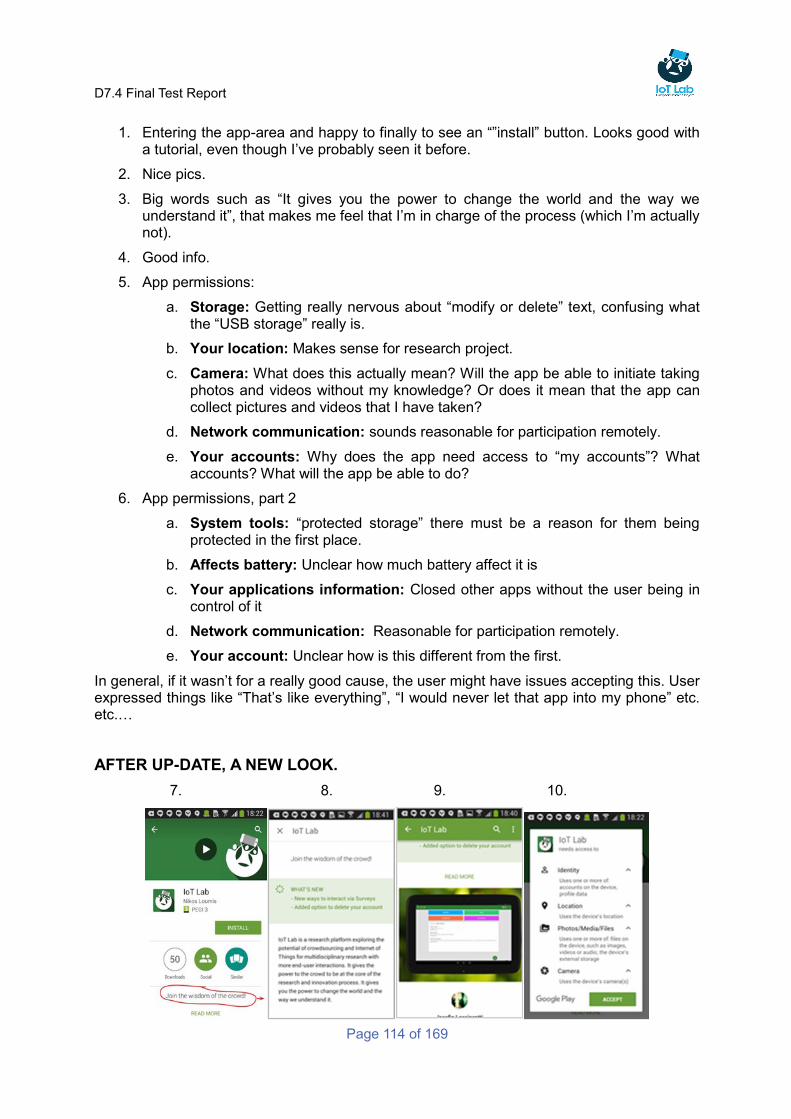
D7.4 Final Test Report
Page 114 of 169
1. Entering the app-area and happy to finally to see an “”install” button. Looks good with a tutorial, even though I’ve probably seen it before.
2. Nice pics.
3. Big words such as “It gives you the power to change the world and the way we understand it”, that makes me feel that I’m in charge of the process (which I’m actually not).
4. Good info.
5. App permissions:
a. Storage: Getting really nervous about “modify or delete” text, confusing what the “USB storage” really is.
b. Your location: Makes sense for research project.
c. Camera: What does this actually mean? Will the app be able to initiate taking photos and videos without my knowledge? Or does it mean that the app can collect pictures and videos that I have taken?
d. Network communication: sounds reasonable for participation remotely.
e. Your accounts: Why does the app need access to “my accounts”? What accounts? What will the app be able to do?
6. App permissions, part 2
a. System tools: “protected storage” there must be a reason for them being protected in the first place.
b. Affects battery: Unclear how much battery affect it is
c. Your applications information: Closed other apps without the user being in control of it
d. Network communication: Reasonable for participation remotely.
e. Your account: Unclear how is this different from the first.
In general, if it wasn’t for a really good cause, the user might have issues accepting this. User expressed things like “That’s like everything”, “I would never let that app into my phone” etc. etc.…
AFTER UP-DATE, A NEW LOOK.
7. 8. 9. 10.
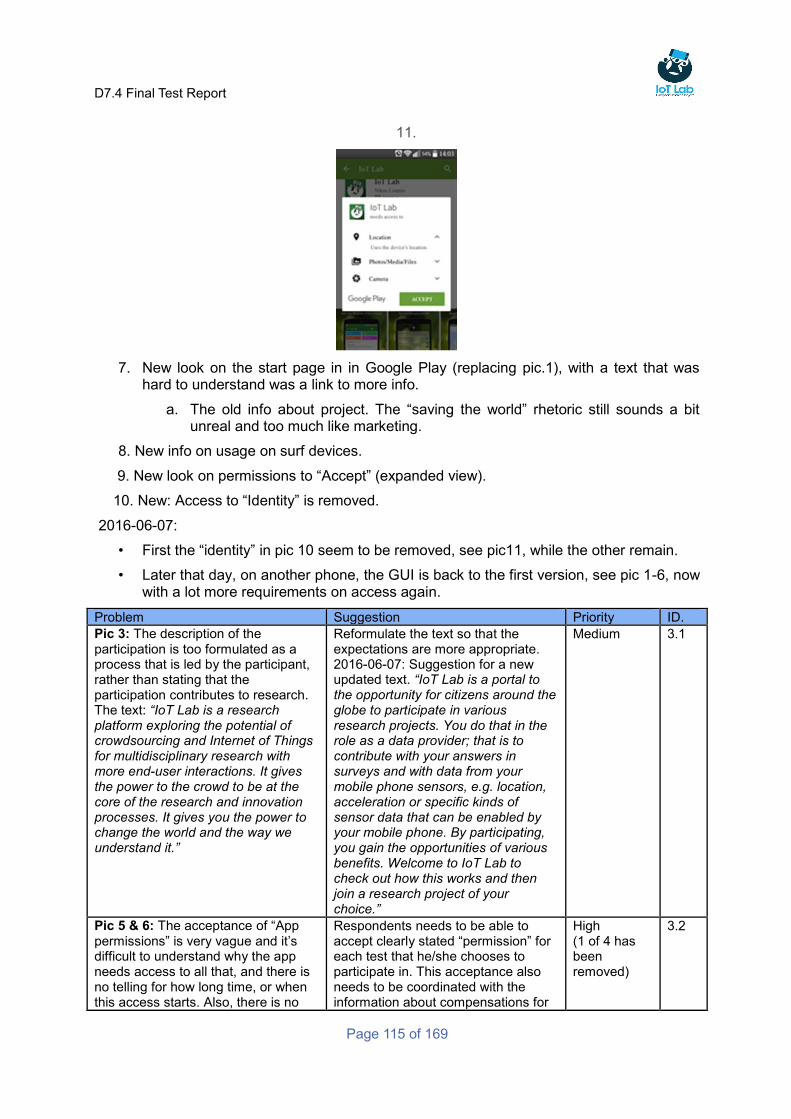
D7.4 Final Test Report
Page 115 of 169
11.
7. New look on the start page in in Google Play (replacing pic.1), with a text that was hard to understand was a link to more info.
a. The old info about project. The “saving the world” rhetoric still sounds a bit unreal and too much like marketing.
8. New info on usage on surf devices.
9. New look on permissions to “Accept” (expanded view).
10. New: Access to “Identity” is removed.
2016-06-07:
• First the “identity” in pic 10 seem to be removed, see pic11, while the other remain.
• Later that day, on another phone, the GUI is back to the first version, see pic 1-6, now with a lot more requirements on access again.
Problem Suggestion Priority ID.
Pic 3: The description of the participation is too formulated as a process that is led by the participant, rather than stating that the participation contributes to research. The text: “IoT Lab is a research platform exploring the potential of crowdsourcing and Internet of Things for multidisciplinary research with more end-user interactions. It gives the power to the crowd to be at the core of the research and innovation processes. It gives you the power to change the world and the way we understand it.”
Reformulate the text so that the expectations are more appropriate. 2016-06-07: Suggestion for a new updated text. “IoT Lab is a portal to the opportunity for citizens around the globe to participate in various research projects. You do that in the role as a data provider; that is to contribute with your answers in surveys and with data from your mobile phone sensors, e.g. location, acceleration or specific kinds of sensor data that can be enabled by your mobile phone. By participating, you gain the opportunities of various benefits. Welcome to IoT Lab to check out how this works and then join a research project of your choice.”
Medium 3.1
Pic 5 & 6: The acceptance of “App permissions” is very vague and it’s difficult to understand why the app needs access to all that, and there is no telling for how long time, or when this access starts. Also, there is no
Respondents needs to be able to accept clearly stated “permission” for each test that he/she chooses to participate in. This acceptance also needs to be coordinated with the information about compensations for
High (1 of 4 has been removed)
3.2
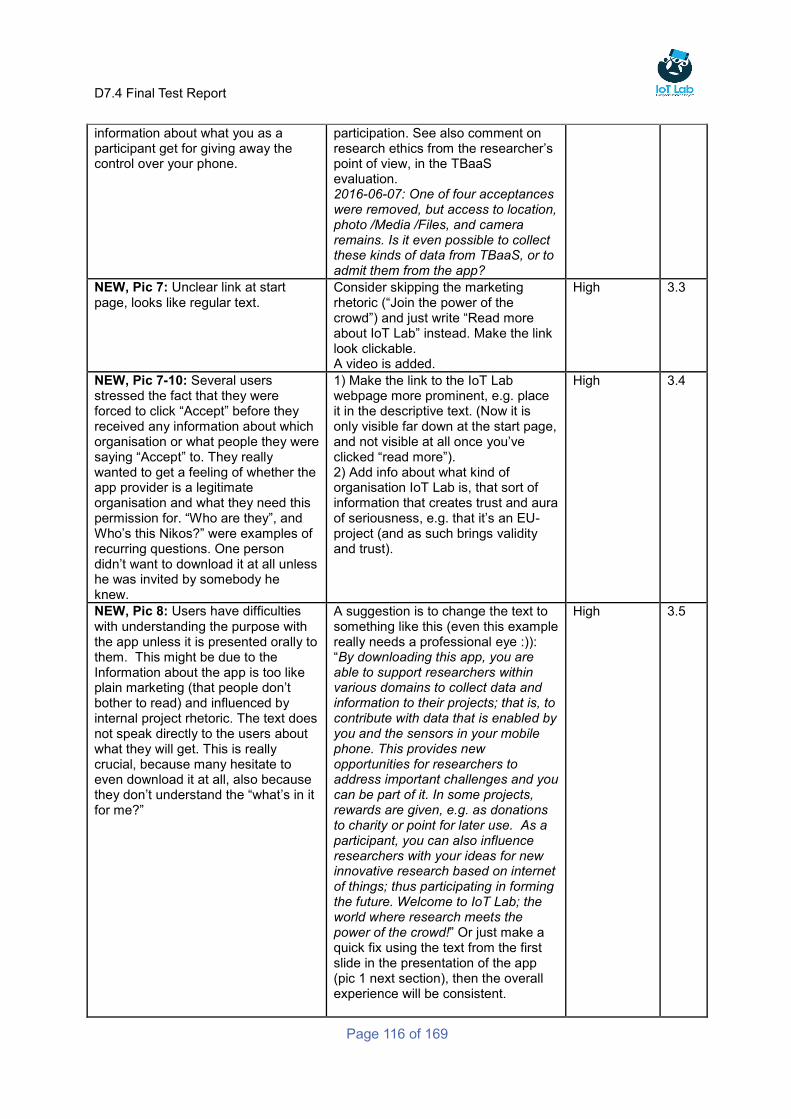
D7.4 Final Test Report
Page 116 of 169
information about what you as a participant get for giving away the control over your phone.
participation. See also comment on research ethics from the researcher’s point of view, in the TBaaS evaluation. 2016-06-07: One of four acceptances were removed, but access to location, photo /Media /Files, and camera remains. Is it even possible to collect these kinds of data from TBaaS, or to admit them from the app?
NEW, Pic 7: Unclear link at start page, looks like regular text.
Consider skipping the marketing rhetoric (“Join the power of the crowd”) and just write “Read more about IoT Lab” instead. Make the link look clickable. A video is added.
High
3.3
NEW, Pic 7-10: Several users stressed the fact that they were forced to click “Accept” before they received any information about which organisation or what people they were saying “Accept” to. They really wanted to get a feeling of whether the app provider is a legitimate organisation and what they need this permission for. “Who are they”, and Who’s this Nikos?” were examples of recurring questions. One person didn’t want to download it at all unless he was invited by somebody he knew.
1) Make the link to the IoT Lab webpage more prominent, e.g. place it in the descriptive text. (Now it is only visible far down at the start page, and not visible at all once you’ve clicked “read more”). 2) Add info about what kind of organisation IoT Lab is, that sort of information that creates trust and aura of seriousness, e.g. that it’s an EU-project (and as such brings validity and trust).
High 3.4
NEW, Pic 8: Users have difficulties with understanding the purpose with the app unless it is presented orally to them. This might be due to the Information about the app is too like plain marketing (that people don’t bother to read) and influenced by internal project rhetoric. The text does not speak directly to the users about what they will get. This is really crucial, because many hesitate to even download it at all, also because they don’t understand the “what’s in it for me?”
A suggestion is to change the text to something like this (even this example really needs a professional eye :)): “By downloading this app, you are able to support researchers within various domains to collect data and information to their projects; that is, to contribute with data that is enabled by you and the sensors in your mobile phone. This provides new opportunities for researchers to address important challenges and you can be part of it. In some projects, rewards are given, e.g. as donations to charity or point for later use. As a participant, you can also influence researchers with your ideas for new innovative research based on internet of things; thus participating in forming the future. Welcome to IoT Lab; the world where research meets the power of the crowd!” Or just make a quick fix using the text from the first slide in the presentation of the app (pic 1 next section), then the overall experience will be consistent.
High 3.5
D7.4 Final Test Report
Page 117 of 169
NEW, Pic 7-10: Several users pointed out the requested access to the photo library and camera felt very inappropriate and was way beyond what they thought was OK. Pictures are personal and private. It was considered ok thought to take pictures with the camera that related to the research topic when requested to do so, but not to give away permission in general.
Investigate whether it is really needed to request permission to camera and photo library upfront.
Medium 3.6
NEW, Pic 7-10: Two users pointed out that it was strange that the acceptance came before the ethical principles.
Consider revising that order. Medium 3.7
Examples on user feedback
One person said that he would be “really careful” when downloading this app because of all the permissions
requested.
• “If someone I personally knew (or trusted) asked me to participate I would. I would never participate in random projects, or even download the app on my own initiative. Unless maybe if it was for some project that I perceived could potentially help society (a lot of individuals, for example refugees, children). Never, under any circumstances, would I actively participate if the research was beneficiary to a private company for example.”
• The request to access the camera and photo library really evoked strong feelings about invading their privacy, and one user (experienced in management of IoT projects) said that the design felt “unplanned” and “not thought through”.
• “Privacy issue is at the centre of my concern and I think individual has two choices, either he/she ought not to use modern technology or face the consequence of privacy breach. I don´t really believe in the guarantee proclaimed by the developers to defend my privacy, even this app. But I dare participate anyway. “
• A social science researcher said this about the app when asked to consider both perspectives; crowd and researcher: “I cannot see a situation where I personally would download this app and participate, what´s in it for me? If someone would ask me I perhaps would consider it, especially if it was someone I knew. The app is designed as if I would have on my own initiative would have downloaded it (actively searching for research project to participate in), which is a situation I cannot see myself in as I explained. I would like to have had it more adapted to participation as a respondent. The complete layout is based on someone who actively would download it, which would mean that the researcher loses control over who participates. There is nothing in the app preventing me from entering incorrect data. I could state that I am a 57-year-old female, while I´m in reality could be a 16-year-old male.”
• About motivation for contributing: “I think it is a matter of curiosity in the first place and I believe it might develop my knowledge and scope of horizon.”
• Discussions with social science users also reveal that doing research on people in a business company context is highly likely to render higher requirements on privacy, that is, these respondents might be restrained by company rules on permitting access to mobiles that contain company information such as correspondence, access points to internal systems etc.
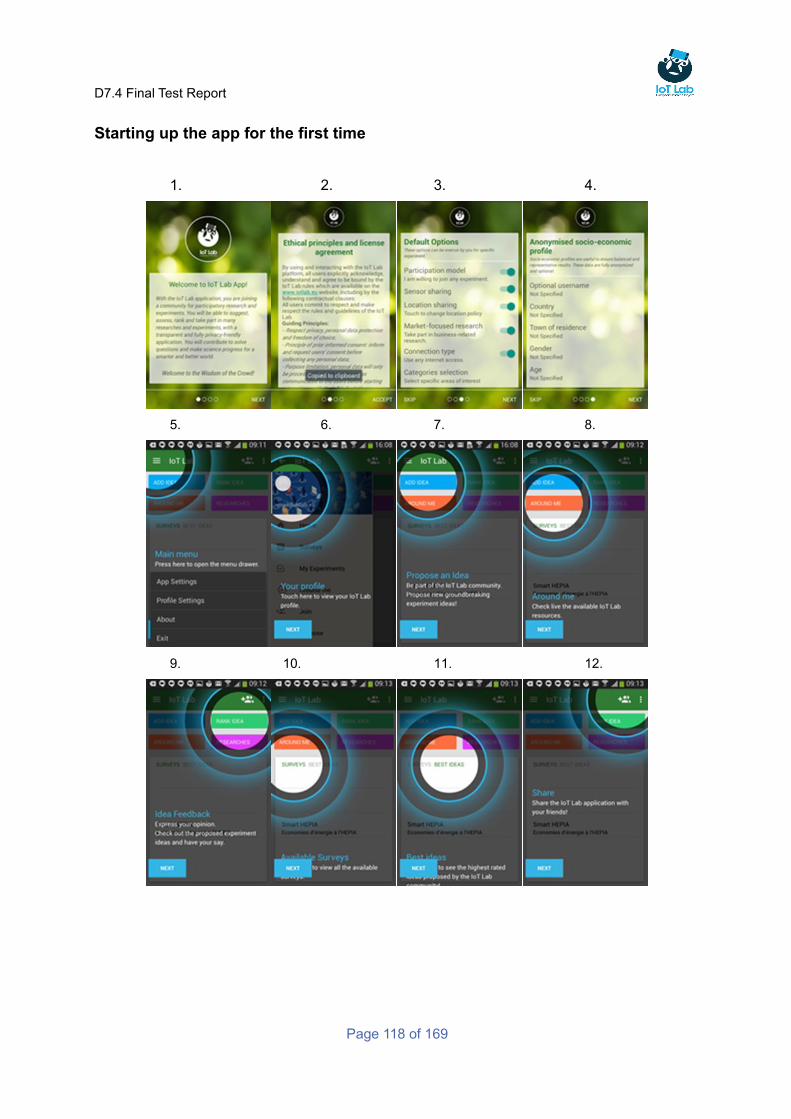
D7.4 Final Test Report
Page 118 of 169
Starting up the app for the first time
1. 2. 3. 4.
5. 6. 7. 8.
9. 10. 11. 12.
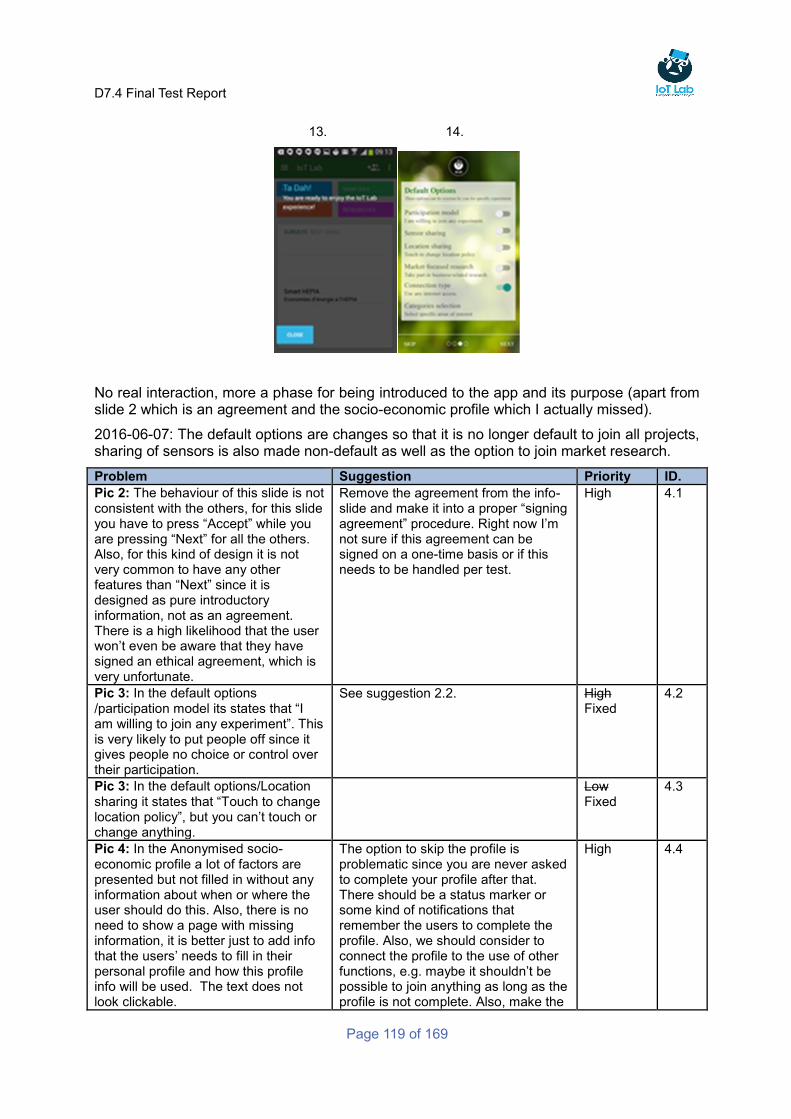
D7.4 Final Test Report
Page 119 of 169
13. 14.
No real interaction, more a phase for being introduced to the app and its purpose (apart from slide 2 which is an agreement and the socio-economic profile which I actually missed).
2016-06-07: The default options are changes so that it is no longer default to join all projects, sharing of sensors is also made non-default as well as the option to join market research.
Problem Suggestion Priority ID.
Pic 2: The behaviour of this slide is not consistent with the others, for this slide you have to press “Accept” while you are pressing “Next” for all the others. Also, for this kind of design it is not very common to have any other features than “Next” since it is designed as pure introductory information, not as an agreement. There is a high likelihood that the user won’t even be aware that they have signed an ethical agreement, which is very unfortunate.
Remove the agreement from the info-slide and make it into a proper “signing agreement” procedure. Right now I’m not sure if this agreement can be signed on a one-time basis or if this needs to be handled per test.
High 4.1
Pic 3: In the default options /participation model its states that “I am willing to join any experiment”. This is very likely to put people off since it gives people no choice or control over their participation.
See suggestion 2.2. High Fixed
4.2
Pic 3: In the default options/Location sharing it states that “Touch to change location policy”, but you can’t touch or change anything.
Low Fixed
4.3
Pic 4: In the Anonymised socio-economic profile a lot of factors are presented but not filled in without any information about when or where the user should do this. Also, there is no need to show a page with missing information, it is better just to add info that the users’ needs to fill in their personal profile and how this profile info will be used. The text does not look clickable.
The option to skip the profile is problematic since you are never asked to complete your profile after that. There should be a status marker or some kind of notifications that remember the users to complete the profile. Also, we should consider to connect the profile to the use of other functions, e.g. maybe it shouldn’t be possible to join anything as long as the profile is not complete. Also, make the
High 4.4
D7.4 Final Test Report
Page 120 of 169
text in the profile look like it's clickable and changeable.
Pic 5-13: Although the design is very appealing and nice, the info and order of the slides presents some problems for the users. First, by setting the “Propose an idea” as the first slide, it gives the impression of being the main purpose of the app (which it’s not). Second, it says nothing about joining a research project (which is the key aim), and the research button is not displayed at all. Lastly, it talks only about surveys and not about experiments (which is the wording mentioned in the start-up and description of the app). Altogether, the purpose of the app is confusing (also, see user feedback below). A general question: Does experiments equal sensor data? If not, we will need to be clear about the difference between experiments and surveys.
Add a slide for the research button. Text needs to be revised to include both survey and experiments in all introductory information. In general, the app needs to align more with TBaaS in that the app is primarily for participating in research by contributing with data. Idea generation and ranking is secondary.
Medium 4.5
Pic 10 & 11: The “Next button” is covering the text.
Move the position of the text. Low 4.6
NEW, Pic 3: One user pointed out that it might be illegal to make a “pre-set” of choices, and compared that to doing that in regular sales (that is, if you as a consumer need to make an active choice to say no to the offering/pre-settings to avoid buying something) is forbidden at least in Sweden.
Check if this is true. High Fixed
4.7
NEW Pic 4: Users had problems understanding the word “socio-economic”. Also, it doesn’t correlate to the wordings in the app “Profile setting”, which also contains a lot more settings than what is shown here in the info-slide.
1) Change to both to “Personal profile” to make it more clear what it really about that is corresponding to the socio-economic profile a researcher needs. 2) Also consider making a separate “Mobile settings” (or something similar) for the setting that relate to battery time, etc.
Medium 4.8
Pic 14: When writing the country, it done manually, not from a dropdown lists, which is likely to cause problems in the later database search of respondents (by TBaaS users) due to the possibility of spelling errors and such. Also it takes a bit too long time to have to click twice to be able to get the keyboard visible.
Change manual input of a country to a pre-made dropdown list, which is both faster, reduces cognitive load and errors. Make the keyboard appear directly when one option is chosen for editing and include automated capitalisation of words.
High 4.9
Pic 4: 1) There is no save function for the socio-economic profile, nor is it connected to some sort of account, which means that if the user deletes
Change the skip/next button to a save button if the profile is filled in. It makes the user have control over the process. And when the profile is saved, a message something like:
Medium 4.10
D7.4 Final Test Report
Page 121 of 169
the app and downloads it again, the data transmitted in various projects risk being worthless since it will be impossible to connect the user to their data again. 2) Then they are seen as a new user by the system. Also, it is possible to click the “skip” button when the profile is filled in, even though the data is saved in the app.
“Your profile is now saved, but you can access it again from the upper right corner and change and add information.”
Examples on user feedback
“After installing it I do not think that I would think twice about privacy. The only thing is if it would be possible for other users to gather data from me without me knowing about it. If I was promised that data was only collected to projects I have approved to be a part of I would not think twice about it.”
In general, people like the design on the “spotlight” presentation. Even though many of them instinctively tries to click the screen on pic 6 :)
When asked about the perceived aim with the app: “This app for the those who would like to set up IoT based experiments and for those who would like to take part in research …”
About the app in general: “I think it is a bit privacy invasive. I am sure (or not) it is anonymised but probably info has been presented once you set up an account. I don’t remember if I saw that info since I installed it a long [time] ago but tried to [access] privacy info on the app again and could not…"
After going through the app and its functions, one user concludes: “To me the app is designed as something I am supposed to use. This is confusing since I thought that the app would be focused on gathering data. If I accept participating in a research project I would like the app to convey this, and have a more “passive” design. The current design gives me a false sense of being able to initiate research or similar. To me the app is just a “gateway” to the information that the device can share, as well as answering the occasional survey or leaving comments/answering interview questions.”
One user described that he thought he was going to see a much simpler app, just stating that “Welcome, you’ve been invited to participate in a research project” and that the app should evolve through that experience in a much more concise way. In this, he also reflected on that it seemed like the app was made too complex (because users are very picky with time) and the TBaaS was made too simple (researchers on the other hand have time to elaborate and try out things).
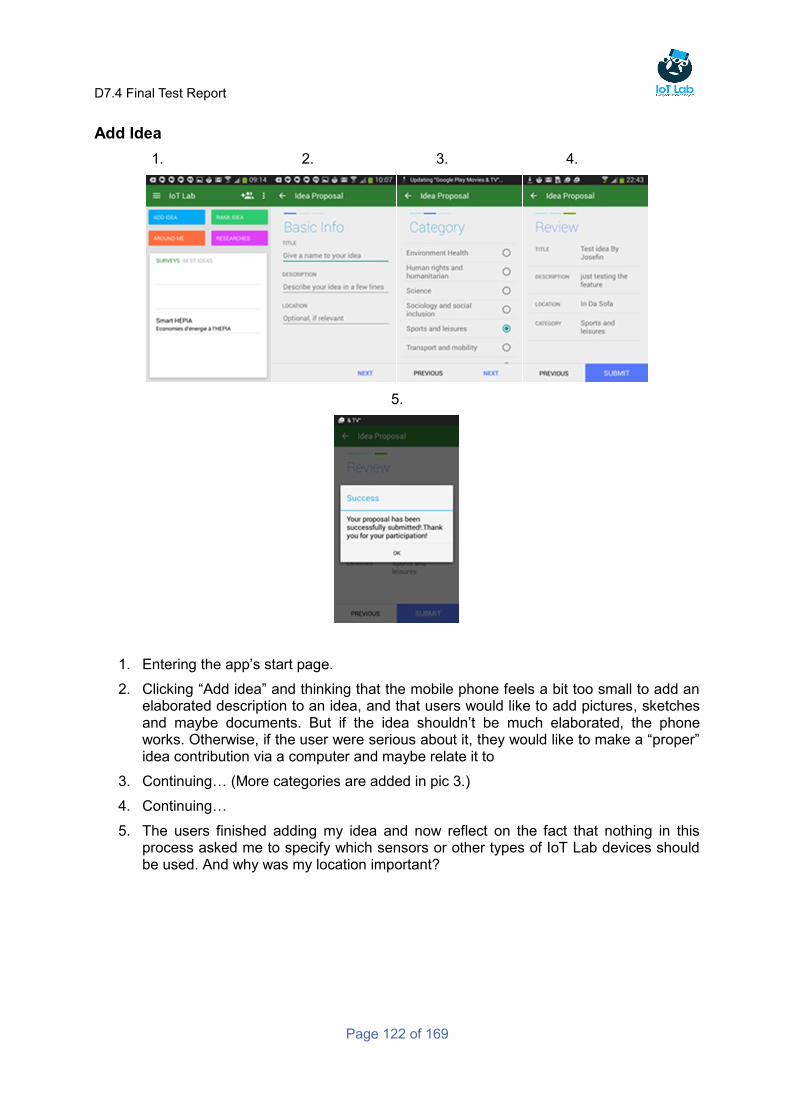
D7.4 Final Test Report
Page 122 of 169
Add Idea
1. 2. 3. 4.
5.
1. Entering the app’s start page.
2. Clicking “Add idea” and thinking that the mobile phone feels a bit too small to add an elaborated description to an idea, and that users would like to add pictures, sketches and maybe documents. But if the idea shouldn’t be much elaborated, the phone works. Otherwise, if the user were serious about it, they would like to make a “proper” idea contribution via a computer and maybe relate it to
3. Continuing… (More categories are added in pic 3.)
4. Continuing…
5. The users finished adding my idea and now reflect on the fact that nothing in this process asked me to specify which sensors or other types of IoT Lab devices should be used. And why was my location important?
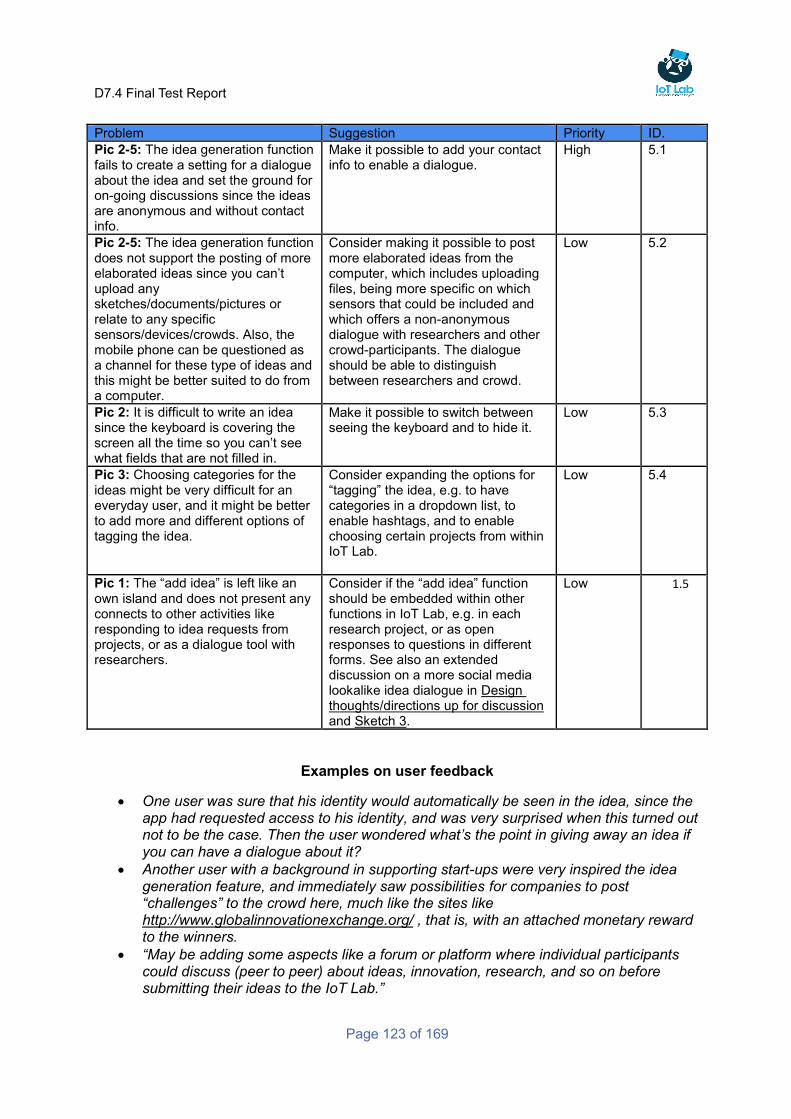
D7.4 Final Test Report
Page 123 of 169
Problem Suggestion Priority ID.
Pic 2-5: The idea generation function fails to create a setting for a dialogue about the idea and set the ground for on-going discussions since the ideas are anonymous and without contact info.
Make it possible to add your contact info to enable a dialogue.
High 5.1
Pic 2-5: The idea generation function does not support the posting of more elaborated ideas since you can’t upload any sketches/documents/pictures or relate to any specific sensors/devices/crowds. Also, the mobile phone can be questioned as a channel for these type of ideas and this might be better suited to do from a computer.
Consider making it possible to post more elaborated ideas from the computer, which includes uploading files, being more specific on which sensors that could be included and which offers a non-anonymous dialogue with researchers and other crowd-participants. The dialogue should be able to distinguish between researchers and crowd.
Low 5.2
Pic 2: It is difficult to write an idea since the keyboard is covering the screen all the time so you can’t see what fields that are not filled in.
Make it possible to switch between seeing the keyboard and to hide it.
Low 5.3
Pic 3: Choosing categories for the ideas might be very difficult for an everyday user, and it might be better to add more and different options of tagging the idea.
Consider expanding the options for “tagging” the idea, e.g. to have categories in a dropdown list, to enable hashtags, and to enable choosing certain projects from within IoT Lab.
Low 5.4
Pic 1: The “add idea” is left like an own island and does not present any connects to other activities like responding to idea requests from projects, or as a dialogue tool with researchers.
Consider if the “add idea” function should be embedded within other functions in IoT Lab, e.g. in each research project, or as open responses to questions in different forms. See also an extended discussion on a more social media lookalike idea dialogue in Design thoughts/directions up for discussion and Sketch 3.
Low 1.5
Examples on user feedback
One user was sure that his identity would automatically be seen in the idea, since the app had requested access to his identity, and was very surprised when this turned out not to be the case. Then the user wondered what’s the point in giving away an idea if you can have a dialogue about it?
Another user with a background in supporting start-ups were very inspired the idea generation feature, and immediately saw possibilities for companies to post “challenges” to the crowd here, much like the sites like http://www.globalinnovationexchange.org/ , that is, with an attached monetary reward to the winners.
“May be adding some aspects like a forum or platform where individual participants could discuss (peer to peer) about ideas, innovation, research, and so on before submitting their ideas to the IoT Lab.”

D7.4 Final Test Report
Page 124 of 169
Rank Idea
1. 2. 3. 4.
5.
1. Entering the “Rank ideas” area.
2. Exploring ideas by clicking on them and reading about the idea. Multi-level filtering function in the upper right corner. First by Category/Status/Participation. Category gives a long list and it is difficult to see how many ideas there are per category (no idea for choosing an empty category). Status gives the options Running/Ended/Waiting for approval. Participation gives the options Participated/Not participated yet (however, the outcome seems to be the same in both cases).
3. Clicking the suggestion, the user want to vote for. The user would also like make a comment to either say why they like the idea or to add a suggestion that extends the idea. Also, the user would like to know who posted the idea since they would like to have a dialogue about the idea. Maybe co-operate…
4. Rating…
5. Feedback on rating.
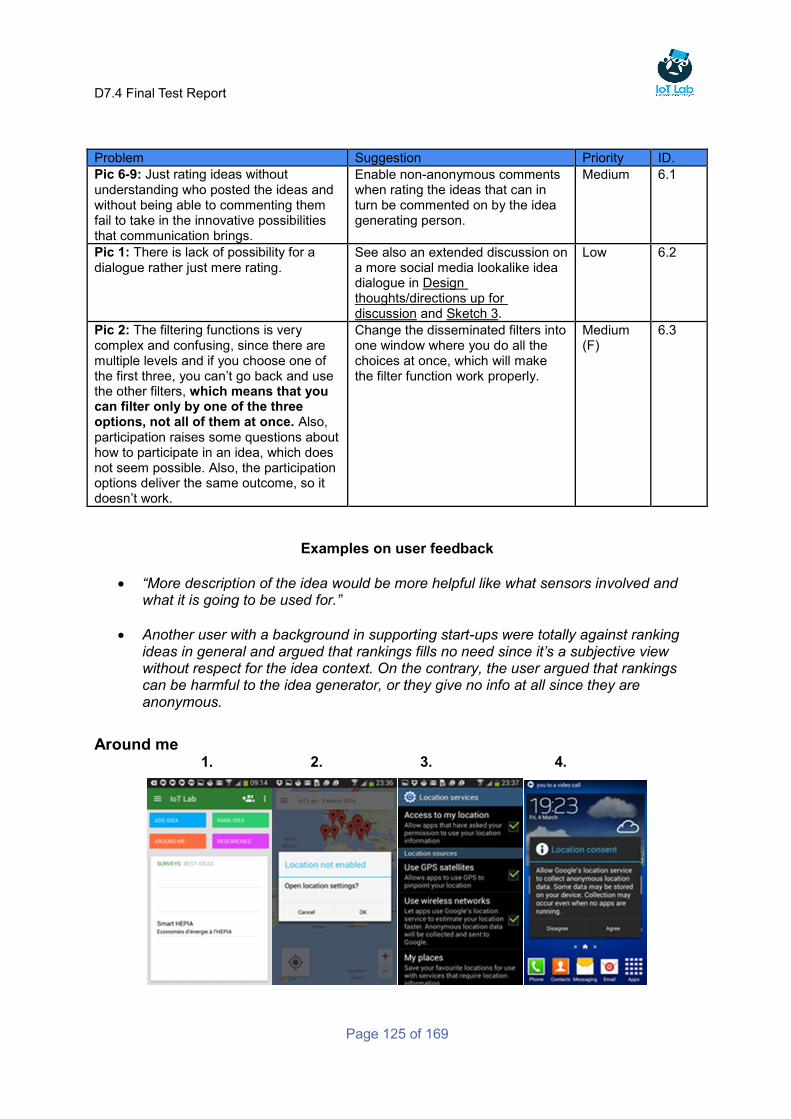
D7.4 Final Test Report
Page 125 of 169
Problem Suggestion Priority ID.
Pic 6-9: Just rating ideas without understanding who posted the ideas and without being able to commenting them fail to take in the innovative possibilities that communication brings.
Enable non-anonymous comments when rating the ideas that can in turn be commented on by the idea generating person.
Medium 6.1
Pic 1: There is lack of possibility for a dialogue rather just mere rating.
See also an extended discussion on a more social media lookalike idea dialogue in Design thoughts/directions up for discussion and Sketch 3.
Low 6.2
Pic 2: The filtering functions is very complex and confusing, since there are multiple levels and if you choose one of the first three, you can’t go back and use the other filters, which means that you can filter only by one of the three options, not all of them at once. Also, participation raises some questions about how to participate in an idea, which does not seem possible. Also, the participation options deliver the same outcome, so it doesn’t work.
Change the disseminated filters into one window where you do all the choices at once, which will make the filter function work properly.
Medium (F)
6.3
Examples on user feedback
“More description of the idea would be more helpful like what sensors involved and what it is going to be used for.”
Another user with a background in supporting start-ups were totally against ranking ideas in general and argued that rankings fills no need since it’s a subjective view without respect for the idea context. On the contrary, the user argued that rankings can be harmful to the idea generator, or they give no info at all since they are anonymous.
Around me 1. 2. 3. 4.
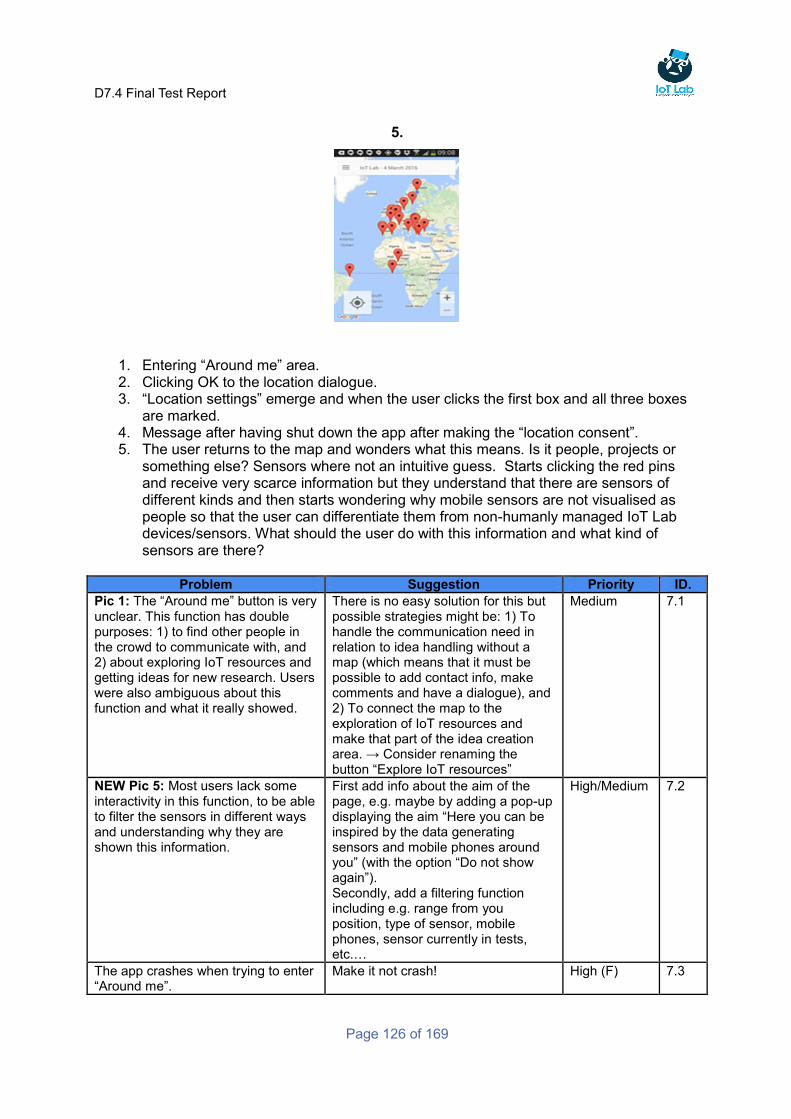
D7.4 Final Test Report
Page 126 of 169
5.
1. Entering “Around me” area. 2. Clicking OK to the location dialogue. 3. “Location settings” emerge and when the user clicks the first box and all three boxes
are marked. 4. Message after having shut down the app after making the “location consent”. 5. The user returns to the map and wonders what this means. Is it people, projects or
something else? Sensors where not an intuitive guess. Starts clicking the red pins and receive very scarce information but they understand that there are sensors of different kinds and then starts wondering why mobile sensors are not visualised as people so that the user can differentiate them from non-humanly managed IoT Lab devices/sensors. What should the user do with this information and what kind of sensors are there?
Problem Suggestion Priority ID.
Pic 1: The “Around me” button is very unclear. This function has double purposes: 1) to find other people in the crowd to communicate with, and 2) about exploring IoT resources and getting ideas for new research. Users were also ambiguous about this function and what it really showed.
There is no easy solution for this but possible strategies might be: 1) To handle the communication need in relation to idea handling without a map (which means that it must be possible to add contact info, make comments and have a dialogue), and 2) To connect the map to the exploration of IoT resources and make that part of the idea creation area. → Consider renaming the button “Explore IoT resources”
Medium 7.1
NEW Pic 5: Most users lack some interactivity in this function, to be able to filter the sensors in different ways and understanding why they are shown this information.
First add info about the aim of the page, e.g. maybe by adding a pop-up displaying the aim “Here you can be inspired by the data generating sensors and mobile phones around you” (with the option “Do not show again”). Secondly, add a filtering function including e.g. range from you position, type of sensor, mobile phones, sensor currently in tests, etc.…
High/Medium 7.2
The app crashes when trying to enter “Around me”.
Make it not crash! High (F) 7.3
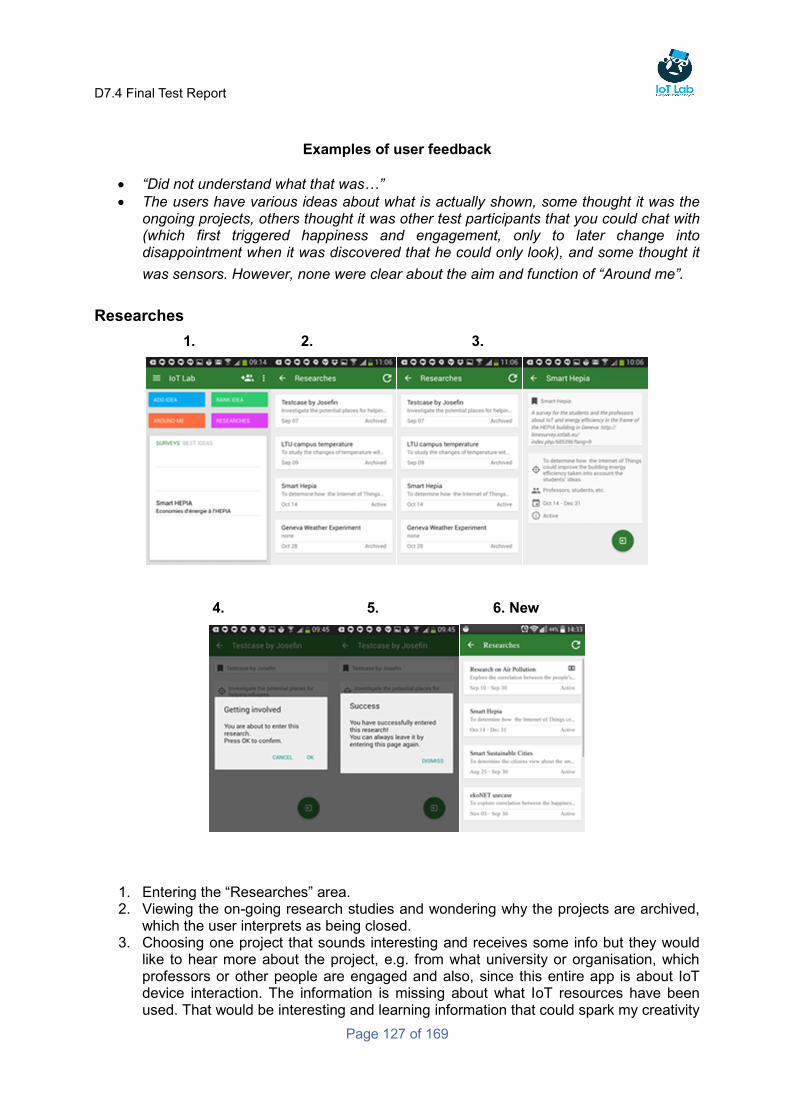
D7.4 Final Test Report
Page 127 of 169
Examples of user feedback
“Did not understand what that was…”
The users have various ideas about what is actually shown, some thought it was the ongoing projects, others thought it was other test participants that you could chat with (which first triggered happiness and engagement, only to later change into disappointment when it was discovered that he could only look), and some thought it
was sensors. However, none were clear about the aim and function of “Around me”.
Researches
1. 2. 3.
4. 5. 6. New
1. Entering the “Researches” area. 2. Viewing the on-going research studies and wondering why the projects are archived,
which the user interprets as being closed. 3. Choosing one project that sounds interesting and receives some info but they would
like to hear more about the project, e.g. from what university or organisation, which professors or other people are engaged and also, since this entire app is about IoT device interaction. The information is missing about what IoT resources have been used. That would be interesting and learning information that could spark my creativity
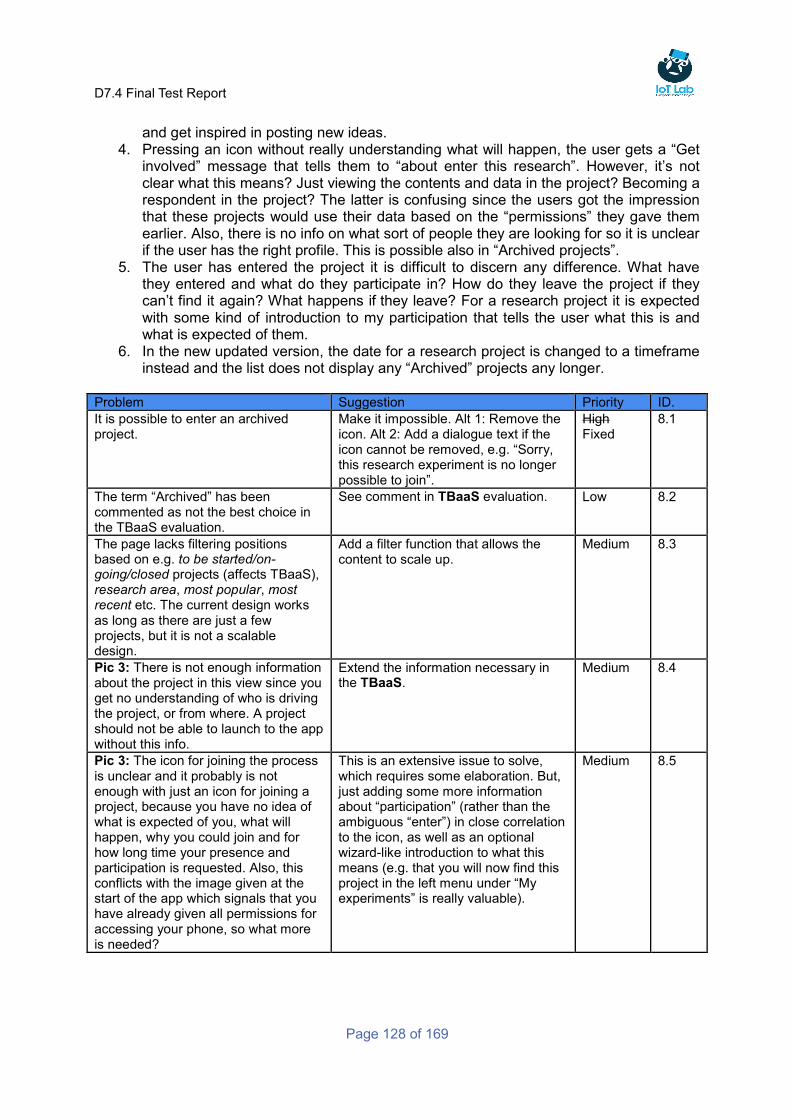
D7.4 Final Test Report
Page 128 of 169
and get inspired in posting new ideas. 4. Pressing an icon without really understanding what will happen, the user gets a “Get
involved” message that tells them to “about enter this research”. However, it’s not clear what this means? Just viewing the contents and data in the project? Becoming a respondent in the project? The latter is confusing since the users got the impression that these projects would use their data based on the “permissions” they gave them earlier. Also, there is no info on what sort of people they are looking for so it is unclear if the user has the right profile. This is possible also in “Archived projects”.
5. The user has entered the project it is difficult to discern any difference. What have they entered and what do they participate in? How do they leave the project if they can’t find it again? What happens if they leave? For a research project it is expected with some kind of introduction to my participation that tells the user what this is and what is expected of them.
6. In the new updated version, the date for a research project is changed to a timeframe instead and the list does not display any “Archived” projects any longer.
Problem Suggestion Priority ID.
It is possible to enter an archived project.
Make it impossible. Alt 1: Remove the icon. Alt 2: Add a dialogue text if the icon cannot be removed, e.g. “Sorry, this research experiment is no longer possible to join”.
High Fixed
8.1
The term “Archived” has been commented as not the best choice in the TBaaS evaluation.
See comment in TBaaS evaluation. Low 8.2
The page lacks filtering positions based on e.g. to be started/on-going/closed projects (affects TBaaS), research area, most popular, most recent etc. The current design works as long as there are just a few projects, but it is not a scalable design.
Add a filter function that allows the content to scale up.
Medium 8.3
Pic 3: There is not enough information about the project in this view since you get no understanding of who is driving the project, or from where. A project should not be able to launch to the app without this info.
Extend the information necessary in the TBaaS.
Medium 8.4
Pic 3: The icon for joining the process is unclear and it probably is not enough with just an icon for joining a project, because you have no idea of what is expected of you, what will happen, why you could join and for how long time your presence and participation is requested. Also, this conflicts with the image given at the start of the app which signals that you have already given all permissions for accessing your phone, so what more is needed?
This is an extensive issue to solve, which requires some elaboration. But, just adding some more information about “participation” (rather than the ambiguous “enter”) in close correlation to the icon, as well as an optional wizard-like introduction to what this means (e.g. that you will now find this project in the left menu under “My experiments” is really valuable).
Medium 8.5
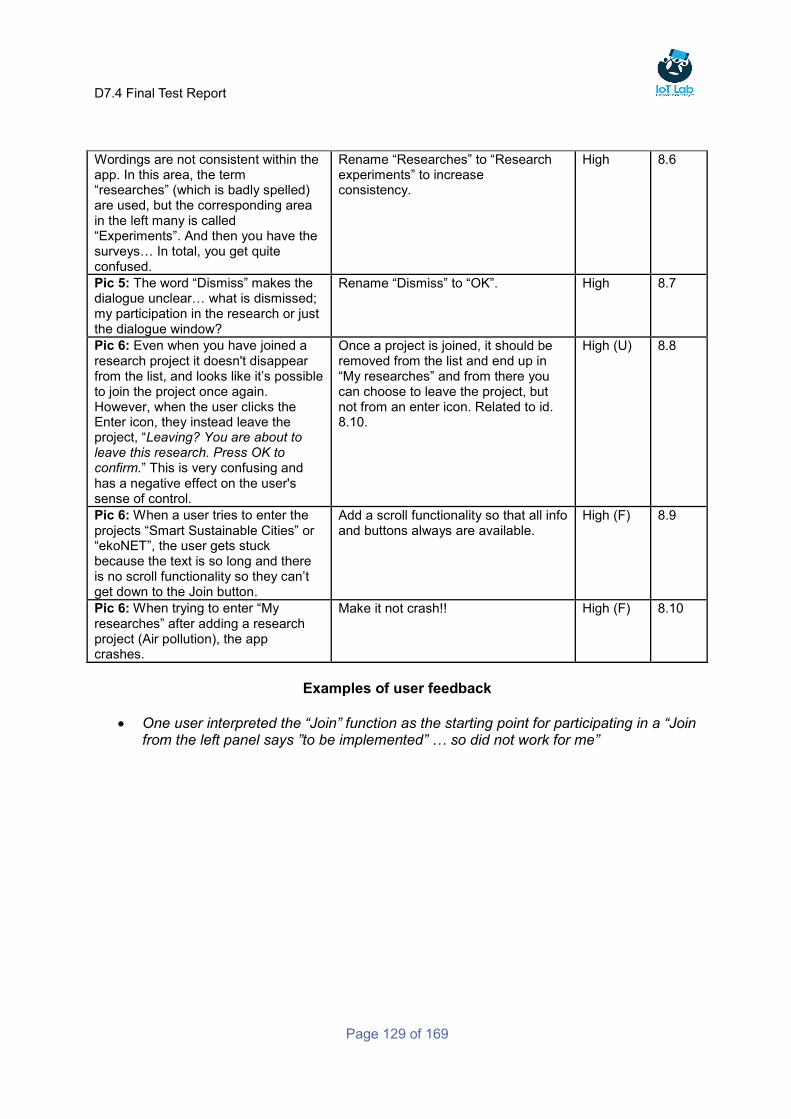
D7.4 Final Test Report
Page 129 of 169
Wordings are not consistent within the app. In this area, the term “researches” (which is badly spelled) are used, but the corresponding area in the left many is called “Experiments”. And then you have the surveys… In total, you get quite confused.
Rename “Researches” to “Research experiments” to increase consistency.
High 8.6
Pic 5: The word “Dismiss” makes the dialogue unclear… what is dismissed; my participation in the research or just the dialogue window?
Rename “Dismiss” to “OK”. High 8.7
Pic 6: Even when you have joined a research project it doesn't disappear from the list, and looks like it’s possible to join the project once again. However, when the user clicks the Enter icon, they instead leave the project, “Leaving? You are about to leave this research. Press OK to confirm.” This is very confusing and has a negative effect on the user's sense of control.
Once a project is joined, it should be removed from the list and end up in “My researches” and from there you can choose to leave the project, but not from an enter icon. Related to id. 8.10.
High (U) 8.8
Pic 6: When a user tries to enter the projects “Smart Sustainable Cities” or “ekoNET”, the user gets stuck because the text is so long and there is no scroll functionality so they can’t get down to the Join button.
Add a scroll functionality so that all info and buttons always are available.
High (F) 8.9
Pic 6: When trying to enter “My researches” after adding a research project (Air pollution), the app crashes.
Make it not crash!! High (F) 8.10
Examples of user feedback
One user interpreted the “Join” function as the starting point for participating in a “Join from the left panel says ”to be implemented” … so did not work for me”
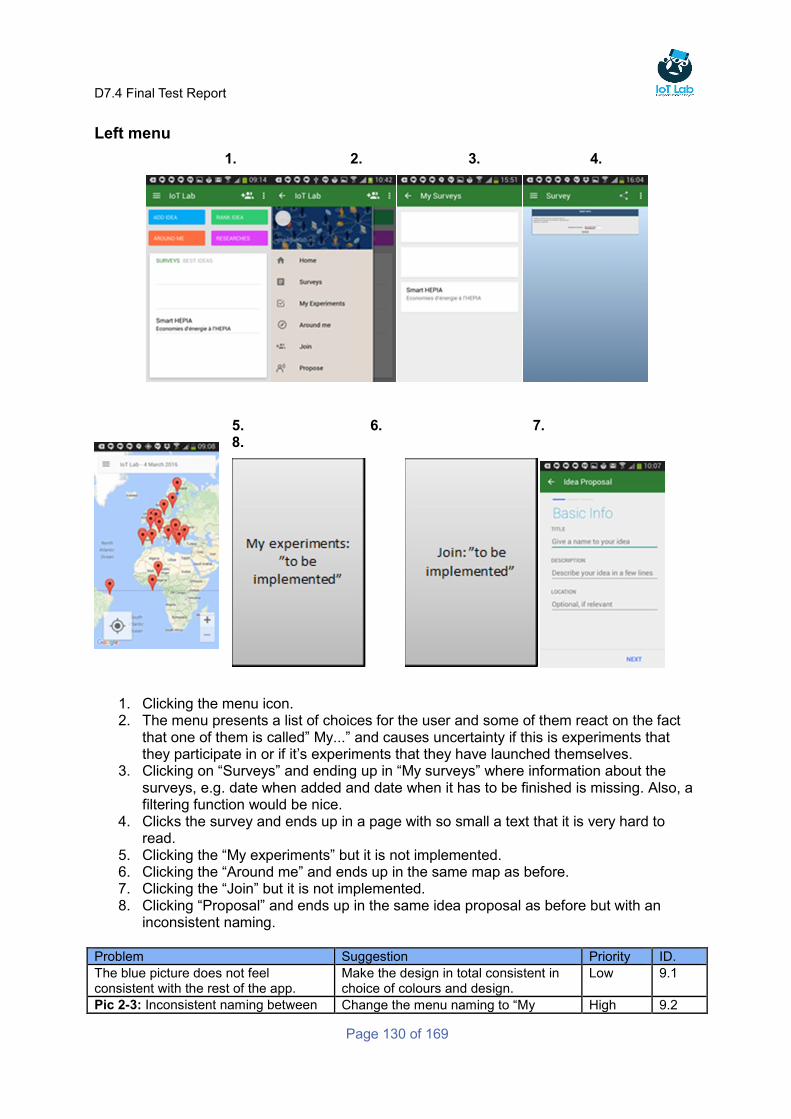
D7.4 Final Test Report
Page 130 of 169
Left menu
1. 2. 3. 4.
5. 6. 7. 8.
1. Clicking the menu icon. 2. The menu presents a list of choices for the user and some of them react on the fact
that one of them is called” My...” and causes uncertainty if this is experiments that they participate in or if it’s experiments that they have launched themselves.
3. Clicking on “Surveys” and ending up in “My surveys” where information about the surveys, e.g. date when added and date when it has to be finished is missing. Also, a filtering function would be nice.
4. Clicks the survey and ends up in a page with so small a text that it is very hard to read.
5. Clicking the “My experiments” but it is not implemented. 6. Clicking the “Around me” and ends up in the same map as before. 7. Clicking the “Join” but it is not implemented. 8. Clicking “Proposal” and ends up in the same idea proposal as before but with an
inconsistent naming.
Problem Suggestion Priority ID.
The blue picture does not feel consistent with the rest of the app.
Make the design in total consistent in choice of colours and design.
Low 9.1
Pic 2-3: Inconsistent naming between Change the menu naming to “My High 9.2
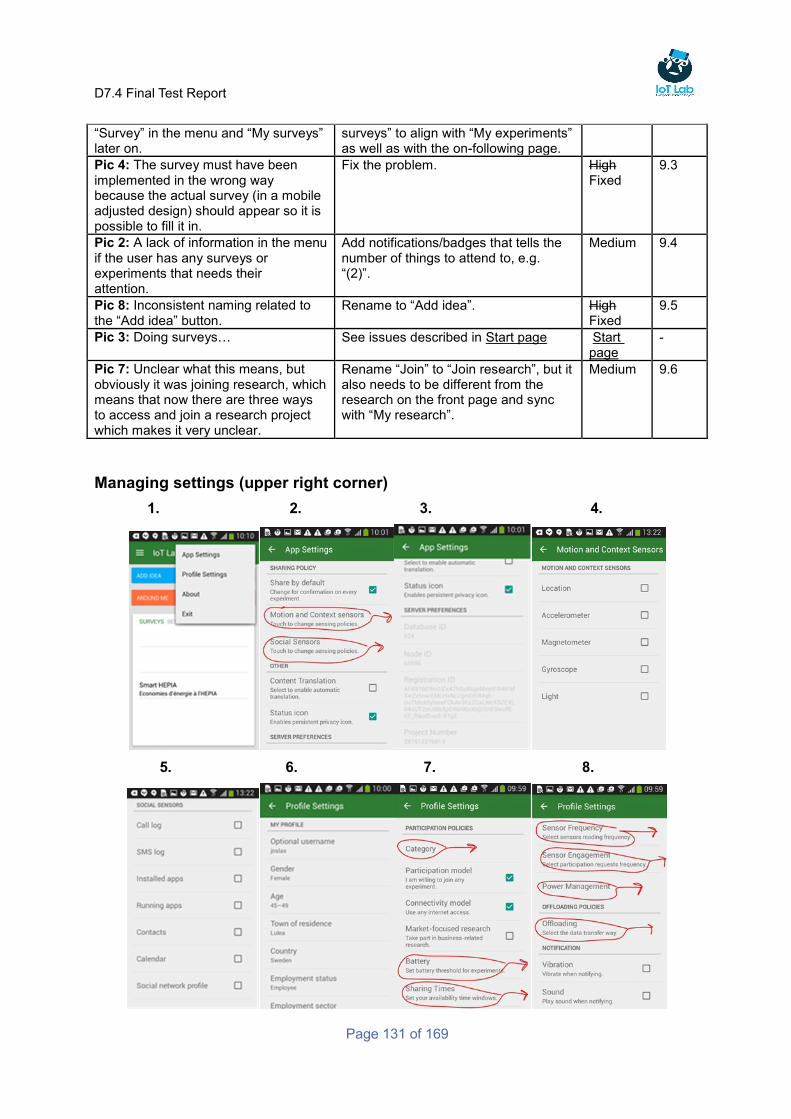
D7.4 Final Test Report
Page 131 of 169
“Survey” in the menu and “My surveys” later on.
surveys” to align with “My experiments” as well as with the on-following page.
Pic 4: The survey must have been implemented in the wrong way because the actual survey (in a mobile adjusted design) should appear so it is possible to fill it in.
Fix the problem. High Fixed
9.3
Pic 2: A lack of information in the menu if the user has any surveys or experiments that needs their attention.
Add notifications/badges that tells the number of things to attend to, e.g. “(2)”.
Medium 9.4
Pic 8: Inconsistent naming related to the “Add idea” button.
Rename to “Add idea”. High Fixed
9.5
Pic 3: Doing surveys… See issues described in Start page Start page
-
Pic 7: Unclear what this means, but obviously it was joining research, which means that now there are three ways to access and join a research project which makes it very unclear.
Rename “Join” to “Join research”, but it also needs to be different from the research on the front page and sync with “My research”.
Medium 9.6
Managing settings (upper right corner)
1. 2. 3. 4.
5. 6. 7. 8.
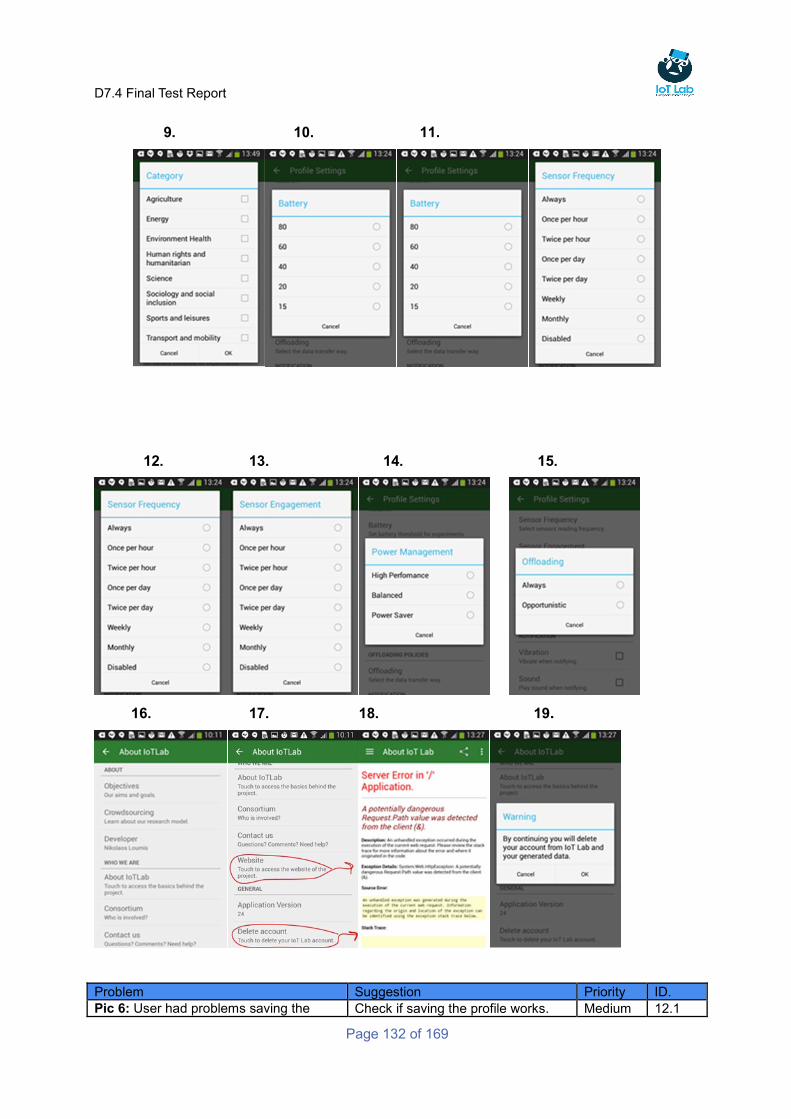
D7.4 Final Test Report
Page 132 of 169
9. 10. 11.
12. 13. 14. 15.
16. 17. 18. 19.
Problem Suggestion Priority ID.
Pic 6: User had problems saving the Check if saving the profile works. Medium 12.1
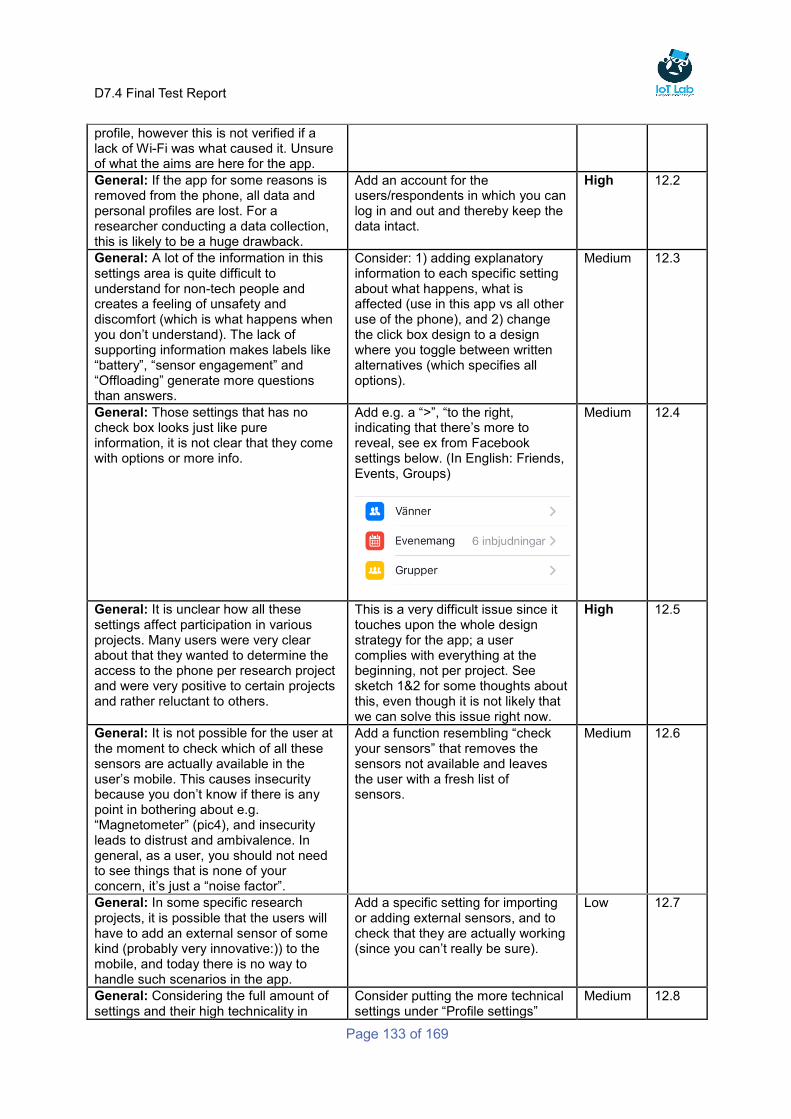
D7.4 Final Test Report
Page 133 of 169
profile, however this is not verified if a lack of Wi-Fi was what caused it. Unsure of what the aims are here for the app.
General: If the app for some reasons is removed from the phone, all data and personal profiles are lost. For a researcher conducting a data collection, this is likely to be a huge drawback.
Add an account for the users/respondents in which you can log in and out and thereby keep the data intact.
High 12.2
General: A lot of the information in this settings area is quite difficult to understand for non-tech people and creates a feeling of unsafety and discomfort (which is what happens when you don’t understand). The lack of supporting information makes labels like “battery”, “sensor engagement” and “Offloading” generate more questions than answers.
Consider: 1) adding explanatory information to each specific setting about what happens, what is affected (use in this app vs all other use of the phone), and 2) change the click box design to a design where you toggle between written alternatives (which specifies all options).
Medium 12.3
General: Those settings that has no check box looks just like pure information, it is not clear that they come with options or more info.
Add e.g. a “>”, “to the right, indicating that there’s more to reveal, see ex from Facebook settings below. (In English: Friends, Events, Groups)
Medium 12.4
General: It is unclear how all these settings affect participation in various projects. Many users were very clear about that they wanted to determine the access to the phone per research project and were very positive to certain projects and rather reluctant to others.
This is a very difficult issue since it touches upon the whole design strategy for the app; a user complies with everything at the beginning, not per project. See sketch 1&2 for some thoughts about this, even though it is not likely that we can solve this issue right now.
High 12.5
General: It is not possible for the user at the moment to check which of all these sensors are actually available in the user’s mobile. This causes insecurity because you don’t know if there is any point in bothering about e.g. “Magnetometer” (pic4), and insecurity leads to distrust and ambivalence. In general, as a user, you should not need to see things that is none of your concern, it’s just a “noise factor”.
Add a function resembling “check your sensors” that removes the sensors not available and leaves the user with a fresh list of sensors.
Medium 12.6
General: In some specific research projects, it is possible that the users will have to add an external sensor of some kind (probably very innovative:)) to the mobile, and today there is no way to handle such scenarios in the app.
Add a specific setting for importing or adding external sensors, and to check that they are actually working (since you can’t really be sure).
Low 12.7
General: Considering the full amount of settings and their high technicality in
Consider putting the more technical settings under “Profile settings”
Medium 12.8
D7.4 Final Test Report
Page 134 of 169
combination with just “everyday” users from all sectors/levels of society, it is just too much and too complicated. Also, it is very likely that from the researcher’s point of view, having the users differing too much in settings (e.g. when sensors are transmitting/sharing) might cause troubles in the validity of their data collection because the data will not be comparable.
under an “Advanced settings” instead. Also, see sketch 1&2 for an alternative approach based on a default setting which is adapted per project.
Pic 12&13: What the difference between “Sensor frequency” and “Sensor engagement”? Are they doublets?
If they are the same, remove one of them, otherwise add information to differ them.
Medium 12.9
Pic 17: The link to the website does not work and should also have a more prominent placement.
Fix the link and why not put the link at the top of the page.
High 12.10
Examples on user feedback
One couldn’t get the personal profile to be saved, it just disappeared. This might have to do with the app being off-line (no Wi-Fi), but I’m not sure.
In general, there were very few comments on the setting parts, maybe they didn’t see it or they thought it was unimportant.
Design thoughts/directions up for discussion
After taking a look on the broad and general challenges stated in first section, and considering the range and differences between each identified problems from the user point of view, I have given this some thought on how to formulate design recommendations. And since a picture sometimes “says more than thousand words”, I’ve decided to do a sketch. However, I’m well aware that this is neither the time to do major re-design or the time to properly discuss how such a re-design should look like (should we have the time), but it is my experience that sketches like this also can make it easier to address minor changes in the right direction. So, it’s not my intention that these sketches should be realised, it’s just an effort to try to communicate the findings from the user evaluation graphically. See this as something that rather points out the design direction based on what the user thinks. Maybe it can be used as input in discussions about new projects based on IoT Lab. Please feel very welcome to comment! • Sketch 1 Starting up the app: Instead of having to accept a long range of permissions when
downloading the app, which creates a very high threshold for some users (and we risk losing them), this sketch is based on the user first downloading the app without any demands for permissions at all. Instead, when starting up the app, a wizard guides and explains the aim with the IoT Lab and lets the users start with simple things such as creating an account and creating a personal profile. This gets people into the app in the first place. An alternative design (and probably recommended) is to let both the account and the personal profile be voluntary here, just to enable the users to enter the app and explore it to feel safe and in control. Doing more than watching should then request the user to sign an account, fill in their personal profile and make default privacy settings. Then they can start.
• Sketch 2 Design to support the key aim; contribute to science: This sketch deals with the problems of discrepancy of aim between app and TBaaS, the problem with informed consent per project the user participates in, and the different parts of a project being scattered across the app. The sketch also tries to show how an increased feeling of control over the research participation could look like, as well as an increased understanding of what needs to be done and what current status of different activities are. For these reasons, the home page is set to be your own participation, which should be the most important part of the app, with “your”
D7.4 Final Test Report
Page 135 of 169
projects in condensed view (able to be expanded to reveal all information). To display the status and characteristics of the project, a range of symbols/info are added; 1) status info (On-going, Closed, Up-coming) with dates, 2) an icon showing if passive data collection/sensor data is being used in the project (ON/OFF), 3) an icon showing if survey questions are used in the project (ON/OFF), 4) Info on acquired points, and 5) the specific privacy setting for that project (shows what is requested by that particular project).
• Sketch 3 A merged area for ideas: The current functions “Propose idea” and “Rank idea” is merged into the same page because they are about the same thing. Also, to increase social interaction and creativity, it could be fruitful to borrow the layout from social media apps such as Facebook (which is about communicating your thoughts, having a dialogue and ranking). This would probably also increase the sense of recognition and of how this works.
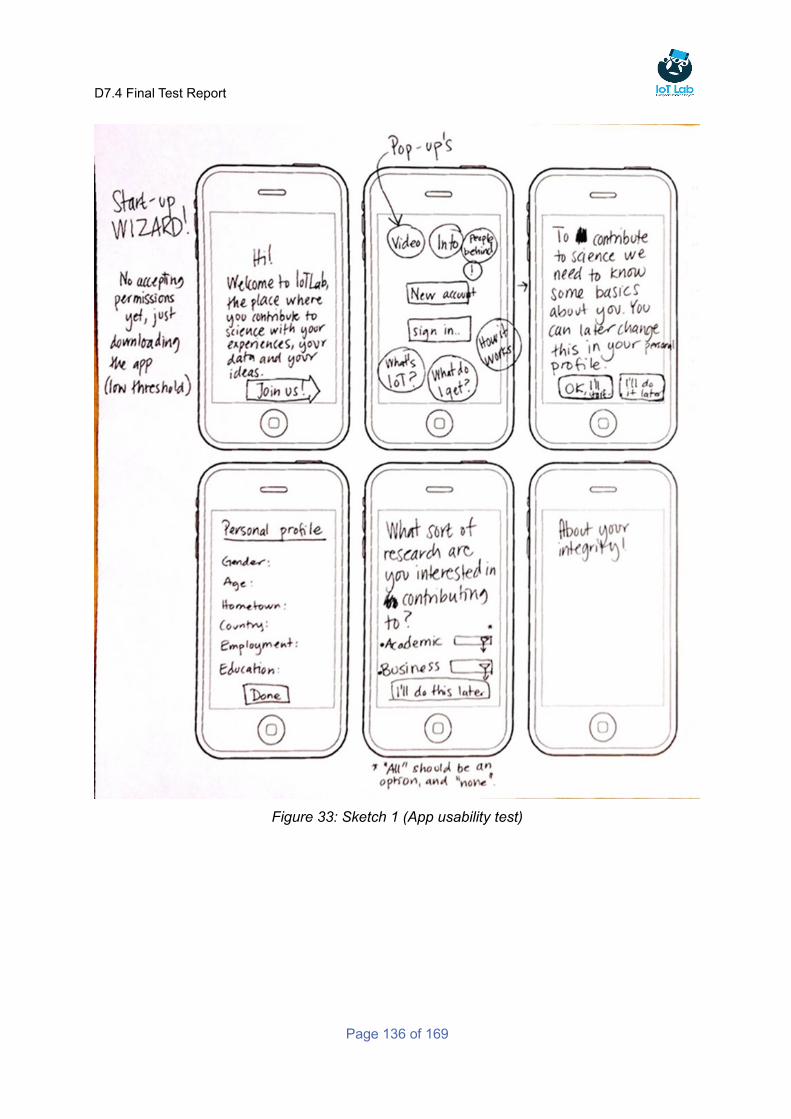
D7.4 Final Test Report
Page 136 of 169
Figure 33: Sketch 1 (App usability test)
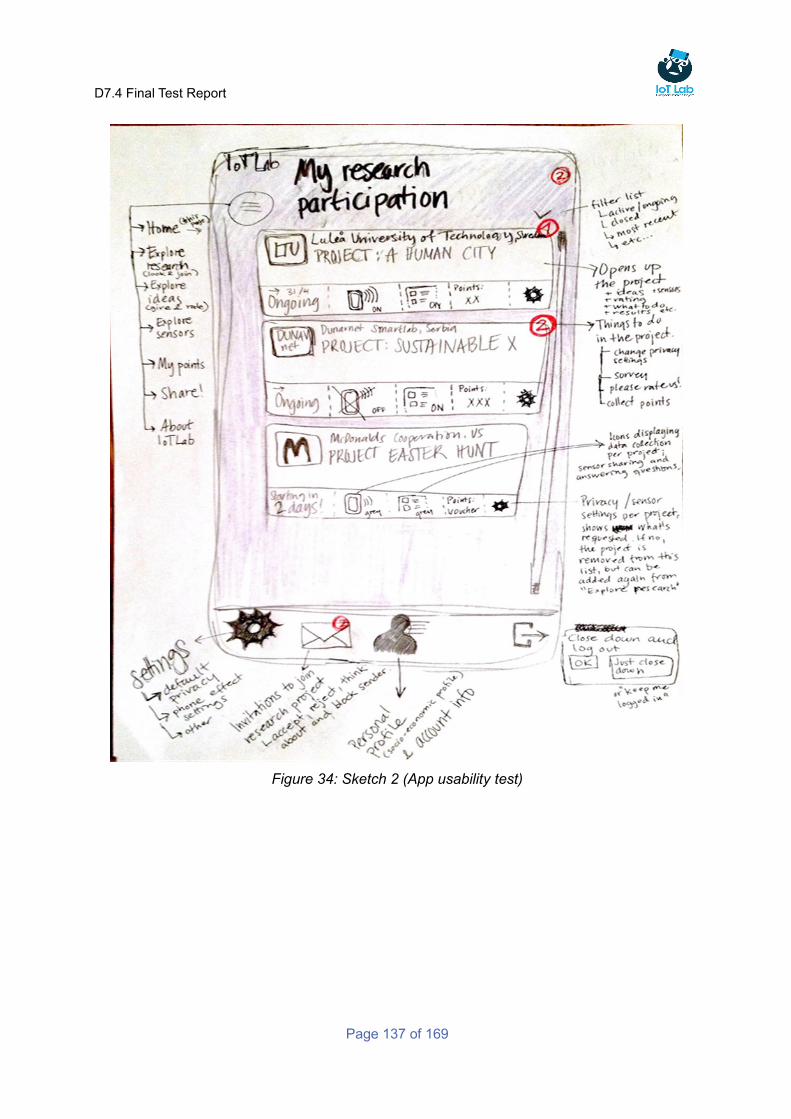
D7.4 Final Test Report
Page 137 of 169
Figure 34: Sketch 2 (App usability test)
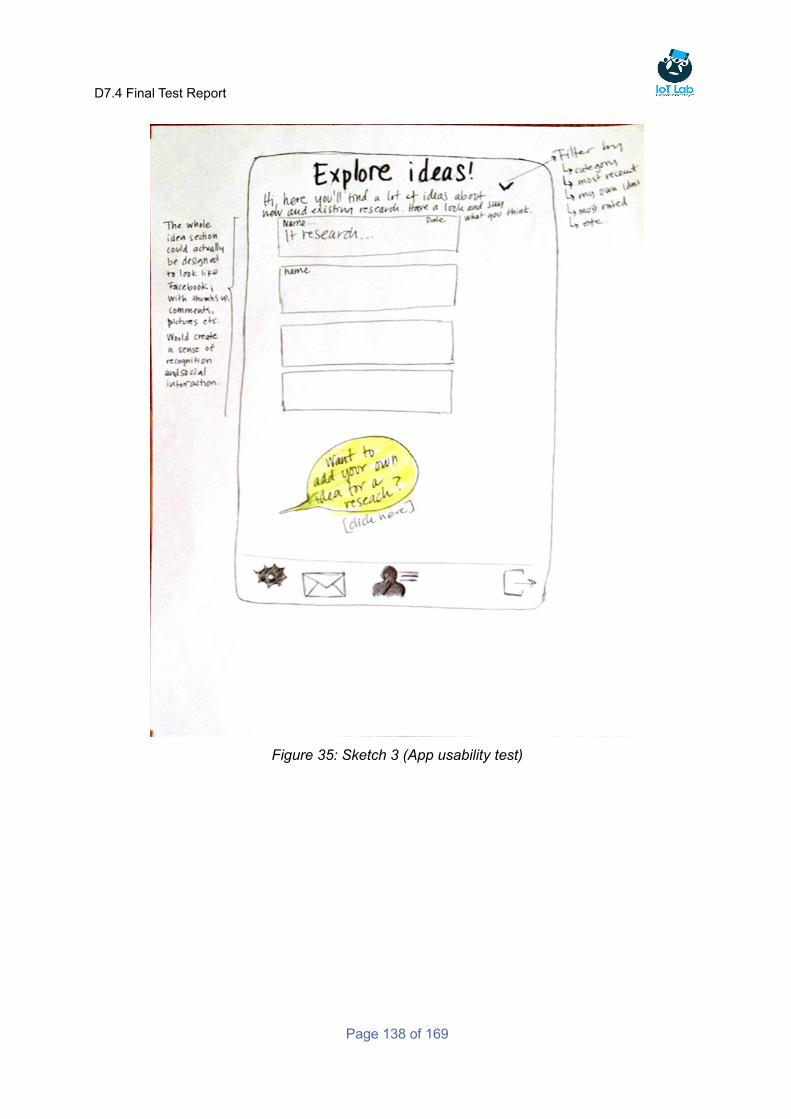
D7.4 Final Test Report
Page 138 of 169
Figure 35: Sketch 3 (App usability test)
D7.4 Final Test Report
Page 139 of 169
Annex 3: IoT Lab Video Use Case–A usability and feasibility test
This test aimed to investigate the feasibility and usability of the Use Case presented in the IoT Lab video commercial used on the www.iotlab.eu page, which aimed to present the functionality to viewers in an easy manner. It was deemed important that we ensured that the presented Schoolteacher Case in the video actually could be performed, or if not, which remaining issues we needed to address. To be sure on what actually was said in the video, the entire dialogue in the video was transcribed and analyzed. Below you will find the video transcript, with corresponding screen dumps (directly below the transcript) and the analysis results.
Transcribed text from video Analysis and reflections Problems ID.
[0.00] “Want to [meaning the crowd]:
● Support and take part in research activities,
● Join a smart community, ● And contribute to address
important issues and build a better world.
Or you might be interested in [meaning the researchers]:
● Lead a research ● Collecting data for your
research. IoT Lab is here to make all this possible.
Why call it “smart community”? Researchers most often want a representational selection of people, not only the smartest persons. Also, the wording “smart” might put people off or create the feeling that you have to be entrepreneurial, creative or know everything about what IoT is (which quite many don’t have a clue about).
Low → Consider what kind of signals that is sent by using the term “smart community”
V1
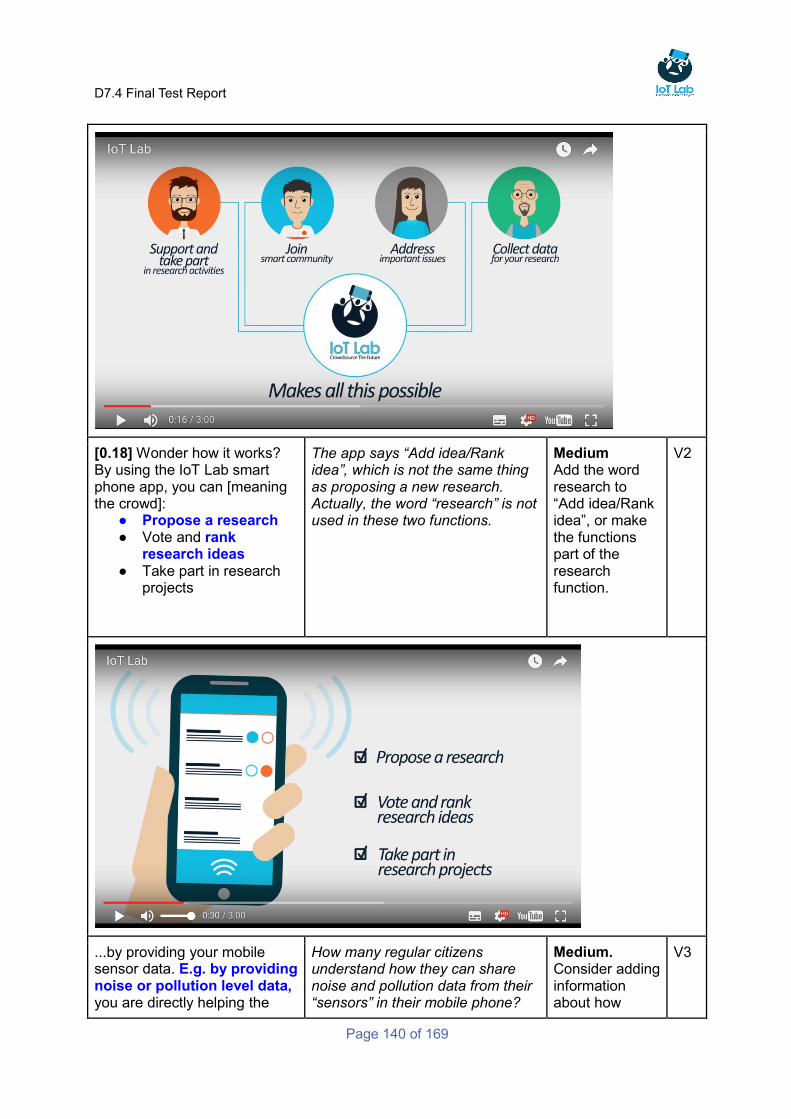
D7.4 Final Test Report
Page 140 of 169
[0.18] Wonder how it works? By using the IoT Lab smart phone app, you can [meaning the crowd]:
● Propose a research ● Vote and rank
research ideas ● Take part in research
projects
The app says “Add idea/Rank idea”, which is not the same thing as proposing a new research. Actually, the word “research” is not used in these two functions.
Medium Add the word research to “Add idea/Rank idea”, or make the functions part of the research function.
V2
...by providing your mobile sensor data. E.g. by providing noise or pollution level data, you are directly helping the
How many regular citizens understand how they can share noise and pollution data from their “sensors” in their mobile phone?
Medium. Consider adding information about how
V3
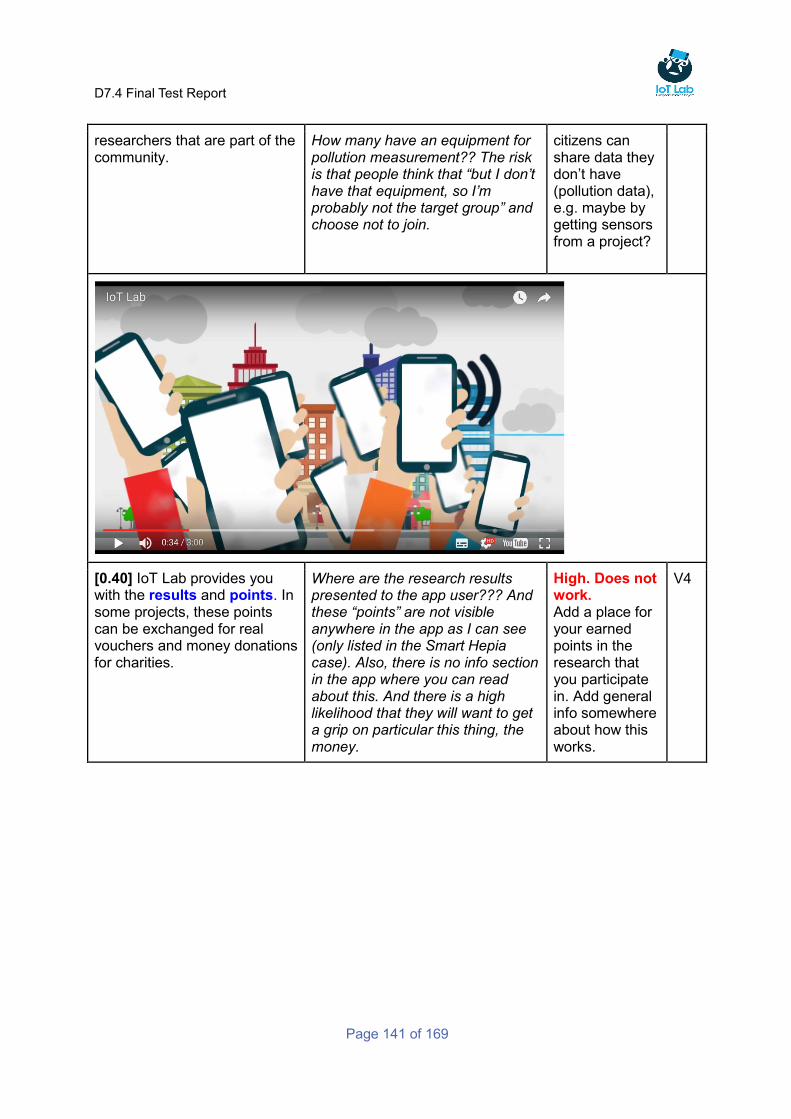
D7.4 Final Test Report
Page 141 of 169
researchers that are part of the community.
How many have an equipment for pollution measurement?? The risk is that people think that “but I don’t have that equipment, so I’m probably not the target group” and choose not to join.
citizens can share data they don’t have (pollution data), e.g. maybe by getting sensors from a project?
[0.40] IoT Lab provides you with the results and points. In some projects, these points can be exchanged for real vouchers and money donations for charities.
Where are the research results presented to the app user??? And these “points” are not visible anywhere in the app as I can see (only listed in the Smart Hepia case). Also, there is no info section in the app where you can read about this. And there is a high likelihood that they will want to get a grip on particular this thing, the money.
High. Does not work. Add a place for your earned points in the research that you participate in. Add general info somewhere about how this works.
V4
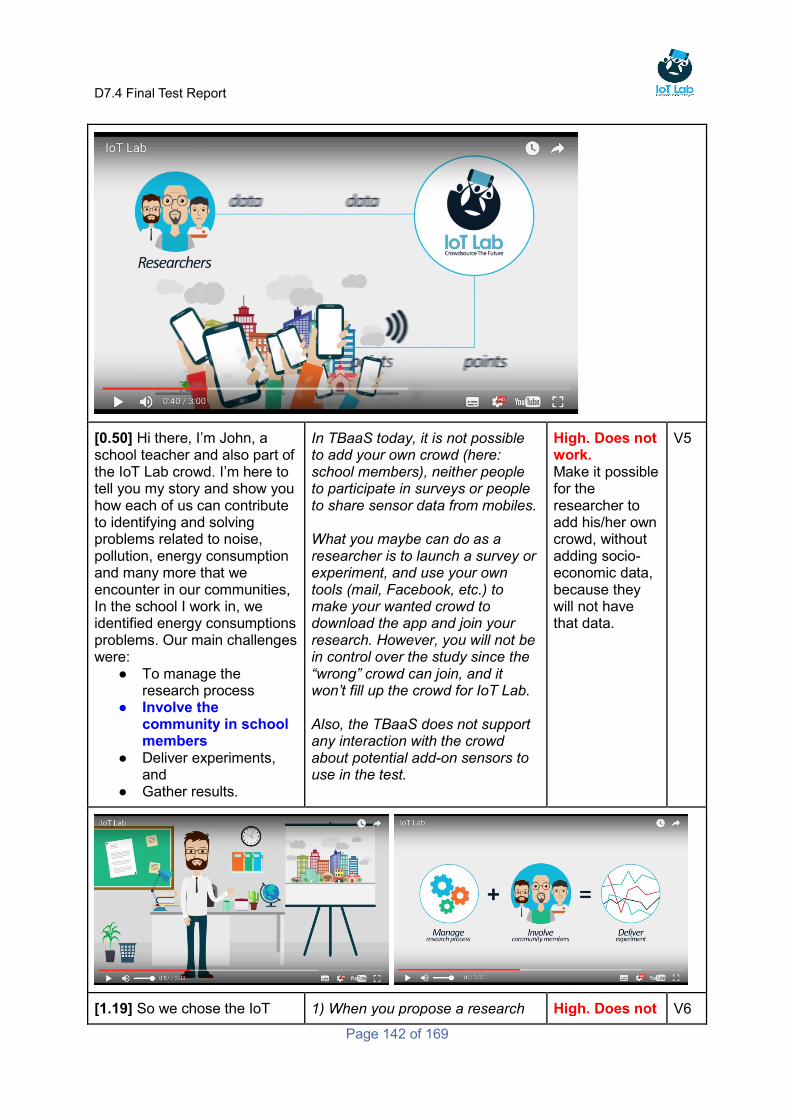
D7.4 Final Test Report
Page 142 of 169
[0.50] Hi there, I’m John, a school teacher and also part of the IoT Lab crowd. I’m here to tell you my story and show you how each of us can contribute to identifying and solving problems related to noise, pollution, energy consumption and many more that we encounter in our communities, In the school I work in, we identified energy consumptions problems. Our main challenges were:
● To manage the research process
● Involve the community in school members
● Deliver experiments, and
● Gather results.
In TBaaS today, it is not possible to add your own crowd (here: school members), neither people to participate in surveys or people to share sensor data from mobiles. What you maybe can do as a researcher is to launch a survey or experiment, and use your own tools (mail, Facebook, etc.) to make your wanted crowd to download the app and join your research. However, you will not be in control over the study since the “wrong” crowd can join, and it won’t fill up the crowd for IoT Lab. Also, the TBaaS does not support any interaction with the crowd about potential add-on sensors to use in the test.
High. Does not work. Make it possible for the researcher to add his/her own crowd, without adding socio-economic data, because they will not have that data.
V5
[1.19] So we chose the IoT 1) When you propose a research High. Does not V6
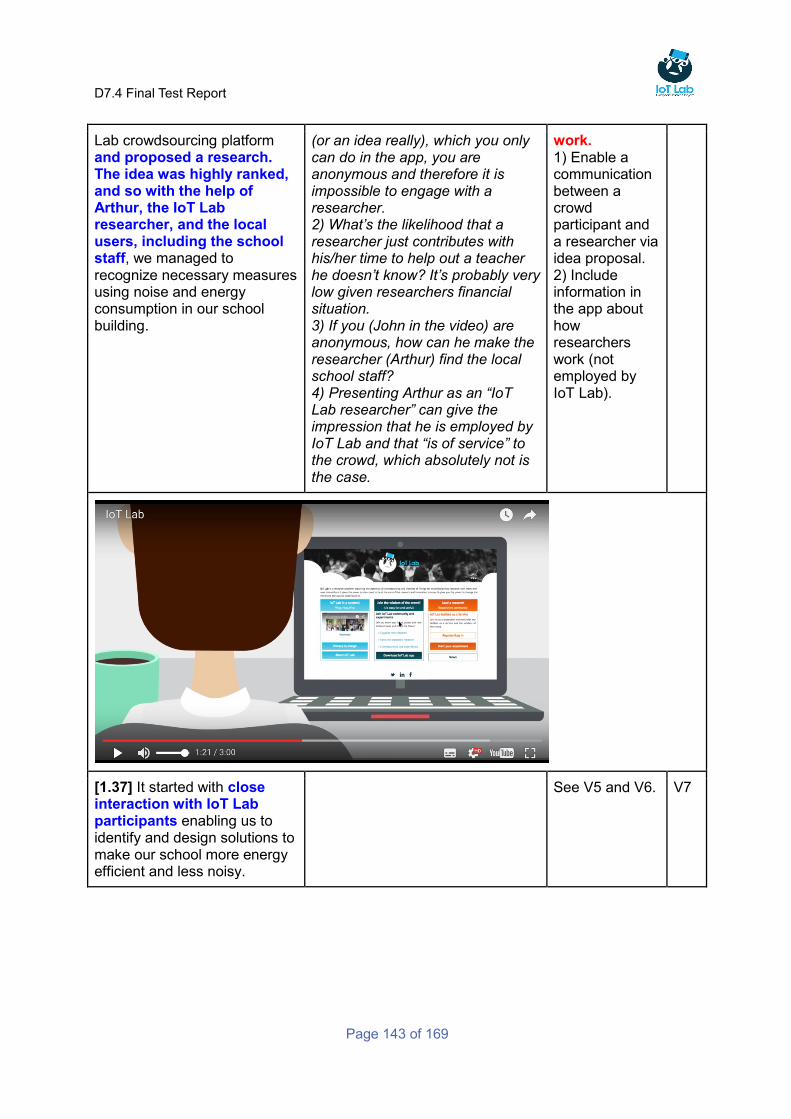
D7.4 Final Test Report
Page 143 of 169
Lab crowdsourcing platform and proposed a research. The idea was highly ranked, and so with the help of Arthur, the IoT Lab researcher, and the local users, including the school staff, we managed to recognize necessary measures using noise and energy consumption in our school building.
(or an idea really), which you only can do in the app, you are anonymous and therefore it is impossible to engage with a researcher. 2) What’s the likelihood that a researcher just contributes with his/her time to help out a teacher he doesn’t know? It’s probably very low given researchers financial situation. 3) If you (John in the video) are anonymous, how can he make the researcher (Arthur) find the local school staff? 4) Presenting Arthur as an “IoT Lab researcher” can give the impression that he is employed by IoT Lab and that “is of service” to the crowd, which absolutely not is the case.
work. 1) Enable a communication between a crowd participant and a researcher via idea proposal. 2) Include information in the app about how researchers work (not employed by IoT Lab).
[1.37] It started with close interaction with IoT Lab participants enabling us to identify and design solutions to make our school more energy efficient and less noisy.
See V5 and V6. V7

D7.4 Final Test Report
Page 144 of 169
[1.47] The IoT Lab is ideal to you [meaning the crowd] if you are in the mood to:
● Join research activities ● Get presents and
support charity ● Have fun in a smart
community
Since “Get presents” is not the solution for all research projects, maybe it shouldn’t have such a prominent appearance? Also, this functionality is not visible today.
See V4 V8
If you are a researcher, the IoT Lab is there for you if you to:
● Access community of voluntary participants from different regions
● Access a testbed as a service with crowdsourcing tools and IoT testbeds
● Join a community of researchers
Today it is not possible to “join a community of researchers” since there are no community present in the TBaaS. There are “on-going research”, but they don’t include any contact info. Googling their webpages (if they have one) is not joining a community that requires communication possibilities.
High. Doesn’t work. Enable contact info in “on-going research” so that communication between researchers can be obtained. Consider integrating some social media support in IoT Lab.
V9

D7.4 Final Test Report
Page 145 of 169
[2.10] We want to change the way researchers perform it by enabling new forms of interaction between researchers and end users through crowd sensing. Yes, because our members can lead, suggest, and take part in all sorts of experiments and researches.
You can’t call an exchange of data for “interaction”. Today, a crowd participant is not pictured as a leader of research. Of course, anybody can enter the www.iotlab.eu, but you can’t lead a research from the app.
Doesn’t work. And it probably shouldn’t work either...as I understood it.
V10
[2.26] What is the most important is that you share your knowledge and data that you decide to share. All data is fully anonymized because IoT Lab is completely privacy friendly. What are you waiting for? Be part of the smart community, crowd source the future! Join us today and participate, discover, initiate or manage innovative research within the IoT Lab community.
There is no way for a crowd participant to actually initiate “innovative research”, they can propose, but that is not the same thing. Risk for misunderstandings.
Medium. V11
D7.4 Final Test Report
Page 146 of 169

D7.4 Final Test Report
Page 147 of 169
Annex 4: Discussion material: Crowd driven city growth
Introduction to the use case used as discussion material
Background The municipality X is currently undergoing a major transformation characterized by a need for more housing, more efficient transportation and an adaption to strengthened environmental goals. For this transformation, the citizen’s participation in the process has been recognized as an important factor and the aim is to create several dialogues that can identify how the citizens view the future of the city. The researcher and the research aim Scientist A is a researcher that focuses on regional governance and citizen’s engagement. In collaboration with municipality X, she aims to investigate how the citizens perceive the existing city and what future visions of the city they have. And important factor is also to gain an understanding of this during different phases of the city; all four seasons and also spread throughout the day (morning, day, evening, night) . Research data In order to match the aim, the study must be based on two forms of data: 1) citizen driven data, and 2) city data. The citizen driven data should reflect their perceptions of the current city and their visualisations of the future city and relate that to a position in the city. Therefore, data is needed in the form of text, pictures, sounds and geographic positions. Data needed about the city is map data, weather data and other related environmental data. Some of these datasets are likely to be found in regional open data portals as well as in city sensors. Research phases For this research to take place, the researcher will engage in the following general research phases:
1. Planning the research 2. Setting up the research 3. Conducting the research 4. Analysing the results from the research 5. Performing complementary research 6. Closing the research study
For each of these phases, the researcher performs a number of activities that needs to be supported by the IoT Lab testbed. These phases are further described below.
First user phase: Planning the research and exploring the tool
During this phase, the researcher has not yet decided whether the research study would benefit from using a tool such as IoT Lab. Given the needed level of professionalism, stability and reliability (since most research studies do not have the finance nor the time to be repeated), this phase can be considered one of the most important for creating a sense of trust and giving the researcher an understanding of the potential.
Area Problem Suggestions/thoughts
Front page in general
It is difficult to understand which of the boxes that contain personal information and which contain public information.
A front page usually contains “news-like” information
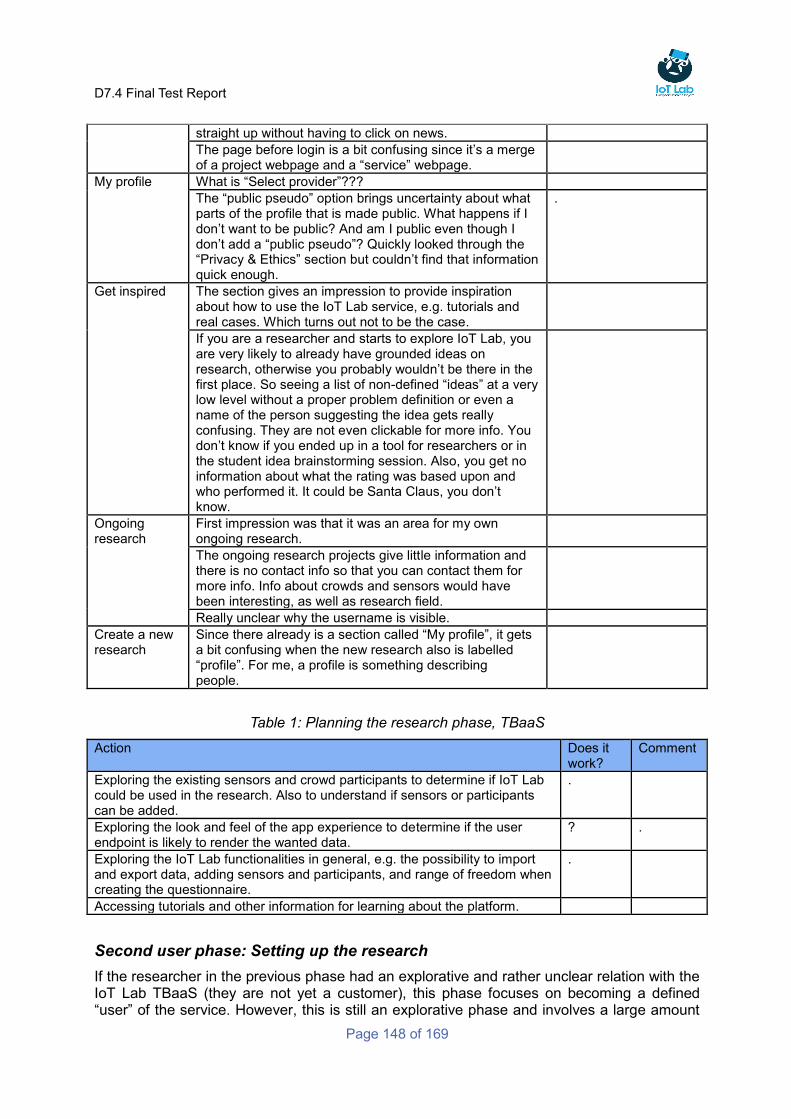
D7.4 Final Test Report
Page 148 of 169
straight up without having to click on news.
The page before login is a bit confusing since it’s a merge of a project webpage and a “service” webpage.
My profile What is “Select provider”???
The “public pseudo” option brings uncertainty about what parts of the profile that is made public. What happens if I don’t want to be public? And am I public even though I don’t add a “public pseudo”? Quickly looked through the “Privacy & Ethics” section but couldn’t find that information quick enough.
.
Get inspired The section gives an impression to provide inspiration about how to use the IoT Lab service, e.g. tutorials and real cases. Which turns out not to be the case.
If you are a researcher and starts to explore IoT Lab, you are very likely to already have grounded ideas on research, otherwise you probably wouldn’t be there in the first place. So seeing a list of non-defined “ideas” at a very low level without a proper problem definition or even a name of the person suggesting the idea gets really confusing. They are not even clickable for more info. You don’t know if you ended up in a tool for researchers or in the student idea brainstorming session. Also, you get no information about what the rating was based upon and who performed it. It could be Santa Claus, you don’t know.
Ongoing research
First impression was that it was an area for my own ongoing research.
The ongoing research projects give little information and there is no contact info so that you can contact them for more info. Info about crowds and sensors would have been interesting, as well as research field.
Really unclear why the username is visible.
Create a new research
Since there already is a section called “My profile”, it gets a bit confusing when the new research also is labelled “profile”. For me, a profile is something describing people.
Table 1: Planning the research phase, TBaaS
Action Does it work?
Comment
Exploring the existing sensors and crowd participants to determine if IoT Lab could be used in the research. Also to understand if sensors or participants can be added.
.
Exploring the look and feel of the app experience to determine if the user endpoint is likely to render the wanted data.
? .
Exploring the IoT Lab functionalities in general, e.g. the possibility to import and export data, adding sensors and participants, and range of freedom when creating the questionnaire.
.
Accessing tutorials and other information for learning about the platform.
Second user phase: Setting up the research
If the researcher in the previous phase had an explorative and rather unclear relation with the IoT Lab TBaaS (they are not yet a customer), this phase focuses on becoming a defined “user” of the service. However, this is still an explorative phase and involves a large amount
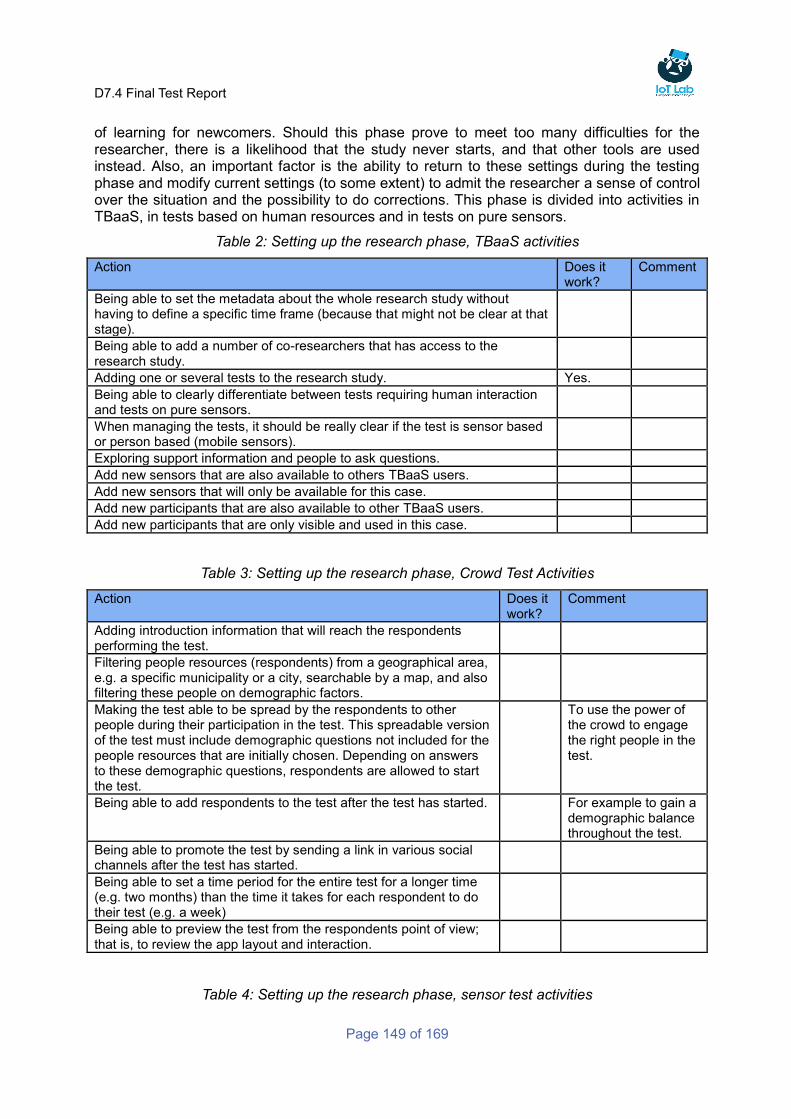
D7.4 Final Test Report
Page 149 of 169
of learning for newcomers. Should this phase prove to meet too many difficulties for the researcher, there is a likelihood that the study never starts, and that other tools are used instead. Also, an important factor is the ability to return to these settings during the testing phase and modify current settings (to some extent) to admit the researcher a sense of control over the situation and the possibility to do corrections. This phase is divided into activities in TBaaS, in tests based on human resources and in tests on pure sensors.
Table 2: Setting up the research phase, TBaaS activities
Action Does it work?
Comment
Being able to set the metadata about the whole research study without having to define a specific time frame (because that might not be clear at that stage).
Being able to add a number of co-researchers that has access to the research study.
Adding one or several tests to the research study. Yes.
Being able to clearly differentiate between tests requiring human interaction and tests on pure sensors.
When managing the tests, it should be really clear if the test is sensor based or person based (mobile sensors).
Exploring support information and people to ask questions.
Add new sensors that are also available to others TBaaS users.
Add new sensors that will only be available for this case.
Add new participants that are also available to other TBaaS users.
Add new participants that are only visible and used in this case.
Table 3: Setting up the research phase, Crowd Test Activities
Action Does it work?
Comment
Adding introduction information that will reach the respondents performing the test.
Filtering people resources (respondents) from a geographical area, e.g. a specific municipality or a city, searchable by a map, and also filtering these people on demographic factors.
Making the test able to be spread by the respondents to other people during their participation in the test. This spreadable version of the test must include demographic questions not included for the people resources that are initially chosen. Depending on answers to these demographic questions, respondents are allowed to start the test.
To use the power of the crowd to engage the right people in the test.
Being able to add respondents to the test after the test has started. For example to gain a demographic balance throughout the test.
Being able to promote the test by sending a link in various social channels after the test has started.
Being able to set a time period for the entire test for a longer time (e.g. two months) than the time it takes for each respondent to do their test (e.g. a week)
Being able to preview the test from the respondents point of view; that is, to review the app layout and interaction.
Table 4: Setting up the research phase, sensor test activities
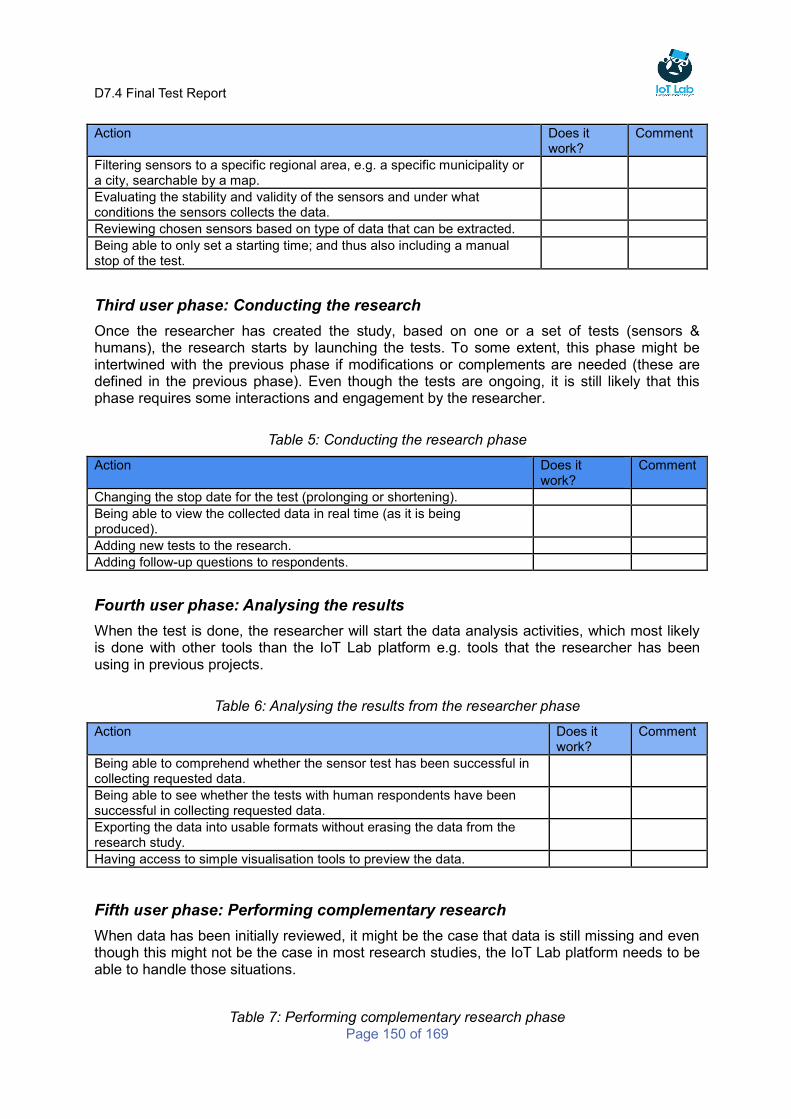
D7.4 Final Test Report
Page 150 of 169
Action Does it work?
Comment
Filtering sensors to a specific regional area, e.g. a specific municipality or a city, searchable by a map.
Evaluating the stability and validity of the sensors and under what conditions the sensors collects the data.
Reviewing chosen sensors based on type of data that can be extracted.
Being able to only set a starting time; and thus also including a manual stop of the test.
Third user phase: Conducting the research
Once the researcher has created the study, based on one or a set of tests (sensors & humans), the research starts by launching the tests. To some extent, this phase might be intertwined with the previous phase if modifications or complements are needed (these are defined in the previous phase). Even though the tests are ongoing, it is still likely that this phase requires some interactions and engagement by the researcher.
Table 5: Conducting the research phase
Action Does it work?
Comment
Changing the stop date for the test (prolonging or shortening).
Being able to view the collected data in real time (as it is being produced).
Adding new tests to the research.
Adding follow-up questions to respondents.
Fourth user phase: Analysing the results
When the test is done, the researcher will start the data analysis activities, which most likely is done with other tools than the IoT Lab platform e.g. tools that the researcher has been using in previous projects.
Table 6: Analysing the results from the researcher phase
Action Does it work?
Comment
Being able to comprehend whether the sensor test has been successful in collecting requested data.
Being able to see whether the tests with human respondents have been successful in collecting requested data.
Exporting the data into usable formats without erasing the data from the research study.
Having access to simple visualisation tools to preview the data.
Fifth user phase: Performing complementary research
When data has been initially reviewed, it might be the case that data is still missing and even though this might not be the case in most research studies, the IoT Lab platform needs to be able to handle those situations.
Table 7: Performing complementary research phase
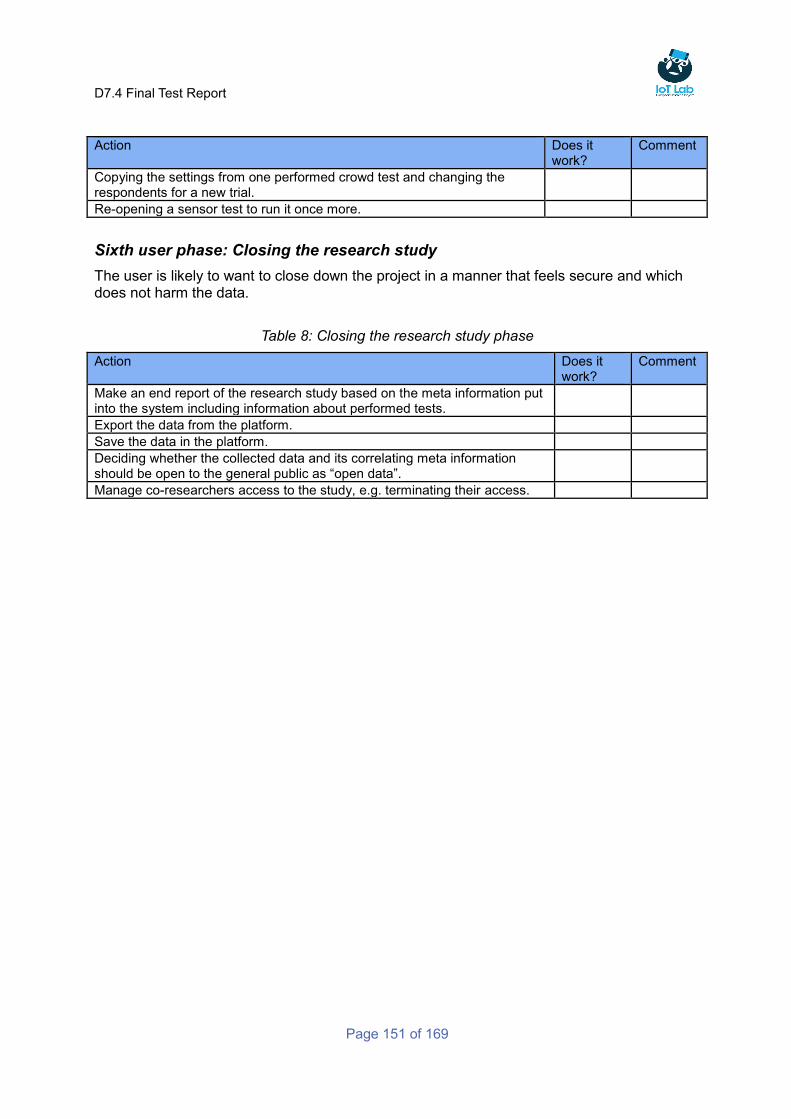
D7.4 Final Test Report
Page 151 of 169
Action Does it work?
Comment
Copying the settings from one performed crowd test and changing the respondents for a new trial.
Re-opening a sensor test to run it once more.
Sixth user phase: Closing the research study
The user is likely to want to close down the project in a manner that feels secure and which does not harm the data.
Table 8: Closing the research study phase
Action Does it work?
Comment
Make an end report of the research study based on the meta information put into the system including information about performed tests.
Export the data from the platform.
Save the data in the platform.
Deciding whether the collected data and its correlating meta information should be open to the general public as “open data”.
Manage co-researchers access to the study, e.g. terminating their access.
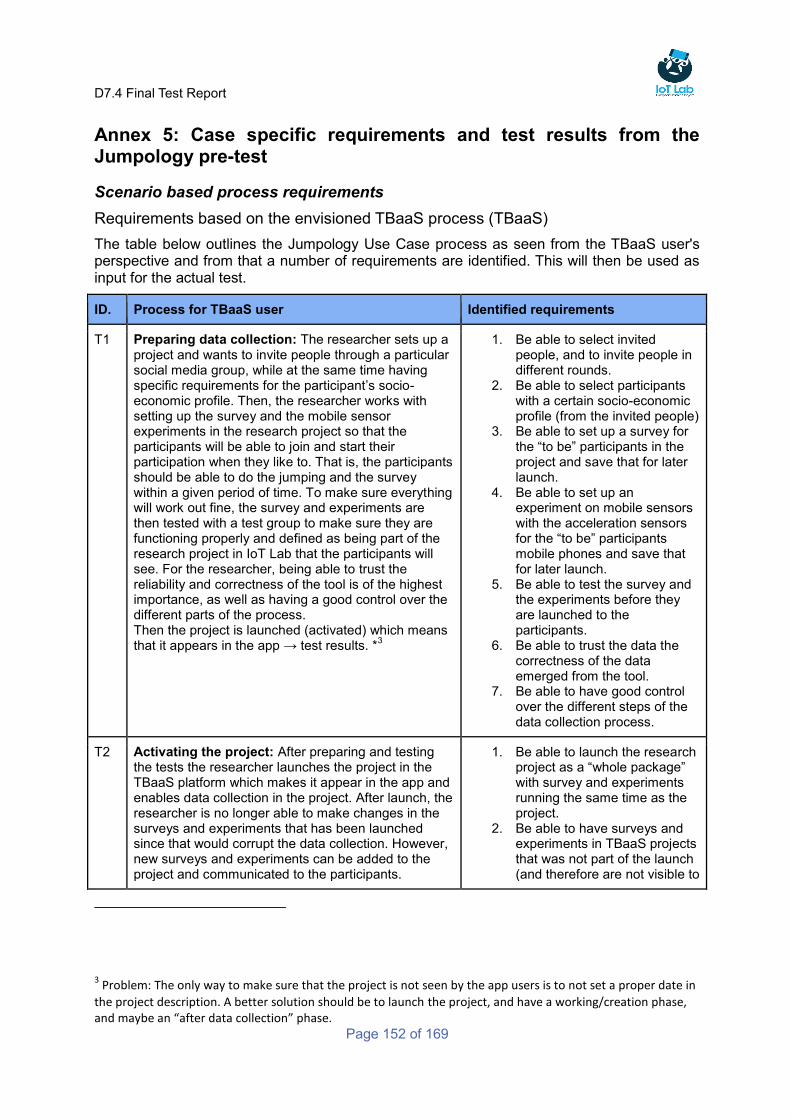
D7.4 Final Test Report
Page 152 of 169
Annex 5: Case specific requirements and test results from the Jumpology pre-test
Scenario based process requirements
Requirements based on the envisioned TBaaS process (TBaaS)
The table below outlines the Jumpology Use Case process as seen from the TBaaS user's perspective and from that a number of requirements are identified. This will then be used as input for the actual test.
ID. Process for TBaaS user Identified requirements
T1 Preparing data collection: The researcher sets up a project and wants to invite people through a particular social media group, while at the same time having specific requirements for the participant’s socio-economic profile. Then, the researcher works with setting up the survey and the mobile sensor experiments in the research project so that the participants will be able to join and start their participation when they like to. That is, the participants should be able to do the jumping and the survey within a given period of time. To make sure everything will work out fine, the survey and experiments are then tested with a test group to make sure they are functioning properly and defined as being part of the research project in IoT Lab that the participants will see. For the researcher, being able to trust the reliability and correctness of the tool is of the highest importance, as well as having a good control over the different parts of the process. Then the project is launched (activated) which means that it appears in the app → test results. *
3
1. Be able to select invited people, and to invite people in different rounds.
2. Be able to select participants with a certain socio-economic profile (from the invited people)
3. Be able to set up a survey for the “to be” participants in the project and save that for later launch.
4. Be able to set up an experiment on mobile sensors with the acceleration sensors for the “to be” participants mobile phones and save that for later launch.
5. Be able to test the survey and the experiments before they are launched to the participants.
6. Be able to trust the data the correctness of the data emerged from the tool.
7. Be able to have good control over the different steps of the data collection process.
T2 Activating the project: After preparing and testing the tests the researcher launches the project in the TBaaS platform which makes it appear in the app and enables data collection in the project. After launch, the researcher is no longer able to make changes in the surveys and experiments that has been launched since that would corrupt the data collection. However, new surveys and experiments can be added to the project and communicated to the participants.
1. Be able to launch the research project as a “whole package” with survey and experiments running the same time as the project.
2. Be able to have surveys and experiments in TBaaS projects that was not part of the launch (and therefore are not visible to
3 Problem: The only way to make sure that the project is not seen by the app users is to not set a proper date in
the project description. A better solution should be to launch the project, and have a working/creation phase, and maybe an “after data collection” phase.
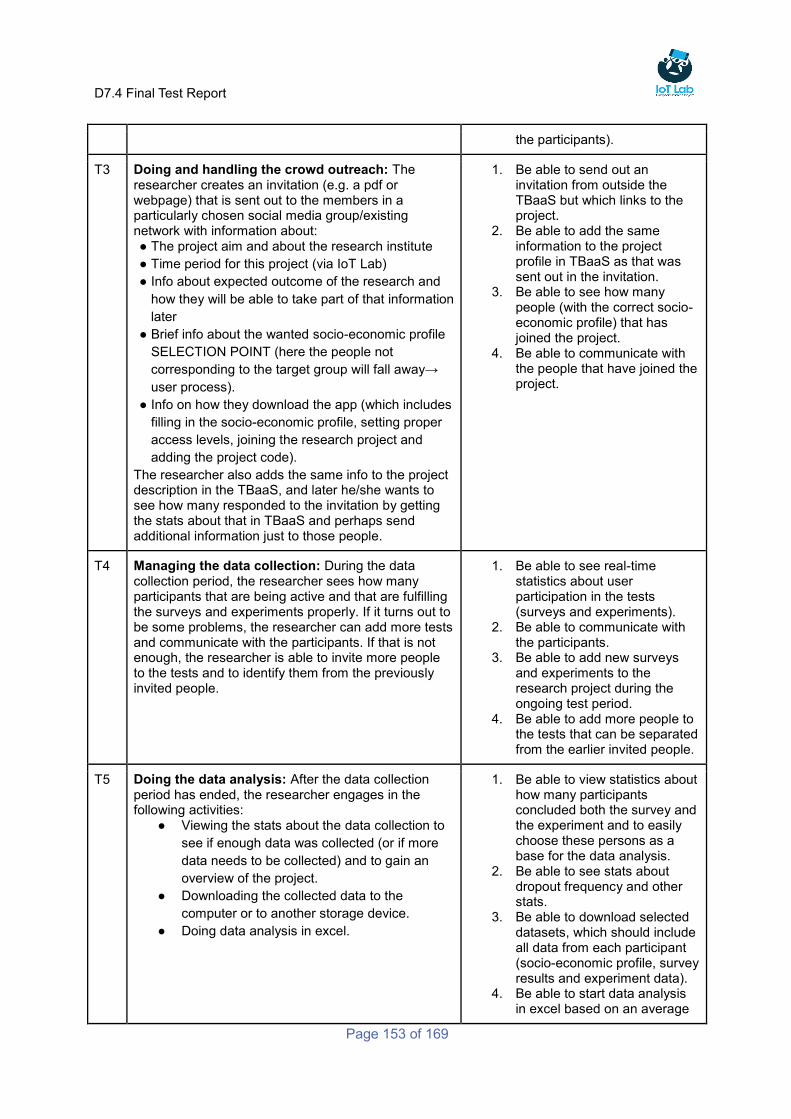
D7.4 Final Test Report
Page 153 of 169
the participants).
T3 Doing and handling the crowd outreach: The researcher creates an invitation (e.g. a pdf or webpage) that is sent out to the members in a particularly chosen social media group/existing network with information about: ● The project aim and about the research institute
● Time period for this project (via IoT Lab)
● Info about expected outcome of the research and
how they will be able to take part of that information
later
● Brief info about the wanted socio-economic profile
SELECTION POINT (here the people not
corresponding to the target group will fall away→
user process).
● Info on how they download the app (which includes
filling in the socio-economic profile, setting proper
access levels, joining the research project and
adding the project code).
The researcher also adds the same info to the project description in the TBaaS, and later he/she wants to see how many responded to the invitation by getting the stats about that in TBaaS and perhaps send additional information just to those people.
1. Be able to send out an invitation from outside the TBaaS but which links to the project.
2. Be able to add the same information to the project profile in TBaaS as that was sent out in the invitation.
3. Be able to see how many people (with the correct socio-economic profile) that has joined the project.
4. Be able to communicate with the people that have joined the project.
T4 Managing the data collection: During the data collection period, the researcher sees how many participants that are being active and that are fulfilling the surveys and experiments properly. If it turns out to be some problems, the researcher can add more tests and communicate with the participants. If that is not enough, the researcher is able to invite more people to the tests and to identify them from the previously invited people.
1. Be able to see real-time statistics about user participation in the tests (surveys and experiments).
2. Be able to communicate with the participants.
3. Be able to add new surveys and experiments to the research project during the ongoing test period.
4. Be able to add more people to the tests that can be separated from the earlier invited people.
T5 Doing the data analysis: After the data collection period has ended, the researcher engages in the following activities:
● Viewing the stats about the data collection to
see if enough data was collected (or if more
data needs to be collected) and to gain an
overview of the project.
● Downloading the collected data to the
computer or to another storage device.
● Doing data analysis in excel.
1. Be able to view statistics about how many participants concluded both the survey and the experiment and to easily choose these persons as a base for the data analysis.
2. Be able to see stats about dropout frequency and other stats.
3. Be able to download selected datasets, which should include all data from each participant (socio-economic profile, survey results and experiment data).
4. Be able to start data analysis in excel based on an average
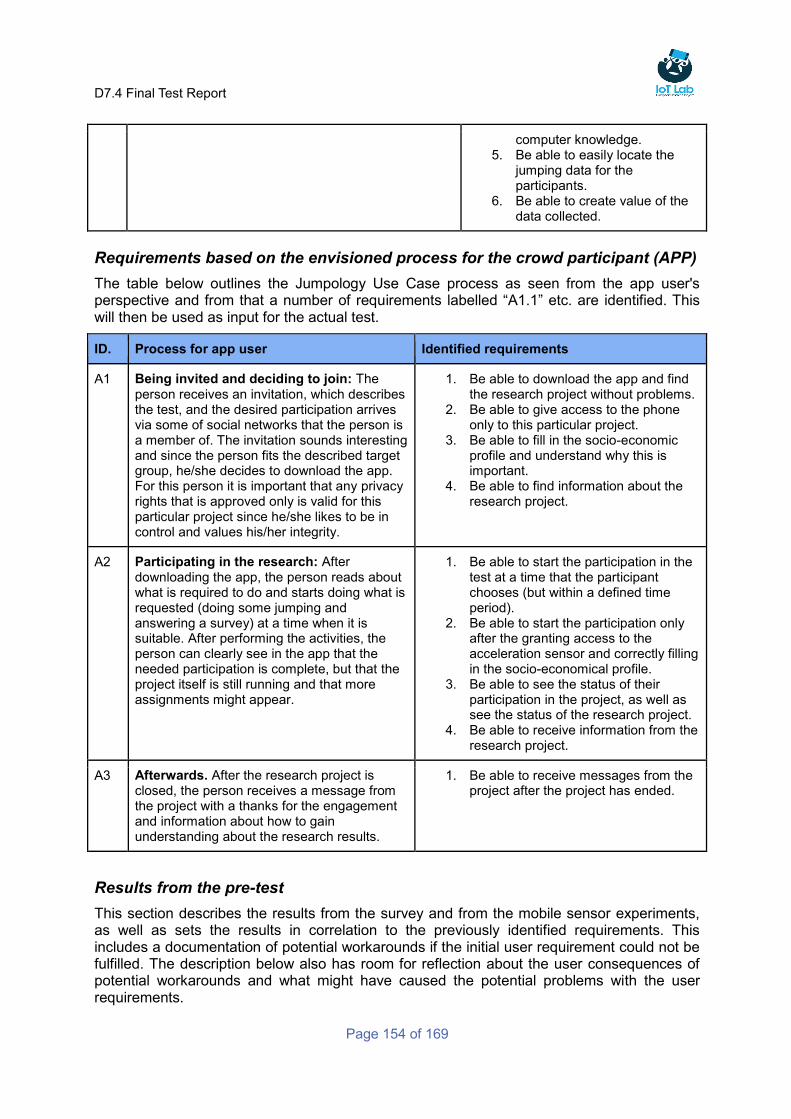
D7.4 Final Test Report
Page 154 of 169
computer knowledge. 5. Be able to easily locate the
jumping data for the participants.
6. Be able to create value of the data collected.
Requirements based on the envisioned process for the crowd participant (APP)
The table below outlines the Jumpology Use Case process as seen from the app user's perspective and from that a number of requirements labelled “A1.1” etc. are identified. This will then be used as input for the actual test.
ID. Process for app user Identified requirements
A1 Being invited and deciding to join: The person receives an invitation, which describes the test, and the desired participation arrives via some of social networks that the person is a member of. The invitation sounds interesting and since the person fits the described target group, he/she decides to download the app. For this person it is important that any privacy rights that is approved only is valid for this particular project since he/she likes to be in control and values his/her integrity.
1. Be able to download the app and find the research project without problems.
2. Be able to give access to the phone only to this particular project.
3. Be able to fill in the socio-economic profile and understand why this is important.
4. Be able to find information about the research project.
A2 Participating in the research: After downloading the app, the person reads about what is required to do and starts doing what is requested (doing some jumping and answering a survey) at a time when it is suitable. After performing the activities, the person can clearly see in the app that the needed participation is complete, but that the project itself is still running and that more assignments might appear.
1. Be able to start the participation in the test at a time that the participant chooses (but within a defined time period).
2. Be able to start the participation only after the granting access to the acceleration sensor and correctly filling in the socio-economical profile.
3. Be able to see the status of their participation in the project, as well as see the status of the research project.
4. Be able to receive information from the research project.
A3 Afterwards. After the research project is closed, the person receives a message from the project with a thanks for the engagement and information about how to gain understanding about the research results.
1. Be able to receive messages from the project after the project has ended.
Results from the pre-test
This section describes the results from the survey and from the mobile sensor experiments, as well as sets the results in correlation to the previously identified requirements. This includes a documentation of potential workarounds if the initial user requirement could not be fulfilled. The description below also has room for reflection about the user consequences of potential workarounds and what might have caused the potential problems with the user requirements.
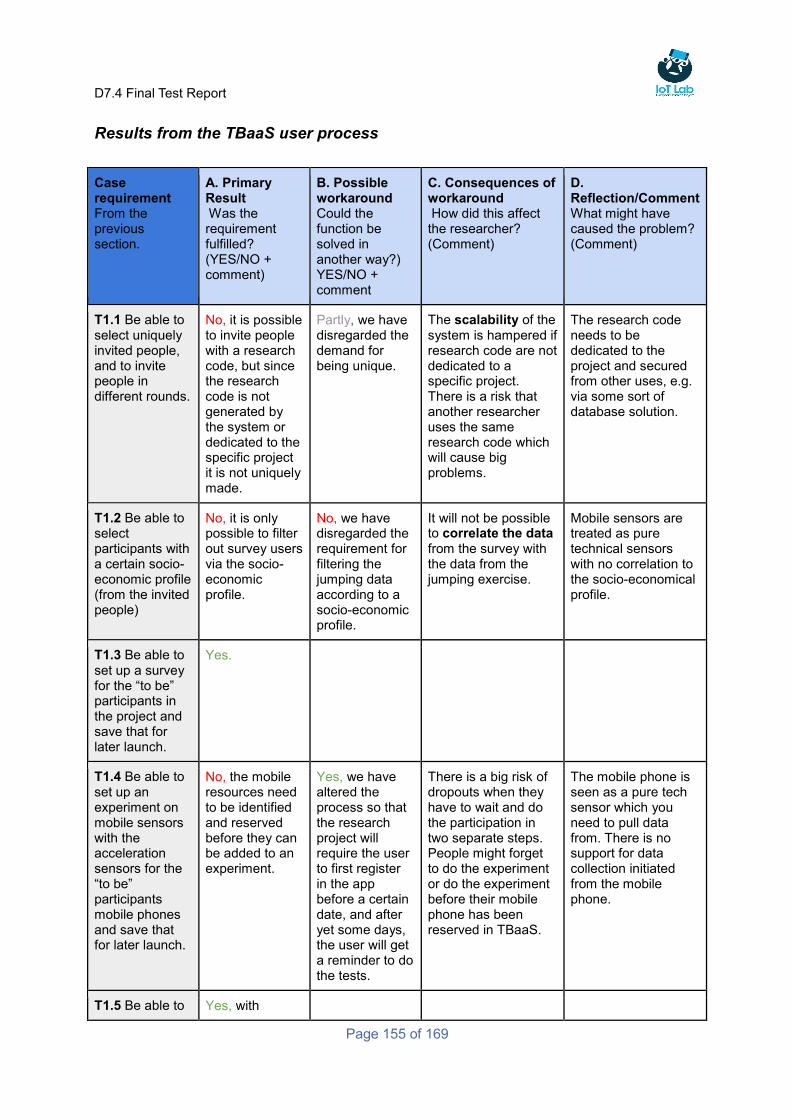
D7.4 Final Test Report
Page 155 of 169
Results from the TBaaS user process
Case requirement From the previous section.
A. Primary Result Was the requirement fulfilled? (YES/NO + comment)
B. Possible workaround Could the function be solved in another way?) YES/NO + comment
C. Consequences of workaround How did this affect the researcher? (Comment)
D. Reflection/Comment What might have caused the problem? (Comment)
T1.1 Be able to select uniquely invited people, and to invite people in different rounds.
No, it is possible to invite people with a research code, but since the research code is not generated by the system or dedicated to the specific project it is not uniquely made.
Partly, we have disregarded the demand for being unique.
The scalability of the system is hampered if research code are not dedicated to a specific project. There is a risk that another researcher uses the same research code which will cause big problems.
The research code needs to be dedicated to the project and secured from other uses, e.g. via some sort of database solution.
T1.2 Be able to select participants with a certain socio-economic profile (from the invited people)
No, it is only possible to filter out survey users via the socio-economic profile.
No, we have disregarded the requirement for filtering the jumping data according to a socio-economic profile.
It will not be possible to correlate the data from the survey with the data from the jumping exercise.
Mobile sensors are treated as pure technical sensors with no correlation to the socio-economical profile.
T1.3 Be able to set up a survey for the “to be” participants in the project and save that for later launch.
Yes.
T1.4 Be able to set up an experiment on mobile sensors with the acceleration sensors for the “to be” participants mobile phones and save that for later launch.
No, the mobile resources need to be identified and reserved before they can be added to an experiment.
Yes, we have altered the process so that the research project will require the user to first register in the app before a certain date, and after yet some days, the user will get a reminder to do the tests.
There is a big risk of dropouts when they have to wait and do the participation in two separate steps. People might forget to do the experiment or do the experiment before their mobile phone has been reserved in TBaaS.
The mobile phone is seen as a pure tech sensor which you need to pull data from. There is no support for data collection initiated from the mobile phone.
T1.5 Be able to Yes, with

D7.4 Final Test Report
Page 156 of 169
Case requirement From the previous section.
A. Primary Result Was the requirement fulfilled? (YES/NO + comment)
B. Possible workaround Could the function be solved in another way?) YES/NO + comment
C. Consequences of workaround How did this affect the researcher? (Comment)
D. Reflection/Comment What might have caused the problem? (Comment)
test the survey and the experiments before they are launched to the participants.
internal resources.
T1.6 Be able to trust the data the correctness of the data emerged from the tool.
No. The low reliability on the experimentation data, the lack of status and setup information affects trust.
No. And we really tried. See details further back in “ Results from “Crowd interactions” – data from survey” and
“Results from “IoT Interactions” – Data from experiment.”
Very high consequences since the data is what will create the key value from IoT Lab.
Lack of focus on user (researcher) need and all parts of the user process.
T1.7 Be able to have good control over the different steps of the data collection process.
No. Especially the data collection process is difficult to oversee because of lack of status and setup info, but also on lack of functionality to support cases like Jumpology.
No. We did not find a way. See details further back in “ Results from “Crowd interactions” – data from survey” and
“Results from “IoT Interactions” – Data from experiment.”
Very high consequences since it is of highest importance that the user (researcher) must be able to finalize the process, not just collect some data.
Lack of focus on user (researcher) need and all parts of the user process.
T2.1 Be able to launch the research project as a “whole package” with survey and experiments running the same time as
No, surveys, experiments and the research project as such act as separate entities.
Yes. We have manually worked with synchronizing the different parts of the research project. This goes for both
When the different parts are not treated as a package, there is a risk for time issues, e.g. that the project happens to end before the experiments have been conducted to
The only way to make sure that the research project is not “launched” in the app is to not set a proper date in the project description. But the major problem is that there
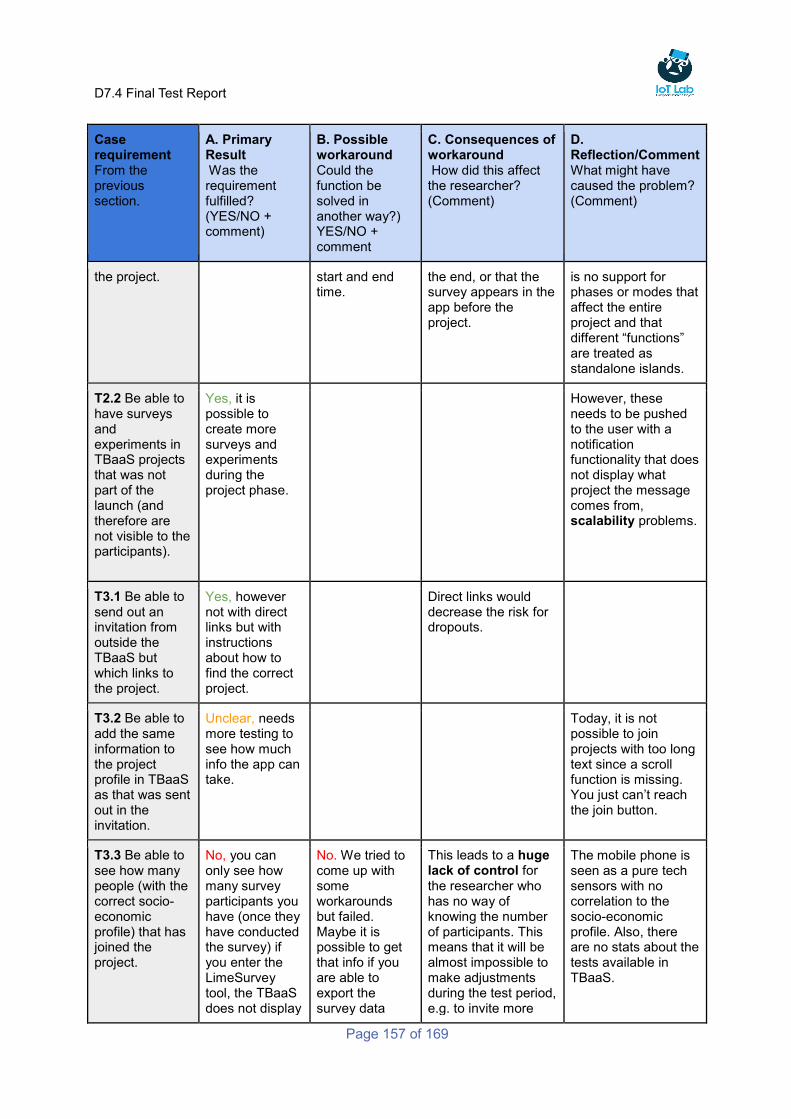
D7.4 Final Test Report
Page 157 of 169
Case requirement From the previous section.
A. Primary Result Was the requirement fulfilled? (YES/NO + comment)
B. Possible workaround Could the function be solved in another way?) YES/NO + comment
C. Consequences of workaround How did this affect the researcher? (Comment)
D. Reflection/Comment What might have caused the problem? (Comment)
the project. start and end time.
the end, or that the survey appears in the app before the project.
is no support for phases or modes that affect the entire project and that different “functions” are treated as standalone islands.
T2.2 Be able to have surveys and experiments in TBaaS projects that was not part of the launch (and therefore are not visible to the participants).
Yes, it is possible to create more surveys and experiments during the project phase.
However, these needs to be pushed to the user with a notification functionality that does not display what project the message comes from, scalability problems.
T3.1 Be able to send out an invitation from outside the TBaaS but which links to the project.
Yes, however not with direct links but with instructions about how to find the correct project.
Direct links would decrease the risk for dropouts.
T3.2 Be able to add the same information to the project profile in TBaaS as that was sent out in the invitation.
Unclear, needs more testing to see how much info the app can take.
Today, it is not possible to join projects with too long text since a scroll function is missing. You just can’t reach the join button.
T3.3 Be able to see how many people (with the correct socio-economic profile) that has joined the project.
No, you can only see how many survey participants you have (once they have conducted the survey) if you enter the LimeSurvey tool, the TBaaS does not display
No. We tried to come up with some workarounds but failed. Maybe it is possible to get that info if you are able to export the survey data
This leads to a huge lack of control for the researcher who has no way of knowing the number of participants. This means that it will be almost impossible to make adjustments during the test period, e.g. to invite more
The mobile phone is seen as a pure tech sensors with no correlation to the socio-economic profile. Also, there are no stats about the tests available in TBaaS.
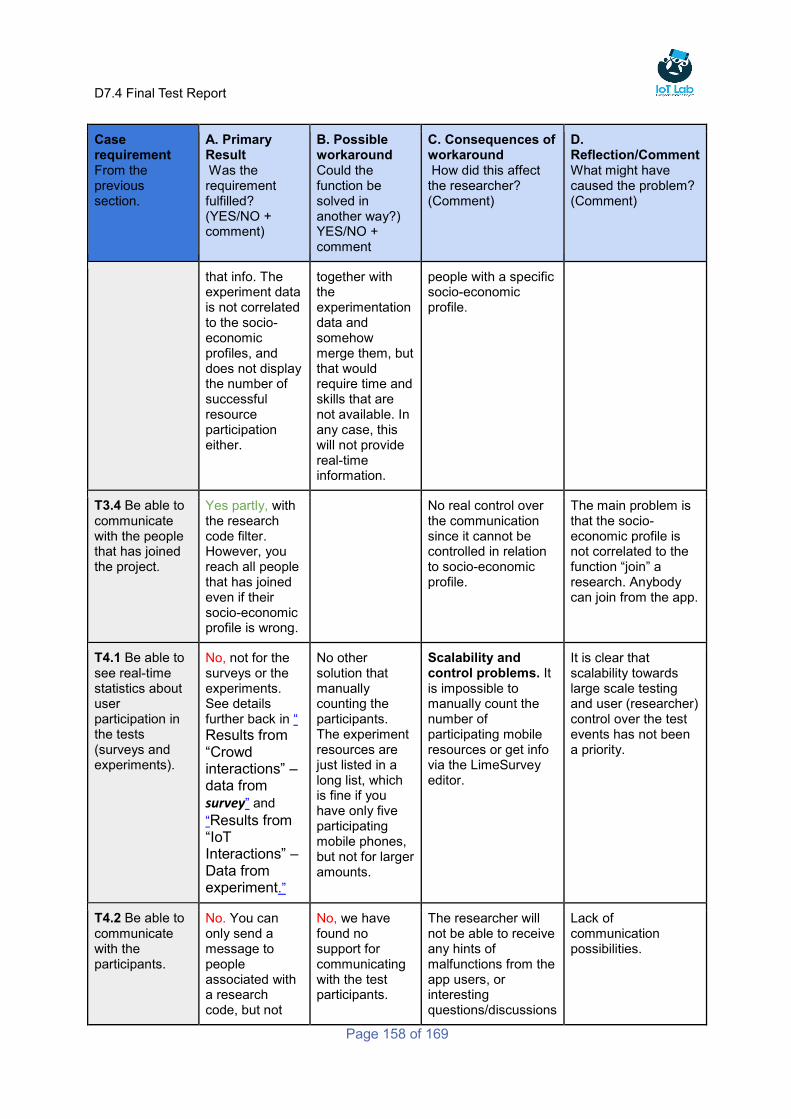
D7.4 Final Test Report
Page 158 of 169
Case requirement From the previous section.
A. Primary Result Was the requirement fulfilled? (YES/NO + comment)
B. Possible workaround Could the function be solved in another way?) YES/NO + comment
C. Consequences of workaround How did this affect the researcher? (Comment)
D. Reflection/Comment What might have caused the problem? (Comment)
that info. The experiment data is not correlated to the socio-economic profiles, and does not display the number of successful resource participation either.
together with the experimentation data and somehow merge them, but that would require time and skills that are not available. In any case, this will not provide real-time information.
people with a specific socio-economic profile.
T3.4 Be able to communicate with the people that has joined the project.
Yes partly, with the research code filter. However, you reach all people that has joined even if their socio-economic profile is wrong.
No real control over the communication since it cannot be controlled in relation to socio-economic profile.
The main problem is that the socio-economic profile is not correlated to the function “join” a research. Anybody can join from the app.
T4.1 Be able to see real-time statistics about user participation in the tests (surveys and experiments).
No, not for the surveys or the experiments. See details further back in “ Results from “Crowd interactions” – data from survey” and
“Results from “IoT Interactions” – Data from experiment.”
No other solution that manually counting the participants. The experiment resources are just listed in a long list, which is fine if you have only five participating mobile phones, but not for larger amounts.
Scalability and control problems. It is impossible to manually count the number of participating mobile resources or get info via the LimeSurvey editor.
It is clear that scalability towards large scale testing and user (researcher) control over the test events has not been a priority.
T4.2 Be able to communicate with the participants.
No. You can only send a message to people associated with a research code, but not
No, we have found no support for communicating with the test participants.
The researcher will not be able to receive any hints of malfunctions from the app users, or interesting questions/discussions
Lack of communication possibilities.
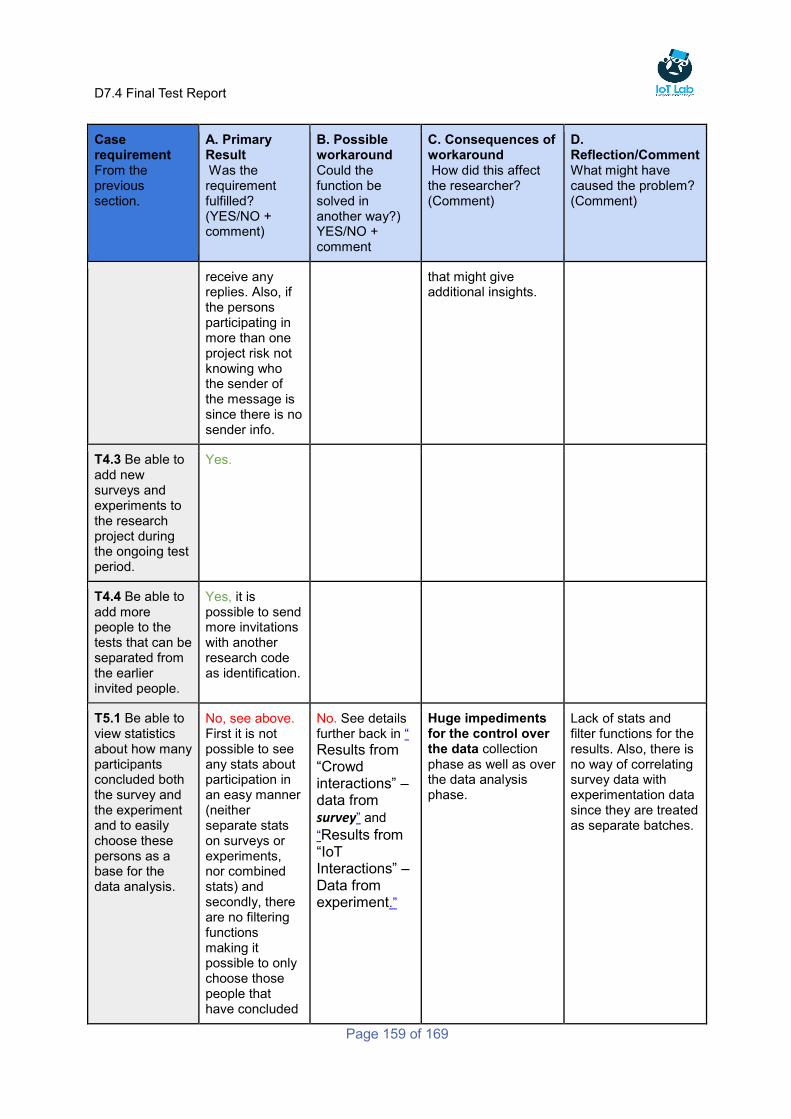
D7.4 Final Test Report
Page 159 of 169
Case requirement From the previous section.
A. Primary Result Was the requirement fulfilled? (YES/NO + comment)
B. Possible workaround Could the function be solved in another way?) YES/NO + comment
C. Consequences of workaround How did this affect the researcher? (Comment)
D. Reflection/Comment What might have caused the problem? (Comment)
receive any replies. Also, if the persons participating in more than one project risk not knowing who the sender of the message is since there is no sender info.
that might give additional insights.
T4.3 Be able to add new surveys and experiments to the research project during the ongoing test period.
Yes.
T4.4 Be able to add more people to the tests that can be separated from the earlier invited people.
Yes, it is possible to send more invitations with another research code as identification.
T5.1 Be able to view statistics about how many participants concluded both the survey and the experiment and to easily choose these persons as a base for the data analysis.
No, see above. First it is not possible to see any stats about participation in an easy manner (neither separate stats on surveys or experiments, nor combined stats) and secondly, there are no filtering functions making it possible to only choose those people that have concluded
No. See details further back in “ Results from “Crowd interactions” – data from survey” and
“Results from “IoT Interactions” – Data from experiment.”
Huge impediments for the control over the data collection phase as well as over the data analysis phase.
Lack of stats and filter functions for the results. Also, there is no way of correlating survey data with experimentation data since they are treated as separate batches.
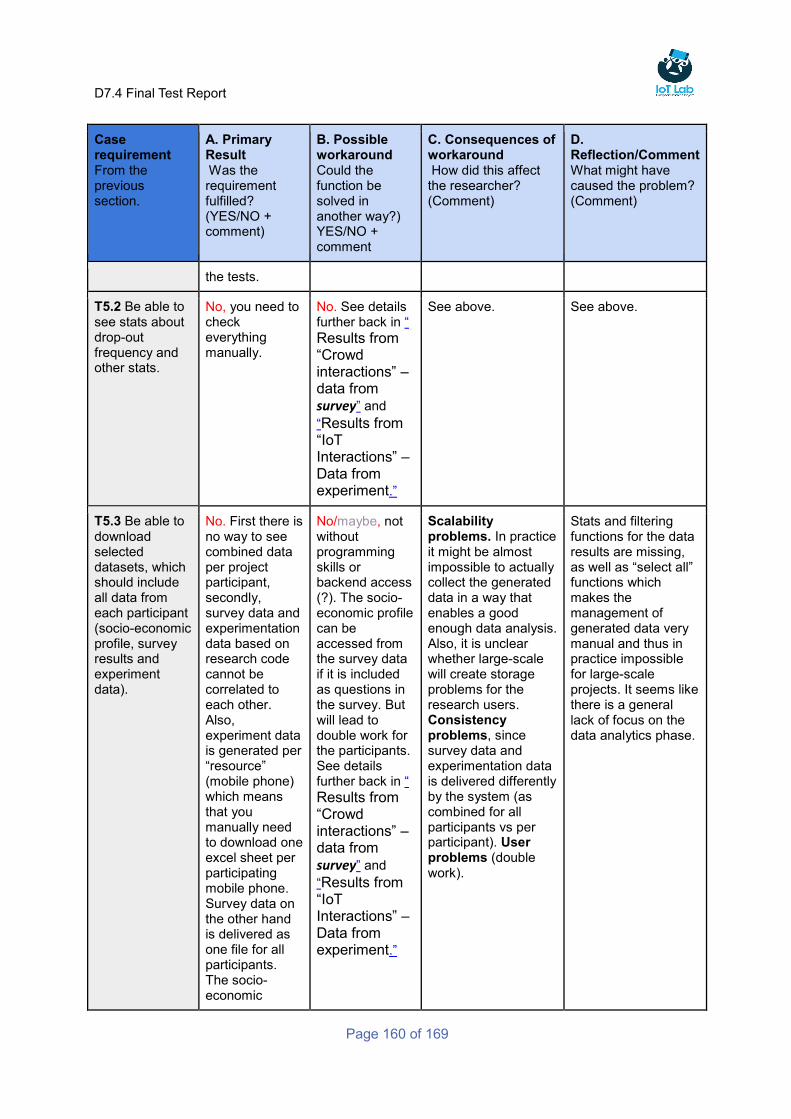
D7.4 Final Test Report
Page 160 of 169
Case requirement From the previous section.
A. Primary Result Was the requirement fulfilled? (YES/NO + comment)
B. Possible workaround Could the function be solved in another way?) YES/NO + comment
C. Consequences of workaround How did this affect the researcher? (Comment)
D. Reflection/Comment What might have caused the problem? (Comment)
the tests.
T5.2 Be able to see stats about drop-out frequency and other stats.
No, you need to check everything manually.
No. See details further back in “ Results from “Crowd interactions” – data from survey” and
“Results from “IoT Interactions” – Data from experiment.”
See above. See above.
T5.3 Be able to download selected datasets, which should include all data from each participant (socio-economic profile, survey results and experiment data).
No. First there is no way to see combined data per project participant, secondly, survey data and experimentation data based on research code cannot be correlated to each other. Also, experiment data is generated per “resource” (mobile phone) which means that you manually need to download one excel sheet per participating mobile phone. Survey data on the other hand is delivered as one file for all participants. The socio-economic
No/maybe, not without programming skills or backend access (?). The socio-economic profile can be accessed from the survey data if it is included as questions in the survey. But will lead to double work for the participants. See details further back in “ Results from “Crowd interactions” – data from survey” and
“Results from “IoT Interactions” – Data from experiment.”
Scalability problems. In practice it might be almost impossible to actually collect the generated data in a way that enables a good enough data analysis. Also, it is unclear whether large-scale will create storage problems for the research users. Consistency problems, since survey data and experimentation data is delivered differently by the system (as combined for all participants vs per participant). User problems (double work).
Stats and filtering functions for the data results are missing, as well as “select all” functions which makes the management of generated data very manual and thus in practice impossible for large-scale projects. It seems like there is a general lack of focus on the data analytics phase.
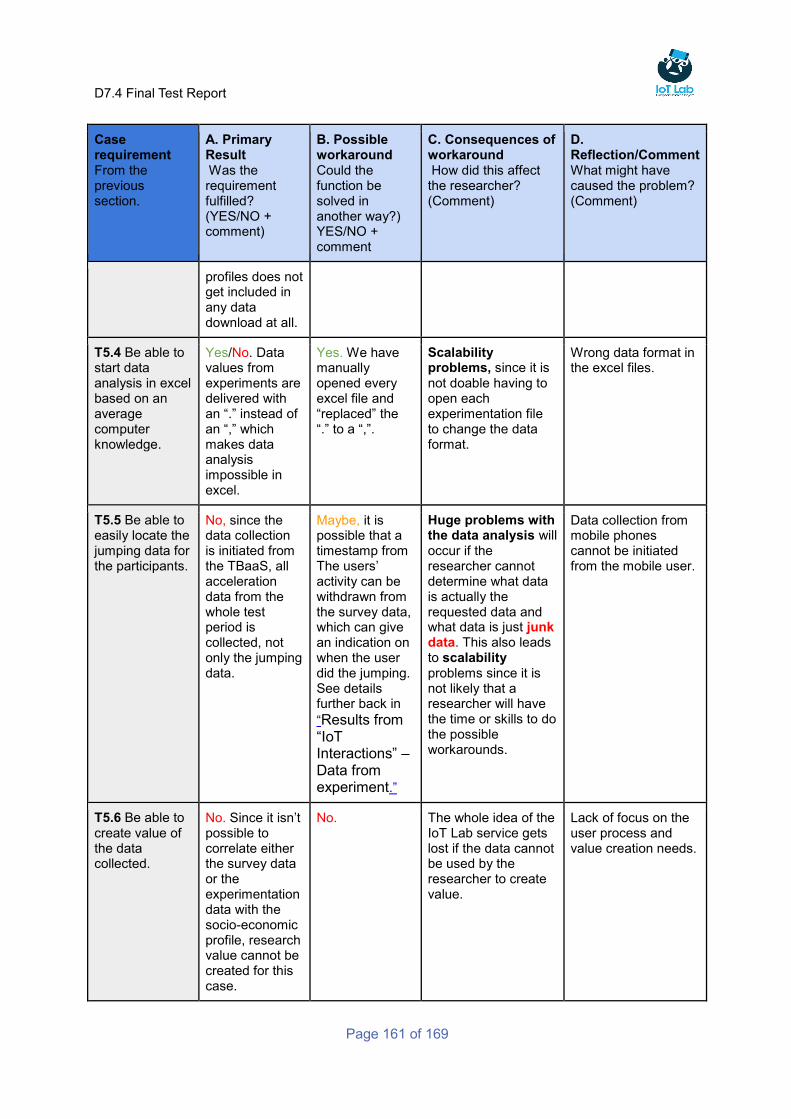
D7.4 Final Test Report
Page 161 of 169
Case requirement From the previous section.
A. Primary Result Was the requirement fulfilled? (YES/NO + comment)
B. Possible workaround Could the function be solved in another way?) YES/NO + comment
C. Consequences of workaround How did this affect the researcher? (Comment)
D. Reflection/Comment What might have caused the problem? (Comment)
profiles does not get included in any data download at all.
T5.4 Be able to start data analysis in excel based on an average computer knowledge.
Yes/No. Data values from experiments are delivered with an “.” instead of an “,” which makes data analysis impossible in excel.
Yes. We have manually opened every excel file and “replaced” the “.” to a “,”.
Scalability problems, since it is not doable having to open each experimentation file to change the data format.
Wrong data format in the excel files.
T5.5 Be able to easily locate the jumping data for the participants.
No, since the data collection is initiated from the TBaaS, all acceleration data from the whole test period is collected, not only the jumping data.
Maybe, it is possible that a timestamp from The users’ activity can be withdrawn from the survey data, which can give an indication on when the user did the jumping. See details further back in
“Results from “IoT Interactions” – Data from experiment.”
Huge problems with the data analysis will occur if the researcher cannot determine what data is actually the requested data and what data is just junk data. This also leads to scalability problems since it is not likely that a researcher will have the time or skills to do the possible workarounds.
Data collection from mobile phones cannot be initiated from the mobile user.
T5.6 Be able to create value of the data collected.
No. Since it isn’t possible to correlate either the survey data or the experimentation data with the socio-economic profile, research value cannot be created for this case.
No. The whole idea of the IoT Lab service gets lost if the data cannot be used by the researcher to create value.
Lack of focus on the user process and value creation needs.

D7.4 Final Test Report
Page 162 of 169
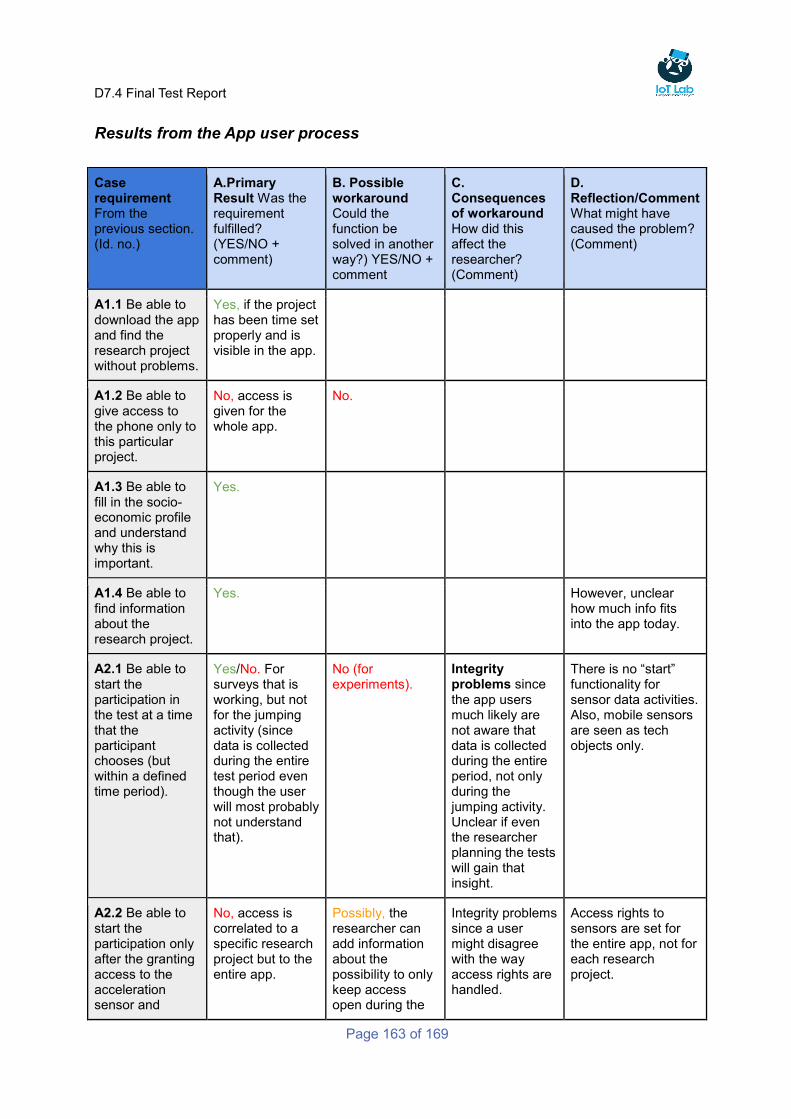
D7.4 Final Test Report
Page 163 of 169
Results from the App user process
Case requirement From the previous section. (Id. no.)
A.Primary Result Was the requirement fulfilled? (YES/NO + comment)
B. Possible workaround Could the function be solved in another way?) YES/NO + comment
C. Consequences of workaround How did this affect the researcher? (Comment)
D. Reflection/Comment What might have caused the problem? (Comment)
A1.1 Be able to download the app and find the research project without problems.
Yes, if the project has been time set properly and is visible in the app.
A1.2 Be able to give access to the phone only to this particular project.
No, access is given for the whole app.
No.
A1.3 Be able to fill in the socio-economic profile and understand why this is important.
Yes.
A1.4 Be able to find information about the research project.
Yes. However, unclear how much info fits into the app today.
A2.1 Be able to start the participation in the test at a time that the participant chooses (but within a defined time period).
Yes/No. For surveys that is working, but not for the jumping activity (since data is collected during the entire test period even though the user will most probably not understand that).
No (for experiments).
Integrity problems since the app users much likely are not aware that data is collected during the entire period, not only during the jumping activity. Unclear if even the researcher planning the tests will gain that insight.
There is no “start” functionality for sensor data activities. Also, mobile sensors are seen as tech objects only.
A2.2 Be able to start the participation only after the granting access to the acceleration sensor and
No, access is correlated to a specific research project but to the entire app.
Possibly, the researcher can add information about the possibility to only keep access open during the
Integrity problems since a user might disagree with the way access rights are handled.
Access rights to sensors are set for the entire app, not for each research project.
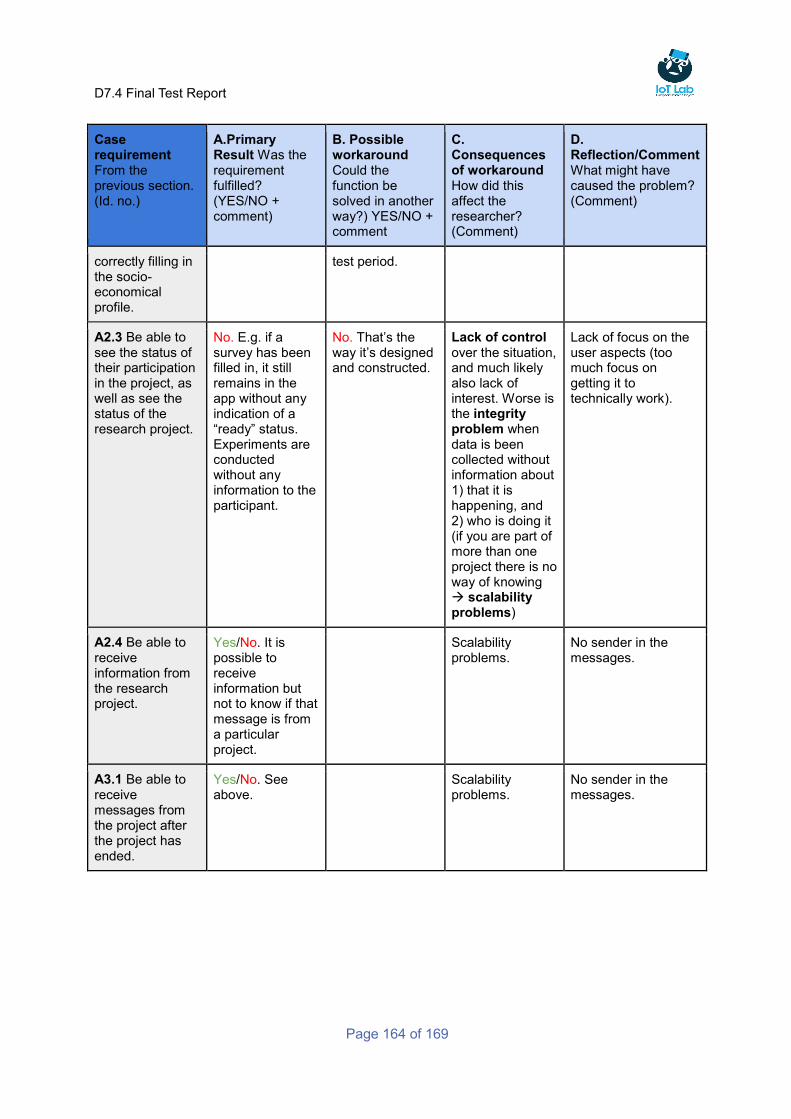
D7.4 Final Test Report
Page 164 of 169
Case requirement From the previous section. (Id. no.)
A.Primary Result Was the requirement fulfilled? (YES/NO + comment)
B. Possible workaround Could the function be solved in another way?) YES/NO + comment
C. Consequences of workaround How did this affect the researcher? (Comment)
D. Reflection/Comment What might have caused the problem? (Comment)
correctly filling in the socio-economical profile.
test period.
A2.3 Be able to see the status of their participation in the project, as well as see the status of the research project.
No. E.g. if a survey has been filled in, it still remains in the app without any indication of a “ready” status. Experiments are conducted without any information to the participant.
No. That’s the way it’s designed and constructed.
Lack of control over the situation, and much likely also lack of interest. Worse is the integrity problem when data is been collected without information about 1) that it is happening, and 2) who is doing it (if you are part of more than one project there is no way of knowing scalability problems)
Lack of focus on the user aspects (too much focus on getting it to technically work).
A2.4 Be able to receive information from the research project.
Yes/No. It is possible to receive information but not to know if that message is from a particular project.
Scalability problems.
No sender in the messages.
A3.1 Be able to receive messages from the project after the project has ended.
Yes/No. See above.
Scalability problems.
No sender in the messages.
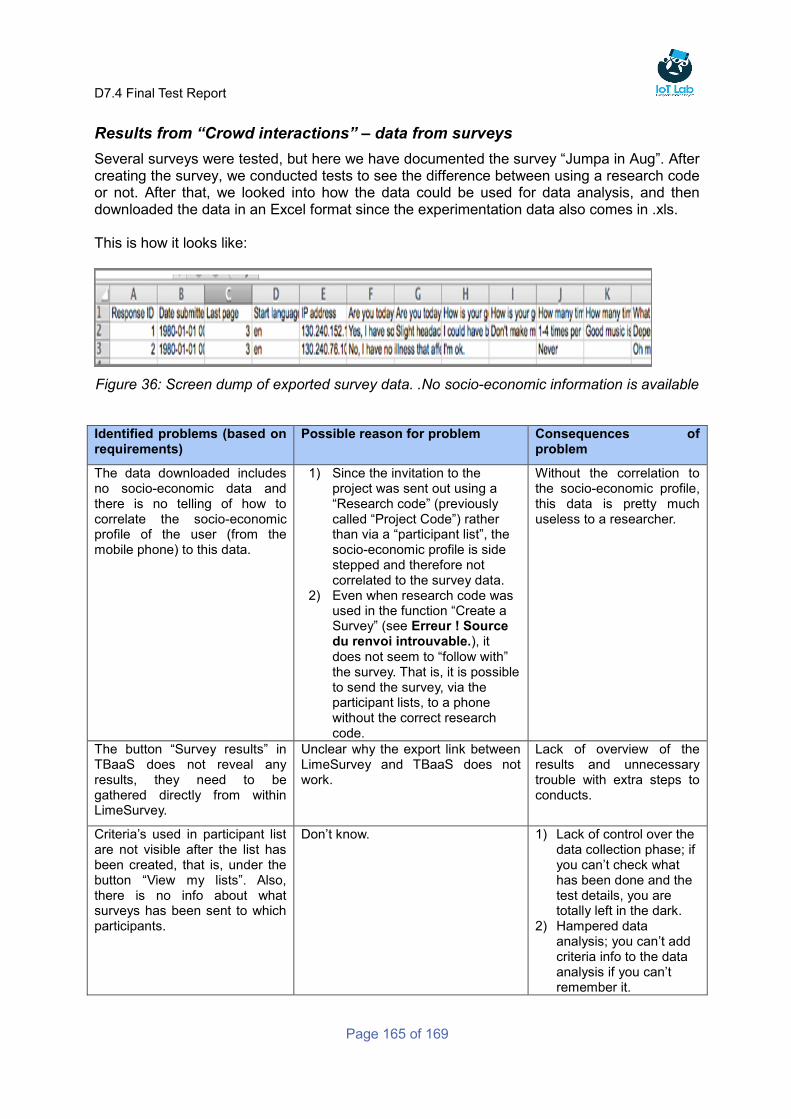
D7.4 Final Test Report
Page 165 of 169
Results from “Crowd interactions” – data from surveys
Several surveys were tested, but here we have documented the survey “Jumpa in Aug”. After creating the survey, we conducted tests to see the difference between using a research code or not. After that, we looked into how the data could be used for data analysis, and then downloaded the data in an Excel format since the experimentation data also comes in .xls. This is how it looks like:
Figure 36: Screen dump of exported survey data. .No socio-economic information is available
Identified problems (based on requirements)
Possible reason for problem Consequences of problem
The data downloaded includes no socio-economic data and there is no telling of how to correlate the socio-economic profile of the user (from the mobile phone) to this data.
1) Since the invitation to the project was sent out using a “Research code” (previously called “Project Code”) rather than via a “participant list”, the socio-economic profile is side stepped and therefore not correlated to the survey data.
2) Even when research code was used in the function “Create a Survey” (see Erreur ! Source du renvoi introuvable.), it does not seem to “follow with” the survey. That is, it is possible to send the survey, via the participant lists, to a phone without the correct research code.
Without the correlation to the socio-economic profile, this data is pretty much useless to a researcher.
The button “Survey results” in TBaaS does not reveal any results, they need to be gathered directly from within LimeSurvey.
Unclear why the export link between LimeSurvey and TBaaS does not work.
Lack of overview of the results and unnecessary trouble with extra steps to conducts.
Criteria’s used in participant list are not visible after the list has been created, that is, under the button “View my lists”. Also, there is no info about what surveys has been sent to which participants.
Don’t know. 1) Lack of control over the data collection phase; if you can’t check what has been done and the test details, you are totally left in the dark.
2) Hampered data analysis; you can’t add criteria info to the data analysis if you can’t remember it.
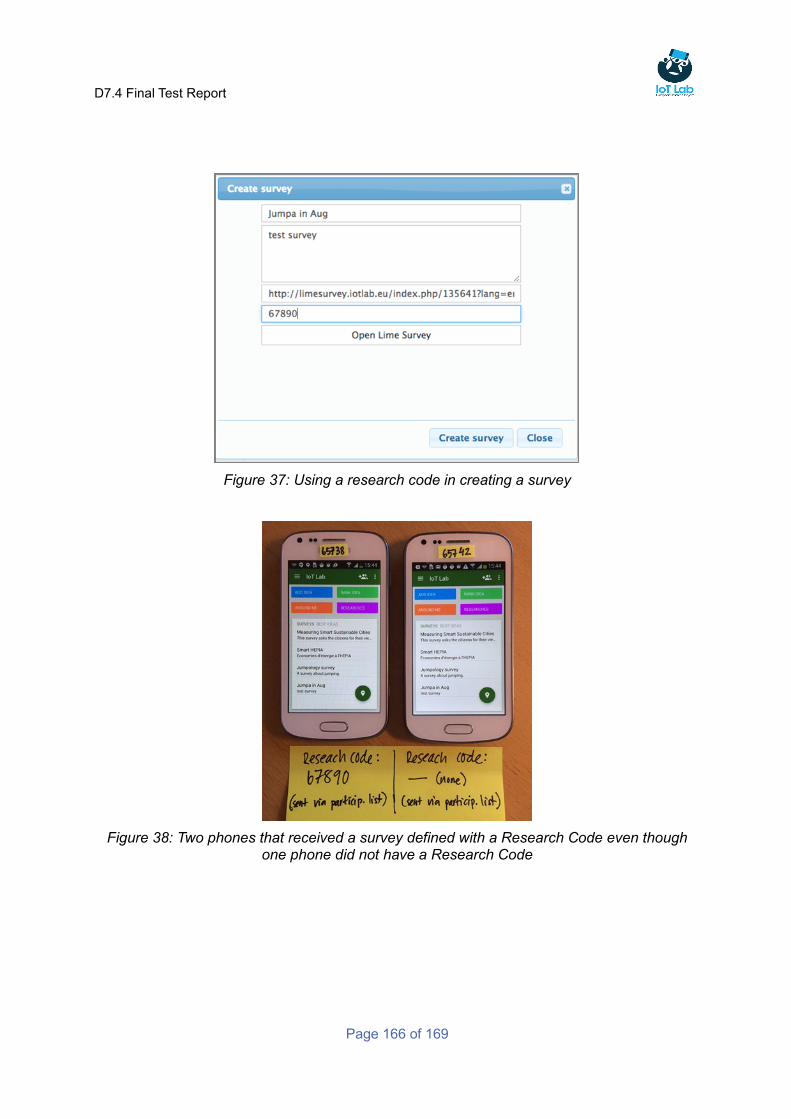
D7.4 Final Test Report
Page 166 of 169
Figure 37: Using a research code in creating a survey
Figure 38: Two phones that received a survey defined with a Research Code even though one phone did not have a Research Code
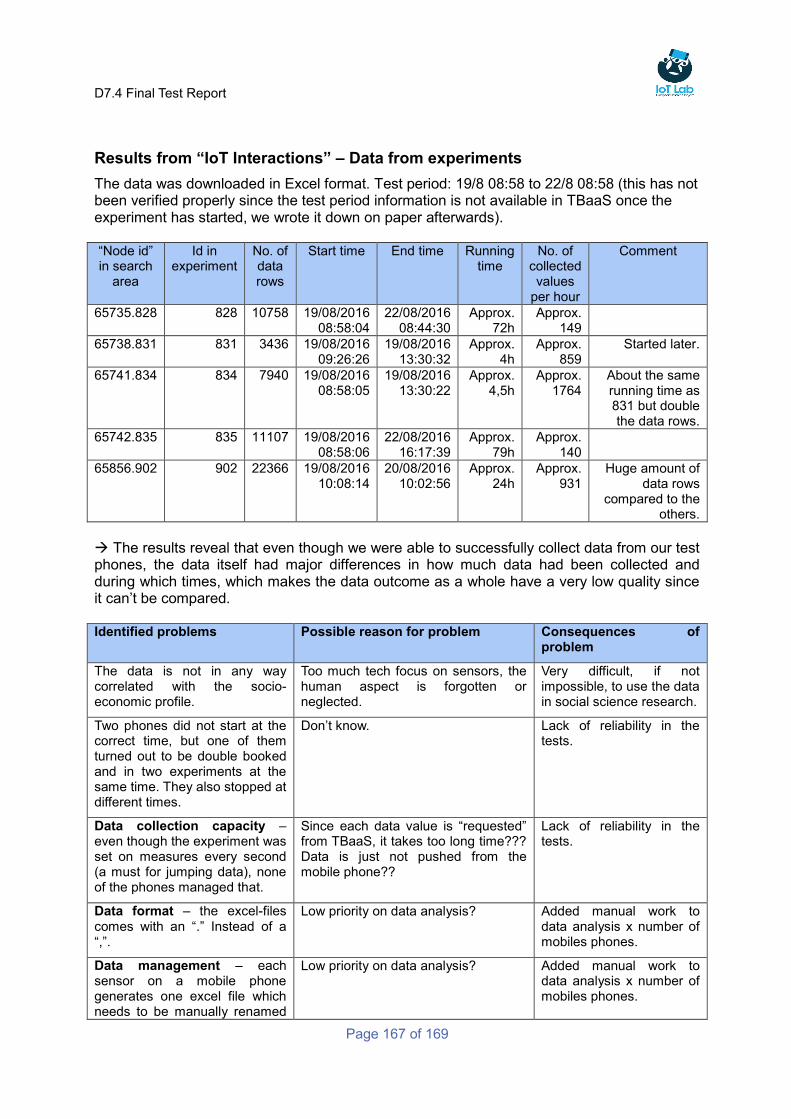
D7.4 Final Test Report
Page 167 of 169
Results from “IoT Interactions” – Data from experiments
The data was downloaded in Excel format. Test period: 19/8 08:58 to 22/8 08:58 (this has not been verified properly since the test period information is not available in TBaaS once the experiment has started, we wrote it down on paper afterwards). “Node id” in search
area
Id in experiment
No. of data rows
Start time End time Running time
No. of collected values
per hour
Comment
65735.828 828 10758 19/08/2016 08:58:04
22/08/2016 08:44:30
Approx. 72h
Approx. 149
65738.831 831 3436 19/08/2016 09:26:26
19/08/2016 13:30:32
Approx. 4h
Approx. 859
Started later.
65741.834 834 7940 19/08/2016 08:58:05
19/08/2016 13:30:22
Approx. 4,5h
Approx. 1764
About the same running time as 831 but double the data rows.
65742.835 835 11107 19/08/2016 08:58:06
22/08/2016 16:17:39
Approx. 79h
Approx. 140
65856.902 902 22366 19/08/2016 10:08:14
20/08/2016 10:02:56
Approx. 24h
Approx. 931
Huge amount of data rows
compared to the others.
The results reveal that even though we were able to successfully collect data from our test phones, the data itself had major differences in how much data had been collected and during which times, which makes the data outcome as a whole have a very low quality since it can’t be compared. Identified problems Possible reason for problem Consequences of
problem
The data is not in any way correlated with the socio-economic profile.
Too much tech focus on sensors, the human aspect is forgotten or neglected.
Very difficult, if not impossible, to use the data in social science research.
Two phones did not start at the correct time, but one of them turned out to be double booked and in two experiments at the same time. They also stopped at different times.
Don’t know. Lack of reliability in the tests.
Data collection capacity – even though the experiment was set on measures every second (a must for jumping data), none of the phones managed that.
Since each data value is “requested” from TBaaS, it takes too long time??? Data is just not pushed from the mobile phone??
Lack of reliability in the tests.
Data format – the excel-files comes with an “.” Instead of a “,”.
Low priority on data analysis? Added manual work to data analysis x number of mobiles phones.
Data management – each sensor on a mobile phone generates one excel file which needs to be manually renamed
Low priority on data analysis? Added manual work to data analysis x number of mobiles phones.
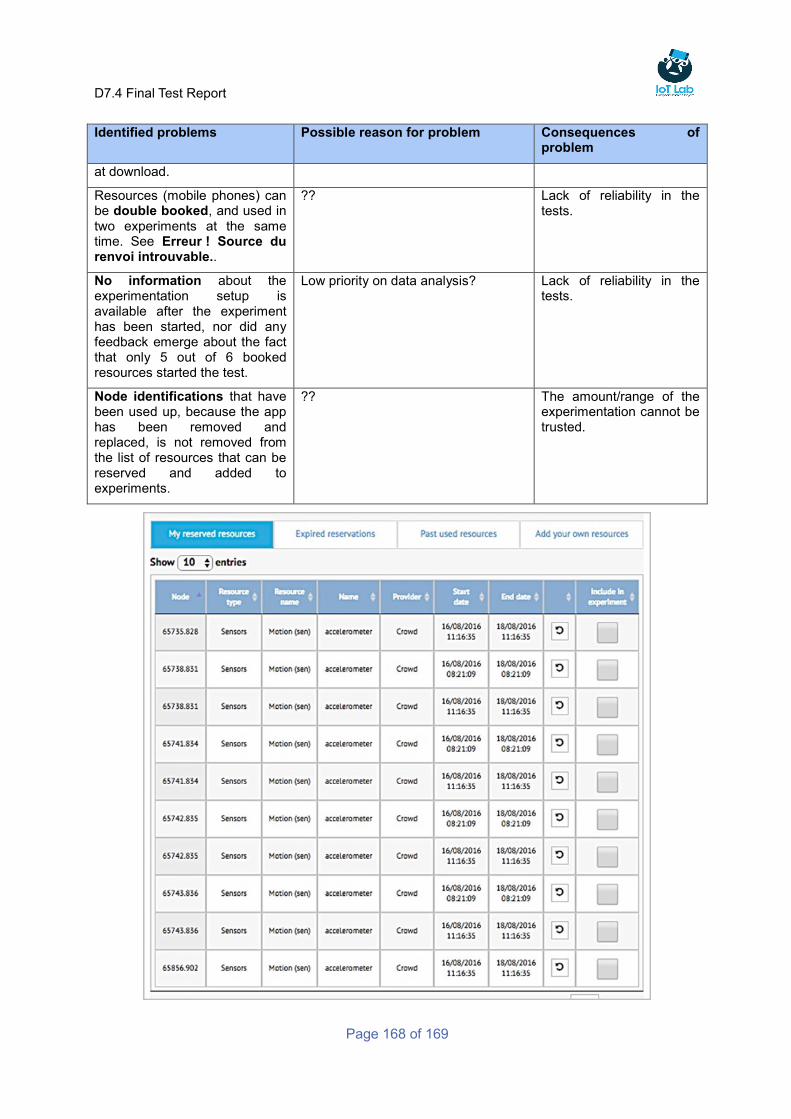
D7.4 Final Test Report
Page 168 of 169
Identified problems Possible reason for problem Consequences of problem
at download.
Resources (mobile phones) can be double booked, and used in two experiments at the same time. See Erreur ! Source du renvoi introuvable..
?? Lack of reliability in the tests.
No information about the experimentation setup is available after the experiment has been started, nor did any feedback emerge about the fact that only 5 out of 6 booked resources started the test.
Low priority on data analysis? Lack of reliability in the tests.
Node identifications that have been used up, because the app has been removed and replaced, is not removed from the list of resources that can be reserved and added to experiments.
?? The amount/range of the experimentation cannot be trusted.
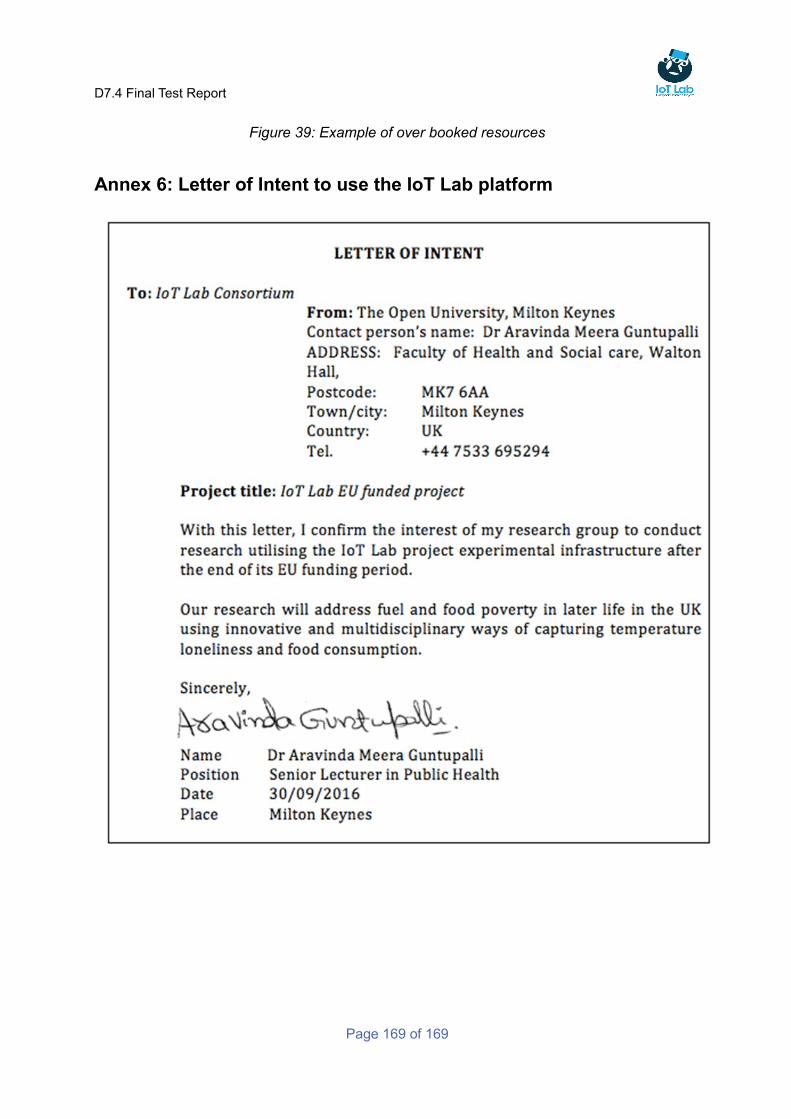
D7.4 Final Test Report
Page 169 of 169
Figure 39: Example of over booked resources
Annex 6: Letter of Intent to use the IoT Lab platform