researcharticle isbeakmorphologyindarwin …. cnsispartofthefacultyofartsandsciencesat...
TRANSCRIPT

RESEARCH ARTICLE
Is Beak Morphology in Darwin’s FinchesTuned to Loading Demands?Joris Soons1*, Annelies Genbrugge1,2, Jeffrey Podos3, Dominique Adriaens2,Peter Aerts4,5, Joris Dirckx1, Anthony Herrel4,6
1 Laboratory of Biomedical Physics, University of Antwerp, Groenenborgerlaan 171, 2020, Antwerpen,Belgium, 2 Evolutionary Morphology of Vertebrates, Ghent University, K.L. Ledeganckstraat 35, 9000, Gent,Belgium, 3 Department of Biology, 221 Morrill Science Center, University of Massachusetts, Amherst,Massachusetts, 01003, United States of America, 4 Department of Biology, University of Antwerp,Universiteitsplein 1, 2610, Antwerpen, Belgium, 5 Department of movement and sports sciences, Universityof Ghent, Watersportlaan 2, 9000, Gent, Belgium, 6 Département d’Ecologie et de Gestion de la Biodiversité,Museum National d’Histoire Naturelle, 57 rue Cuvier, Case postale 55, 75231, Paris, Cedex 5, France
AbstractOne of nature's premier illustrations of adaptive evolution concerns the tight correspon-
dence in birds between beak morphology and feeding behavior. In seed-crushing birds,
beaks have been suggested to evolve at least in part to avoid fracture. Yet, we know little
about mechanical relationships between beak shape, stress dissipation, and fracture avoid-
ance. This study tests these relationships for Darwin's finches, a clade of birds renowned
for their diversity in beak form and function. We obtained anatomical data from micro-CT
scans and dissections, which in turn informed the construction of finite element models of
the bony beak and rhamphotheca. Our models offer two new insights. First, engineering
safety factors are found to range between 1 and 2.5 under natural loading conditions, with
the lowest safety factors being observed in species with the highest bite forces. Second,
size-scaled finite element (FE) models reveal a correspondence between inferred beak
loading profiles and observed feeding strategies (e.g. edge-crushing versus tip-biting), with
safety factors decreasing for base-crushers biting at the beak tip. Additionally, we identify
significant correlations between safety factors, keratin thickness at bite locations, and beak
aspect ratio (depth versus length). These lines of evidence together suggest that beak
shape indeed evolves to resist feeding forces.
IntroductionThe often tight correspondence between bird beaks and plant morphology well-illustrates thepower and precision of natural selection [1]. Within bird populations, subtle variations in beakmorphology can affect foraging efficiency [2], and in some cases tip the balance between sur-vival and starvation [3]. For seed-crushing birds, however, analyses of feeding capacity requirea broader view than just beak morphology per se. This is because a bird’s ability to crush seedsis determined mainly by bite force capacity, which in turn depends primarily on the orientation
PLOSONE | DOI:10.1371/journal.pone.0129479 June 12, 2015 1 / 14
OPEN ACCESS
Citation: Soons J, Genbrugge A, Podos J, AdriaensD, Aerts P, Dirckx J, et al. (2015) Is Beak Morphologyin Darwin’s Finches Tuned to Loading Demands?PLoS ONE 10(6): e0129479. doi:10.1371/journal.pone.0129479
Academic Editor: Kornelius Kupczik, Max PlanckInstitute for Evolutionary Anthropology, GERMANY
Received: November 29, 2013
Accepted: May 10, 2015
Published: June 12, 2015
Copyright: © 2015 Soons et al. This is an openaccess article distributed under the terms of theCreative Commons Attribution License, which permitsunrestricted use, distribution, and reproduction in anymedium, provided the original author and source arecredited.
Funding: This work was performed in part at theCenter for Nanoscale Systems (CNS), a member ofthe National Nanotechnology Infrastructure Network(NNIN), which is supported by the National ScienceFoundation under NSF award no. ECS- 0335765.CNS is part of the Faculty of Arts and Sciences atHarvard University. Financial support to this projectwas provided by the Research Foundation - Flanders(FWO) to JS, an interdisciplinary research grant ofthe special research fund of the University of Antwerpto PA, JD, AH, a PHC Tournesol project to AH, AGand DA, and JP was supported by NSF grant IBN-0347291. The funders had no role in study design,
and cross sectional area of the jaw closer muscles [4–6]. These muscles, situated at the back ofthe head, generate crushing forces that are transferred to food by means of the upper and lowerbeak through a complex kinetic beak apparatus [6–11]. Beak morphology, by contrast, likelyevolves to facilitate successful food manipulation and song production. However, beaks alsoneed to avoid structural failure during loading [4]. The loading regime itself presumably varieswith food manipulation strategies (e.g. tip biting versus base crushing) and may thus drive theevolution of beak shape [12].
We here test, in Darwin’s finches of the Galápagos Islands, the hypothesis that beak mor-phology provides structural integrity, i.e., that it evolves to resist feeding forces and avoid frac-ture [13]. Beaks in Darwin’s finches are known to vary broadly across and within species, andto evolve via natural selection as a response to variation in food type, food availability, and in-terspecific competition [3,10,14–18]. Our main approach is to develop and apply finite element(FE) models of the upper beak. FE models enable exploration of the effect of complex shapevariation on stress magnitude and distribution [19–21], and allows us to draw inferences aboutpatterns of loading during biting. We include here 13 species and incorporate data into ourmodels for the bones, the jaw closer muscles, and the keratinous rhamphotheca that encapsu-lates the beak. Including the rhamphotheca in the model allows us to provide a more realisticestimate of stresses incurred during biting [22,23] that we achieved in previous studies [24,25].
The goal of this paper is twofold. First we examine how natural loadings are reflected insafety factors for a subset of species for which physiological FE models could be created (i.e. forwhich data on muscles could be obtained). Second, we created models of all 13 species scaled toa common surface area to muscle ratio [26]. This allows us to test whether variation in beakshape matches differences in food handling behavior. We predict that species will have beakshapes that allow them to minimize peak stresses during those feeding behaviors most com-monly employed. In particular, we predict that base-crushing species should show the loweststresses when biting at the base of the beak, that tip-biting species should show the loweststresses during tip-biting, and that probing beaks should show higher stresses during both tip-and base crushing compared to those species specialized for these behaviors.
Materials and Methods
Specimen collection and CT scanningNo animals were killed for the purpose of this study. Road-killed specimens were collected dur-ing February-March of 2005 and 2006 on the main road connecting the airport on Baltra withPuerto Ayora, Santa Cruz Island. Specimens were collected under a salvage permit provided bythe Galápagos National Park Service. Intact specimens were collected and preserved in a 10%aqueous formaldehyde solution for 24 h, rinsed and transferred to a 70% aqueous ethanol solu-tion. One individual of Geospizia fortis, Geospizia fuliginosa, Geospizia scandens, Platyspizacrassirostris, Certhidea olivacea, and Camarhynchus parvulus were scanned at the UGCT scan-ning facility (www.ugct.ugent.be), using a micro-focus directional type X-ray tube, set at a volt-age of 80 kV and a spot size of 10 mm. Specimens were mounted on a controllable rotatingtable (MICOS, UPR160F-AIR). For each specimen, a series of 1000 projections of 940 by 748pixels were recorded covering 360 degrees.
Museum specimens of Geospizia magnirostris, Geospizia difficilis, Pinaroloxias inornata,Cactospiza pallida, Camarhynchus psittacula, Geospiza conirostris, and Camarhynchus pauperfrom the collections of the California Academy of Sciences maintained in a 70% aqueous etha-nol solution were scanned at the Harvard CNS facility using an X-Tek XRA-002 micro-CT im-aging system set at 75 kV. Specimens were mounted on a rotating table and a series of 3142projections of 2000 by 2000 pixels covering 360 degrees was recorded. The voxel size of the
Tuning of Beak Morphology
PLOS ONE | DOI:10.1371/journal.pone.0129479 June 12, 2015 2 / 14
data collection and analysis, decision to publish, orpreparation of the manuscript.
Competing Interests: The authors have declaredthat no competing interests exist
scans was dependent on the specimen size and ranged from 2.96 μm for the smallest species to47.00 μm for the larger species. As such, the bone shell of the bony core was represented bymultiple voxels, and details within the bony beak were visible.
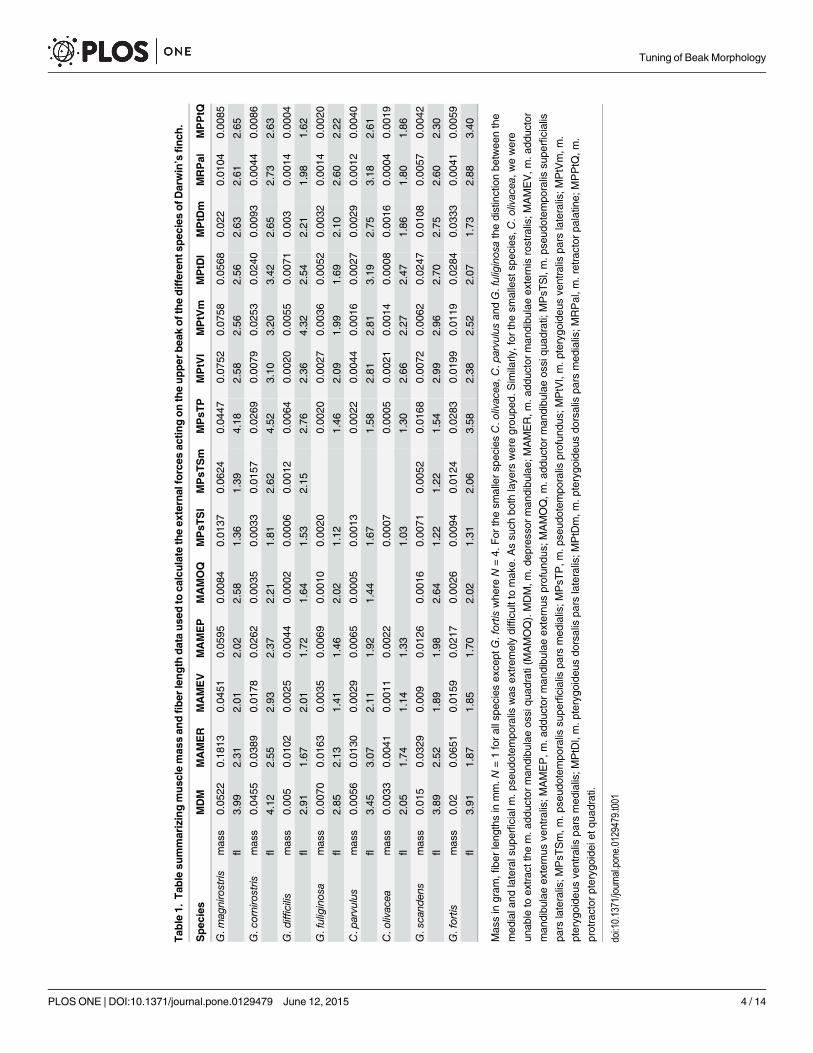
Muscle dataMuscle data were available for five of the species collected in the field as road-killed specimens:G. fortis, G. fuliginosa, G. scandens, C. olivacea and C. parvulus; data for three additional specieswere derived through dissection of museum specimens from the California Academy of Sci-ences (G.magnirostris, G. conirostris, and G. difficilis). These species were dissected and allmuscle bundles of the jaw removed individually [27]. Muscles were blotted dry and weighed ona Mettler microbalance (±0.01mg). Next, muscles were transferred individually to Petri dishesand submerged in a 30% aqueous nitric acid solution for 18 h to dissolve all connective tissue[28]. After removal of nitric acid, muscles were transferred to a 50% aqueous glycerol solutionand fibers were teased apart using blunt-tipped glass needles. Thirty fibers were selected fromeach muscle bundle (Table 1) and drawn using a binocular scope with attached camera lucida.A background grid was also drawn in each image to provide an object for scaling. Drawingswere scanned and fiber lengths determined using imageJ (freely available at http://rsb.info.nih.gov/ij/).
Based on muscle mass and fiber length, the physiological cross-sectional area of each musclebundle was estimated assuming a muscle density of 1036kg/m3 [29]. Since pennate muscleswere separated into their individual bundles, no additional correction for pennation angle wasincluded. Corresponding force-generation capacities for each muscle were calculated assuminga muscle stress of 30N/cm2 [30]. As the external adductor and pseudotemporalis muscles actonly indirectly on the upper mandible [6,9,10,31], the component of the muscle force trans-ferred to the upper mandible was calculated taking into account the position of the musclesand their angles relative to the jugal bone (which transfers the forces from the lower jaw andthe quadrate to the upper beak by pulling the beak downward when quadrate is rotated back-ward during jaw closing). The pterygoid muscle bundles act directly on the upper mandible[6,9,10,31], and muscle forces are directly transmitted through the pterygoid/palatine complex.The combined muscle forces applied to the model are shown in Table 2.
Segmentation and FE modellingThe segmentation of the bony core and the keratin layer (Amira 4.1 64-bit version, TGS sys-tems) was done for all species. The tetrahedral grid construction [32], the assigned materialproperties (homogenuous and isotropic linear elastic with Ekeratin = 1.7 GPa and Ebone = 7.3GPa) [22] and the boundary conditions are similar to those reported previously [22–24, 33].Convergence testing on the results, namely the von Mises (vM) stresses and the bite forces, wasconducted so they change less than 5% when doubling mesh size. The final FE grids of approxi-mately 2–3 million 4-noded linear tetrahedral elements were obtained. Consequently, multiplelayers of elements were available to model the thin bony walls.
For every specimen, a FE model for base and tip loading was established. In this study wewere only interested in the stresses on the upper beak, and as such elements were fully con-strained (in all 6 degrees of freedom) at the back of the beak at the neurocranium. Hinging ofthe upper beak is possible due to bending of the thin bone (BA in Fig 1). In order to avoid sin-gularities around point constraints, we constrained elements (in x, y and z direction, no rota-tion) at the ventral surface of the rhamphotheca simulating the bite constraint (T and Bs in Fig1); the calculated reaction force of these elements is the bite force which is of equal magnitudeyet of opposite sign as the seed reaction force. Bite positions were estimated using in vivo
Tuning of Beak Morphology
PLOS ONE | DOI:10.1371/journal.pone.0129479 June 12, 2015 3 / 14
Tab
le1.
Tab
lesu
mmarizingmusc
lemas
san
dfiber
length
datause
dto
calculate
theex
ternal
forces
actingontheupper
bea
kofthedifferen
tspec
iesofD
arwin’s
finch
.
Spec
ies
MDM
MAMER
MAMEV
MAMEP
MAMOQ
MPsT
Sl
MPsT
Sm
MPsT
PMPtVl
MPtVm
MPtD
lMPtD
mMRPal
MPPtQ
G.m
agnirostris
mas
s0.05
220.18
130.04
510.05
950.00
840.01
370.06
240.04
470.07
520.07
580.05
680.02
20.01
040.00
85
fl3.99
2.31
2.01
2.02
2.58
1.36
1.39
4.18
2.58
2.56
2.56
2.63
2.61
2.65
G.c
ornirostris
mas
s0.04
550.03
890.01
780.02
620.00
350.00
330.01
570.02
690.00
790.02
530.02
400.00
930.00
440.00
86
fl4.12
2.55
2.93
2.37
2.21
1.81
2.62
4.52
3.10
3.20
3.42
2.65
2.73
2.63
G.d
ifficilis
mas
s0.00
50.01
020.00
250.00
440.00
020.00
060.00
120.00
640.00
200.00
550.00
710.00
30.00
140.00
04
fl2.91
1.67
2.01
1.72
1.64
1.53
2.15
2.76
2.36
4.32
2.54
2.21
1.98
1.62
G.fuliginos
amas
s0.00
700.01
630.00
350.00
690.00
100.00
200.00
200.00
270.00
360.00
520.00
320.00
140.00
20
fl2.85
2.13
1.41
1.46
2.02
1.12
1.46
2.09
1.99
1.69
2.10
2.60
2.22
C.p
arvu
lus
mas
s0.00
560.01
300.00
290.00
650.00
050.00
130.00
220.00
440.00
160.00
270.00
290.00
120.00
40
fl3.45
3.07
2.11
1.92
1.44
1.67
1.58
2.81
2.81
3.19
2.75
3.18
2.61
C.o
livac
eamas
s0.00
330.00
410.00
110.00
220.00
070.00
050.00
210.00
140.00
080.00
160.00
040.00
19
fl2.05
1.74
1.14
1.33
1.03
1.30
2.66
2.27
2.47
1.86
1.80
1.86
G.s
cand
ens
mas
s0.01
50.03
290.00
90.01
260.00
160.00
710.00
520.01
680.00
720.00
620.02
470.01
080.00
570.00
42
fl3.89
2.52
1.89
1.98
2.64
1.22
1.22
1.54
2.99
2.96
2.70
2.75
2.60
2.30
G.fortis
mas
s0.02
0.06
510.01
590.02
170.00
260.00
940.01
240.02
830.01
990.01
190.02
840.03
330.00
410.00
59
fl3.91
1.87
1.85
1.70
2.02
1.31
2.06
3.58
2.38
2.52
2.07
1.73
2.88
3.40
Mas
sin
gram
,fibe
rleng
thsin
mm.N
=1forallspe
cies
exce
ptG.fortis
whe
reN=4.
For
thesm
allersp
eciesC.o
livac
ea,C
.parvu
lusan
dG.fuliginos
athedistinctionbe
twee
nthe
med
iala
ndlateralsup
erficial
m.p
seud
otem
poralis
was
extrem
elydifficu
ltto
mak
e.Assu
chbo
thlaye
rsweregrou
ped.
Sim
ilarly
,for
thesm
allest
spec
ies,
C.o
livac
ea,w
ewere
unab
leto
extrac
tthe
m.a
dduc
torman
dibu
laeos
siqu
adrati(M
AMOQ).MDM,m
.dep
ressor
man
dibu
lae;
MAMER,m
.add
uctorman
dibu
laeex
ternisrostralis;M
AMEV,m
.add
uctor
man
dibu
laeex
ternus
ventralis;M
AMEP,m
.add
uctorman
dibu
laeex
ternus
profun
dus;
MAMOQ,m
.add
uctorman
dibu
laeos
siqu
adrati;
MPsT
Sl,m.p
seud
otem
poralis
supe
rficialis
pars
lateralis;M
PsT
Sm,m
.pse
udotem
poralis
supe
rficialispa
rsmed
ialis;M
PsT
P,m
.pse
udotem
poralis
profun
dus;
MPtVl,m.p
terygo
ideu
sve
ntralis
pars
lateralis;M
PtVm,m
.
pteryg
oide
usve
ntralis
pars
med
ialis;M
PtDl,m.p
terygo
ideu
sdo
rsalispa
rslateralis;M
PtDm,m
.pterygo
ideu
sdo
rsalispa
rsmed
ialis;M
RPal,m
.retractor
palatin
e;MPPtQ
,m.
protractor
pteryg
oide
ietq
uadrati.
doi:10.1371/journal.pone.0129479.t001
Tuning of Beak Morphology
PLOS ONE | DOI:10.1371/journal.pone.0129479 June 12, 2015 4 / 14
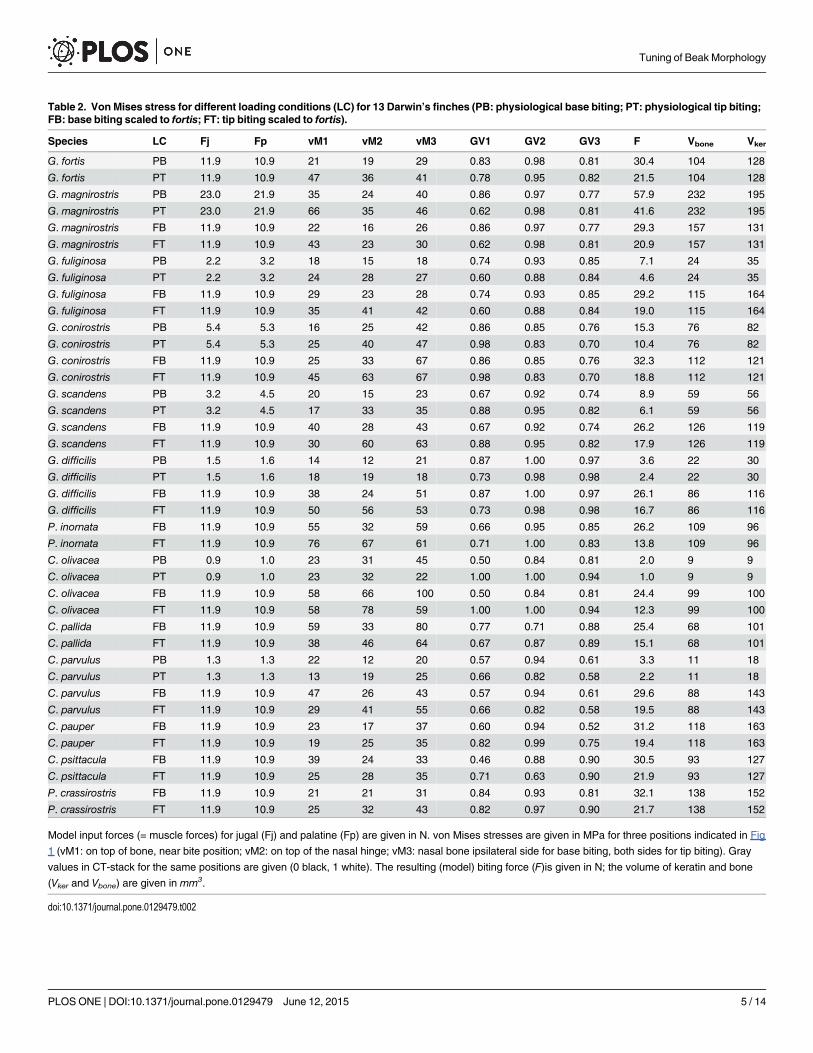
Table 2. Von Mises stress for different loading conditions (LC) for 13 Darwin’s finches (PB: physiological base biting; PT: physiological tip biting;FB: base biting scaled to fortis; FT: tip biting scaled to fortis).
Species LC Fj Fp vM1 vM2 vM3 GV1 GV2 GV3 F Vbone Vker
G. fortis PB 11.9 10.9 21 19 29 0.83 0.98 0.81 30.4 104 128
G. fortis PT 11.9 10.9 47 36 41 0.78 0.95 0.82 21.5 104 128
G. magnirostris PB 23.0 21.9 35 24 40 0.86 0.97 0.77 57.9 232 195
G. magnirostris PT 23.0 21.9 66 35 46 0.62 0.98 0.81 41.6 232 195
G. magnirostris FB 11.9 10.9 22 16 26 0.86 0.97 0.77 29.3 157 131
G. magnirostris FT 11.9 10.9 43 23 30 0.62 0.98 0.81 20.9 157 131
G. fuliginosa PB 2.2 3.2 18 15 18 0.74 0.93 0.85 7.1 24 35
G. fuliginosa PT 2.2 3.2 24 28 27 0.60 0.88 0.84 4.6 24 35
G. fuliginosa FB 11.9 10.9 29 23 28 0.74 0.93 0.85 29.2 115 164
G. fuliginosa FT 11.9 10.9 35 41 42 0.60 0.88 0.84 19.0 115 164
G. conirostris PB 5.4 5.3 16 25 42 0.86 0.85 0.76 15.3 76 82
G. conirostris PT 5.4 5.3 25 40 47 0.98 0.83 0.70 10.4 76 82
G. conirostris FB 11.9 10.9 25 33 67 0.86 0.85 0.76 32.3 112 121
G. conirostris FT 11.9 10.9 45 63 67 0.98 0.83 0.70 18.8 112 121
G. scandens PB 3.2 4.5 20 15 23 0.67 0.92 0.74 8.9 59 56
G. scandens PT 3.2 4.5 17 33 35 0.88 0.95 0.82 6.1 59 56
G. scandens FB 11.9 10.9 40 28 43 0.67 0.92 0.74 26.2 126 119
G. scandens FT 11.9 10.9 30 60 63 0.88 0.95 0.82 17.9 126 119
G. difficilis PB 1.5 1.6 14 12 21 0.87 1.00 0.97 3.6 22 30
G. difficilis PT 1.5 1.6 18 19 18 0.73 0.98 0.98 2.4 22 30
G. difficilis FB 11.9 10.9 38 24 51 0.87 1.00 0.97 26.1 86 116
G. difficilis FT 11.9 10.9 50 56 53 0.73 0.98 0.98 16.7 86 116
P. inornata FB 11.9 10.9 55 32 59 0.66 0.95 0.85 26.2 109 96
P. inornata FT 11.9 10.9 76 67 61 0.71 1.00 0.83 13.8 109 96
C. olivacea PB 0.9 1.0 23 31 45 0.50 0.84 0.81 2.0 9 9
C. olivacea PT 0.9 1.0 23 32 22 1.00 1.00 0.94 1.0 9 9
C. olivacea FB 11.9 10.9 58 66 100 0.50 0.84 0.81 24.4 99 100
C. olivacea FT 11.9 10.9 58 78 59 1.00 1.00 0.94 12.3 99 100
C. pallida FB 11.9 10.9 59 33 80 0.77 0.71 0.88 25.4 68 101
C. pallida FT 11.9 10.9 38 46 64 0.67 0.87 0.89 15.1 68 101
C. parvulus PB 1.3 1.3 22 12 20 0.57 0.94 0.61 3.3 11 18
C. parvulus PT 1.3 1.3 13 19 25 0.66 0.82 0.58 2.2 11 18
C. parvulus FB 11.9 10.9 47 26 43 0.57 0.94 0.61 29.6 88 143
C. parvulus FT 11.9 10.9 29 41 55 0.66 0.82 0.58 19.5 88 143
C. pauper FB 11.9 10.9 23 17 37 0.60 0.94 0.52 31.2 118 163
C. pauper FT 11.9 10.9 19 25 35 0.82 0.99 0.75 19.4 118 163
C. psittacula FB 11.9 10.9 39 24 33 0.46 0.88 0.90 30.5 93 127
C. psittacula FT 11.9 10.9 25 28 35 0.71 0.63 0.90 21.9 93 127
P. crassirostris FB 11.9 10.9 21 21 31 0.84 0.93 0.81 32.1 138 152
P. crassirostris FT 11.9 10.9 25 32 43 0.82 0.97 0.90 21.7 138 152
Model input forces (= muscle forces) for jugal (Fj) and palatine (Fp) are given in N. von Mises stresses are given in MPa for three positions indicated in Fig
1 (vM1: on top of bone, near bite position; vM2: on top of the nasal hinge; vM3: nasal bone ipsilateral side for base biting, both sides for tip biting). Gray
values in CT-stack for the same positions are given (0 black, 1 white). The resulting (model) biting force (F)is given in N; the volume of keratin and bone
(Vker and Vbone) are given in mm3.
doi:10.1371/journal.pone.0129479.t002
Tuning of Beak Morphology
PLOS ONE | DOI:10.1371/journal.pone.0129479 June 12, 2015 5 / 14
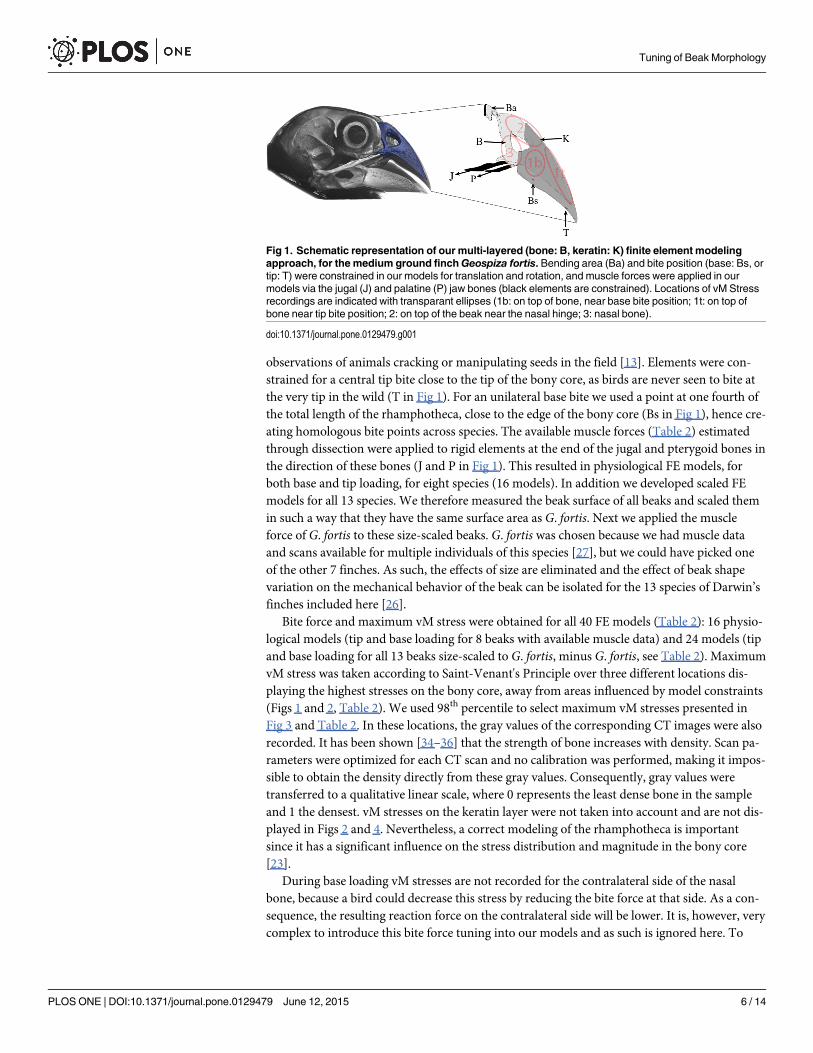
observations of animals cracking or manipulating seeds in the field [13]. Elements were con-strained for a central tip bite close to the tip of the bony core, as birds are never seen to bite atthe very tip in the wild (T in Fig 1). For an unilateral base bite we used a point at one fourth ofthe total length of the rhamphotheca, close to the edge of the bony core (Bs in Fig 1), hence cre-ating homologous bite points across species. The available muscle forces (Table 2) estimatedthrough dissection were applied to rigid elements at the end of the jugal and pterygoid bones inthe direction of these bones (J and P in Fig 1). This resulted in physiological FE models, forboth base and tip loading, for eight species (16 models). In addition we developed scaled FEmodels for all 13 species. We therefore measured the beak surface of all beaks and scaled themin such a way that they have the same surface area as G. fortis. Next we applied the muscleforce of G. fortis to these size-scaled beaks. G. fortis was chosen because we had muscle dataand scans available for multiple individuals of this species [27], but we could have picked oneof the other 7 finches. As such, the effects of size are eliminated and the effect of beak shapevariation on the mechanical behavior of the beak can be isolated for the 13 species of Darwin’sfinches included here [26].
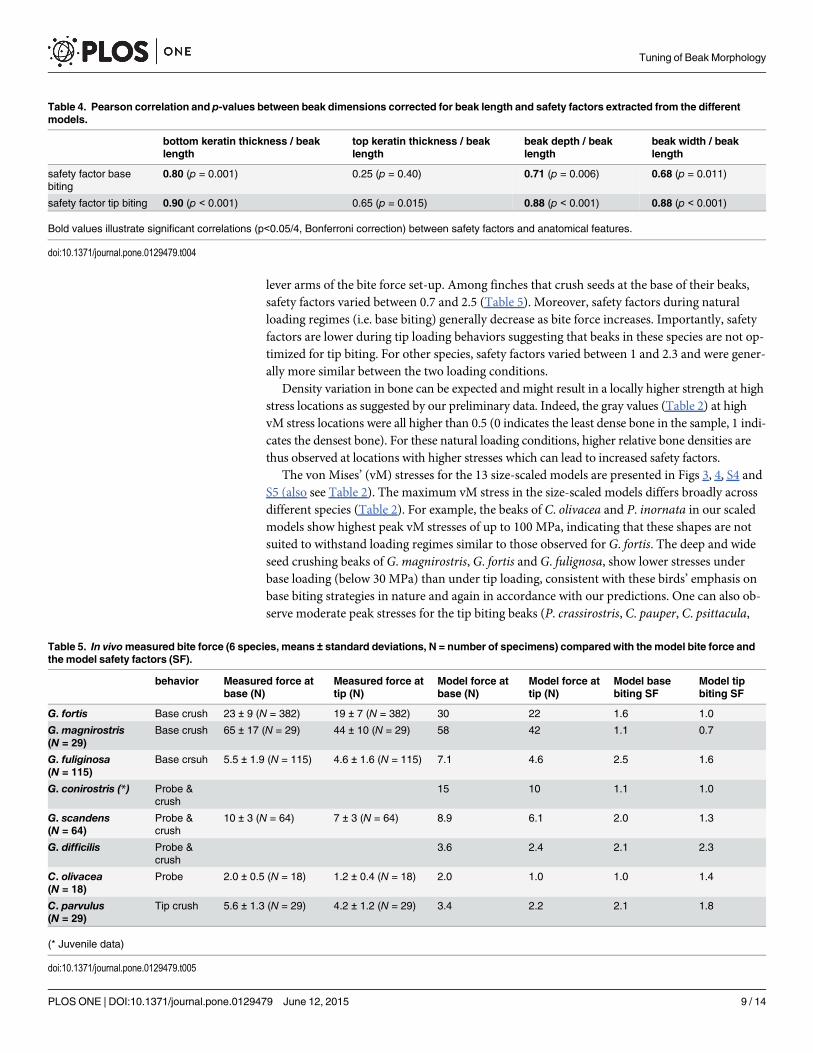
Bite force and maximum vM stress were obtained for all 40 FE models (Table 2): 16 physio-logical models (tip and base loading for 8 beaks with available muscle data) and 24 models (tipand base loading for all 13 beaks size-scaled to G. fortis, minus G. fortis, see Table 2). MaximumvM stress was taken according to Saint-Venant's Principle over three different locations dis-playing the highest stresses on the bony core, away from areas influenced by model constraints(Figs 1 and 2, Table 2). We used 98th percentile to select maximum vM stresses presented inFig 3 and Table 2. In these locations, the gray values of the corresponding CT images were alsorecorded. It has been shown [34–36] that the strength of bone increases with density. Scan pa-rameters were optimized for each CT scan and no calibration was performed, making it impos-sible to obtain the density directly from these gray values. Consequently, gray values weretransferred to a qualitative linear scale, where 0 represents the least dense bone in the sampleand 1 the densest. vM stresses on the keratin layer were not taken into account and are not dis-played in Figs 2 and 4. Nevertheless, a correct modeling of the rhamphotheca is importantsince it has a significant influence on the stress distribution and magnitude in the bony core[23].
During base loading vM stresses are not recorded for the contralateral side of the nasalbone, because a bird could decrease this stress by reducing the bite force at that side. As a con-sequence, the resulting reaction force on the contralateral side will be lower. It is, however, verycomplex to introduce this bite force tuning into our models and as such is ignored here. To
Fig 1. Schematic representation of our multi-layered (bone: B, keratin: K) finite element modelingapproach, for the medium ground finchGeospiza fortis. Bending area (Ba) and bite position (base: Bs, ortip: T) were constrained in our models for translation and rotation, and muscle forces were applied in ourmodels via the jugal (J) and palatine (P) jaw bones (black elements are constrained). Locations of vM Stressrecordings are indicated with transparant ellipses (1b: on top of bone, near base bite position; 1t: on top ofbone near tip bite position; 2: on top of the beak near the nasal hinge; 3: nasal bone).
doi:10.1371/journal.pone.0129479.g001
Tuning of Beak Morphology
PLOS ONE | DOI:10.1371/journal.pone.0129479 June 12, 2015 6 / 14
quantify a birds’ risk of beak fracture during biting, we calculated safety factors for each species’beak, by dividing bone strength by peak stress. Values for bone strength were obtained usingthe linear relationship of Fyhrie and Vashishth, bone strength = 0.0061 EBone [37]. In this studywe used 45 MPa for a experimentally obtained Young’s modulus of 7.3 GPa for finch beakbone [22,23]. Finally keratin thickness on top and bottom of the beak, and beak dimensions
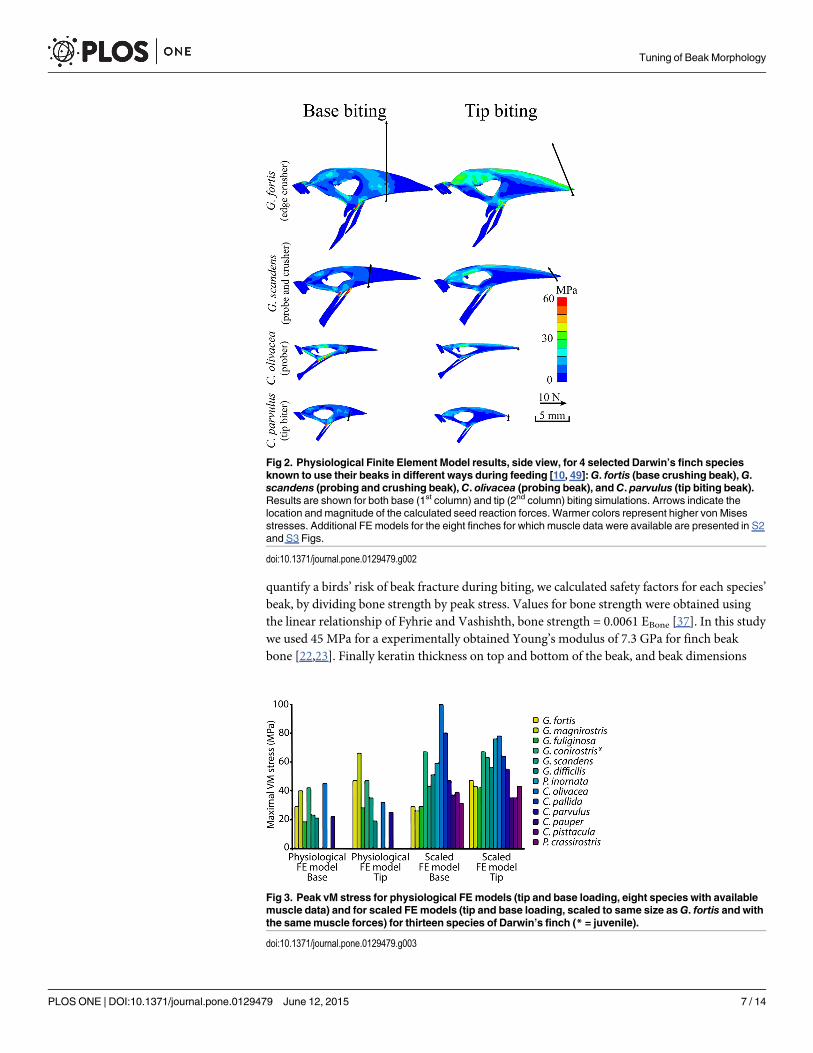
Fig 2. Physiological Finite Element Model results, side view, for 4 selected Darwin’s finch speciesknown to use their beaks in different ways during feeding [10, 49]:G. fortis (base crushing beak),G.scandens (probing and crushing beak),C. olivacea (probing beak), andC. parvulus (tip biting beak).Results are shown for both base (1st column) and tip (2nd column) biting simulations. Arrows indicate thelocation and magnitude of the calculated seed reaction forces. Warmer colors represent higher von Misesstresses. Additional FE models for the eight finches for which muscle data were available are presented in S2and S3 Figs.
doi:10.1371/journal.pone.0129479.g002
Fig 3. Peak vM stress for physiological FEmodels (tip and base loading, eight species with availablemuscle data) and for scaled FEmodels (tip and base loading, scaled to same size asG. fortis and withthe samemuscle forces) for thirteen species of Darwin’s finch (* = juvenile).
doi:10.1371/journal.pone.0129479.g003
Tuning of Beak Morphology
PLOS ONE | DOI:10.1371/journal.pone.0129479 June 12, 2015 7 / 14

(depth and width relative to length) were measured and are reported for four functional groups(Table 3), and Pearson’s correlations (with Bonferroni correction) of these values compared tothe SFs are shown in Table 4.
ResultsThe calculated von Mises stresses for the physiological boundary conditions in different Dar-win’s finches are presented in Figs 2, 3, S2 and S3 (see also Table 2). The force vectors repre-senting bite forces (Figs 2, S2 and S3) correspond well with field-measured in vivo bite forces(Table 5) [4, 5, 25]. Note, however, that in vivo bite forces reported here differ proportionallyfrom those reported previously [25], as in that study the bite forces were not corrected for the
Fig 4. Top view of scaled FEmodels of the upper beaks of 13 species of Darwin’s finches. All beaks were scaled to same size and muscle force asG.fortis, with stresses calculated for both base (left) and tip (right) biting. Warmer colors represent higher vM stresses. Note how stresses are lower during thebehaviors typically employed by each species, with base crushers showing the lowest stress values during base-loading and tip crushers during tip-loading.Species with probing beaks show generally high stresses under both loading conditions. Top and side views of scaled FE models are presented in S4 and S5Figs.
doi:10.1371/journal.pone.0129479.g004
Table 3. Characterization of keratin thickness and beak dimensions (relative to beak length) in the different functional groups.
bottom keratin thickness / beaklength
top keratin thickness / beaklength
beak depth / beaklength
beak width / beaklength
Crush (N = 3) 0.095 ± 0.015 0.023 ± 0.005 0.22 ± 0.03 0.406 ± 0.010
Probe and Base(N = 3)
0.067 ± 0.007 0.0205 ± 0.0013 0.161 ± 0.013 0.35 ± 0.02
Probe (N = 2) 0.029 ± 0.005 0.018 ± 0.007 0.120 ± 0.006 0.304 ± 0.003
Tip (N = 5) 0.08 ± 0.03 0.035 ± 0.011 0.22 ± 0.05 0.44 ± 0.07
Table entries are means ± standard deviations.
doi:10.1371/journal.pone.0129479.t003
Tuning of Beak Morphology
PLOS ONE | DOI:10.1371/journal.pone.0129479 June 12, 2015 8 / 14
lever arms of the bite force set-up. Among finches that crush seeds at the base of their beaks,safety factors varied between 0.7 and 2.5 (Table 5). Moreover, safety factors during naturalloading regimes (i.e. base biting) generally decrease as bite force increases. Importantly, safetyfactors are lower during tip loading behaviors suggesting that beaks in these species are not op-timized for tip biting. For other species, safety factors varied between 1 and 2.3 and were gener-ally more similar between the two loading conditions.
Density variation in bone can be expected and might result in a locally higher strength at highstress locations as suggested by our preliminary data. Indeed, the gray values (Table 2) at highvM stress locations were all higher than 0.5 (0 indicates the least dense bone in the sample, 1 indi-cates the densest bone). For these natural loading conditions, higher relative bone densities arethus observed at locations with higher stresses which can lead to increased safety factors.
The von Mises’ (vM) stresses for the 13 size-scaled models are presented in Figs 3, 4, S4 andS5 (also see Table 2). The maximum vM stress in the size-scaled models differs broadly acrossdifferent species (Table 2). For example, the beaks of C. olivacea and P. inornata in our scaledmodels show highest peak vM stresses of up to 100 MPa, indicating that these shapes are notsuited to withstand loading regimes similar to those observed for G. fortis. The deep and wideseed crushing beaks of G.magnirostris, G. fortis and G. fulignosa, show lower stresses underbase loading (below 30 MPa) than under tip loading, consistent with these birds’ emphasis onbase biting strategies in nature and again in accordance with our predictions. One can also ob-serve moderate peak stresses for the tip biting beaks (P. crassirostris, C. pauper, C. psittacula,
Table 4. Pearson correlation and p-values between beak dimensions corrected for beak length and safety factors extracted from the differentmodels.
bottom keratin thickness / beaklength
top keratin thickness / beaklength
beak depth / beaklength
beak width / beaklength
safety factor basebiting
0.80 (p = 0.001) 0.25 (p = 0.40) 0.71 (p = 0.006) 0.68 (p = 0.011)
safety factor tip biting 0.90 (p < 0.001) 0.65 (p = 0.015) 0.88 (p < 0.001) 0.88 (p < 0.001)
Bold values illustrate significant correlations (p<0.05/4, Bonferroni correction) between safety factors and anatomical features.
doi:10.1371/journal.pone.0129479.t004
Table 5. In vivomeasured bite force (6 species, means ± standard deviations, N = number of specimens) compared with the model bite force andthe model safety factors (SF).
behavior Measured force atbase (N)
Measured force attip (N)
Model force atbase (N)
Model force attip (N)
Model basebiting SF
Model tipbiting SF
G. fortis Base crush 23 ± 9 (N = 382) 19 ± 7 (N = 382) 30 22 1.6 1.0
G. magnirostris(N = 29)
Base crush 65 ± 17 (N = 29) 44 ± 10 (N = 29) 58 42 1.1 0.7
G. fuliginosa(N = 115)
Base crsuh 5.5 ± 1.9 (N = 115) 4.6 ± 1.6 (N = 115) 7.1 4.6 2.5 1.6
G. conirostris (*) Probe &crush
15 10 1.1 1.0
G. scandens(N = 64)
Probe &crush
10 ± 3 (N = 64) 7 ± 3 (N = 64) 8.9 6.1 2.0 1.3
G. difficilis Probe &crush
3.6 2.4 2.1 2.3
C. olivacea(N = 18)
Probe 2.0 ± 0.5 (N = 18) 1.2 ± 0.4 (N = 18) 2.0 1.0 1.0 1.4
C. parvulus(N = 29)
Tip crush 5.6 ± 1.3 (N = 29) 4.2 ± 1.2 (N = 29) 3.4 2.2 2.1 1.8
(* Juvenile data)
doi:10.1371/journal.pone.0129479.t005
Tuning of Beak Morphology
PLOS ONE | DOI:10.1371/journal.pone.0129479 June 12, 2015 9 / 14
except C. parvulus), ranging from 31 MPa to 39 MPa. The probe and crush beaks (G. scandens,G. difficilis) show higher stresses, however, ranging from 43 to 51 MPa. Finally, comparativelylow maximum stresses are found during tip loading for species that use the tips of their beakduring foraging and have beaks with high curvature, as predicted (e.g. Camarhynchus pauperand C. psittacula, 35 MPa). The crushing beaks (G. fortis, G. fuliginosa, G.magnirostris) on theother hand have higher stresses (42 to 47 MPa, SF = ±1) under these loading conditions. Themain exceptions to the otherwise rather precise tuning of beak strength and feeding mode con-cerns relatively high stresses observed for G. conirostris (67 MPa), C. parvulus (55 MPa), andCactospiza pallida (80 MPa) under different loading regimes.
The rhamphotheca was thinnest in the probers (Table 3). Base crushers have a thicker kera-tin layer on the bottom of the beak than tip biters, and tip biters have thicker keratin on the topof the beak. The size scaled models show a strong correlation between the beak safety factorand the thickness of the keratin at the base of the beak (Table 4). It is also interesting to notethat base and tip biters seem to have similar aspect ratios of the beak (depth and width relativeto length), and that these ratios are lower in the probers (Table 3). Moreover, we observe astrong and positive correlation between aspect ratio and beak safety factor (Table 4).
DiscussionFor all species, the estimated maximum vM stresses, particularly near the nasal hinge, were4–44% lower than maximum vM stresses calculated in prior models that did not take into ac-count the keratinous rhamphotheca [24]. An earlier study on Padda oryzivora [23] showedthat changing the bone modulus value also had a linear effect, albeit small, on safety factor val-ues (SFs changed from 2.5 to 3.0 if bone modulus changed from 6.7 to 7.9 GPa). Also, variationin the keratin modulus within its measured interval (Eker = 1.3 till 2.1 GPa) had a little effecton SF. However, if we decreased the keratin modulus below this, a profound effect was ob-served (for Eker of 1.7 GPa the SF = 2.8, while for Eker = 0.5 GPa the SF = 1.8), indicating theimportance of incorporating the keratin layer in the models. Models that integrate informationabout multiple layers ideally consider well-defined material properties for each constituent ma-terial. These parameters were obtained on a different species of finch (Padda oryzivora) sinceexperiments cannot be conducted with Darwin’s finches due to the protected status of thesebirds. Stress regimes for multi-layered beaks using these experimentally-obtained elastic mod-uli of keratin and bone had been modeled with success previously for Padda oryzivora andthen validated using digital speckle pattern interferometry [22,23].
Keratin itself is also a multi-layered structure [38,39] that typically shows an anisotropicmechanical behavior, with preferential directions of failure depending on cell orientation [38].The mechanical behavior of keratin also depends on its hydration state [22,40]. However, inliving animals the hydration state of the keratin is controlled to the underlying living tissues(epidermis and dermis). In birds specifically, the beak consists of four distinct layers: a layer ofdead epidermal cells (stratum corneum), a series of living epidermal cells, the dermis, and final-ly the bony beak [41]. Keratin cells typically orient such that they are aligned with the principaldeformation [41]. In contrast to bone, which is a stiff mineralized tissue prone to fracture, kera-tin often shows local failure which does not penetrate the entire structure due to the organiza-tion of the cells in the different layers of the structure. Moreover, keratin is abrasion resistantand worn layers are shed and renewed by the addition of new layers of the stratum corneumthrough deposition from the living epidermal cells. As such the keratinous rhamphotheca is acontinuously growing structure where damaged cells are shed and replaced. Consequently, wehere decided to focus on the mechanical behavior of the underlying bony beak while takinginto account the mechanical behavior of the keratinous rhamphoteca.
Tuning of Beak Morphology
PLOS ONE | DOI:10.1371/journal.pone.0129479 June 12, 2015 10 / 14
We found that the beaks of different finch species operate within a range of safety factors be-tween 0.7 and 2.5 (Table 5). From an engineering perspective this range cannot be regarded asnarrow, although from a biological perspective it is rather narrow if one takes into account thelarge variation finches express in bite forces (1N to 65N), beak sizes (1cm to 2cm), shapes, andbiological uses. The in vivo realistic range of applicable safety factors is likely even narrowerthan this, given that the 0.7 value was calculated for a behavior rarely observed in nature: tip-biting in the largest species, G.magnirostris. A safety factor lower than 1 implies that the beakwould break if the bird would use its full muscle strength while biting at the tip. This is, howev-er, a biting strategy rarely observed in this base-biting bird (note that this species displays asafety factor of 1.1 for base loading). Moreover, bone remodeling could further increase safetyfactors by decreasing vM stresses in highly loaded areas, a statement supported by the highergrayscale values in these regions. In future modeling, density dependent elastic moduli andstrength could be used to provide further insights in this material tuning. Nevertheless, calcu-lated safety factors imply that beaks can withstand loading under normal conditions, althoughthe exceptional jaw muscle hypertrophy of the ground finches [27], particularly G.magnirostris(S1 Fig), introduces risks to the beak’s structural integrity during tip biting.
As a further caveat, the magnitude of the safety factors given here should be interpreted asrelative only when comparing different species, since our measures for the Young’s moduluswere based on data for a different species (P. oryzivora). Moreover, we used the linear approxi-mation of Fyhrie and Vashishth [37]. Indeed, a wide range of strengths for denser bone,ranging from 106 to 224 MPa [42–44] is available in literature and Darwin’s finches couldpotentially have evolved denser bone with a higher strength. Moreover, stress magnitudes aresensitive to changes in material properties [23,45–48]. Another assumption we make in calcu-lating the safety factors is that the beaks of Darwin’s finches have similar material properties asthose measured for P. oryzivora. We are, however, unable to test this directly since the preser-vation of the tissues can have a major impact on the mechanical properties of bone and keratin.In addition, freshly killed animals cannot be obtained.
A unique advantage of FE models, applied in our study, is that they can be size-scaled, thusallowing a size-independent view on the structural merits of different beak shapes. In our set ofFE models, for which we scaled the beaks of all Darwin’s finches to the same size and appliedidentical muscle forces [26], our primary result is that maximum vM stresses differ broadlyacross different species, in ways that align with the different species feeding strategies (Table 2).For example, the beaks of C. olivacea and P. inornata show highest peak vM stresses in ourmodels (up to 100 MPa). This suggests that their beak shape is not suited to crack very hardseeds. Indeed, these birds use their beaks almost exclusively to capture insects, rather than tocrush or manipulate hard objects [49].
The high stresses for G. conirostris observed in our models might be explained by the fact thatthe geometry included in our study was that from a juvenile, while the applied muscle forces onthis juvenile geometry were those from an adult. Likely, ontogenetic changes in shape and ossifica-tion take place to optimize the beak for adult loading conditions [50] as previously demonstratedfor G. fortis. Results for C. parvulus and C. pallida remain puzzling, but suggest that these speciesmay be functionally constrained in the use of their beak when applying large muscle forces.
We observed a thicker rhamphotheca in base crushing and tip-biting birds compared tobirds that probe and bite, as well as dedicated probers (Table 3). Moreover, the keratin thick-ness at the bottom of the beak was strongly correlated to the beak safety factor indicating thatthicker keratin helps protect the beak and increase its safety factor (Table 4). Interestingly, thethicker top keratin for tip biters matches the patterns of stress generated during tip loading,suggesting that in both ecotypes keratin is an important part of the stress mitigation strategy.In addition, positive and high correlations between beak aspect ratio and beak safety factor
Tuning of Beak Morphology
PLOS ONE | DOI:10.1371/journal.pone.0129479 June 12, 2015 11 / 14
indicate that birds with relatively deeper and wider beaks have higher safety factors (Table 4)and are thus better equipped to withstand loading due to biting. This provides evidence thatbeak shape affects the risk of failure.
In summary, our FE models demonstrate that beak shapes are generally well-suited for miti-gating risk of fracture in accordance with a species’ predominant feeding habitat. Understand-ing how beaks evolve to reduce risk of fracture may help to explain patterns of selection onbeak size and shape in natural populations, and ultimately should be considered as one of theaxes of adaptation and specialization in the Darwin’s finch radiation.
Data availabilityData is available from biomesh.org.
Supporting InformationS1 Fig. Muscle mass and tip bite force compared to the body mass of finches.Note how G.magnirostris and G. fortis have an exceptionally high muscle mass and bite force for their size.(DOCX)
S2 Fig. Top and side view for physiological FE models of upper beak during base biting for8 Darwin finches.(DOCX)
S3 Fig. Top and side view for physiological FE models of upper beak during tip biting for 8Darwin finches.(DOCX)
S4 Fig. Top and side view for scaled FE models of upper beak during base biting for 13 Dar-win finches.(DOCX)
S5 Fig. Top and side view for scaled FE models of upper beak during tip biting for 13 Dar-win finches.(DOCX)
AcknowledgmentsWe thank S. Maas and J. Weis (University of Utah) for allowing us to use the FEBio softwarepackage. We also thank three anonymous reviewers for constructive comments on an earlierversion of the manuscript. Field work was coordinated through the Charles Darwin ResearchStation and the Galápagos National Park Service (GNPS). We are particularly grateful for thegenerosity of the GNPS in granting a salvage permit, and to the California of Sciences for theloan of material. The authors thank Luis De Leon, Ana Gabela, Andrew Hendry, Mike Hendry,Eric Hilton, Sarah Huber, Katleen Huyghe, and Bieke Vanhooydonck for their assistance in thefield. This work was performed in part at the Center for Nanoscale Systems (CNS), a memberof the National Nanotechnology Infrastructure Network (NNIN).
Author ContributionsConceived and designed the experiments: JS, PA, JD, AH, DA. Performed the experiments: JS,AG, PA, AH, JP. Analyzed the data: JS, AG, PA, AH. Wrote the paper: JS, AG, JP, PA, JD, AH,DA.
Tuning of Beak Morphology
PLOS ONE | DOI:10.1371/journal.pone.0129479 June 12, 2015 12 / 14
References1. Temeles EJ, Kress WJ. Adaptation in a Plant-Hummingbird Association. Science. 2003; 300:630–3.
PMID: 12714743
2. Temeles EJ, Koulouris CR, Sander SE, Kress WJ. Effect of flower shape and size on foraging perfor-mance and trade-offs in a tropical hummingbird. Ecology. 2009; 90:1147–61. PMID: 19537537
3. Boag PT, Grant PR. Intense Natural Selection in a Population of Darwin’s Finches (Geospizinae) in theGalapagos. Science. 1981; 214:82–5. PMID: 17802577
4. Herrel A, Podos J, Huber SK, Hendry AP. Evolution of bite force in Darwin’s finches: a key role for headwidth. J. Evol. Biol. 2005; 18:669–75. PMID: 15842496
5. Herrel A, Podos J, Huber SK, Hendry AP. Bite performance and morphology in a population of Darwin’sfinches: implications for the evolution of beak shape. Funct Ecol. 2005; 19:43–48.
6. van der Meij M, Bout R. Scaling of jaw muscle size and maximal bite force in finches. J Exp Biol. 2004;207:2745–53. PMID: 15235003
7. BockWJ. Kinetics of the avian skull. J Morphol. 1964; 114:1–42.
8. Bout RG Biomechanics of the avian skull. In: Gasc JP, Casinos A, Bels VL, editors. Vertebrate Biome-chanics and Evolution II. Oxford: BIOS Scientific Publishers Ltd; 2002. pp. 49–62.
9. van der Meij MAA, Bout RG. The relationship between shape of the skull and bite force in finches. JExp Biol. 2008; 211:1668–80. doi: 10.1242/jeb.015289 PMID: 18456894
10. Bowman RI. Morphological Differentation and Adaptation in the Galapagos Finches. University of cali-fornia press: Berkeley and Los Angeles; 1961.
11. Nuijens F, Zweers F. Characters discriminating two seed husking mechanisms in finches (Fringillidae:Carduelinae) and Estrildids (Passeridae: Estrildinae). J Morphol.1997; 232:1–33.
12. Campàs O, Mallarino R, Herrel A, Abzhanov A, Brenner MP. Scaling and shear transformations capturebeak shape variation in Darwin’s finches. PNAS. 2010; 107(8):3356–60. doi: 10.1073/pnas.0911575107 PMID: 20160106
13. Herrel A, Podos J, Vanhooydonck B, Hendry AP. Force-velocity trade-off in Darwin's finch jaw function:a biomechanical basis for ecological speciation? Funct Ecol. 2009; 23:119–125.
14. Grant PR. Inheritance of size and shape in a population of Darwin’s finches. Proc R Soc Lond B. 1983;212:403–432.
15. Grant PR. Ecology and Evolution of Darwin’s Finches. Princeton Univ: Princeton; 1999.
16. Grant PR, Grant RB. Evolution of character displacement in Darwin’s finches. Science. 2006;313:224–6. PMID: 16840700
17. Lack D. Darwin’s Finches. Cambridge Univ Press: Cambridge; 1947.
18. Foster D, Podos J, Hendry AP. A geometric morphometric appraisal of beak shape in Darwin’s finches.J Evol Biol. 2008; 21:263–75. PMID: 18021202
19. Rayfield EJ. Finite element analysis and understanding the biomechanics and evolution of living andfossil organisms. Annu. Rev. Earth Planet. Sci. 2007; 35: 541–576.
20. Ross CF. Finite element analysis in vertebrate biomechanics. Anat Rec. 2005; 283A:253–8.
21. Richmond BG, Wright BW, Grosse I, Dechow PC, Ross CF, Spencer MA, et al. Finite element analysisin functional morphology. Anat Rec Part A. 2005; The Anatomical Record Part A: 283(2), 259–74.PMID: 15747355
22. Soons J, Herrel A, Aerts P, Dirckx JJJ. Determination and validation of the elastic moduli of small andcomplex biological samples: bone and keratin in bird beaks. J R Soc Interface. 2012; doi: 10.1098/rsif.2011.0667
23. Soons J, Herrel A, Genbrugge A, Adriaens D, Aerts P, Dirckx J. Multi-layered bird beaks: a finite-ele-ment approach towards the role of keratin in stress dissipation. J R Soc Interface. 2012; 9(73), 1787–96. doi: 10.1098/rsif.2011.0910 PMID: 22337628
24. Soons J, Herrel A, Genbrugge A, Aerts P, Podos J, Adriaens D, et al. Mechanical stress, fracture riskand beak evolution in Darwin’s ground finches (Geospiza). Philos T Roy Soc B. 2010; 365:1093–8.doi: 10.1098/rstb.2009.0280 PMID: 20194171
25. Herrel A, Soons J, Aerts P, Dirckx J, Boone M, Jacobs P, et al. Adaptation and function of the bills ofDarwin's finches: divergence by feeding type and sex. Emu. 2010; 110(1), 39–47.
26. Dumont E R, Grosse I R, Slater G J. Requierements for comparing the performance of finite elementmodels of biological structures. J Theor Biol. 2009; 256:96–103. doi: 10.1016/j.jtbi.2008.08.017 PMID:18834892
Tuning of Beak Morphology
PLOS ONE | DOI:10.1371/journal.pone.0129479 June 12, 2015 13 / 14
27. Genbrugge A, Herrel A, Boone M, Van Hoorebeke L, Podos J, Dirckx J, et al. The head of the finch: theanatomy of the feeding system in two species of finches (Geospiza fortis and Padda oryzivora). J Anat.2011; 219,6: 676–95. doi: 10.1111/j.1469-7580.2011.01437.x PMID: 21999913
28. Loeb GE, Gans C. Electromyography for experimentalists. University of Chicago Press, Chicago;1986.
29. Mendez J, Keys A. Density and composition of mammalian muscle. Metabolism. 1960; 9, 184–8
30. Nigg B, HerzogW. Biomechanics of the Musculo-skeletal System. JohnWiley & Sons Ltd, Universityof Calgary, 3th edition; 2007. PMID: 18001971
31. Nuijens FW, Zweers GA. Characters discriminating two seed husking mechanisms in finches (Fringilli-dae: Carduelinae) and estrildids (Passeridae: Estrildinae). J. Morp. 1997; 232(1):1–33
32. Si H. TetGen: A Quality Tetrahedral Mesh Generator and three-dimensional Delaunay Triangulatorv1.4. Control at <http://tetgen.berlios.de>; 2006.
33. Maas S, Weiss JA. FEBio: Finite Elements for Biomechanics. User’s Manual, Version 1.0. Online publi-cation; 2008.
34. Carter DR, HayesWC. Bone compressive strength: the influence of density and strain rate. Science.1976; 194:1174–6 PMID: 996549
35. Rice JC, Cowin SC, Bowman JA. On the dependence of the elasticity and strength of cancellous boneon apparent density. J biomech. 1988; 21.2 155–68. PMID: 3350829
36. Ford CM, Keaveny TM. The dependence of shear failure properties of trabecular bone on apparentdensity and trabecular orientation. J biomech. 1996; 29.10: 1309–17. PMID: 8884476
37. Fyhrie DP, Vashishth D. Bone stiffness predicts strength similarly for human vertebral cancellous bonein compression and for cortical bone in tension. Bone. 2000; 26:169–73. PMID: 10678412
38. Farren L, Shayler S, Ennos AR. The fracture properties and mechanical design of human fingernails. JExp Biol. 2004; 207.5: 735–41.
39. Chou SF, Overfelt RA, Miller ME. Anisotropic mechanical behavior of keratin tissue from quill shells ofNorth American porcupine (Erethizon dorsatum). Mater Sci Eng A-Struct. 2012; 557:36–44.
40. Li BW, Zhao HP, Feng XQ, GuoWW, Shan SC. Experimental study on the mechanical properties ofthe horn sheaths from cattle. J exp biol. 2010; 213(3):479–86. doi: 10.1242/jeb.035428 PMID:20086133
41. Genbrugge A, Adriaens D, Kegel B, Brabant L, Hoorebeke L, Podos J, et al. Structural tissue organiza-tion in the beak of Java and Darwin's finches. J anat. 2012; 221, 5: 383–93. doi: 10.1111/j.1469-7580.2012.01561.x PMID: 22938039
42. Yamada H. Strength of Biological Materials. Williams &Wilkins: Baltimore; 1970.
43. Vogel S. Comparative Biomechanics: Life’s Physical World. Princeton University Press: Princeton;2003.
44. Currey JD. Bones: Structure and Mechanics. Princeton University Press: Princeton; 2006.
45. Panagiotopoulou O, Kupczik K, Cobb SN. The mechanical function of the periodontal ligament in themacaque mandible: a validation and sensitivity study using finite element analysis. J. Anat. 2011;218,75–86. doi: 10.1111/j.1469-7580.2010.01257.x PMID: 20584094
46. BerthaumeMA, Dechow PC, Iriarte-Diaz J, Ross CF, Strait DS, Wang Q, et al. Probabilistic finite ele-ment analysis of a craniofacial finite element model. j theor boil. 2012; 300: 242–53. doi: 10.1016/j.jtbi.2012.01.031 PMID: 22306513
47. Kupczik K, Dobson CA, Fagan MJ, Crompton RH, Oxnard CE, O’Higgins P. Assessing mechanicalfunction of the zygomatic region in macaques: validation and sensitivity testing of finite element models.J Anat. 2007; 210,1: 41–53. PMID: 17229282
48. Fitton LC, Proa M, Rowland C, Toro-ibacache V, O’Higgins P. The impact of simplifications on the per-formance of a finite element model of a Macaca fascicularis cranium. The Anat Rec. 2015; 298,1: 107–21. doi: 10.1002/ar.23075 PMID: 25339306
49. Grant P R, Grant B R. How and why Species Multiply: The radiation of Darwin’s Finches. Princeton Uni-versity Press: Princeton & Oxford; 2008.
50. Genbrugge A, Heyde AS, Adriaens D, Boone M, Van Hoorebeke L, Dirckx J, et al. Ontogeny of the cra-nial skeleton in a Darwin’s finch (Geospiza fortis). J anat. 2011; 219, 2: 115–31. doi: 10.1111/j.1469-7580.2011.01388.x PMID: 21599660
Tuning of Beak Morphology
PLOS ONE | DOI:10.1371/journal.pone.0129479 June 12, 2015 14 / 14