research topic understanding consumer behaviour in the
TRANSCRIPT

Research Topic Understanding consumer behaviour in the Spanish
fitness industry
Bachelor Thesis Geneva Business School
Bachelor in Business Administration - Sport Management & Marketing
Submitted by:
Nicola Bordogna
Geneva, Switzerland
Approved on the application of:
Dr. Ryan Federo
And
Dr. Roy Mouawad
Date: 26 May 2020
Total number of words (excluding references and appendices): 11318

2
Declaration of Authorship
“I hereby declare:
● That I have written this work on my own without other people’s help (copy-editing, translation, etc.) and without the use of any aids other than those indicated;
● That I have mentioned all the sources used and quoted them correctly in accordance with academic quotation rules;
● That the topic or parts of it are not already the object of any work or examination of another course unless this has been explicitly agreed on with the faculty member in advance;
● That my work may be scanned in and electronically checked for plagiarism.”
Date: 22/05/2020
Name: Nicola Bordogna
Signature:
3
Acknowledgements
First of all, I express my sincere thanks to my thesis advisor, Professor Ryan Federo, for following and helping me throughout my research period. Professor Federo was always ready to give me advice whenever I needed or had a question about my research or writing.
I would also like to thank the General Director of Technogym Iberia, Renato Senta, and the Marketing manager of Technogym Iberia, Claudia Annibaldi, for giving me the opportunity to do a thesis related to my internship at Technogym.
I must express my very profound gratitude to my parents, to my sister, to my aunt, to my grandmothers, and to my girlfriend for providing me with unfailing support and continuous encouragement throughout my years of study and through the process of researching and writing this thesis. This accomplishment would not have been possible without them. Thank you.
Lastly, I want to devote this important achievement to my grandfathers, who passed away in the last years, because they would have been very proud of me.

4
Table of Content
DECLARATION OF AUTHORSHIP 2
ACKNOWLEDGEMENTS 3
TABLE OF CONTENT 4
ABSTRACT 5
CHAPTER 1: INTRODUCTION 6
CHAPTER 2: SUMMARY OF LITERATURE REVIEW 8
CHAPTER 3: BODY OF THESIS 16
CHAPTER 4: FINDINGS 20
CHAPTER 5: SUMMARY, CONCLUSIONS, AND RECOMMENDATIONS 35
REFERENCES 39
APPENDICES 45

5
Abstract Gyms are one of the most used and common places for people to exercise, no matter their level. Everyone has different reasons for going to the gym but in the end, most of them go for personal health. The world is changing, in which digitalization is one of the main factors for this change. As a result, almost every business has to adapt to the change and improve the way it operates. The fitness industry is no exception; therefore, fitness companies need to develop products that satisfy customer needs. The popularity of gym members is rising in Europe, especially in Spain where the market faced a rapid growth over the last few years. Thus, this thesis aims to understand consumer behaviour regarding gym equipment. This study employs a quantitative analysis approach, using a specially designed survey which brought a sample of 187 people from Spain. The questionnaire consists of 14 questions that ask about the demographic characteristics and behaviours (i.e., motives, preferences, activities, and awareness) of the respondents. Using Kruskal-Wallis H and Mann-Whitney U tests, the study examines whether there are differences in the behaviour of distinguishable consumer groups based on their demographic characteristics. The findings show statistically notable differences among consumer groups, defined by gender, marital status, employment status, income level, age, and education level. Ultimately, this research emphasizes the importance of better understanding the behaviour of gym enthusiasts, which would be particularly crucial for the strategies of gym operators and gym-equipment producers.

6
Chapter 1: Introduction
Digitalization is defined as “the process of making digital everything that can be digitized and the process of converting information into digital format” (Croon Fors, 2012, p. 62). It changes everything: the way we live, the way we learn and the way we do business (Ilcus, 2018). As a consequence, digitalization is becoming a very important topic and evolving into an interesting subject of discussion at every level.
Over the last few years, the fitness industry is adapting to a growing digitalization that completely changed the way we train at the gym. In the fitness industry, digitalization refers to the development of new products containing a software which allows customers to track their progress, see the results of every workout, and even improve their training. For instance, new machines such as treadmills or bikes have a screen in which the clients can watch their favourite TV programs, simulate a marathon, or try different kinds of training while doing the physical activity (Technogym, 2019). As a result, all of these data can be gathered in digital applications which take the analogue information and transform it into digital information to make it easily accessible (Hughes, 2004). In other words, thanks to the technology, it is possible for people who train to see their results directly on their smartphones and program the next training already knowing how to increase the performance and train more efficiently.
There are millions of people who go to the gym, and this trend is annually increasing (Dale, Godinet, Kearse, & Field, 2009). Looking at the European market, the market is growing rapidly, in which we see an exponential increase in the number of fitness clubs(MarketLine, 2017). In other words, fitness is a business which has expanded constantly over the last years and leading to many new market opportunities. For instance, the fitness market in Spain in 2019 has grown about 16% more than the previous year, which is very impressive given that the Spanish economy has grown just by 2% from 2018 to 2019 (Palco23, 2020). Thus, it is important to examine how fitness companies could explore business opportunities that will be available in the future since the fitness industry is currently a very fast-growing market.
This topic is significant because fitness is playing a significant role in today’s lives. The development of new technologies justifies the need to improve gym’s machines for fitness firms (Andreasson & Johansson, 2014). Fitness companies which already produce these more technologically advanced products are the ones that are selling the most in the market (MarketLine, 2017). However, the constantly evolving needs and behaviours—such as preferences and perception—of consumers have become a challenge for these firms. Moreover, many of these consumer preferences have been attributed to their demographic differences. For this reason, this thesis addresses the following research question: what are the differences in the behaviour of consumer groups regarding gym equipment?
To answer this research question, this study develops different hypotheses on the relationship between the consumers’ behaviour regarding gym equipment and different demographic characteristics such as gender, marital status, employment status, income level, age, and education level. Using a quantitative research methodology, a suitable approach used for the objective measurement and statistical analysis of data collected

7
through surveys (Given, 2008), this study examines the previously described relationships with the use of a survey that generated a sample of 187 respondents. The survey questionnaire is divided into two sections relating to consumer demographic characteristics and behaviour, with a total of 14 questions specially designed for this research.
This research provides evidence that people with different contextual elements—
related to the demographic characteristics of the consumers—differ among themselves about their motives, preferences, activities, and awareness regarding their gym membership. Therefore, the results showed differences among the respondents. For instance the motives for going to the gym among the consumers and the most used type of equipment all partially support the hypotheses. Moreover, other variables such as the preference of going to a specific fitness chain, the frequency of training and the awareness of the presence of Technogym’s equipment in the gym, mostly scored that they do not support the hypotheses. Furthermore, the awareness of the improvement of the products and the usefulness of smart digital devices and applications had different results depending on the contextual element. For example, according to the different age, they both scored that the hypotheses are supported. Lastly, the consideration of equipment when subscribing to the gym resulted in supporting the hypotheses in each dimension.
This study makes an important contribution for academics and practitioners.
Mainly, it generates a more general, rigorous picture of consumer behaviour with a particular focus on their differences related to gender, marital status, employment status, income level, age, and education level. Previous research or case studies on the same topic have not analysed the matter from the context of the fitness industry. Thus, this study could help fitness companies for their market research and future product developments for their business.
This thesis proceeds as follows. In the next section, the current situation of the fitness industry is evaluated and reviewed. Following that, the methodology is discussed, focusing on explaining the sample in general and explaining the verification process, describing the data from the questionnaire, and discussing the performed analysis. Thereafter, the results of the surveys are presented, leading to the relevant findings. The final section concludes with a sum up of the thesis, a discussion of the findings, and presentation of the implications, limitations, and recommendations.

8
Chapter 2: Summary of Literature Review Current situation of the fitness business
The fitness business has been growing quickly over the last years, especially in developed countries. There is, in fact, an increasing focus of society on an individual’s well being; the development of a good physique and a greater effort in achieving a healthy lifestyle are critical aspects in the growth of the fitness industry (Panasenko, Nikishin, Mayorova, Boris, & Murtuzalieva, 2018; Dale, Godinet, Kearse, & Field, 2009). As a result, nowadays, there are millions of people who are subscribed to a gym around the world (Dale et al., 2009). Naturally, this phenomenon started to attract younger people who want to get in shape and older people who want to be healthier (Panasenko et al., 2018).
The fitness industry has a very important mission, which is directly related to an ageing population whereby the trend is for people to be more sedentary and be out of shape (Dale et al., 2009). On a similar note, the younger generation is practising less sport, resulting in an increase in obesity, which can be directly attributed to the development of the “online world.” Consequently, insurance companies and governments are trying to implement a system for cutting health-related costs (Dale et al., 2009). For this reason, the fitness chains have also begun promoting health awareness by increasing the number of 24/7 gyms, coupled with nutritionists and other specialists as part of the services offered.
However, these fitness centres are having difficulty in attracting people. On the one hand, many people are attracted to fitness but not to gyms. This is mainly due to a vast number of new recreational outside sports that do not necessarily need the professional equipment of a standard gym. On the other hand, there are many ways to achieve what fitness does in a shorter way by doing less-effort than going to a gym, such as surgery, science, and technology (Dale et al., 2009). Thus, the gyms are now buying more digitised machines (e.g. interactive treadmills and bikes), which have screens where people can do their workout and at the same time “be distracted” by the interactive platform (Dale et al., 2009).
The next step of the research is to review the report of the MarketLine industry profile around Europe; just in 2017 alone, the European market generated a staggering total revenue of $30,122.0 million (MarketLine, 2017). Furthermore, the German and the English markets are the leaders of the fitness industry. There is. however, an emerging market composed of low-cost gyms which are becoming very popular especially in less developed countries because of their low membership fee (MarketLine, 2017). Geographically speaking, it is very clear how the market is divided around Europe; the United Kingdom and Germany (around 20% each) are the countries with the biggest segmentation, followed by Italy, France, and Spain (each has around 8%), and then the rest of Europe which has a market segmentation of 33% (MarketLine, 2017). Looking at the market expected growth, it is estimated that from 2017 to 2022 there will likely be a 17% increase in market size, with a resulting increase in revenue around $35,232.8 million (MarketLine, 2017).

9
Historical development of modern gym and the use of digital applications
There is an extensive story behind the transformation of the fitness culture but it is possible to say that since the 1970s there has been a huge global expansion of the industry (Andreasson & Johansson, 2014). Many countries have a very strong fitness background, especially the United States of America (US), which is the biggest country with people that go to the gym. In the late 20th century, in order to attract more fans, gyms started organizing many competitions with popular bodybuilders such as Arnold Schwarzenegger and Lou Ferrigno. During those years, it has developed an idea of body subculture especially directed to males; following the movie Pumping Iron II published in 1985, which showed four women preparing for a bodybuilding competition, this ideology began to change (Andreasson & Johansson, 2014). This moment can be seen as the new starting point for a modern fitness culture where the gym has become a place of mass leisure activity.
A study made by ‘Revista Espacio’ shows that gyms are facing an important development in products. It is stated that even though the new gym machines provide the same type of exercise as the previous models, there are many improvements in the quality of the products and in the implementation of technologies which are applied to the machines (Panasenko et al., 2018).
Moreover, the gym and fitness culture can be compared to McDonaldization, since they are all related to the topic of Americanization. When it comes to fitness culture, there is a historical association with the American cultural conceptions of beauty, bodybuilding, and values which are still one of the core pillars of this industry (Melnick & Jackson, 2002; Monaghan, 2007). However, despite the prominence of this subculture, the concept of bodybuilding is associated with the use of drugs and steroids; thus, this is one of the reasons for its separation with fitness.
As Sam Fussell confessed, the public image of bodybuilding is deteriorating and the ‘sport’ got a very bad reputation (Fussell, 1991; Hoberman, 2005). As a result, the decline of bodybuilding has paved the way for a fitness revolution. On one hand, there is the bodybuilding which is connoted to the use of pastiche, drugs, steroids, and hyper-masculinity; on the other hand, fitness is seen as something which brings youth, health, and beauty. To sum up, this difference between healthy and unhealthy is just one part of the fitness business (Andreasson & Johansson, 2014).
Furthermore, over the last years, there have been many health and fitness applications launched on Google Play and Apple Store. Many of these applications became very popular especially among the younger generation because they are more concerned about the use of technology and weight control. However, several launched applications failed because of different factors such as difficulty in accessibility or high price to download the app (Khalaf, 2014; Park, Yoo, Kim, & Lee, 2018).
A study conducted by Electronic Commerce Research suggests the main factors that could stimulate the young generation to download and use fitness-related applications. These factors are divided into two groups: the social-cognitive group and the quality-related group. The results of this study ultimately argue that social-cognitive

10
characteristics are those factors that have a very powerful influence over people. Additionally, today in the market there are a huge number of free fitness applications and every time a new one is launched it is often better than the previous ones. In other words, it is a waste of time for a researcher to develop and design a new app. However, what researchers should do, is to invest money in already existing applications which are already successful and try to implement the design in order to attract the social-cognitive factors of users (Park et al., 2018).
Furthermore, social-cognitive factors are a very important reason why this thesis looks at three variables (gender, marital status and employment status). It was found that a key difference between genders played a crucial role in the relationship between customer behaviour and social-cognitive factors (Renner et al., 2008). According to a research published by the Californian Journal of Health Promotion, demonstrated that marital status and physical activity are related and the usage of the social cognitive factors helped to better understand it (Michel, Goodson, & Pruitt, 2013). Moreover, these factors do also impact people in accordance with their employment. For instance, employees are influenced by some of those factors and as a result, they perform differently at work (Cashin & Ifinedo, 2014). Benefits of doing exercise for young and adults
Physical activity is any movement that our body does which involves energy consumption. Nowadays, it is required to be very effective at work and do things in less time, but in order to achieve that it is crucial to maintain a good work-life balance; exercising makes people happier, healthier, and more efficient (Elmagd, 2016). Moreover, it is empirically supported that physical activity helps to prevent many illnesses such as heart diseases, diabetes, obesity and depression (Vuori, 1995). In other words, doing exercise has many benefits, which are not just related to health but also the general well-being of a person (Jones, 1998). However, prior research shows that there has been a decrease in physical activity rates over the last years, especially among the younger population. As a consequence of this, the trend might get worse in the next few years (Kann, Kinchen, Lowry, Grunbaum, & Kolbe, 1999; Trost et al., 2002).
There are four groups of exercises: endurance, strength, balance, and cardio; each of them gives benefits and this is why the best would be to mix them and not just do one. In addition to this, the exercises can be divided into two types: aerobic and anaerobic. The first one has the goal to increase the endurance of the cardiovascular system, while the second one improves balance and strength (Wilmore & Knuttgen, 2003; De Vos et al., 2005). To put it in a more straightforward way, it is very important to do exercises otherwise the bones become weaker and people might get injured easier. To sum up, people who do physical activity have a lower risk of getting diabetes, cardiovascular disease, and obesity (Stampfer, Hu, Manson, Rimm, & Willett, 2000; Hu et al., 2001). According to Doğan (2015), there are three key themes which motivate people to train at the gym, those benefits are higher productivity and efficiency, more sense of control, and a better psychological situation.
Furthermore, society is becoming more sedentary and it is increasing the level of stress in people, thereby resulting in a less active population. In other words, the majority

11
of the world’s population is not aware of the benefits of sports for the body and for achieving a better quality of life (Bădicu & Balint, 2016). Nevertheless, the quality of life is as important as economic wellbeing and this is a pillar in order to achieve personal goals (Nussbaum & Sen, 1993).
The quality of life can be attributed to the environment and the population’s well-being (Liu, 1975). Overall, the quality of life in Europe changes from one country to another. For example, northern countries have a higher quality of life than the south or eastern countries (Bădicu & Balint, 2016). As a result, health status is the most important factor for the evaluation of the quality of life but this can be affected by the level of psychological, physical, and social health. However, in Europe, the level of quality of life has begun decreasing because the lives of the population have become too stressed and sedentary (Bădicu & Balint, 2016).
In addition, physical activity is on the basis of the life of young students too. It is often said that the younger generations are becoming more inactive, but this is because colleges and universities seem to fail in providing enough sports activities for them to engage in. For instance, Germany and Italy were the first countries to implement physical education into their school systems in all the faculties and to add it in the university curriculum (Tifrea, Giosan, & Costache, 2016). During the last few years, the improvement of the position of European countries has brought to very fast development of the educational process. In other words, the implementation of the new curriculum has helped students not just to have general knowledge, but also get the physical competences (Tifrea et al., 2016). What health care has to do in order to enter the fitness industry
Parrot (1996) reports that health care providers are becoming more and more interested in the fitness market. This is because, thanks to the development of the fitness industry, the healthcare industry has seen a new profitable opportunity. There are five principles for health centres (e.g. hospitals, clinics) to follow in order to become successful in this new market (Parrot, 1996). Firstly, they need to understand how important the strategy of the fitness business is for health care companies. This means that fitness chains affiliated with medical centres need to have easier and faster access to the services provided by health centres. Secondly, it is a core pillar to understand and know your clients. In other words, it is important to know the budget of your customers before pricing or know which facilities are the best for them considering how often they train. Thirdly, health centres need to provide different kinds of products in order to give the client a vast choice. It is important to keep in mind the potential demand that a centre might receive because there is the risk to not be able to support the requests. Fourthly, many centres do not succeed because of a lack of proper management. This is why it is necessary to hire the best staff that they can get. Lastly, it is crucial to advertise (e.g. through direct emails), promote (e.g. through social media), and offer special prices to new customers. The importance of the customers
Nowadays, at gyms, it is becoming more important to focus on customer experience and satisfaction because going to the gym is not anymore just about training,

12
but it is already more about the engagement that the client has with the gym (Algar et al., 2017). The key aspect for gyms to engage with the clients is to build a relationship based on trust and respect. Moreover, there are two critical battles: the customer buy-in and the sense of belonging for a client.
In other words, this translates in the objectives to have firstly a customer that sees and understands the methodology used at the gym, and secondly to have a good feeling of the gym to be given to the client (e.g. the desire of being part of that gym because of the people who are there). If these two battles are won, the fitness club has a big opportunity of having a higher level of customer engagement. To sum up, it is essential to keep the clients happy with a healthy relationship because this will be the key that will keep them in the long term.
Furthermore, it is vital for gyms to create a customer experience and engagement also through personal trainers. Personal training is one of the most important areas of gym services because it has direct contact with the clients and it generates a higher price to train with one of the trainers (Pine & Gilmore, 2011). As a consequence of that, the price is higher when a client receives a good service but the price will rise even more when the client could get a unique experience.
However, the relationship between the customer and the personal trainer does not develop overnight, which takes time and effort; for instance, there are three levels of engagement: business, personal, and emotional. These are the three stages of customer experience in which the more often a client trains, the faster these stages are achieved (Algar et al., 2017). Moreover, there are many ways in order to keep the relationship and this can be done through face-to-face meetings, phone calls, emails, and applications. These are all very important tips for the personal trainer because the relationship changes very fast and easily.
Additionally, digitalization has entered the fitness world as well. This trend can be attributed to the development of smartphones and other wearable digital devices. There are three steps in order to improve the use of technologies for the client’s engagement: consistency, continuity, and customisation (Algar et al., 2017). First, consistency is about the attraction of each technology; for instance, the style, design, and messaging have to be used in a way that customers would feel unique. Second, continuity has the goal of being able to perform the same tasks across channels and digital devices without losing what was doing before. Lastly, customization is crucial because the clients expect that the fitness club understands and knows their needs, being able to adapt based on their preferences.
In addition, according to the report of Brigadoon fitness, Ideal Customer Experience (ICE) is a culture that they have inside the company, enabling them to understand the customers by having the “the right people and the right products in the right place at the right time”(Davis, 2018, p. 44). In other words, the company wants to know everything about the customers and give them solutions if there is negative feedback. To sum up, they want to offer, at a reasonable price, a high-quality product and this is something that definitely works from the customer’s perspective (Davis, 2018).

13
Overall, the importance of customers is specifically underscored by an extensive research on consumer behaviour. According to a questionnaire made by a gym, clients answered in different ways about the reason why they go to the gym and this affects customer behaviour. For instance, some clients said that it is because they want to stay healthy and look good in their clothes, other said that it helps to disconnect from work and take the stress away, another group of respondents said that they can reach their goal through training hard and lastly, a part of customers said that they have the chance to meet friends and meet new people (Green, n.d.).
Moreover, it is important for customers to choose the right gym and in order to do this, the gym needs to offer programs which are interesting for you and also have a wide variety of fitness equipment. In addition to this, clients look if the venue is safe, clean and attractive because this will stimulate them. Furthermore, it is crucial for many clients to have a gym with nice staff which helps in case they need it (Beltz & Korzan, 2019). Another consumer behaviour is related to the activities at the gym which means how often people train. According to the Europe’s journal of psychology, people train three times per week and this helps them to control their lives, perform better at work and be more efficient (Doğan, 2015). Lastly, the awareness of the development of gym’s equipment is also part of the consumer behaviour. In other words, every product follows a life-cycle (introduction, growth, maturity, decline and termination) but during the last decade, there is a bigger sense of recognition of the development of the gym products thanks to the development of new technologies (Addolorato, García-Fernández, Gallardo, & García-Unanue, 2020). Hypotheses development
While the above arguments explain the general aspects of consumer behaviours, certain contextual elements—relating to the demographic characteristics of the consumers—are more likely exacerbating the differences in such behaviours. For instance, gender is known to have a significant influence on consumer preferences. In this study, I highlight that different genders have different preferences regarding the fitness centre membership. Usually, gyms are divided into different areas: strength, cardio, and functional equipment. As a result, free-weights areas are mostly used by males while stretching cardio areas are primarily used by females (Higgins, 2011). Research has shown that different genders have different tastes in many things; for instance, by looking at their food or fashion preferences, it is possible to see that they often have opposite tastes and they are expected to choose differently (Bender, 1976). This is because of the nature of the two different genders, in which females being on average are more consistent in what they think than males (Bender, 1976). Using the same logic, this study assumes that when it comes to consumer behaviour regarding gym membership, females and males are more likely to have different behaviours. This study, therefore, aims to test whether there are differences between genders about their motives, preferences, activities, and awareness regarding their gym membership.
Hypothesis 1a: Females and males differ in their motives for gym membership. Hypothesis 1b: Females and males differ in their preferences regarding gym membership. Hypothesis 1c: Females and males differ in their activities in the gym. Hypothesis 1d: Females and males differ in their awareness of the gym equipment.

14
Apart from gender, the marital status might also be another demographic
characteristic that influences consumer behaviour. Research in finance suggests that people with different marital status have contrasting opinions when investing money. For example, single people are more willing to invest just thinking about themselves while married people prefer to invest in long term thinking more about their family. Moreover, widowed or divorced individuals are in a situation where they are in the middle between the two previous categories (Rana, 2017). As a result, it might be that this can also be applied to their behaviours concerning gym membership. This study, thus, assumes that people with different marital status are more likely to have different behaviours concerning gym membership.
Hypothesis 2a: Single and non-single people differ in their motives for gym membership. Hypothesis 2b: Single and non-single people differ in their preferences regarding gym membership. Hypothesis 2c: Single and non-single people differ in their activities in the gym. Hypothesis 2d: Single and non-single people differ in their awareness of the gym equipment.
Moreover, employment status could also influence consumer behaviours.
Research shows that unemployed and employed people differ from each other in four main factors. Firstly, they have different individual characteristics; secondly, their past jobs affected them in dissimilar ways and this impacts on their decision making strategy; thirdly, they have distinct preferences over the working hours; and lastly, they have contrasting plans of action when they look for a job (Longhi & Taylor, 2011). Extrapolating this lesson to gym membership, this study also assumes that people with different employment status are more likely to have different behaviours regarding their gym membership.
Hypothesis 3a: Employed and unemployed people differ in their motives for gym membership. Hypothesis 3b: Employed and unemployed people differ in their preferences regarding gym membership. Hypothesis 3c: Employed and unemployed people differ in their activities in the gym. Hypothesis 3d: Employed and unemployed people differ in their awareness of the gym equipment.
Related to employment, the income of the people is also a factor which might affect consumer behaviour. A research published in the journal of happiness studies shows how people with different income brackets differ in motivation for life satisfaction. For instance, it was analysed that motivation variables had a crucial effect on life satisfaction for individuals in the high-, middle-, and low-income brackets (Salinas-Jiménez, Artés, & Salinas-Jiménez, 2010). As a result, it could also be that this can be applied to consumer behaviours concerning gym membership. This study, thus, intends to examine whether there are differences between people in different income brackets about their motives, preferences, activities, and awareness regarding their gym membership.
Hypothesis 4a: People in different income brackets differ in their motives for gym membership.

15
Hypothesis 4b: People in different income brackets differ in their preferences regarding gym membership. Hypothesis 4c: People in different income brackets differ in their activities in the gym. Hypothesis 4d: People in different income brackets differ in their awareness of the gym equipment.
Furthermore, another characteristic which might affect consumer behaviour is age.
It was found in a study that people from different age groups had different preferences over their workplace preferences. In other words, very significant differences were found concerning their personal services. For instance, younger generations preferred workspaces that supported teamwork and innovation, while older ones preferred the restaurant offering in the neighbourhood and adjustability of the indoor climate (Rothe, Lindholm, Hyvönen, & Nenonen, n.d.). As a consequence, it could be that this can also be applied to their behaviours concerning gym membership. This study, therefore, aims to test whether there are differences between people in different age brackets about their motives, preferences, activities, and awareness regarding their gym membership.
Hypothesis 5a: People in different age brackets differ in their motives for gym membership. Hypothesis 5b: People in different age brackets differ in their preferences regarding gym membership. Hypothesis 5c: People in different age brackets differ in their activities in the gym. Hypothesis 5d: People in different age brackets differ in their awareness of the gym equipment.
Lastly, apart from different income brackets and different age brackets, the
educational level might also be another characteristic that influences consumer behaviour. In a study made by the University of Twente, it was stated that people with different educational levels differ in their perception of a good life and this was often because of different occupations (Eckhardt, 2017). Moreover, according to another research, people with mid-level education score higher in happiness than people with lower or higher education (Hartog & Oosterbeek, 1988). Using the same logic, this study assumes that when it comes to consumer behaviour regarding gym membership, people with different education levels are more likely to have different behaviours.
Hypothesis 6a: People with different education levels differ in their motives for gym membership. Hypothesis 6b: People with different education levels differ in their preferences regarding gym membership. Hypothesis 6c: People with different education levels differ in their activities in the gym. Hypothesis 6d: People with different education levels differ in their awareness of the gym equipment.

16
Chapter 3: Body of Thesis Sample
The research process followed a very detailed and structured guideline. For this
study, primary data was collected with the use of a specifically designed survey. Since the researcher is doing an internship at Technogym S.p.A. (a company leader in the world of gym equipment) in Barcelona, all of the survey participants were reached through the connection of the researcher’s colleagues who helped share the survey questionnaire to people who were potential respondents. The email sent by the researcher’s colleagues to the probable interviewees contained a brief description of the topic, the purpose of the survey, the privacy policy of the survey, and a request to fill it out. Once those people decided to answer the survey, they had to click on the link in the email to answer the questions. The responses were automatically transferred to the Google Form survey administration system.
The participants answer the questions in complete anonymity, which means that
no personal information such as name, surname or email were required. The approximate time in order to complete the questionnaire was 5 minutes. There was not any kind of incentive in order to attract more people to fill the questionnaire, therefore every single submission of the survey was done completely voluntarily.
Furthermore, in pursuance to have very significant reliability of the research, respondents are all people which have direct contact with the company Technogym S.p.A., where the researcher is working, which means that there are no fake people who completed the survey but rather every person is real and has a close relationship with the fitness industry. In addition to this, another stage of validation was given by the researcher’s colleagues which assured the fact that every participant was part of their personal contacts, contacted by direct email and spread around the Spanish territory.
The main reason why such a verification method was used is to prevent the risk of collecting any false data from the questionnaire respondents, which would have of course affected the findings and the result of the research. In that case, the thesis would have not been reliable and the whole process would have been useless. In other words, the verification process was taken very seriously and everything has been checked more than once.
In addition, other verification processes have been considered, however, such alternatives would possibly have created a disruption for the survey and would have caused some problems. In other words, asking the participants to give more personal data might have been too invasive; moreover, Technogym S.p.A. advised the researcher not to include anything personal such as names, surnames or emails but to keep it anonymous; and in order to be compliant with privacy policies, the researcher followed their guidelines. As a consequence of this request, the missing of further verification methods does not affect the outcome of the research.
Besides, the main advantage of sending online questionnaires around Spain mitigates the problem of recording all the data from a paper and pencil survey, as well as

17
saving money and time. Additionally, another preconceived opinion that might arise, because of the use of an online questionnaire, is a specific age group’s misrepresentation. To put it simply, such fallacy might happen but for this survey, very specific people were chosen, with different age groups and as a result, the answers of the respondents did not show any issues. Hence, to sum up, the formerly explained procedure with direct emails sent to specifically chosen people was used for the collection of the data for this research. Data
To proceed with the research, an online survey—consisting of 14 questions
grouped into two parts—is specifically created for this purpose. The first part is about the participant's profile while the second part is about more specific questions addressing the behaviours concerning gym membership. Before the online survey was sent to the potential participants, it was sent as a pre-test to 20 people. Feedbacks were collected and some minor final adjustments were made before the final version was ultimately sent to the respondents. More specifically, once that survey has been tested, few little corrections were made to the survey, wherein there were a few questions about some terminologies and the presentation of the questionnaire.
To begin with, the questionnaire started with a brief introduction explaining the
content of the survey, the researcher, and the objective of the study. The goal was portrayed as an attempt to understand the demographic characteristics of the respondents, particularly focusing on their gender, age, marital status, and their employment and income status. The questions for the second part were based on the literature review of this thesis about the respondents’ behaviour with regard to their gym membership.
One hundred and eighty-seven participants filled out a tailored survey that
collected consumer behaviour about gym membership. The questionnaire was sent to people who actually are subscribed to gyms in Spain.
The first part of the survey had six multiple-choice questions regarding the profile
of the participant. The first question was about the gender: male, female or prefer to not say. The second question was concerning age and it was divided into different age groups. The next multiple choice regarded the education level. Following, there were questions about employment and income range of the participants. The last question of this section was concerning the marital status. These questions provide the dataset for the demographic characteristics of the respondents.
The second part of the questionnaire had eight questions: one short answer, one
checkbox, four multiple choices and two linear scales. The questions are grouped into four overall categories: motive, preferences, activities, and awareness. First, the motive is captured using a checkbox question asking for the main reasons why people go to the gym. This variable is used to test Hypotheses 1a, 2a, 3a, 4a, 5a, and 6a.
Second, the preferences are measured using two questions. The first one requires
a short answer to fill the name of their fitness chain, while the second one is a checkbox question asking if the respondents considered the fitness equipment of the gym when they subscribe. These variables are used to test Hypotheses 1b, 2b, 3b, 4b, 5b, and 6b.

18
Third, the activities were collected using two questions. The respondents were
asked using a multiple-choice question how often they train in the gym and a checkbox question asking the kind of equipment that they use the most. These variables are used to test Hypotheses 1c, 2c, 3c, 4c, 5c, and 6c.
Lastly, data on awareness is collected using three questions. A yes or no question
asks whether the gym has Technogym products. The remaining two questions ask a rating on a 5-point Likert-type scale (1 = strongly disagree, 5 = strongly agree). Those two questions ask whether they see an improvement of the gym’s machines and whether they find the smart digital devices and applications useful during training. These variables are used to test Hypotheses 1d, 2d, 3d, 4d, 5d, and 6d.
At this point, participants were surveyed and all their answers were recorded. The
first section of the questionnaire was about demographic questions which were very helpful in order to understand the profile of every participant. The second part of the survey was about gym membership related questions which helped to get information about the reasons why people train or if they saw improvement in the equipment and if they use digital applications during their workout. As a result, the gathered data will be used later on in the data analysis. The evaluation of the characteristics of the respondents’ profile, addressed by the questions listed above, guarantees the possibility of forming a measurable relationship between client and gym. Ultimately, all the collected data associated with demographic and gym’s membership are the core pillar of the segmentation of the gym’s clients. Analytical procedures
The research design chosen for this specific study is a quantitative research approach by conducting a particular survey as a tool for gathering primary data. The quantitative approach is selected as the best method for this research since it is appropriate for examining statistical differences and making comparisons between groups (Given, 2008). In addition to this, the current study uses different variables such as socio-demographic and behavioural ones. Moreover, there were studied motivational factors, the improvement of the equipment and the use of smart digital devices in order to understand and analyse the statistical differences which might exist among different groups of respondents. It should be noted that all the completed surveys were gathered in Microsoft Excel and then launched into the Statistical Package for the Social Sciences (SPSS) for statistical calculations. Statistical significance was set at α=0.05 level.
In order to get an overview of the sample structure, interesting findings, and fundamental insights, the first step was to run an exploratory data analysis to get more understanding about the dataset. Next, a descriptive statistical analysis was performed. In other words, means and frequencies were calculated for every socio-demographic and behavioural variable.
Exploratory data analysis. In the beginning, a normality test was run with the aim of verifying whether the dataset follows a normal distribution. The analysis reveals that the data gathered through the specially designed survey is not normal. Although many

19
of the variables for this study have skewness and kurtosis within the acceptable range of -1.96 to 1.96 (see Table 2 below for the descriptive statistics of the variables), they have Shapiro-Wilk values that are below the threshold of 0.05, which means that we cannot reject the assumption that the distribution of the dataset is not normal (see Appendix: Table A1). Since the aim of this research is to identify whether there are differences between distinct groups, non-parametric tests such as the Mann-Whitney U test and the Kruskal-Wallis H test would be appropriate.
Non-parametric tests. The Mann-Whitney U test is a non-parametric test used to check whether two samples can be from the same group. Some researchers consider this test as a comparison of the medians between the two groups (LaMorte, 2017). In this study, the Mann-Whitney U test was used to see if there are differences between genders, marital status, and employment status because this test can be used only for two groups. As a consequence, the Mann-Whitney U test showed interesting results of the data between males and females, between single and non-single, and between employed and unemployed, which will be shown and analysed later.
The Kruskal-Wallis H test is another non-parametric test for verifying the equality of the medians of different groups; i.e. to verify that these groups come from the same population (Laerd statistics, n.d.). This test can be used for two or more groups. In this thesis, the Kruskal-Wallis H test was run to discover if there were statistically considerable differences among people with a different income bracket, age bracket, and education level. In the following part, the results will be shown.

20
Chapter 4: Findings Descriptive statistics
The sample distribution associated with the respondents’ demographic characteristics can be found in Table 1. Overall, 56.7% of the participants who answered the survey are males, while the other 43.3% comprise females respondents. The largest group of the sample is in the age between 31 and 40 years old, which had 50 answers (26.7%). Most of the participants have an education level which is higher than a high-school degree. 44.4% of them have a bachelor degree while 31% of the respondents have a graduate degree. Following that, 64.2% of the people who answered the questionnaire are employed while the rest of the participants are students (which means that they have no job), thus they are unemployed, or they are already retired. It follows that 34.8% of the respondents have an income of less than €20.000. Lastly, considering the marital status, 50.3% of the sample are married while the rest are single or divorced.
Table 1 Sample Distribution
Frequency Percentage
Motive
Reasons of going to the gym
Health 151 80.70%
Get in shape 81 43.30%
Disconnect 52 27.80%
Meet people 86 46.00%
Preferences
Gym chain Metropolitan 37 19.80%
GoFit 35 18.40%
McFit 31 16.60%
Dir 29 15.70%
AnytimeFitness 21 11.40%
DreamFit 19 10.30%
Holmes Place 15 7.80%
Consider the type of Yes 124 66.30%

21
equipment
No 63 33.70%
Activities
Frequency of training Once a week 59 31.50%
More than once a week 86 46.00%
Daily 42 22.50%
Equipments used in training
Cardio 70 37.40%
Functional or flexibility 48 25.70%
Strength 69 36.90%
Awareness
Presence of Technogym products
Yes 119 63.60%
No 68 36.40%
Improvement in gym equipment
1 (Strongly disagree) 3 1.60%
2 10 5.30%
3 42 22.50%
4 77 41.20%
5 (Strongly agree) 55 29.40%
Smart devices or app utility
1(Strongly disagree) 2 1.10%
2 9 4.80%
3 27 14.40%
4 72 38.50%
5 (Strongly agree) 77 41.20%
Furthermore, the respondents’ behavioural elements are analysed. The information gathered shows that the most commonly used fitness chain is Metropolitan (19.8%). Furthermore, people who go to the gym are mostly going because they wanted to be healthy (80.7%); moreover, other common reasons are meeting people, getting in shape
22
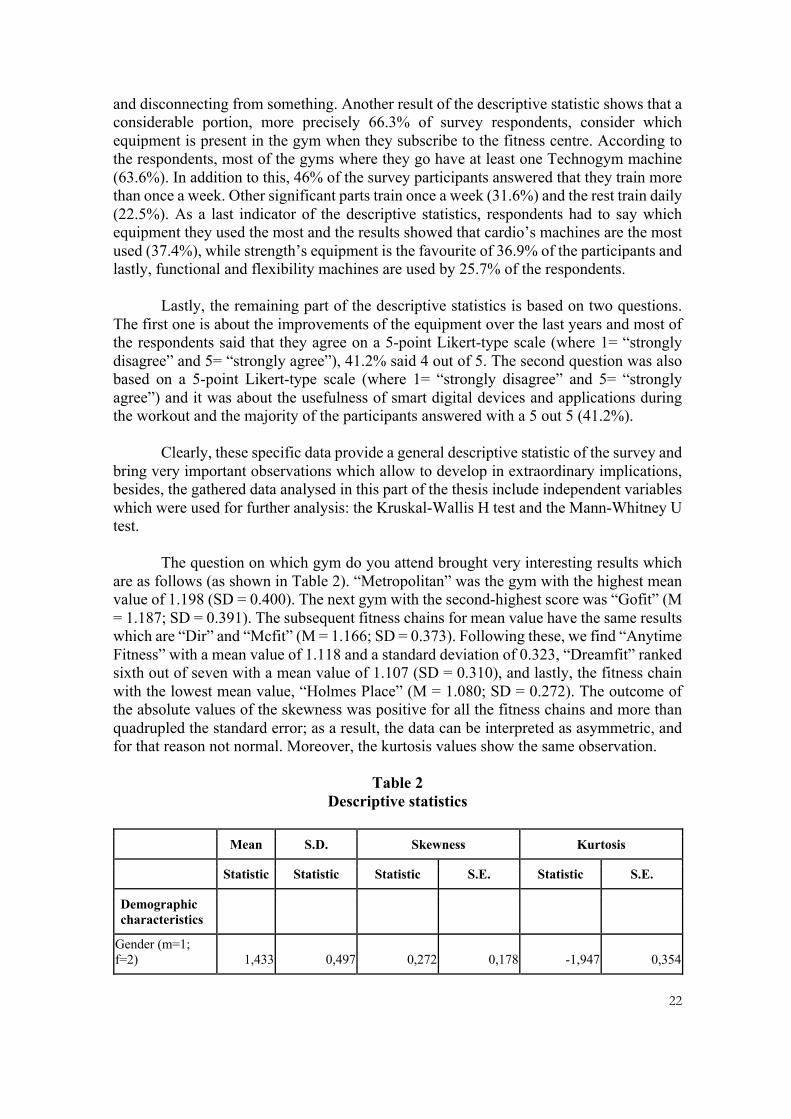
and disconnecting from something. Another result of the descriptive statistic shows that a considerable portion, more precisely 66.3% of survey respondents, consider which equipment is present in the gym when they subscribe to the fitness centre. According to the respondents, most of the gyms where they go have at least one Technogym machine (63.6%). In addition to this, 46% of the survey participants answered that they train more than once a week. Other significant parts train once a week (31.6%) and the rest train daily (22.5%). As a last indicator of the descriptive statistics, respondents had to say which equipment they used the most and the results showed that cardio’s machines are the most used (37.4%), while strength’s equipment is the favourite of 36.9% of the participants and lastly, functional and flexibility machines are used by 25.7% of the respondents.
Lastly, the remaining part of the descriptive statistics is based on two questions. The first one is about the improvements of the equipment over the last years and most of the respondents said that they agree on a 5-point Likert-type scale (where 1= “strongly disagree” and 5= “strongly agree”), 41.2% said 4 out of 5. The second question was also based on a 5-point Likert-type scale (where 1= “strongly disagree” and 5= “strongly agree”) and it was about the usefulness of smart digital devices and applications during the workout and the majority of the participants answered with a 5 out 5 (41.2%).
Clearly, these specific data provide a general descriptive statistic of the survey and bring very important observations which allow to develop in extraordinary implications, besides, the gathered data analysed in this part of the thesis include independent variables which were used for further analysis: the Kruskal-Wallis H test and the Mann-Whitney U test.
The question on which gym do you attend brought very interesting results which are as follows (as shown in Table 2). “Metropolitan” was the gym with the highest mean value of 1.198 (SD = 0.400). The next gym with the second-highest score was “Gofit” (M = 1.187; SD = 0.391). The subsequent fitness chains for mean value have the same results which are “Dir” and “Mcfit” (M = 1.166; SD = 0.373). Following these, we find “Anytime Fitness” with a mean value of 1.118 and a standard deviation of 0.323, “Dreamfit” ranked sixth out of seven with a mean value of 1.107 (SD = 0.310), and lastly, the fitness chain with the lowest mean value, “Holmes Place” (M = 1.080; SD = 0.272). The outcome of the absolute values of the skewness was positive for all the fitness chains and more than quadrupled the standard error; as a result, the data can be interpreted as asymmetric, and for that reason not normal. Moreover, the kurtosis values show the same observation.
Table 2 Descriptive statistics
Mean S.D. Skewness Kurtosis
Statistic Statistic Statistic S.E. Statistic S.E.
Demographic characteristics
Gender (m=1; f=2) 1,433 0,497 0,272 0,178 -1,947 0,354

23
Marital status (not single = 1; single = 2) 1,497 0,501 0,011 0,178 -2,022 0,354
Employment status (not employed = 1; employed = 2) 1,642 0,481 -0,596 0,178 -1,663 0,354
Level of income 2,642 1,601 0,633 0,178 -0,739 0,354
Age 3,048 1,241 -0,024 0,178 -0,980 0,354
Level of education 3,904 1,038 -0,914 0,178 0,162 0,354
Motives
Reasons for going to the gym
Health 1,807 0,395 -1,572 0,178 0,477 0,354
Get in shape 1,433 0,497 0,272 0,178 -1,947 0,354
Disconnect 1,278 0,449 0,999 0,178 -1,014 0,354
Meet people 1,460 0,500 0,162 0,178 -1,995 0,354
Preferences
Gym chain
Anytime fitness 1,118 0,323 2,393 0,178 3,765 0,354
Dir 1,166 0,373 1,812 0,178 1,297 0,354
Dreamfit 1,107 0,310 2,564 0,178 4,624 0,354
Gofit 1,187 0,391 1,617 0,178 0,622 0,354
Holmes place 1,080 0,272 3,116 0,178 7,793 0,354
Mcfit 1,166 0,373 1,812 0,178 1,297 0,354
Metropolitan 1,198 0,400 1,529 0,178 0,342 0,354
Consider the type of equipment 1,663 0,474 -0,696 0,178 -1,532 0,354
Activities
Frequency of training 1,909 0,731 0,143 0,178 -1,111 0,354
Equipment used in training
Cardio 1,374 0,485 0,524 0,178 -1,745 0,354
Functional or flexibility 1,257 0,438 1,123 0,178 -0,747 0,354

24
Strength 1,369 0,484 0,547 0,178 -1,719 0,354
Awareness
Presence of Technogym products 1,636 0,482 -0,572 0,178 -1,692 0,354
Improvement in gym equipment 3,914 0,935 -0,705 0,178 0,267 0,354
Smart devices or applications utility 4,139 0,911 -1,013 0,178 0,742 0,354
The factors why people go to the gym were analysed with descriptive statistics. Among the four motivational factors, “health” is the one with the highest mean value (M = 1.807; SD = 0.395). The second aspect with highest score was “meet people” (M = 1.460; SD = 0.500); subsequently there was “get in shape” (M = 1.433; SD = 0.497) which was ranked third as motive and lastly, there was “disconnect from something” with a mean score of 1.278 (SD = 0.449). In the same way as the gym chains, also the reasons why people go to the gym have been skewed, however, in this case, skewness values were positive (except “health” which was negative). Likewise, kurtosis values were negative (except “health” which was positive) and this also showed that the data are not normal and are not symmetric.
Respondents had to choose which kind of gym equipment they use the most and according to descriptive statistics, these are the results. “Cardio” is the group of machines with the highest mean value which is 1.374 (SD = 0.485). The subsequent highest score is the “strength” with a mean value of 1.369 (SD = 0.484). Finally, the equipment with the lower mean is the “functional and flexibility” one (M = 1.257; SD = 0.438). Likewise, these results have been skewed and they were all positive, but they were much higher than the standard error which means that they were asymmetric. Furthermore, the kurtosis values were negative, and they supported the insight.
In the same way, two more questions are analysed using descriptive statistics. On one hand, the awareness of the improvement of gym equipment has a mean value of 3.914 (SD = 0.935) while on the other hand, the usefulness of smart digital devices and applications during the training has a mean value of 4.139 (SD = 0.911). As a confirmation, that the data were not normal, the data have been skewed and the results were for both answers negative and much higher than the standard error. Moreover, the kurtosis were for the two questions positive and showed that they were asymmetric. Testing the hypotheses
Table 3 shows a summary of the results. It is very clear that the motive for going to the gym is partially supported by all the consumer groups. This means that just some of the reasons for going to the gym support the hypotheses. Moreover, moving to the preferences and looking at the fitness chains, most of the consumer groups are not supported besides for educational level which is partially supported. In addition to this, all

25
of the groups support the consideration of the equipment. Furthermore, the activities are divided into two questions: the first one is partially supported by all besides the marital status which does not, and the second is rejected by all the consumer groups. Lastly, looking at the awareness of the consumers, the table highlights that just at the educational level and the presence of Technogym equipment is supported. Moreover, employment and age are the two consumer groups which provide support for the difference in becoming aware of the improvement of the gym equipment. Besides, the last dimension about the usefulness of digital devices and applications is supported by income brackets and age.
Table 3 Matrix of whether there are differences on consumer groups
Gender Marital
status Employment
status Income Age Education
level
Motive
Reasons of going to the gym
Partial Partial Partial Partial Partial Partial
Preferences
Gym chain No No No No No Partial
Consider the type of equipment
Yes Yes Yes Yes Yes Yes
Activities
Equipments used in training
Partial No Partial Partial Partial Partial
Frequency of training
No No No No No No
Awareness
Presence of Technogym products
No No No No No Yes
Improvement in gym equipment
No No Yes No Yes No
Smart device No No No Yes Yes No

26
or application utility
The Mann-Whitney U test was run for the first hypothesis in order to determine if there were differences between genders about their motives, preferences, activities, and awareness regarding their gym membership. Looking at table 4, it is possible to understand which items support the hypotheses and which not. More specifically, inside of the motives, there are two reasons for going to the gym which support the hypotheses, those are “get in shape” and “meet people” and they have significant results while “health” and “disconnect” do not support. Moving to the next part, it is possible to find the preferences which contain two questions; the first one regarding the fitness chains which does not support the hypotheses while the second one about considering the equipment when subscribing to the gym is supported. Moreover, the items analysed in the activities show in two types of gym machines (“cardio” and “strength”) are consistent and supported. In the last part, among the items used for awareness, none of them supported the hypotheses. Ranks of the test are in the Appendix: Table A2.
Table 4 Mann-Whitney Test for Gender
Wilcoxon W Z Asymp. Sig. (2-tailed)
Motives
Reasons for going to the gym
Health 9721,5 -0,968 0,333
Get in shape 6390,5 -3,887 0,000***
Disconnect 9639 -1,142 0,254
Meet people 9146 -2,584 0,010**
Preferences
Gym chain
Anytime fitness 9826,5 -0,672 0,502
Dir 7480,5 -0,565 0,572
Dreamfit 9839 -0,637 0,524
Gofit 7599 -0,061 0,952
Holmes place 9917 -0,272 0,785
Mcfit 9817 -0,622 0,534
Metropolitan 7518 -0,379 0,704
Consider the type of equipment 5677,5 -6,450 0,000***

27
Activities
Frequency of training 7424,5 -0,557 0,577
Equipment used in training
Cardio 8591,5 -4,464 0,000***
Functional or flexibility 9664 -1,081 0,280
Strength 5941,5 -5,456 0,000***
Awareness
Presence of Technogym products 7189 -1,391 0,164
Improvement in gym equipment 7257 -1,030 0,303
Smart devices or app utility 9732 -0,678 0,498
*** significant at 0.01 ** significant at 0.05 * significant at 0.10
The Mann-Whitney U test is used for the second hypothesis to test whether there are differences between marital status about their motives, preferences, activities, and awareness regarding their gym membership. Looking at the hypothesis about differences between single and non-single (see table 5 below and table A3 in the appendix), there are four different reasons for going to the gym. However, just “disconnect” and “meet people” among them are consistent and support the hypotheses while the “health” and “get in shape” do not. Additionally, in the preferences, the gym chains do not support while the consideration of equipment has significant results and supports the hypotheses. In addition, none of the items analysed in the activities, which include frequency of training and favourite gym equipment support the hypotheses. As well as that, in the awareness of consumer behaviour, none of the three variables support the hypotheses made for marital status.
Table 5 Mann-Whitney Test for Marital Status
Wilcoxon W Z Asymp. Sig. (2-tailed)
Motives
Reasons for going to the gym
Health 8359 -1,515 0,130

28
Get in shape 8622 -0,378 0,706
Disconnect 7913,5 -2,885 0,004***
Meet people 7412 -4,457 0,000***
Preferences
Gym chain
Anytime fitness 8643,5 -0,932 0,351
Dir 8609,5 -0,556 0,578
Dreamfit 8831 -0,025 0,980
Gofit 8593,5 -0,97 0,332
Holmes place 8605,5 -0,784 0,433
Mcfit 8688 -0,621 0,535
Metropolitan 8611 -0,513 0,608
Consider the type of equipment 8118,5 -2,058 0,040**
Activities
Frequency of training 8821 -0,044 0,965
Equipment used in training
Cardio 8631,5 -0,659 0,510
Functional or flexibility 8193 -1,961 0,050
Strength 8491,5 -1,114 0,265
Awareness
Presence of Technogym products 8725 -0,055 0,956
Improvement in gym equipment 8650 -0,263 0,793
Smart devices or app utility 8723 -0,055 0,956
*** significant at 0.01 ** significant at 0.05 * significant at 0.10
The last Mann-Whitney U test was used for employment status in order to test if people with different employment status are more likely to have different behaviours regarding their gym membership. As it is shown at table 6 (and in the Appendix table A4) in the motives for people to go to the gym, there are two items which support the

29
hypotheses because they have consistent and significant results; these reasons are “health” and “disconnect”. However, “get in shape” and “meet people” do not support the hypotheses. Moreover, in the preferences of the customers, it is possible to highlight that the gym chains do not have meaningful results while the consideration of gym equipment has a consistent result, therefore it supports the hypotheses. Furthermore, in the activities, only one of the equipment used in training has a significant result (“strength”), and so it supports the hypotheses. Nevertheless, the other items and the frequency of training do not support. Lastly, in the awareness of customers, there are three variables, but just the improvement of gym machines have considerable results for the hypotheses.
Table 6 Mann-Whitney Test for Employment Status
Wilcoxon W Z Asymp. Sig. (2-tailed)
Motives
Reasons for going to the gym
Health 5821 -1,968 0,049**
Get in shape 5922 -1,234 0,217
Disconnect 5678 -2,251 0,024**
Meet people 10701,5 -1,888 0,059
Preferences
Gym chain
Anytime fitness 11175,5 -0,528 0,598
Dir 6288 -0,044 0,965
Dreamfit 6095,5 -1,066 0,286
Gofit 6154 -0,601 0,548
Holmes place 5982,5 -1,89 0,059
Mcfit 11009,5 -1,183 0,237
Metropolitan 11117 -0,666 0,506
Consider the type of equipment 5697 -2,068 0,039**
Activities
Frequency of training 11072,5 -0,63 0,528
Equipment used in training
Cardio 10820 -1,546 0,122
Functional or 11018 -0,976 0,329

30
flexibility
Strength 5576 -2,434 0,015**
Awareness
Presence of Technogym products 5864,5 -1,466 0,143
Improvement in gym equipment 5520 -2,319 0,020**
Smart devices or app utility 5814 -1,462 0,144
*** significant at 0.01 ** significant at 0.05 * significant at 0.10
The Kruskal-Wallis H test was run for the fourth hypothesis to determine if there were differences between people in different income brackets about their motives, preferences, activities, and awareness regarding their gym membership. Looking at table 7 (and table A5 in the Appendix), there are shown the results of the test. Firstly, in the motives, there are three items out of four (“health”, “disconnect” and “meet people”), which have significant results and support the hypotheses. Secondly, in the preferences of the respondents, there are no meaningful results in the fitness chains; while the consideration of gym equipment when subscribing has important results which support the hypotheses. Following that, in the activities, the frequency of training has not scored in a considerable way. Moreover, one of the three items of the equipment used during training has a significant result (“functional and flexibility”). However, “cardio” and “strength” do not support it. Lastly, in the consumer's awareness, the usefulness of smart digital devices and applications during the workout scored in a considerable manner and so it supports the hypotheses. The other two questions about the improvement of gym products and the presence of Technogym equipment do not support the hypotheses.
Table 7 Kruskal-Wallis Test for Income Brackets
Chi-Square df Asymp. Sig.
Motives
Reasons for going to the gym
Health 11,455 5 0,043**
Get in shape 8,271 5 0,142
Disconnect 13,113 5 0,022**
Meet people 12,035 5 0,034**

31
Preferences
Gym chain
Anytime fitness 3,771 5 0,583
Dir 1,803 5 0,876
Dreamfit 9,49 5 0,091
Gofit 3,081 5 0,687
Holmes place 5,822 5 0,324
Mcfit 3,197 5 0,670
Metropolitan 6,892 5 0,229
Consider the type of equipment 17,825 5 0,003***
Activities
Frequency of training 2,468 5 0,781
Equipment used in training
Cardio 3,683 5 0,596
Functional or flexibility 12,364 5 0,030**
Strength 4,838 5 0,436
Awareness
Presence of Technogym products 3,528 5 0,619
Improvement in gym equipment 8,01 5 0,156
Smart devices or app utility 12,742 5 0,026**
*** significant at 0.01 ** significant at 0.05 * significant at 0.10
For the next hypothesis, the Kruskal-Wallis H test was run in order to determine if there were differences between people in different age brackets about their motives, preferences, activities, and awareness regarding their gym membership. Table 8 and table A6 in the Appendix show the results of the test. Analysing the outcome of this test it is possible to understand that in the motives for going to the gym, “get in shape” and “meet people” have significant results which support the hypotheses. On the other hand, “health” and “disconnect” do not show any meaningful result. Moving to the preferences of consumers, there are no fitness chains which show considerable results and there support the hypotheses. However, the next part about the consideration of equipment when

32
subscribing to the gym has significant results which are supporting the hypotheses. Furthermore, in the activities, the frequency of training does not show important results. Despite that, looking at the favourite equipment used at the gym “functional and flexibility” and “strength” show remarkable results which support the analysis. In the last part, the awareness of improvement of gym’s equipment and the usefulness of smart digital devices and applications are consistent and have significant scores which support the hypotheses.
Table 8 Kruskal-Wallis Test for Age Brackets
Chi-Square df Asymp. Sig.
Motives
Reasons for going to the gym
Health 8,095 4 0,088
Get in shape 11,48 4 0,022**
Disconnect 6,391 4 0,172
Meet people 32,765 4 0,000***
Preferences
Gym chain
Anytime fitness 1,451 4 0,835
Dir 1,468 4 0,832
Dreamfit 5,826 4 0,213
Gofit 2,499 4 0,645
Holmes place 6,125 4 0,190
Mcfit 6,087 4 0,193
Metropolitan 3,305 4 0,508
Consider the type of equipment 13,621 4 0,009***
Activities
Frequency of training 9,086 4 0,059
Equipment used in training
Cardio 8,787 4 0,067
Functional or flexibility 18,256 4 0,001***
Strength 19,607 4 0,001***

33
Awareness
Presence of Technogym products 3,994 4 0,407
Improvement in gym equipment 11,276 4 0,024**
Smart devices or app utility 39,279 4 0,000***
*** significant at 0.01 ** significant at 0.05 * significant at 0.10
For the last hypothesis, the Kruskal-Wallis H test was run in order to determine if there were differences between people with different education levels about their motives, preferences, activities, and awareness regarding their gym membership. Table 9 and table A7 in the Appendix show the results of the Kruskal- Wallis test. According to the outcome of the test, in the consumer’s motives, just “health” and “disconnect” have a considerable result which supports the hypotheses. However, “get in shape” and “meet people” are not supporting it. Moreover, looking at the preferences of the clients one fitness chain, which is McFit, scored very significantly and as a result, it supports the hypotheses. As well as that, also the consideration of the equipment when subscribing to the gym. On the other hand, none of the other fitness chains has meaningful scores. In addition, in the consumer’s preferences, the frequency of training does not have a considerable result. Furthermore, “strength” is the only item of the type of gym equipment which has a consistent score and supports the hypothesis. Lastly, the awareness of having Technogym’s equipment is the last item which has a meaningful result which supports the hypotheses.
Table 9 Kruskal-Wallis Test for Education Level
Chi-Square df Asymp. Sig.
Motives
Reasons for going to the gym
Health 13,324 4 0,010**
Get in shape 7,015 4 0,135
Disconnect 15,551 4 0,004***
Meet people 9,28 4 0,054
Preferences
Gym chain
Anytime fitness 1,779 4 0,776

34
Dir 1,697 4 0,791
Dreamfit 0,711 4 0,950
Gofit 3,427 4 0,489
Holmes place 2,303 4 0,680
Mcfit 12,257 4 0,016**
Metropolitan 1,334 4 0,856
Consider the type of equipment 20,266 4 0,000***
Activities
Frequency of training 3,333 4 0,504
Equipment used in training
Cardio 7,836 4 0,098
Functional or flexibility 7,519 4 0,111
Strength 11,793 4 0,019**
Awareness
Presence of Technogym products 9,872 4 0,043**
Improvement in gym equipment 7,922 4 0,094
Smart devices or app utility 6,134 4 0,189
*** significant at 0.01 ** significant at 0.05 * significant at 0.10

35
Chapter 5: Summary, Conclusions, and Recommendations
The gathered data and the characteristics of this study’s sample demonstrated some similarities between the different gym’s client profile and the ones described by the preceding existing reports and researchers (Higgins, 2011; Green, n.d.; Longhi & Taylor, 2011). The typical gym’s customer has a university degree, is single and most likely employed. The findings of this research also partially support the hypotheses made at the beginning of the thesis. The presence of males at the gym is slightly higher compared to females. Furthermore, most of the people who go to the gym have an age between 31 and 40 years old. Moreover, the majority of the customers attend the gym because they want to have a healthy lifestyle. Apart from this, the choice of the gym is very personal and depends on many factors such as price, type of gym, and the average age of clients. Besides, most of the clients consider which equipment the gym has when they subscribe and they do realize that most of their gyms have Technogym equipment. The typical client usually trains more than once a week and mostly uses cardio and strength machines. Lastly, customers recognize that the gym’s products are improving over the last years and that the usage of smart digital devices and applications during training are useful and can improve the way we train.
The central part of the research was divided into four different sections. The first one explained briefly the overall results of the survey. Moreover, to be more specific, this part was looking at how the survey was made and highlighted how it was conducted, assuring the verification process of participants. Furthermore, it contained the explanation of how the data were gathered for this study. Following that, in the second section, there was a detailed explanation of the structure of the questionnaire and its variables. Here, it is shown the whole process followed in order to get to the final version of the survey which was then sent to potential participants.
In the third part, the analysis of the data is demonstrated and for this specific thesis
a quantitative method was used. In other words, the quantitative approach is chosen as the best method because it has a good methodology for discovering statistical differences and making comparisons (Given, 2008; Newland & Aicher, 2018). Lastly, since the study tests three different hypotheses: one based on gender, one on marital status, one on employment status, one on income brackets, one on age brackets, and one on education level, this part contains the exploratory data analysis.
For the three hypotheses, descriptive statistics were analysed, taking into account
mean, standard deviation, skewness and kurtosis. Moreover, a t-test was performed but since the data was not normal, instead of using a normal parametric t-test, non-parametric tests had to be performed. The Mann-Whitney U test was used for the first three hypotheses, while the Kruskal Wallis H test was used for the last three ones (LaMorte, 2017; Laerd statistics, n.d.).
The following part analyses the descriptive statistics of the gathered data through the specially designed survey. Overall, it is shown that the main reason why people go to the gym is because of health (M = 1.807), which aligns with previously done researchers (Andreasson & Johansson, 2014; Dale, Godinet, Kearse, & Field, 2009; Elmagd, 2016;

36
Panasenko, Nikishin, Mayorova, Boris, & Murtuzalieva, 2018). Similarly, other motivational factors such as meeting people and getting in shape also showed high scores, as it was also recognized in some previous studies (Bădicu & Balint, 2016; Green, n.d.; Jones, 1998).
Another implication suggested by the literature that this research supports is that
many companies are launching new applications and smart digital devices. This is because people actually use them during their workout and think that they are useful, therefore in this study it scored high (Khalaf, 2014; Park, Yoo, Kim, & Lee, 2018). Furthermore, as it was highlighted in the literature and confirmed in this research, the gym’s products changed a lot over the last years and this is due to the development of new technologies and new materials; as a result, people do recognize the differences between old and new equipment (Andreasson & Johansson, 2014).
Moreover, looking at the descriptive statistics, there were statistically significant differences between diverse groups of respondents based on which gym they attended and variables such as gender, marital status and employment status. The results showed that males and females prefer different fitness chains; for instance, at Metropolitan there are more males than females and this might be because it is a premium club with spa and with quite a high average age. However, at Anytime Fitness there are more females than males and this is because this gym is open 24/7 and females with children and a job, have the necessity of a gym which is always open. Following that, it was empirically supported that respondents with a different employment status have different preferences on which gym they attend. In other words, it was found that employed people prefer DreamFit, while unemployed McFit. This might be because of the prices of the two gyms, where the first one is expensive while the second one is very cheap. Lastly, the results showed differences between single and non-single. For this reason, single people preferred GoFit while married preferred Dir, which is a gym with many families.
The Mann-Whitney U test and the Kruskal-Wallis H tests were performed for the six hypotheses tested in this research. The results highlighted important statistical differences between distinct groups of participants and these results showed that some hypotheses were supported while others were not. The first three hypotheses were tested with the Mann-Whitney U test, while the last three with the Kruskal-Wallis H test.
The first hypothesis used gender as variable and what came out is that males and females differed in some choices as it was identified in previous studies (Bender, 1976; Higgins, 2011). For instance, motivational factors, considering equipment when subscribing to a gym and preferences of type of gym machines are all variables which support the hypothesis. Furthermore, for the second hypothesis, it was empirically supported in the literature that single and non-single spent money differently and had contrasting preferences (Rana, 2017). As a result, this study confirms what was suggested in the literature of other studies and the hypothesis can be applied to variables such as the reason why they go to the gym and consideration of the equipment that a gym has. Moreover, for the third hypothesis, another implication was recommended in the literature and confirmed in this thesis which was about the differences between employed and unemployed people (Longhi & Taylor, 2011). Hence, variables like motivational factors, consideration of the gym equipment, preference of the type of gym products and seeing improvement in gym’s machines were all supporting the hypothesis.

37
Looking at the fourth hypothesis it was empirically supported in the literature review that people in different income brackets have different motivations for life satisfaction (Salinas-Jiménez, Artés, & Salinas-Jiménez, 2010). Therefore, this thesis validates that what was previously analysed and that the hypothesis can be applied to consumer behaviours such as motives for going to the gym, consideration of the gym equipment and awareness of the usefulness of smart digital devices and applications. Moreover, for the fifth hypothesis another suggestion which was recommended in the literature and confirmed in this study, was about the differences between people in different age brackets. For instance, younger people have diverse preferences in the workplace than older ones (Rothe, Lindholm, Hyvönen, & Nenonen, n.d.). Hence, variables like reasons for going to the gym, consideration of the equipment when subscribing to the gym, most used types of gym products, awareness of the improvement of gym’s machines and usefulness of digital devices during the workout were all supporting the hypothesis. Finally, for the last hypothesis, it was empirically supported in the literature that people with different education levels have a different perception of a good life and happiness (Eckhardt, 2017; Hartog & Oosterbeek, 1988). As a result, motivational factors, considering equipment when subscribing to a gym, favourite type of gym product and awareness of the presence of Technogym in the gym are all variables which support the hypothesis.
On the contrary, not every hypothesis was supported because the scores between the groups were not significant. Such information suggests that not every consumer behaviour can be attributed to demographic characteristics. Moreover, there might be other explanations which could affect the results that were not taken into account in this research.
In conclusion, this thesis wants to show how digitalization has evolved in the fitness industry and highlight how consumer behaviour is affected. In other words, it is crucial to be aware that new technologies are changing our world and we live this process every day (Ilcus, 2018). Moreover, the behaviour of the clients has changed in the last years and this has increased their awareness of the usefulness of smart digital devices and applications. Lastly, this paper can be used by Technogym as a customer’s market research because innovation and digitalization are one of their core pillars and an analysis of the Spanish market can be useful for them.
Limitations and future research
Although the results of this thesis bring significant insights, the researcher must acknowledge different limitations of the research that point to areas for other research in the future. Following that, the purposive selection of the variables is not random. Firstly, not every single variable which might highlight differences among the groups are brought to light; this is why other studies in the future could examine different parts of the variables.
Secondly, a quantitative survey presents other potential limitations to the outcome of the thesis such as the fact that participants could not express their exact motivational reasons and so something might be excluded from the results. However, future analyses also could include other facets such as physical capabilities or budget to spend for the gym membership. Further research could look at other several contextual factors such as

38
personal training which might have a very strong effect on the relationships studied in this research.
Thirdly, it is plausible that each country has different factors such as cultural, economic, or political aspects and that these might also affect the choices of the gym’s clients and their habits. Therefore, it would be good to see the results of the survey also in other parts of the world, especially in countries with a different level of economic development such as emerging and developing countries.
Lastly, the COVID-19 pandemic had an impact on the thesis and was definitely an important limitation for this thesis. In other words, the virus made me change the researcher’s initial plans of interviewing people who work within the fitness industry because they had more pressing issues to deal with given the extremely challenging circumstances. In addition, being from one of the worst-hit countries in the world, the researcher has realised how several of the survey responses might have been affected by this global emergency. In normal times, the researcher would have obtained a much bigger response rate adding greater insights on the results collected. Concluding remark
Technogym’s CEO Nerio Alessandri previously stated in an interview with Business Insider Italia that:
"When everyone was talking about bodybuilding, we were carrying on the idea of Fitness. When others began to embrace Fitness, we launched Wellness. While our competitors were making mechanical equipment, we were experimenting with electronics and monitors in front of treadmills.
We were the first in the world to introduce electronics into gym machines. The first to put the heartbeat on a display, the first to combine entertainment by showing TV, the first to connect machines to the Internet, the first to develop software to connect gyms. We have also created content, for example an App that works like a virtual trainer: it keeps in memory the results of training and can share them with friends in a social network dedicated to those who use our machines" (Tognini, 2018).
The study highlights and provides information about Spanish gym members’
profiles and motivational drivers, preferences, activities, and awareness of their gym membership. Consequently, such information might be useful for fitness firms in order to have an overall understanding of the gym’s clients. As well as that, people can use this research to understand which people go to a specific fitness chain and moreover, they can realize how useful smart digital devices and applications are during a workout. Moreover, the discovered existing different results between demographic (gender, marital status and employment status) and the independent variables used (reasons why people go to the gym, consideration of the equipment, favourite type of gym machine, etc.) increase knowledge for the fitness marketers. Therefore, they have to be conscious and know the differences between the gym’s groups presented in this study because they need to do specific marketing plans and make decisions. In conclusion, considering this study’s findings, there are presented data which were not available in the gym field before.

39
References Addolorato, S., García-Fernández, J., Gallardo, L., & García-Unanue, J. (2020). An
overview of the origins and effectiveness of commercial fitness equipment and sectoral corporate settings: A critical review of literature. MDPI, 1–19. Retrieved from https://www.mdpi.com/2076-3417/10/4/1534/htm
Algar, R., Bose, R., Harting, A., Huete, L., Middelkamp, J., O’Rourke, B., & Rutgers, H.
(2017). Customer engagement and experience in the fitness sector. (J. Middelkamp & H. Rutgers, Eds.) (1st ed.). ’s-Hertogenbosch, The Netherlands: BlackBoxPublishers.
Andreasson, J., & Johansson, T. (2014). The Fitness Revolution. Historical
Transformations in the Global Gym and Fitness Culture. Sport Science Review, 23(3–4), 91–112. https://doi.org/10.2478/ssr-2014-0006
Bădicu, G., & Balint, L. (2016). The importance sports activities have over the quality of
life in the adult population. Journal of social science research, 10(1), 2003–2006. https://doi.org/10.24297/jssr.v10i1.6601
Beltz, N., & Korzan, L. (2019). Selecting the right fitness facility for you. Retrieved from
https://www.acsm.org/docs/default-source/files-for-resource-library/selecting-the-right-fitness-facility.pdf?sfvrsn=234d6f96_4
Bender, A. (1976). Food preferences of males and females. Proceedings of the Nutrition
Society, 35(2), 181-189. https://doi.org/10.1079/PNS19760031 Cashin, J., & Ifinedo, P. (2014). Using social cognitive theory to understand employees’
counterproductive computer security behaviors (CCSB): A pilot study. Retrieved from https://bit.ly/3fKNj8h
Choi, J. H., Park, D. J., & Roh, K. Y. (2015). The effect of attributes of exercise/fitness apps on app usage: A convergence perspective based on the self-determination theory. Journal of Digital Con- vergence, 13(6), 327–339. https://doi.org/10.14400/JDC.2015.13.6.327
Croon Fors, A. (2012). Handbook of Research on Technoself (Vol. 1). Retrieved from https://bit.ly/2UGDeiV
Dale, S., Godinet, S., Kearse, N., & Field, D. A. (2009). The future of fitness. Retrieved
from http://www.chirotractor.com/downloads/thefutureoffitness.pdf

40
Davis, T. (2018). Fitness on purpose: Brigadoon Fitness builds its business around the ideal customer experience. Business People, 31(4), 42–46. Retrieved from https://web.a.ebscohost.com/ehost/pdfviewer/pdfviewer?vid=13&sid=28b3edae-14ba-4820-a0b4-57fde408afc4%40sessionmgr4008
De Vos, N. J., Singh, N. A., Ross, D. A., Stavrinos, T. M., Orr, R., & Fiatarone Singh, M.
A. (2005). Optimal Load for Increasing Muscle Power During Explosive Resistance Training in Older Adults. The Journals of Gerontology Series A: Biological Sciences and Medical Sciences, 60(5), 638–647. https://doi.org/10.1093/gerona/60.5.638
Doğan, C. (2015). Training at the Gym, Training for Life: Creating Better Versions of the
Self Through Exercise. Europe’s Journal of Psychology, 11(3), 442–458. https://doi.org/10.5964/ejop.v11i3.951
Eckhardt, T. (2017). Do people with different educational backgrounds differ in their
description of the aspects belonging to a good life? Retrieved from https://pdfs.semanticscholar.org/97e8/35eb63bd6e5f13e4a829c49a06895af71e7a.pdf
Elmagd, M. A. (2016). Benefits, needs and importance of daily exercise. Retrieved from
https://www.researchgate.net/publication/306118434_Benefits_need_and_importance_of_daily_exercise
Ernst & Young. (2011). The digitisation of everything: How organisations must adapt to
changing consumer behaviour. Retrieved from https://www.academia.edu/23705650/The_digitisation_of_everything_How_organisations_must_adapt_to_changing_consumer_behaviour
Fussell, S. W. (1991). Muscles. The Confession of an Unlikely Bodybuilder. New York,
USA: Scribner’s. Given, L. M. (2008). The Sage Encyclopedia of Qualitative Research Methods (Vol. 2).
Thousand Oaks, Canada: SAGE Publications. Green, J. (n.d.). Why is Fitness Your Passion? Retrieved from
http://www.sagchip.org/fitness/_newsletters/2012/fitnesspassion.pdf
Hartog, J., & Oosterbeek, H. (1998). Health, wealth and happiness: why pursue a higher education?. Economics of Education Review, 17(3), 245-256. Retrieved from http://www.sciencedirect.com/science/article/pii/027277578890043X

41
Higgins, D. (2011). Girls — Why it’s time to train like a bloke. Evening Standard. Retrieved from https://bit.ly/2LhaiKb
Hoberman, J. (2005). Testosterone Dreams: Rejuvenation, Aphrodisia, Doping. Berkeley;
Los Angeles; London: University of California Press. Retrieved from www.jstor.org/stable/10.1525/j.ctt1pncvq
Hu, F. B., Manson, J. E., Stampfer, M. J., Colditz, G., Liu, S., Solomon, C. G., & Willett,
W. C. (2001). Diet, Lifestyle, and the Risk of Type 2 Diabetes Mellitus in Women. New England Journal of Medicine, 345(11), 790–797. https://doi.org/10.1056/nejmoa010492
Hughes, L. M. (2004). Digitizing Collections: Strategic issues for the information
manager. London, United Kingdom: Facet Publishing. Ilcus, M. A. (2018). Impact of Digitalization in Business World. Review of International
Comparative Management, 19(4), 350-358. Jones, D. A. (1998). Moderate Leisure-Time Physical Activity: Who Is Meeting the Public
Health Recommendations? A National Cross-sectional Study. Archives of Family Medicine, 7(3), 285–289. https://doi.org/10.1001/archfami.7.3.285
Kann, L., Kinchen, S. A., Lowry, R., Grunbaum, J. A., & Kolbe, L. J. (1999). Youth Risk
Behavior Surveillance. Retrieved from https://www.cdc.gov/mmwr/preview/mmwrhtml/ss4905a1.htm
Khalaf, S. (2014). Health and Fitness Apps Finally Take Off, Fueled by Fitness Fanatics.
Retrieved from https://flurrymobile.tumblr.com/post/115192181465/health-and-fitness-apps-finally-take-off-fueled#_=_
Laerd statistics. (n.d.). Kruskal-Wallis H Test using SPSS Statistics. Retrieved from
https://statistics.laerd.com/spss-tutorials/kruskal-wallis-h-test-using-spss-statistics.php
LaMorte, W. (2017). Mann Whitney U Test (Wilcoxon Rank Sum Test). Retrieved from
http://sphweb.bumc.bu.edu/otlt/mph-modules/bs/bs704_nonparametric/BS704_Nonparametric4.html
Liu, B. (1975). Quality of Life: Concept, Measure and Results. The American Journal of
Economics and Sociology, 34(1), 1-13. Retrieved from www.jstor.org/stable/3485691
42
Longhi, S., & Taylor, M. (2011). Employed and unemployed job seekers: Are they substitutes? Institute for the Study of Labor. Retrieved from https://www.researchgate.net/publication/46469075
MarketLine. (2017). Gyms, Health & Fitness Clubs in Europe. Retrieved from
https://web.b.ebscohost.com/ehost/pdfviewer/pdfviewer?vid=8&sid=62520af8-3e53-4eea-92bb-c4a997803ad2%40pdc-v-sessmgr01
Melnick, J. M., & Jackson, S. J. (2002). Globalization American-Style and Reference Idol
Selection. International Review for the Sociology of Sport, 37(3–4), 429–448. https://doi.org/10.1177/1012690202037004027
Michel, K. L., Goodson, P., & Pruitt, B. E. (2013). Mr. & Mrs.: A Social Cognitive
Approach to Understanding How the Marital Context Influences Physical Activity. Californian Journal of Health Promotion, 11(2), 73–85. Retrieved from http://www.cjhp.org/Volume11Issue2_2013/documents/73-85_MichelK.pdf
Monaghan, L. F. (2007). McDonaldizing Men’s Bodies? Slimming, Associated
(Ir)Rationalities and Resistances. Body & Society, 13(2), 67–93. https://doi.org/10.1177/1357034x07077776
Newland, B. L., & Aicher, T. J. (2018). Exploring sport participants’ event and destination choices. Journal of Sport & Tourism, 22(2), 131-149. doi:10.1080/14775085.2018.1436464
Nussbaum, M., & Sen, A. (1993). The Quality of Life. Oxford, United Kingdom: Oxford Clarendon Press.
Palco23. (2020) Dossier Los reyes del “fitness.” Retrieved from
https://www.palco23.com/visor-online.php?id=30&name=Dossier+Los+reyes+del+%27fitness%27+2020#1
Panasenko, S. V., Nikishin, A. F., Mayorova, E. A., Boris, O. A., & Murtuzalieva, T. V.
(2018). Innovative Approach to Fitness Industry Development. Retrieved from http://www.revistaespacios.com/a18v39n41/a18v39n41p11.pdf
Park, M., Yoo, H., Kim, J., & Lee, J. (2018). Why do young people use fitness apps?
Cognitive characteristics and app quality. Electronic Commerce Research, 18(4), 755–761. https://doi.org/10.1007/s10660-017-9282-7
Parrot, L. D. (1996). Whose business is fitness? Journal of Health Care Marketing, 16(3),
44–49. Retrieved from

43
https://web.a.ebscohost.com/ehost/pdfviewer/pdfviewer?vid=10&sid=28b3edae-14ba-4820-a0b4-57fde408afc4%40sessionmgr4008
Pine, B. J., & Gilmore, J. H. (2011). The Experience Economy. Boston, Massachusetts:
Harvard Business Press. Rana, S. (2017). Marital Status and Investment Preferences. Online International
Interdisciplinary Research Journal, 07, 91–98. Retrieved from https://www.researchgate.net/publication/321996698
Renner, B., Kwon. S., Yang, B.-H., Paik, K.-C., Kim, S. H., Roh, S., Song, J., &
Schwarzer, R. (2008). Social-cognitive predictors of dietary behaviors in South Korean men and women. International Journal of Behavioral Medicine, 15, 4-13. doi: 10.1007/BF03003068
Rothe, P., Lindholm, A. L., Hyvönen, A., & Nenonen, S. (n.d.). Workplace preferences –
does age make a difference? Retrieved from https://www.irbnet.de/daten/iconda/CIB21523.pdf
Salinas-Jiménez, M. d. M., Artés, J., & Salinas-Jiménez, J. (2010). Income, motivation,
and satisfaction with life: an empirical analysis. Journal of Happiness Studies, 11(6). https://doi.org/10.1007/s10902-010-9185-y
Stampfer, M. J., Hu, F. B., Manson, J. E., Rimm, E. B., & Willett, W. C. (2000). Primary
Prevention of Coronary Heart Disease in Women through Diet and Lifestyle. New England Journal of Medicine, 343(1), 16–22. https://doi.org/10.1056/nejm200007063430103
Technogym. (2019). Technogym Artis Run technical specifications. Retrieved from
https://www.technogym.com/wpress/wp-content/uploads/2019/09/Artis-Run.pdf Tifrea, C., Giosan, A., & Costache, R. (2016). The importance of physical education and
sport in the life of the students of the economy colleges. Annals of the University of Oradea, Economic Science Series., 25(1), 428–434. Retrieved from https://web.a.ebscohost.com/ehost/pdfviewer/pdfviewer?vid=6&sid=28b3edae-14ba-4820-a0b4-57fde408afc4%40sessionmgr4008
Tognini, M. 2018. L’importanza di essere romagnoli: la lezione di intraprendenza
imprenditoriale di Nerio Alessandri e della sua Technogym. Business Insider Italia. Accessed: May 17, 2020.

44
Trost, S. G., Pate, R. R., Sallis, J. F., Freedson, P. S., Taylor, W. C., Dowda, M., & Sirard, J. (2002). Age and gender differences in objectively measured physical activity in youth. Medicine and Science in Sports and Exercise, 34(2), 350–355. https://doi.org/10.1097/00005768-200202000-00025
Vuori, I. (1995). Exercise and Physical Health: Musculoskeletal Health and Functional
Capabilities. Research Quarterly for Exercise and Sport, 66(4), 276–285. https://doi.org/10.1080/02701367.1995.10607912
Wilmore, J. H., & Knuttgen, H. G. (2003). Aerobic Exercise and Endurance. The
Physician and Sportsmedicine, 31(5), 45–51. https://doi.org/10.3810/psm.2003.05.367

45
Appendices
Table A1
Test of Normality
Kolmogorov-Smirnov Shapiro-Wilk
Statistic df Sig. Statistic df Sig.
Demographic characteristics
Gender (m=1; f=2) 0,375 187 0,000 0,630 187 0,000
Marital status (not single = 1; single = 2) 0,342 187 0,000 0,636 187 0,000
Employment status (not employed = 1; employed = 2) 0,414 187 0,000 0,607 187 0,000
Level of income 0,195 187 0,000 0,863 187 0,000
Age 0,158 187 0,000 0,913 187 0,000
Level of education 0,291 187 0,000 0,826 187 0,000
Motives
Reasons for going to the gym
Health 0,494 187 0,000 0,481 187 0,000
Get in shape 0,375 187 0,000 0,630 187 0,000
Disconnect 0,454 187 0,000 0,560 187 0,000
Meet people 0,361 187 0,000 0,634 187 0,000
Preferences
Gym chain
Anytime fitness 0,524 187 0,000 0,375 187 0,000
Dir 0,506 187 0,000 0,448 187 0,000
Dreamfit 0,528 187 0,000 0,355 187 0,000
Gofit 0,497 187 0,000 0,475 187 0,000
Holmes place 0,536 187 0,000 0,301 187 0,000

46
Mcfit 0,506 187 0,000 0,448 187 0,000
Metropolitan 0,492 187 0,000 0,487 187 0,000
Consider the type of equipment 0,425 187 0,000 0,597 187 0,000
Activities
Frequency of training 0,234 187 0,000 0,807 187 0,000
Equipment used in training
Cardio 0,405 187 0,000 0,613 187 0,000
Functional or flexibility 0,464 187 0,000 0,544 187 0,000
Strength 0,408 187 0,000 0,611 187 0,000
Awareness
Presence of Technogym products 0,411 187 0,000 0,609 187 0,000
Improvement in gym equipment 0,242 187 0,000 0,856 187 0,000
Smart devices or applications utility 0,239 187 0,000 0,810 187 0,000

47
Table A2
Ranks by Gender
Gender
(m - 1; f - 2) N Mean Rank Sum of Ranks
anytimefitness 1 106 92,7 9826,5
2 81 95,7 7751,5
Total 187
dir 1 106 95,26 10097,5
2 81 92,35 7480,5
Total 187
dreamfit 1 106 92,82 9839
2 81 95,54 7739
Total 187
gofit 1 106 94,14 9979
2 81 93,81 7599
Total 187
holmesplace 1 106 93,56 9917
2 81 94,58 7661
Total 187
mcfit 1 106 92,61 9817
2 81 95,81 7761
Total 187
metropolitan 1 106 94,91 10060
2 81 92,81 7518
Total 187
health 1 106 91,71 9721,5
2 81 96,99 7856,5
Total 187
getinshape 1 106 105,54 11187,5
2 81 78,9 6390,5
Total 187
disconnect 1 106 90,93 9639
2 81 98,01 7939
Total 187
meetpeople 1 106 86,28 9146

48
2 81 104,1 8432
Total 187
considerequip 1 106 112,27 11900,5
2 81 70,09 5677,5
Total 187
technoequip 1 106 98,01 10389
2 81 88,75 7189
Total 187
frequency 1 106 95,79 10153,5
2 81 91,66 7424,5
Total 187
cardio 1 106 81,05 8591,5
2 81 110,94 8986,5
Total 187
functionalflex 1 106 91,17 9664
2 81 97,7 7914
Total 187
strength 1 106 109,78 11636,5
2 81 73,35 5941,5
Total 187
gymprodimprov 1 106 97,37 10321
2 81 89,59 7257
Total 187
devnappuseful 1 106 91,81 9732
2 81 96,86 7846
Total 187

49
Table A3
Ranks by marital status
Marital status (not single - 1;
single - 2) N Mean Rank Sum of Ranks
anytimefitness 1 94 91,95 8643,5
2 93 96,07 8934,5
Total 187
dir 1 94 95,41 8968,5
2 93 92,58 8609,5
Total 187
dreamfit 1 94 93,95 8831
2 93 94,05 8747
Total 187
gofit 1 94 91,42 8593,5
2 93 96,61 8984,5
Total 187
holmesplace 1 94 95,45 8972,5
2 93 92,53 8605,5
Total 187
mcfit 1 94 92,43 8688
2 93 95,59 8890
Total 187
metropolitan 1 94 95,39 8967
2 93 92,59 8611
Total 187
health 1 94 98,07 9219
2 93 89,88 8359
Total 187
getinshape 1 94 95,28 8956
2 93 92,71 8622
Total 187
disconnect 1 94 102,81 9664,5
2 93 85,09 7913,5
Total 187
meetpeople 1 94 78,85 7412

50
2 93 109,31 10166
Total 187
considerequip 1 94 100,63 9459,5
2 93 87,3 8118,5
Total 187
technoequip 1 94 94,18 8853
2 93 93,82 8725
Total 187
frequency 1 94 93,84 8821
2 93 94,16 8757
Total 187
cardio 1 94 91,82 8631,5
2 93 96,2 8946,5
Total 187
functionalflex 1 94 99,84 9385
2 93 88,1 8193
Total 187
strength 1 94 90,34 8491,5
2 93 97,7 9086,5
Total 187
gymprodimprov 1 94 94,98 8928
2 93 93,01 8650
Total 187
devnappuseful 1 94 94,2 8855
2 93 93,8 8723
Total 187

51
Table A4
Ranks by employment status
Employment status (not employed - 1;
employed - 2) N Mean Rank Sum of Ranks
anytimefitness 1 67 95,56 6402,5
2 120 93,13 11175,5
Total 187
dir 1 67 93,85 6288
2 120 94,08 11290
Total 187
dreamfit 1 67 90,98 6095,5
2 120 95,69 11482,5
Total 187
gofit 1 67 91,85 6154
2 120 95,2 11424
Total 187
holmesplace 1 67 89,29 5982,5
2 120 96,63 11595,5
Total 187
mcfit 1 67 98,04 6568,5
2 120 91,75 11009,5
Total 187
metropolitan 1 67 96,43 6461
2 120 92,64 11117
Total 187
health 1 67 86,88 5821
2 120 97,98 11757
Total 187
getinshape 1 67 88,39 5922
2 120 97,13 11656
Total 187
disconnect 1 67 84,75 5678
2 120 99,17 11900
Total 187
meetpeople 1 67 102,63 6876,5

52
2 120 89,18 10701,5
Total 187
considerequip 1 67 85,03 5697
2 120 99,01 11881
Total 187
technoequip 1 67 87,53 5864,5
2 120 97,61 11713,5
Total 187
frequency 1 67 97,1 6505,5
2 120 92,27 11072,5
Total 187
cardio 1 67 100,87 6758
2 120 90,17 10820
Total 187
functionalflex 1 67 97,91 6560
2 120 91,82 11018
Total 187
strength 1 67 83,22 5576
2 120 100,02 12002
Total 187
gymprodimprov 1 67 82,39 5520
2 120 100,48 12058
Total 187
devnappuseful 1 67 86,78 5814
2 120 98,03 11764
Total 187

53
Table A5
Ranks by income brackets
Income brackets N Mean Rank
anytimefitness 1 65 95,95
2 33 94,33
3 36 98,58
4 23 91,13
5 17 83
6 13 90,19
Total 187
dir 1 65 92,88
2 33 95,5
3 36 96,68
4 23 98,83
5 17 89,5
6 13 85,69
Total 187
dreamfit 1 65 95,51
2 33 86,83
3 36 94,39
4 23 88,07
5 17 111,5
6 13 91,19
Total 187
gofit 1 65 95,2
2 33 96,33
3 36 86,89
4 23 100,89
5 17 87,5
6 13 98,08
Total 187
holmesplace 1 65 89,38
2 33 92,17
3 36 96,89
4 23 102,76

54
5 17 97,5
6 13 93,69
Total 187
mcfit 1 65 98,64
2 33 87
3 36 96,68
4 23 90,7
5 17 89,5
6 13 92,88
Total 187
metropolitan 1 65 94,2
2 33 103,83
3 36 85,89
4 23 83,63
5 17 97,5
6 13 104,27
Total 187
health 1 65 86,11
2 33 86,5
3 36 101,61
4 23 112
5 17 95,5
6 13 97,62
Total 187
getinshape 1 65 89,46
2 33 90,33
3 36 113,24
4 23 94,15
5 17 86,5
6 13 82,27
Total 187
disconnect 1 65 85,26
2 33 110,5
3 36 86,18
4 23 104,59
5 17 106,5

55
6 13 82,38
Total 187
meetpeople 1 65 108,54
2 33 93,5
3 36 87,36
4 23 75,39
5 17 89,5
6 13 79,77
Total 187
considerequip 1 65 80,91
2 33 88,67
3 36 94,33
4 23 105,17
5 17 114,5
6 13 125,5
Total 187
technoequip 1 65 89,16
2 33 96,83
3 36 89,04
4 23 95,48
5 17 106
6 13 106,42
Total 187
frequency 1 65 93,72
2 33 97,98
3 36 89,24
4 23 90,83
5 17 88,21
6 13 111,69
Total 187
cardio 1 65 99,28
2 33 98,67
3 36 92,76
4 23 83,39
5 17 92
6 13 80,58

56
Total 187
functionalflex 1 65 94,45
2 33 81,33
3 36 85,58
4 23 106,59
5 17 97,5
6 13 120,35
Total 187
strength 1 65 88,27
2 33 102
3 36 103,65
4 23 92,02
5 17 92,5
6 13 81,08
Total 187
gymprodimprov 1 65 81,9
2 33 104,2
3 36 96,94
4 23 110,65
5 17 87
6 13 100,15
Total 187
devnappuseful 1 65 98,07
2 33 111,59
3 36 89,21
4 23 88,91
5 17 91,03
6 13 55,15
Total 187

57
Table A6
Ranks by age brackets
Age brackets N Mean Rank
anytimefitness 1 23 95,2
2 43 93,87
3 50 90,48
4 44 97,88
5 27 93,39
Total 187
dir 1 23 98,83
2 43 95,9
3 50 91,59
4 44 95,5
5 27 88,89
Total 187
dreamfit 1 23 92,13
2 43 101,4
3 50 87,74
4 44 92,5
5 27 97,85
Total 187
gofit 1 23 84,63
2 43 98,24
3 50 95,2
4 44 95,63
5 27 90,35
Total 187
holmesplace 1 23 90,57
2 43 88,67
3 50 92,11
4 44 99,25
5 27 100,35
Total 187
mcfit 1 23 102,89
2 43 95,9

58
3 50 99,07
4 44 87
5 27 85,43
Total 187
metropolitan 1 23 91,76
2 43 90,72
3 50 99,81
4 44 88,25
5 27 99,74
Total 187
health 1 23 83,54
2 43 85,91
3 50 93,3
4 44 101,38
5 27 105,07
Total 187
getinshape 1 23 94,15
2 43 96,99
3 50 109,6
4 44 83,25
5 27 77,74
Total 187
disconnect 1 23 76,13
2 43 94,09
3 50 99,79
4 44 99,88
5 27 88,78
Total 187
meetpeople 1 23 128,24
2 43 98,84
3 50 73,44
4 44 108,38
5 27 71,78
Total 187
considerequip 1 23 68,59
2 43 90,71

59
3 50 108,67
4 44 91,5
5 27 97,8
Total 187
technoequip 1 23 79,22
2 43 95,38
3 50 96,21
4 44 91,88
5 27 103,76
Total 187
frequency 1 23 91,57
2 43 84,06
3 50 85,36
4 44 101,83
5 27 115,15
Total 187
cardio 1 23 111,85
2 43 93,79
3 50 81,44
4 44 101,5
5 27 90,17
Total 187
functionalflex 1 23 82,2
2 43 83,05
3 50 90,57
4 44 97,63
5 27 121,94
Total 187
strength 1 23 87,96
2 43 105,16
3 50 109,99
4 44 82,88
5 27 69,89
Total 187
gymprodimprov 1 23 73,02
2 43 101,98

60
3 50 106,14
4 44 94,74
5 27 75,48
Total 187
devnappuseful 1 23 118,78
2 43 105,29
3 50 101,47
4 44 94,44
5 27 40,35
Total 187

61
Table A7
Ranks by education level
Education level N Mean Rank
anytimefitness 1 4 83
2 22 100
3 20 97,03
4 83 93,14
5 58 92,67
Total 187
dir 1 4 78,5
2 22 95,5
3 20 87,85
4 83 94,27
5 58 96,23
Total 187
dreamfit 1 4 84
2 22 92,5
3 20 93,35
4 83 95,27
5 58 93,67
Total 187
gofit 1 4 76,5
2 22 89,25
3 20 90,53
4 83 99,03
5 58 91,01
Total 187
holmesplace 1 4 86,5
2 22 90,75
3 20 91,18
4 83 93,26
5 58 97,78
Total 187
mcfit 1 4 148,63
2 22 99,75
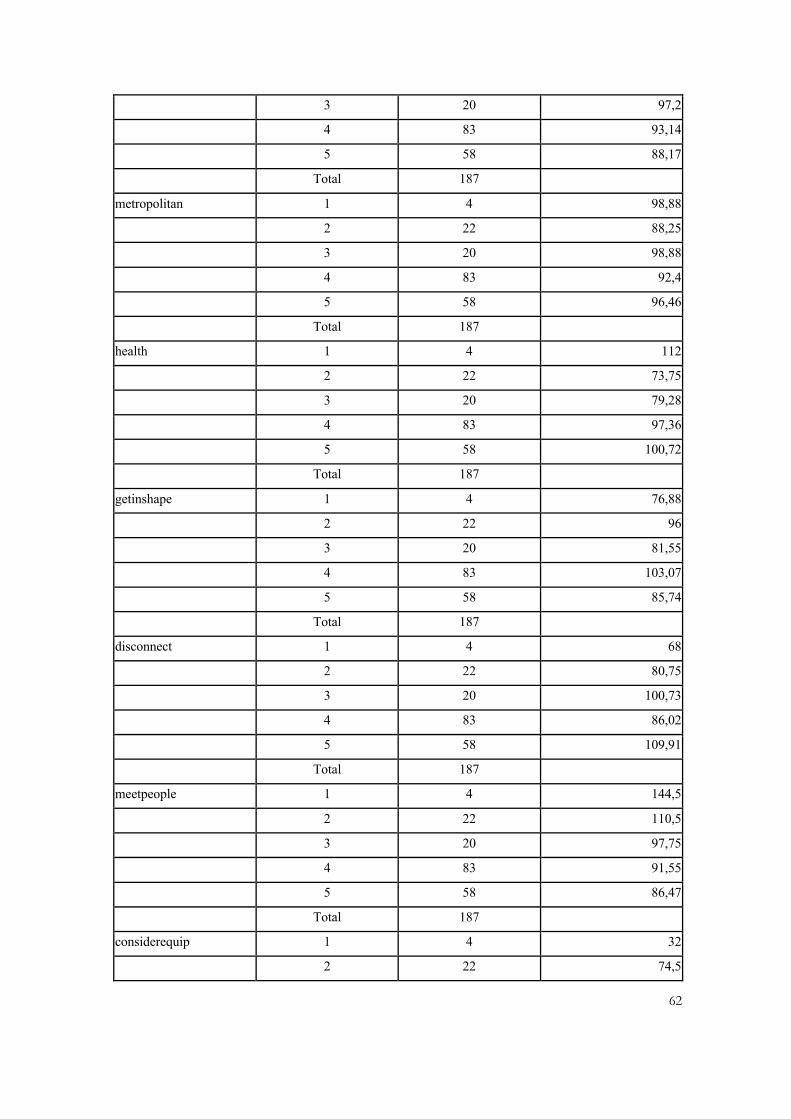
62
3 20 97,2
4 83 93,14
5 58 88,17
Total 187
metropolitan 1 4 98,88
2 22 88,25
3 20 98,88
4 83 92,4
5 58 96,46
Total 187
health 1 4 112
2 22 73,75
3 20 79,28
4 83 97,36
5 58 100,72
Total 187
getinshape 1 4 76,88
2 22 96
3 20 81,55
4 83 103,07
5 58 85,74
Total 187
disconnect 1 4 68
2 22 80,75
3 20 100,73
4 83 86,02
5 58 109,91
Total 187
meetpeople 1 4 144,5
2 22 110,5
3 20 97,75
4 83 91,55
5 58 86,47
Total 187
considerequip 1 4 32
2 22 74,5

63
3 20 78,75
4 83 96,21
5 58 107,77
Total 187
technoequip 1 4 34,5
2 22 85,5
3 20 85,93
4 83 96,46
5 58 100,59
Total 187
frequency 1 4 66,25
2 22 103,09
3 20 93,13
4 83 97,63
5 58 87,58
Total 187
cardio 1 4 152,5
2 22 97,25
3 20 87,05
4 83 90,54
5 58 96,08
Total 187
functionalflex 1 4 70
2 22 91,25
3 20 88,7
4 83 89,15
5 58 105,47
Total 187
strength 1 4 59,5
2 22 93,5
3 20 106,25
4 83 102,31
5 58 80,46
Total 187
gymprodimprov 1 4 49,38
2 22 81,11

64
3 20 78,53
4 83 98,76
5 58 100,49
Total 187
devnappuseful 1 4 130,38
2 22 109,89
3 20 81,50
4 83 94,74
5 58 88,72
Total 187