research summary: network-based modeling and analysis of systemic risk in banking systems, hu
TRANSCRIPT

Network-Based Modeling and Analysis of Systemic Risk in
Banking Systems (4B)Hu, Zhao, Hua, Wong, MIS Quarterly 2012
Presented by Alex Klibisz, UTK STAT 645, 9/13/16

Outline
- Background
- Purpose
- Related Work
- Network Approach to Risk Management, NARM
- Modeling systemic risk as networks
- Link Aware Systemic Estimation of Risks, LASER
- Simulating risk scenarios, evaluating LASER
- Caveats and Thoughts

Background
- Publication: MIS Quarterly, special issue on BI Research.
- Context: business intelligence for systemic risk in banking.
- Authors: broad backgrounds (business intelligence, economics, banking,
computer science)

Background - Terms
- Systemic Risk - risk imposed by relationships among banks.
- Contagious Failure - failure in a banking system propagates.
- Example: 2008 US banking collapse, > 160 banks failed
- Capital Injections - banks given or loaned money to continue operating.
- Modern Portfolio Theory
- Investment methodology
- Asset risk is the standard deviation of the asset’s returns.
- Portfolio risk is the variance of the portfolio's returns.
- Risk reduced by including assets whose returns are not positively correlated.

Related Work
- Well-studied
- Sources of systemic risk
- Risk management for individual banks
- Interbank payment obligations
- Modern Portfolio Theory
- Elsinger Risk Assessment for Banking Systems referenced ~20 times

Purpose
Create a framework that will:
1. Model systemic risk using network and financial principles.
2. Order banks by systemic risk.
3. Predict which banks will fail.
4. Determine which banks get capital injections, and how much.

Network Approach to Risk Management, NARM
1. Model systemic risk as networks
a. Interbank payments as a network
b. Correlated assets as a network
2. Simulate and evaluate risk scenarios
a. Build scenarios with real-world data sets
b. Apply market shock
c. Apply capital injection
d. Evaluate LASER on simulations
3. LASER Algorithm to determine failed banks and cash injections
a. CRINP, HITS
b. Hub, Authority measurement and sorting

Interbank Payments as a Network
- Failure scenario
- Bank A owes bank B, bank B owes bank C, ...
- Market shock causes bank A default to B, B default to C, ...
- Network Model
- Banks are nodes, payment obligations are directed edges.
- Network represented as matrix L, lij represents bank i’s payment obligation to bank j.
- Clearing payment vector pi* represents i’s ability to pay off all obligations (eq. 10)
- Consider available reserve capital and financial asset portfolios
- Algorithm for Payment Clearing Process (Figure 3)
- Determine the sequence of banks that will fail
A B C$ $ $ $

Correlated Assets as a Network
- Failure scenario
- Multiple banks own common or positively correlated assets
- Assets rapidly lose value, causing banks to default and fail
- Network Model
- Based on modern portfolio theory, banking system is portfolio, a bank is an asset.
- Calculate: systemic risk of a banking system (eq. 4), systemic risk of an individual bank
(eq. 5), systemic risk of a pair of banks (eq. 6), correlation coefficient ⍴ij for a pair of
banks (eq. 7).
- Nodes are banks, edges are correlation coefficients; only include edges above a
threshold ⍴s, fixed at 0.5
- Eq. 5 later used in LASER calculation of Hub and Authority scores

Network Approach to Risk Management, NARM
1. Model systemic risk as networks
a. Interbank payments as a network
b. Correlated assets as a network
2. Simulate and evaluate risk scenarios
a. Build scenarios with real-world data sets
b. Apply market shock
c. Apply capital injection
d. Evaluate LASER on simulations
3. LASER Algorithm to determine failed banks and cash injections
a. CRINP, HITS
b. Hub, Authority measurement and sorting

Hyperlink-induced topic search Algorithm (HITS)
- Rank the importance of web pages, Kleinberg (1999)
- Measure a web page’s relative importance
- Authority score: relative importance of a web page
- Hub score: relative influence on other pages
- Web pages and banks
- Web pages have links, banks have interbank relationships
- As bank’s interbank relationships increase, its failure’s influence on other banks
increases.

Correlative Rank-in-Network Principle (CRINP)
- Summarizes HITS algorithm.
- Definition 4: A node’s prominence in a characteristic depends on:
1) Number of incoming links
2) Prominence of this characteristic on the source nodes
- Systemic risk a bank receives in the banking system depends on:
1) Number and amount of incoming payments from other banks.
2) Number and levels of correlation with other banks’ financial asset portfolios.
3) Systemic risk level of the other banks.

Hub and Authority Measurement and Sorting
- Link Aware Systematic Estimation of Risks, LASER
- Authority score: systemic risk received from other banks.
- Hub score: systemic risk imposed on other banks.
- Higher score implies higher risk.
- Algorithm described in Figure 4
- Input: banks, interbank payment matrix,
correlated portfolio coefficients
- Output: ranked list of banks by
authority score and hub scores

Hub and Authority Measurement and Sorting
- Intuition
- Authority score identifies first banks to fail in contagious failure scenarios.
- Hub score identifies banks whose failure will have largest negative impact.
- Banks with high hub scores should receive cash injections to stabilize the system.

Network Approach to Risk Management, NARM
1. Model systemic risk as networks
a. Interbank payments as a network
b. Correlated assets as a network
2. Simulate and evaluate risk scenarios
a. Build scenarios with real-world data sets
b. Apply market shock
c. Apply capital injection
d. Evaluate LASER on simulations
3. LASER Algorithm to determine failed banks and cash injections
a. CRINP, HITS
b. Hub, Authority measurement and sorting

Build Scenarios with Real-World Data Sets
- 18 quarters Fedwire (interbank payment).
- 38 quarters FDIC call reports (assets, asset correlation).
- Mergers and acquisitions excluded.
- End up with 18 quarters of base scenarios with 7,822 banks.
- Simulations applied on first day after close of a quarter.
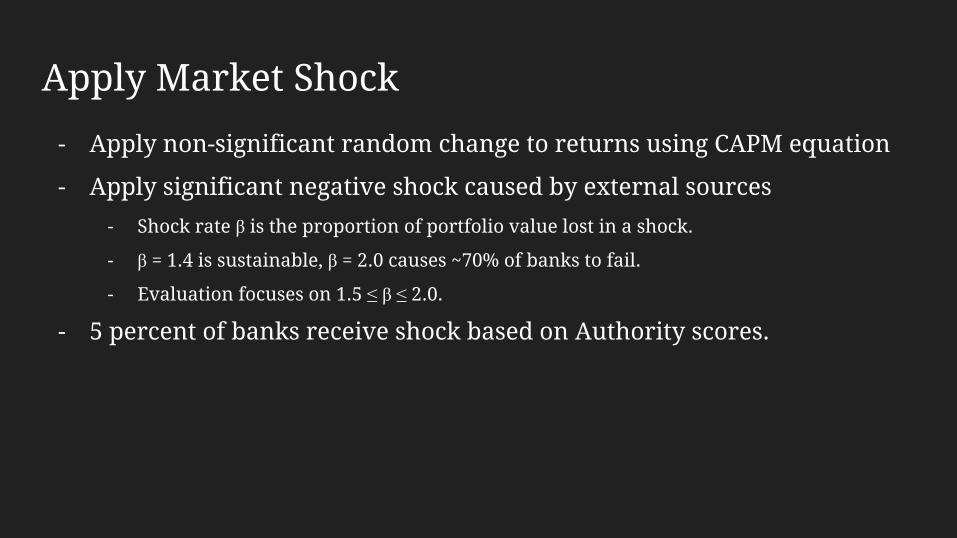
Apply Market Shock
- Apply non-significant random change to returns using CAPM equation
- Apply significant negative shock caused by external sources
- Shock rate β is the proportion of portfolio value lost in a shock.
- β = 1.4 is sustainable, β = 2.0 causes ~70% of banks to fail.
- Evaluation focuses on 1.5 ≤ β ≤ 2.0.
- 5 percent of banks receive shock based on Authority scores.

Apply Capital Injection
- 5 percent of banks selected based on Hub scores.
- Inject a percentage of the bank’s asset portfolio,
- = {100, 200, 300, 400, 500}

Evaluate LASER on Simulations - Method
1. Generate base scenarios
2. Generate systemic risk scenarios
a. Market shock
b. Market shock followed by cash injection
3. LASER determines failed banks, large-risk banks.
4. Evaluate
a. Banks that actually failed vs. LASER list, F-score
b. Effects of capital injection, reduction rate
c. Compare a. and b. against four baselines with thorough explanations

Evaluate LASER on Simulations - Results
- LASER outperforms baselines in classifying failed banks (Table 2)
- F-score between 0.2 and 0.47
- LASER cash injections outperforms in reducing failure rate (Table 3)
- 13% to 38% of banks “saved” on average

Caveats and Thoughts
- Possible inaccuracies in correlation, because MPT ignores taxes and
transaction fees.
- LASER requires high-quality financial data, not always available.
- Several variables determined by domain experts opinion.