research summary #01 - the homeless hub · 2016-01-27 · research summary #01 ... social research...
TRANSCRIPT

Revised 2011 September 8
COMMUNITY AND NEIGHBOURHOOD SERVICES SOCIAL RESEARCH UNIT
Research Summary #01
© 2011 The City of Calgary, Community and Neighbourhood Services, Social Research Unit
RS-01 – Affordable Rent and Home Ownership Limits for Calgary, 2010 Page 1 of 18
Affordable Rent and Home Ownership Limits for Calgary, 2010 For Calgary City Council, ―affordable housing adequately suits the needs of low- and moderate-income households at costs below those generally found in the Calgary market. It may take a number of forms that exist along a continuum – from emergency shelters, to transitional housing, to non-market rental (also known as social or subsidized housing), to formal and informal rental, and ending with affordable home ownership.‖ Affordable housing projects are targeted to households with 65% or less of median household income in Calgary (City of Calgary, 2002: 18), meaning households with a before-tax income of less than $44,000 per year (Statistics Canada, 2007).1 The City‘s definition of affordable housing can be illustrated graphically, as shown in Box 1.
BOX 1. THE AFFO RDABLE HO US ING CO NTI NUUM
NO N -MA R K E T HO U S IN G NE A R -MA R K E T HO U S IN G
Calgarians whose gross annual household income is less than $44,000 and whose housing costs exceed 30% of gross household income face serious housing affordability challenges. A total of 19% of all Calgary households—72,195 households—fall into this category. Those affected are comprised of 37% of all renters for a total of 38,610 households and 12% of all owners or 33,585 households (Statistics Canada, 2008a; City of Calgary, 2008a: 18; 4; 11). Most of the low and moderate income households identified by The City of Calgary simply cannot afford to pay average market rent. Box 2 explains how average market rent is calculated.
1 Median annual household income in Calgary for 2005 was $67,238 (Statistics Canada, 2007). Thus,
65% of median annual household income is now $43,705 (rounded up to $44,000 for analysis).
EM E R G E N C Y
SH E L T E R S
AF F O R D A B L E
HO M E
OW N E R S H IP
FO R M A L A N D
IN F O R M A L
RE N T A L
SO C IA L O R
SU B S ID IZ E D
HO U S IN G
TR A N S IT IO N A L
HO U S IN G

Page 2 of 18 The City of Calgary, Community and Neighbourhood Services, Social Research Unit
BOX 2. CAL CUL ATI NG “AVERAG E MARKET RE NT” F OR CALG ARY
DURING THE FIRST TW O W EEKS OF APRIL AND OCTOBER , CANADA MORTGAGE AND
HOUSING CORPORATION (CMHC) CONDUCTS A PRIVATE RENTAL MARKET SURVEY IN
ALL URBAN AREAS OF CANADA W ITH POPULATIONS OF 10,000 OR MORE . THE
OCTOBER SURVEY RESULTS FOR CALGARY—W HICH ARE USED IN THIS REPORT—ARE
PUBLISHED IN A DETAILED RENTAL MARKET REPORT THAT IS RELEASED EACH FALL .
DATA ARE NOT COLLECTED FOR NON-MARKET HOUSING , W HICH IS ALSO KNOW N AS
PUBLIC , SOCIAL OR SUBSIDIZED HOUSING . THE RENTAL MARKET SURVEY TARGETS ONLY ―PRIVATELY INITIATED STRUCTURES‖
(BUILT AS RENTAL PROPERTIES) W ITH AT LEAST THREE RENTAL UNITS . DATA ARE
COLLECTED FOR UNITS THAT HAVE BEEN ON THE MARKET FOR AT LEAS T THREE
MONTHS AT THE TIME OF THE SURVEY. RENTAL DATA ARE COLLECTED FOR BOTH
APARTMENTS AND ROW HOMES (TOW NHOUSES) . APARTMENT STRUCTURES MUST BE
LOCATED IN A BUILDING W ITH THREE OR MORE RENTAL UNITS , W HERE AT LEAST ONE
UNIT MUST NOT BE GROUND-ORIENTED . ROW HOME STRUCTURES MUST BE LOCATED
IN A BUILDING W ITH THREE OR MORE RENTAL UNITS , ALL OF W HICH MUST BE GROUND-ORIENTED W ITH VERTICAL DIVISIONS . FOR BOTH APARTMENT AND ROW HOME
STRUCTURES , OWNER -OCCUPIED UNITS ARE EXCLUDED FROM THE UNIT COUNT . IN ADDITION , CMHC BEGAN CONDUCTING A FULL SECONDARY RENTAL MARKET
SURVEY IN CALGARY IN 2007, W HICH TAKES PLACE IN SEPTEMBER AND OCTOBER OF
EACH YEAR . THE SECONDARY MARKET SURVEY PROVIDES INFORMATION ABOUT THE
MARKET RENTAL UNITS THAT ARE NOT INCLUDED IN THE PRIVATE MARKET SURVEY.
CMHC SURVEYS OCCUPANTS AND OW NERS OF CONDOMINIUMS—W HICH CAN BE ANY
DW ELLING TYPE BUT ARE PRIMARILY CONDOMINIUM APARTMENTS—AND ALL ‘OTHER ’
UNITS IN THE SECONDARY MARKET. ‗OTHER ‘ UNITS CONSIST OF : RENTED SINGLE
DETACHED HOUSES ; DOUBLE HOUSES (SEMI-DETACHED HOMES OR DUPLEXES);
FREEHOLD ROW HOMES OR TOW NHOUSES ; DUPLEX APARTMENTS (STACKED ONE
ABOVE THE OTHER); ACCESSORY APARTMENTS (SEPARATE UNITS LOCATED W ITHIN
ANOTHER STRUCTURE SUCH AS A BASEMENT , GARAGE , OR GARDEN SUITE); AND ONE
OR TW O APARTMENTS THAT ARE PART OF A COMMERCIAL OR OTHER TYPE OF
STRUCTURE (THEREFORE W ITH FEW ER UNITS THAN THE THREE OR MORE UNIT
MINIMUM SET FOR THE PRIVATE RENTAL MARKET SURVEY). FOR BOTH THE PRIVATE AND SECONDARY RENTAL MARKET SURVEYS , RENT IS
CONSIDERED TO BE THE ACTUAL AMOUNT TENANTS PAY F OR AN OCCUPIED UNIT. IT IS
NOT ADJUSTED FOR THE INCLUSION OR EXCLUSION OF HEAT, HYDRO , HOT W ATER ,
PARKING , OR OTHER AMENITIES A ND SERVICES . FOR VACANT OR AVAILABLE UNITS ,
RENT IS DEFINED AS THE AMOUNT THE OW NER IS ASKING FOR THE UNIT. THIS
INCLUDES UNITS W HERE THE TENANT HAS GIVEN OR RECEIVED NOTICE TO MOVE AND
A NEW TENANT HAS NOT SIGNED A LEASE OR W HERE THE UNIT IS UNOCCUPIED AND
AVAILABLE FOR IMMEDIATE RENTAL . Source: CMHC (2010: 28-29).
RS-01 – Affordable Rent and Home Ownership Limits for Calgary, 2010 Page 3 of 18
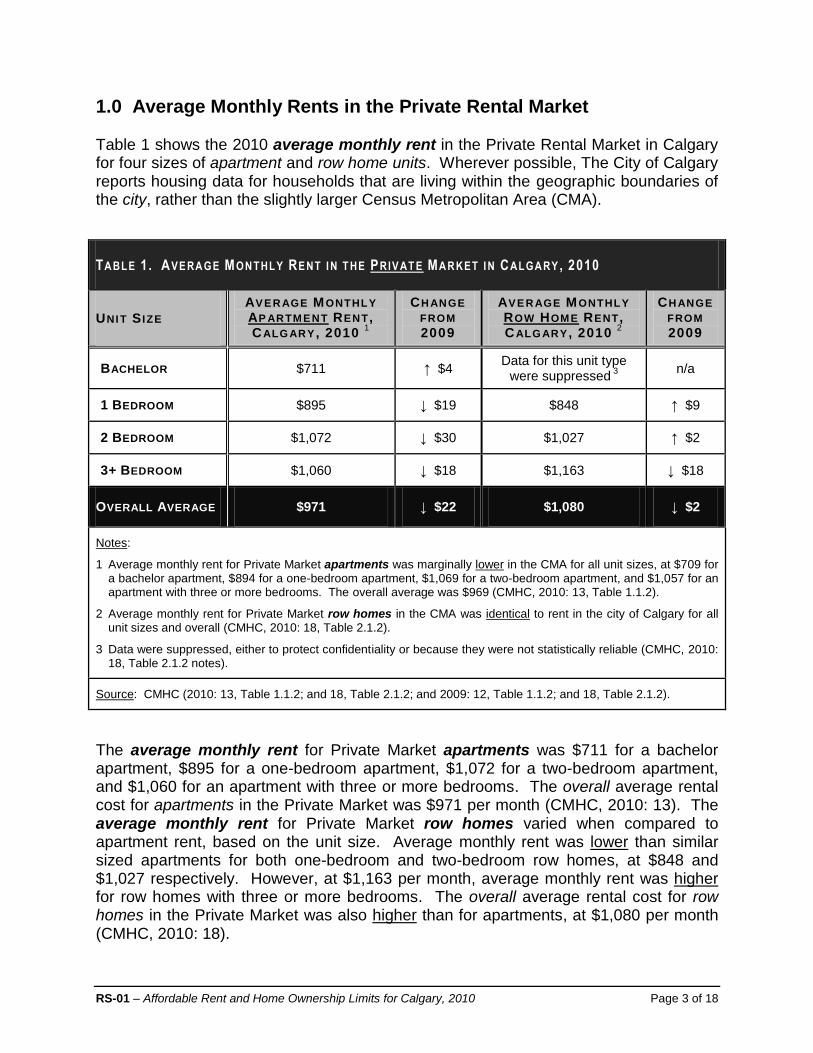
1.0 Average Monthly Rents in the Private Rental Market Table 1 shows the 2010 average monthly rent in the Private Rental Market in Calgary for four sizes of apartment and row home units. Wherever possible, The City of Calgary reports housing data for households that are living within the geographic boundaries of the city, rather than the slightly larger Census Metropolitan Area (CMA).
TABLE 1. AVE RAGE MONTHLY RE NT I N T HE PRIV AT E MARKET I N CALGARY , 2010
UNIT S IZE
AVER AGE MONTHLY AP ARTMENT RENT , CALG ARY , 2010
1
CH ANGE FROM 2009
AVER AGE MONTHLY ROW HOME RENT , CALG ARY , 2010
2
CH ANGE FROM 2009
BACHELOR $711 ↑ $4 Data for this unit type
were suppressed 3
n/a
1 BEDROOM $895 ↓ $19 $848 ↑ $9
2 BEDROOM $1,072 ↓ $30 $1,027 ↑ $2
3+ BEDROOM $1,060 ↓ $18 $1,163 ↓ $18
OVERALL AVERAGE $971 ↓ $22 $1,080 ↓ $2
Notes:
1 Average monthly rent for Private Market apartments was marginally lower in the CMA for all unit sizes, at $709 for a bachelor apartment, $894 for a one-bedroom apartment, $1,069 for a two-bedroom apartment, and $1,057 for an apartment with three or more bedrooms. The overall average was $969 (CMHC, 2010: 13, Table 1.1.2).
2 Average monthly rent for Private Market row homes in the CMA was identical to rent in the city of Calgary for all unit sizes and overall (CMHC, 2010: 18, Table 2.1.2).
3 Data were suppressed, either to protect confidentiality or because they were not statistically reliable (CMHC, 2010: 18, Table 2.1.2 notes).
Source: CMHC (2010: 13, Table 1.1.2; and 18, Table 2.1.2; and 2009: 12, Table 1.1.2; and 18, Table 2.1.2).
The average monthly rent for Private Market apartments was $711 for a bachelor apartment, $895 for a one-bedroom apartment, $1,072 for a two-bedroom apartment, and $1,060 for an apartment with three or more bedrooms. The overall average rental cost for apartments in the Private Market was $971 per month (CMHC, 2010: 13). The average monthly rent for Private Market row homes varied when compared to apartment rent, based on the unit size. Average monthly rent was lower than similar sized apartments for both one-bedroom and two-bedroom row homes, at $848 and $1,027 respectively. However, at $1,163 per month, average monthly rent was higher for row homes with three or more bedrooms. The overall average rental cost for row homes in the Private Market was also higher than for apartments, at $1,080 per month (CMHC, 2010: 18).

Page 4 of 18 The City of Calgary, Community and Neighbourhood Services, Social Research Unit
In contrast with 2009, when average monthly rent in Calgary declined for all unit sizes in the Private Rental Market with the exception of apartments with three or more bedrooms, there was more variability across unit types in 2010. Average rent changes in Private Market apartment and row home rents in 2010 ranged from an increase of $2 per month to a decrease of $30, as shown in Table 1 (City of Calgary, 2010: 3-4; and CMHC, 2010; 2009).
2.0 Average Monthly Rents in the Secondary Rental Market Secondary Rental Market data are only available for the Calgary Census Metropolitan Area (CMA), rather than for the slightly smaller geographic boundaries of the city. Table 2 shows the average monthly rent for 2010 for condominium apartments and all ‘other’ units in the Secondary Rental Market. As described in Box 2, CMHC (2010: 28) clusters a wide range of dwelling types together as ‗other‘ units when reporting on the Secondary Rental Market.
TABLE 2. AVE RAGE MONTHLY RE NT I N T HE SE CO NDARY MARKET I N T HE CAL GARY CMA, 2010
UNIT S IZE
AVER AGE MONTHLY CONDOMINIUM
AP ARTMENT RENT , CALG ARY CM A, 2010
CH ANGE FROM 2009
AVER AGE MONTHLY RENT FOR ALL OTHER
SECOND ARY UNITS , CALG ARY CM A, 2010
CH ANGE FROM 2009
BACHELOR No units of this type
at all in Calgary 1
n/a No units of this type
in the survey sample 2
n/a
1 BEDROOM $1,276 n/a 3 $785 n/a
3
2 BEDROOM $1,385 ↑ $75 $1,037 ↑ $50
3+ BEDROOM Data for this unit type
were suppressed 4
n/a $1,260 ↓ $29
OVERALL AVERAGE $1,355 ↑ $99 $1,150 ↓ $5
Notes:
1 No units of this type exist in the Secondary Rental Market in Calgary (CMHC, 2010: 25, Table 4.1.3 notes).
2 No units of this type that are in the Secondary Rental Market were included in the survey sample (CMHC, 2010: 26, Table 5.1 notes).
3 Data for 2009 were suppressed, either to protect confidentiality or because they were not statistically reliable (CMHC, 2010: 24, Table 4.1.3 notes; and 26, Table 5.1 notes). Therefore, no annual comparisons can be made.
4 Data were suppressed, either to protect confidentiality or because they were not statistically reliable (CMHC, 2010: 24, Table 4.1.3 notes).
Source: CMHC (2010: 24, Table 4.1.3; and 26, Table 5.1; and 2009: 25, Table 4.1.3; and 27, Table 5.1).

RS-01 – Affordable Rent and Home Ownership Limits for Calgary, 2010 Page 5 of 18
The average monthly rent for Secondary Market condominium apartments was $1,276 for a one-bedroom unit and $1,385 for a two-bedroom unit. There are no bachelor condominium apartments in the Secondary Rental Market universe in Calgary and there are too few units with three or more bedrooms to enable CMHC to report average monthly rent. The overall average rental cost for condominium apartments in the Secondary Market was $1,355 per month (CMHC, 2010: 24). Compared to condominium apartments, rental costs were decidedly lower for all other units in the Secondary Market, at $785 for one-bedroom units and $1,037 for two-bedroom units. Average monthly rent was $1,260 for units with three or more bedrooms. The overall average rental cost for all ‘other’ units in the Secondary Market was considerably lower than for condominium apartments, at $1,150 per month (CMHC, 2010: 26). CMHC first conducted a full Secondary Rental Market Survey in Calgary in 2007, so year-to-year changes can now be reported where data are available. In 2010, rent increased by an average of $75 per month for two-bedroom condominium apartments and by $50 per month for ‗other‘ two-bedroom units in the Secondary Rental Market. Conversely, rent decreased by an average of $29 per month for ‗other‘ units with three or more bedrooms in the Secondary Rental Market, as shown in Table 2. When comparing the Private Rental Market to the Secondary Rental Market, average monthly rents varied according to the size of the unit. For example, two-bedroom row home units in the Private Market had lower average monthly rents than all similar sized units in both markets. In contrast, ‗other‘ units in the Secondary Market with three or more bedrooms had higher average monthly rents than all similar sized units in both markets.
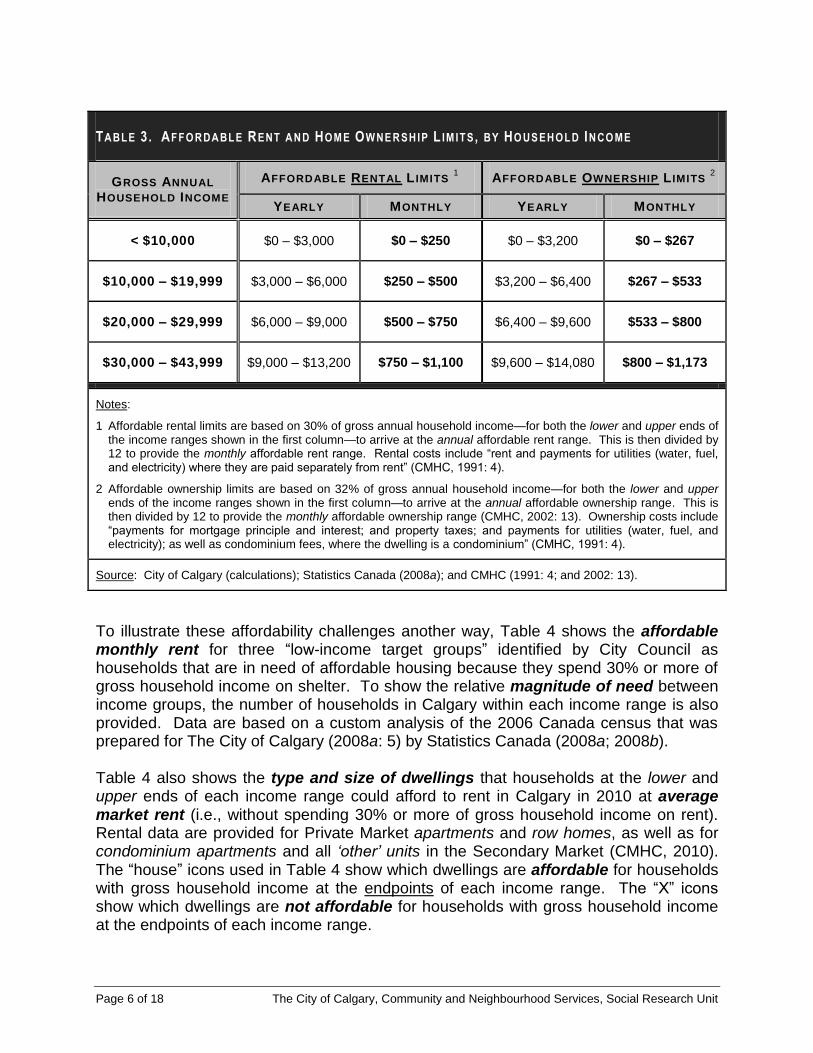
3.0 Affordability Challenges in Calgary As shown in Table 3, the upper limit for affordable rent for Calgarians with a gross annual household income of less than $10,000 is $250 per month. For households with income of $10,000 to $19,999 per year, the affordable monthly rent range is $250-$500. The affordable monthly rent range for households with income of $20,000 to $29,999 is $500-$750. For households with income of $30,000 to $43,999 per year (the upper limit of which denotes 65% of median household income in Calgary), the affordable monthly rent range is $750-$1,100 (City of Calgary calculations; Statistics Canada, 2008a; and CMHC, 1991: 4; and 2002: 13). Table 3 also shows that potential home owners with low to moderate household income face similar challenges related to finding housing they can afford to purchase.
Page 6 of 18 The City of Calgary, Community and Neighbourhood Services, Social Research Unit
TABLE 3. AFFO RDABLE RENT AND HOM E OW NE RSHIP L IM ITS , BY HO US EHOLD INCO ME
GROSS ANNUAL HOUSEHOLD INCOME
AFFORDABLE RENTAL L IMITS 1 AFFORDABLE OWNERSHIP L IMITS
2
YEARLY MONTHLY YEARLY MONTHLY
< $10,000 $0 – $3,000 $0 – $250 $0 – $3,200 $0 – $267
$10,000 – $19,999 $3,000 – $6,000 $250 – $500 $3,200 – $6,400 $267 – $533
$20,000 – $29,999 $6,000 – $9,000 $500 – $750 $6,400 – $9,600 $533 – $800
$30,000 – $43,999 $9,000 – $13,200 $750 – $1,100 $9,600 – $14,080 $800 – $1,173
Notes:
1 Affordable rental limits are based on 30% of gross annual household income—for both the lower and upper ends of the income ranges shown in the first column—to arrive at the annual affordable rent range. This is then divided by 12 to provide the monthly affordable rent range. Rental costs include ―rent and payments for utilities (water, fuel, and electricity) where they are paid separately from rent‖ (CMHC, 1991: 4).
2 Affordable ownership limits are based on 32% of gross annual household income—for both the lower and upper ends of the income ranges shown in the first column—to arrive at the annual affordable ownership range. This is then divided by 12 to provide the monthly affordable ownership range (CMHC, 2002: 13). Ownership costs include ―payments for mortgage principle and interest; and property taxes; and payments for utilities (water, fuel, and electricity); as well as condominium fees, where the dwelling is a condominium‖ (CMHC, 1991: 4).
Source: City of Calgary (calculations); Statistics Canada (2008a); and CMHC (1991: 4; and 2002: 13).
To illustrate these affordability challenges another way, Table 4 shows the affordable monthly rent for three ―low-income target groups‖ identified by City Council as households that are in need of affordable housing because they spend 30% or more of gross household income on shelter. To show the relative magnitude of need between income groups, the number of households in Calgary within each income range is also provided. Data are based on a custom analysis of the 2006 Canada census that was prepared for The City of Calgary (2008a: 5) by Statistics Canada (2008a; 2008b). Table 4 also shows the type and size of dwellings that households at the lower and upper ends of each income range could afford to rent in Calgary in 2010 at average market rent (i.e., without spending 30% or more of gross household income on rent). Rental data are provided for Private Market apartments and row homes, as well as for condominium apartments and all ‘other’ units in the Secondary Market (CMHC, 2010). The ―house‖ icons used in Table 4 show which dwellings are affordable for households with gross household income at the endpoints of each income range. The ―X‖ icons show which dwellings are not affordable for households with gross household income at the endpoints of each income range.

RS-01 – Affordable Rent and Home Ownership Limits for Calgary, 2010 Page 7 of 18
TABLE 4. AFFO RDABLE RENT L I M ITS AND AV ERAG E RE NTS I N CALG ARY , 2010
Key: X = Cannot afford average market rent at that endpoint of the household income range shown.
= Can afford average market rent at that endpoint of the household income range shown.
GROSS ANNUAL
HOUSEHOLD
INCOME RANGES
AND AFFORDABLE
MONTHLY RENT 1
NUMBER OF
RENTER
HOUSEHOLDS
AFFECTED IN CALGARY 2
2010 RENTAL AFFORDABILITY, BY UNIT SIZE AND TYPE 3
UNIT TYPE
BACHELOR
APT. – $711 ROW – n/a 4 CONDO – n/a 5 OTHER – n/a 6
1 BEDROOM
APT. – $895 ROW – $848 CONDO – $1,276 OTHER – $785
2 BEDROOM
APT. – $1,072 ROW – $1,027 CONDO – $1,385 OTHER – $1,037
3+ BEDROOM
APT. – $1,060 ROW – $1,163 CONDO – n/a 7 OTHER – $1,260
EXTREMELY LOW INCOME (less than $20,000) AFFORDABLE MONTHLY RENT = $0 – $500
20,040
Apartment:-
Row:-
Condo:-
Other:-
X X
n/a-
n/a-
n/a-
X X
X X
X X
X X
X X
X X
X X
X X
X X
X X
n/a-
X X
VERY LOW INCOME ($20,000 – 29,999) AFFORDABLE MONTHLY RENT = $500 – $750
10,825
Apartment:-
Row:-
Condo:-
Other:-
X
n/a-
n/a-
n/a-
X X
X X
X X
X X
X X
X X
X X
X X
X X
X X
n/a-
X X
LOW INCOME ($30,000 – 43,999) AFFORDABLE MONTHLY RENT = $750 – $1,100
7,740
Apartment:-
Row:-
Condo:-
Other:-
X
n/a-
n/a-
n/a-
X
X
X X
X
X
X
X X
X
X
X X
n/a-
X X
Notes:
1 A total of 38,610 renter households in Calgary need affordable housing because they have a gross annual household income that is less than $44,000 and they spend 30% or more of household income on rental costs. They are divided into three “low-income target groups” identified by City Council (City of Calgary, 2008a: 1; and 4). The Affordable Monthly Rent for these “low-income target groups” is based on 30% of gross annual household income, divided by 12, for the lower and upper endpoints of each income range. Note that due to random rounding, the summed total for all target groups shown in this table is slightly lower than the aggregate total reported by Statistics Canada (2008a).
2 For detailed information on households that are in need of affordable housing, see Research Brief #03 (City of Calgary, 2008a).
3 Rental data are reported for the city of Calgary for apartments and row homes in the Private Rental Market and for the Census Metropolitan Area (Calgary CMA) for condominium apartments and all ‘other’ units in the Secondary Rental Market.
4 Data were suppressed, either to protect confidentiality or because they were not statistically reliable (CMHC, 2010: 18, Table 2.1.2 notes).
5 No units of this type exist in the Secondary Rental Market in Calgary (CMHC, 2010: 24, Table 4.1.3 notes).
6 No units of this type that are in the Secondary Rental Market were included in the survey sample (CMHC, 2010: 26, Table 5.1 notes).
7 Data were suppressed, either to protect confidentiality or because they were not statistically reliable (CMHC, 2010: 24, Table 4.1.3 notes).
Source: City of Calgary (2008a: 1; 4; and 5); Statistics Canada (2008a; 2008b; and 2007); and CMHC (2010: 13, Table 1.1.2; 18, Table 2.1.2; 24, Table 4.1.3; and 26, Table 5.1).

Page 8 of 18 The City of Calgary, Community and Neighbourhood Services, Social Research Unit
Table 4 illustrates how grim the situation is for the 37% of Calgary renter households who are living in unaffordable housing. For the vast majority of these households, the options for affordable market rental accommodation are extremely limited. There are 20,040 extremely low-income households in Calgary (with a gross annual household income of less than $20,000) that are spending 30% or more of their income on shelter. Among these households, none can afford to rent any type of unit in Calgary at average market rates. For this group, all housing in both the Private and Secondary Rental Markets is unaffordable. There are 10,825 very low-income households in Calgary (with a gross annual household income of $20,000 to $29,999) that are spending 30% or more of their income on shelter. For households near the lower end of this income range, none can afford to rent any type of unit in Calgary at average market rates. For this group, all housing in the Private and Secondary Rental Markets is unaffordable. Households near the upper end of this income range can only afford to rent a bachelor apartment in Calgary at average market rates. All remaining housing in the Private and Secondary Rental Markets is unaffordable. There are 7,740 low-income households in Calgary (with a gross annual household income of $30,000 to $43,999) that are spending 30% or more of their income on shelter. Households near the lower end of this income range can only afford to rent a bachelor apartment in Calgary at average market rates. All remaining housing in the Private and Secondary Rental Markets is unaffordable. Households near the upper end of this income range have several more housing options since they can afford to rent two-thirds of the unit types in the Rental Market at average market rates. For this group, affordable options consist of the following:
A bachelor apartment in the Private Market
A one-bedroom apartment or one-bedroom row home in the Private Market or an ‘other’ one-bedroom unit in the Secondary Market
A two-bedroom apartment or two-bedroom row home in the Private Market or an ‘other’ two-bedroom unit in the Secondary Market, and
An apartment with three or more bedrooms in the Private Market. An additional challenge for some of these households is that they are living in rental housing that is considered to be inadequate because it is in need of major repair. In the Canada census, Statistics Canada (2008b: 3) asks householders to state if their dwelling is in need of regular maintenance, minor repairs, or major repairs, and provides detailed examples of each to enable respondents to properly assess their dwellings (CMHC, 1991: 3). Of the 38,610 ―target-income‖ renter households in Calgary that are spending more than they can afford on shelter, 3,400 households (9%) are also living in inadequate housing that needs major repairs (City of Calgary, 2008b: 5).

RS-01 – Affordable Rent and Home Ownership Limits for Calgary, 2010 Page 9 of 18
Even in cases where rental costs may be affordable, the type of accommodation that is available may be unsuitable for a particular household because the unit has too few bedrooms for the household size and composition (City of Calgary, 2008c: 3; and CMHC, 1991: 4). For example, a bachelor apartment, one-bedroom apartment, or one-bedroom row home in the Private Market or an ‗other‘ one-bedroom unit in the Secondary Market that may be affordable based on income would not be suitable for a family with children. As explained by CMHC (2008: 5, emphasis added):
Suitable dwellings have enough bedrooms for the size and make-up of resident households, according to National Occupancy Standard (NOS) requirements. Enough bedrooms based on NOS requirements means one bedroom for each cohabiting adult couple; unattached household member 18 years of age and over; same-sex pair of children under age 18; and additional boy or girl in the family, unless there are two opposite sex children under five years of age, in which case they are expected to share a bedroom. A household of one individual can occupy a bachelor unit (i.e. a unit with no bedroom).
Since the available data cannot be used to determine the actual number of households that experience crowding, a housing suitability index has been developed to assess the situation in Calgary. As shown in Table 5, The City of Calgary‘s crowding index has been applied to all Calgary households—renters, owners, and both groups combined. It has also been applied to all households in The City‘s three ―low-income target groups‖ that are overspending on shelter (City of Calgary, 2008c: 4-5). All index values are less than 1.0, which means that overcrowding is not a significant issue overall in Calgary, although it certainly may be a challenge for individual households.
TABLE 5. HO USI NG SUIT ABIL ITY I N CALG ARY , 2006
HOUSEHOLDS, BY TENURE
CR O W D IN G IN D E X 1
ALL HOUSEHOLDS IN CALGARY
TARGET INCOME HOUSEHOLDS THAT ARE OVERSPENDING ON SHELTER (earning < $44,000 and spending 30%+ of gross annual household income on shelter)
RE N T E R HO U S E H O L D S 0.80 0.79
OW N E R S HO U S E H O L D S 0.57 0.55
AL L HO U S E H O L D S (R E N T E R S A ND O W N E R S )
0.61 0.65
Notes:
1 Any value greater than 1.0 represents overcrowding.
Source: City of Calgary (2008c: 4-5).

Page 10 of 18 The City of Calgary, Community and Neighbourhood Services, Social Research Unit
3.1 Housing Affordability and Minimum Wage When a household‘s monthly affordable rent limit is lower than average monthly rent, housing in the Private or Secondary Rental Markets is simply not affordable. This discrepancy is especially evident for minimum wage workers. On 2011 September 1, Alberta minimum wage was increased to $9.40 per hour (HRSDC, 2011) and to only $9.05 for employees serving liquor (Government of Alberta, 2011) because they receive tips. A person employed at minimum wage who is working 40 hours per week (full-time) for 52 weeks per year (full-year) has a monthly affordable rent limit of only $489 per month. Since the 2010 average monthly rent for a bachelor apartment in Calgary was $711 per month, it is clear that the wage earner would fall significantly short of the rent that is needed to secure even the most basic form of market rental housing.
The minimum housing wage provides further insight into how low wages intersect with housing affordability. The minimum housing wage is the full-time, full-year minimum wage needed to rent apartments of various sizes at current market rates—without spending more than 30% of gross income. A related calculation shows how many full-time, full-year minimum wage workers earning the current provincial minimum wage would be needed to rent apartments of various sizes at current market rates—again without spending more than 30% of gross income (Pomeroy, 2007a; and 2007b).
The current Alberta minimum wage and 2010 average monthly rent for Private Market apartments were used to calculate the minimum housing wage for Calgary. Table 6 presents these findings, along with the number of full-time, full-year minimum wage workers (working 40 hours per week for 52 weeks per year) that are needed to rent Private Market apartments in Calgary at current market rates.
TABLE 6. M I N I M UM HO US ING WAGE FO R CALG ARY , 2010
UNIT TYPE
AVERAGE
MONTHLY
APARTMENT
RENT IN
CALGARY, 2010
M IN IM U M HO U S IN G WA G E SHORTFALL
IN HOURLY
WAGE
NEEDED TO
AFFORD
RENT
MINIMUM
WAGE
WORKERS
NEEDED
TO
AFFORD
RENT
ANNUAL
INCOME
NEEDED TO
AFFORD
RENT
MONTHLY
INCOME
NEEDED TO
AFFORD
RENT
WEEKLY
INCOME
NEEDED TO
AFFORD
RENT
HOURLY INCOME
NEEDED TO
AFFORD
RENT
BACHELOR $711 $28,440 $2,370 $547 $13.67 $4.27 1.5
1 BEDROOM $895 $35,800 $2,983 $688 $17.21 $7.81 1.8
2 BEDROOM $1,072 $42,880 $3,573 $825 $20.62 $11.22 2.2
3+ BEDROOM $1,060 $42,400 $3,533 $815 $20.38 $10.98 2.2
OV E R A L L
AV E R A G E $971 $38,840 $3,237 $747 $18.67 $9.27 2.0
Source: CMHC (2010: 13, Table 1.1.2); HRSDC (2011); and City of Calgary (calculations based on Pomeroy, 2007a; and 2007b).

RS-01 – Affordable Rent and Home Ownership Limits for Calgary, 2010 Page 11 of 18
As Table 6 shows, in order to rent a bachelor apartment in Calgary in the Private Rental Market without overspending on shelter, a person would need to earn a minimum wage of $13.67 per hour, which is an hourly shortfall of $4.27 over the current Alberta Minimum Wage of $9.40. Stated another way, 1.5 people would need to work full-time for a full-year at the current Alberta Minimum Wage of $9.40 to affordably rent a bachelor apartment in Calgary. As unit sizes increase, the situation worsens.
In order to rent a one-bedroom apartment in Calgary in the Private Rental Market without overspending on shelter, a person would need to earn a minimum wage of $17.21 per hour, which is an hourly shortfall of $7.81 over the current Alberta Minimum Wage of $9.40. Stated another way, 1.8 people would need to work full-time for a full-year at the current Alberta Minimum Wage of $9.40 to affordably rent a one-bedroom apartment in Calgary. In order to rent a two-bedroom apartment in Calgary in the Private Rental Market without overspending on shelter, a person would need to earn a minimum wage of $20.62 per hour, which is an hourly shortfall of $11.22 over the current Alberta Minimum Wage of $9.40. Stated another way, 2.2 people would need to work full-time for a full-year at the current Alberta Minimum Wage of $9.40 to affordably rent a two-bedroom apartment in Calgary. In order to rent an apartment with three or more bedrooms in Calgary in the Private Rental Market without overspending on shelter, a person would need to earn a minimum wage of $20.38 per hour, which is an hourly shortfall of $10.98 over the current Alberta Minimum Wage of $9.40. Stated another way, 2.2 people would need to work full-time for a full-year at the current Alberta Minimum Wage of $9.40 to affordably rent an apartment with three or more bedrooms in Calgary. Of note, there are fewer apartments with three or more bedrooms in Calgary—and they are often located in less accessible locations—so average monthly rent for units of this size is generally lower than average monthly rent for two-bedroom apartments.
4.0 Rental Housing Stock in Calgary
Table 7 shows the number of apartments and row homes in the Private Rental Market (by the size of the unit) and the total number of condominium apartments and all other units in the Secondary Rental Market in 2010. Overall vacancy rates for the Calgary CMA are also shown, where these are reported by CMHC (2010). All data for the rental universe are for the Calgary Census Metropolitan Area (CMA).

Page 12 of 18 The City of Calgary, Community and Neighbourhood Services, Social Research Unit
TABLE 7. PRI VAT E AND SECO NDARY RE NTAL MARKET UNI VE RS E AND VACANCY RATES , 2010
UN IT TY P E NU M B E R O F UN IT S IN CA L G A R Y CMA, B Y UN IT S I Z E TO T A L
UN IT S
OV E R A L L VA C A N C Y
RA T E BA C H E L O R 1 BE D R O O M 2 BE D R O O M 3+ BE D R O O M
APARTMENTS 1,334 17,255 15,196 1,727 35,512 3.6%
ROW HOMES 4 123 2,072 1,697 3,896 3.7%
TOTAL – PRIVATE
MARKET UNITS 1,338 17,378 17,268 3,424 39,408 3.6%
CONDOMINIUM RENTAL APARTMENTS 11,168 5.2%
ALL OTHER SECONDARY RENTAL UNITS 51,476 –
TOTAL – SECONDARY MARKET UNITS 62,644 –
GRAND TOTAL – ALL PRIVATE AND SECONDARY RENTAL MARKET UNITS 102,052 –
Source: CMHC (2010: 13, Table 1.1.1; 14, Table 1.1.3; 18, Table 2.1.1; 19, Table 2.1.3; 20, Table 3.1.1; 25, Table 4.3.2; and 26, Table 5.2).
4.1 Private Market Rental Housing Stock in the Calgary CMA
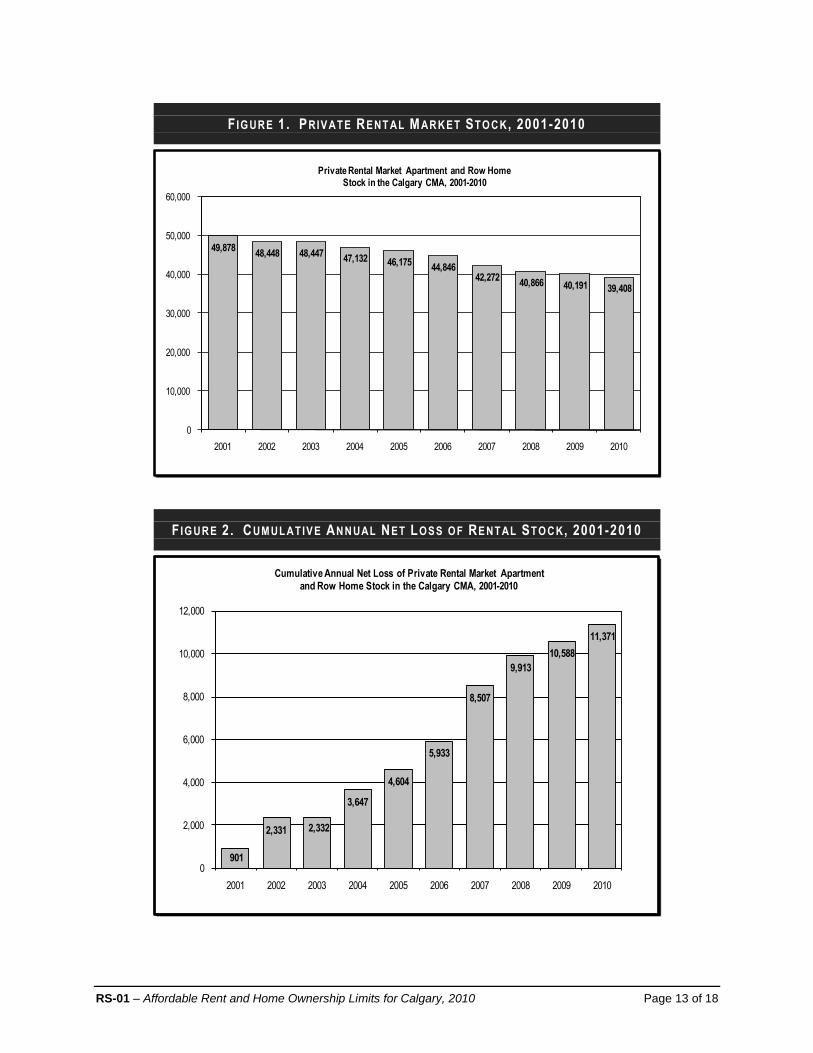
As in previous years, the Private Rental Market apartment and row home stock continued to dwindle in the Calgary CMA. Net losses are calculated by adding the total new stock built to the number of units lost to condominium conversion, demolition, or removal from the market for renovation. The Private Rental Market universe declined in 2010 to 39,408 units. While apartment stock declined by 662 units in 2010 and row home stock decreased by 121 units, three new rental units were added, for a net loss of 783 units. A total of 311 rental units were converted to condominiums, which comprised 40% of all the stock that was lost in 2010 (CMHC, 2010: 1; 4). This is a much smaller number and proportion than in previous years; indeed, the lowest since 2002. New rental construction that could offset these losses remained largely absent. Of the 241 rental units completed during the first 10 months of 2010, only three of them were added to the Private Market. The other 238 units were built as non-market (social or subsidized) housing units (CMHC, 2010: 4). Figures 1 through 4 illustrate some of these trends for 2001 through 2010.
RS-01 – Affordable Rent and Home Ownership Limits for Calgary, 2010 Page 13 of 18
F IG URE 1. PRIV ATE RENT AL MARKET STO CK , 2001-2010
49,87848,448 48,447
47,132 46,17544,846
42,27240,866 40,191 39,408
0
10,000
20,000
30,000
40,000
50,000
60,000
2001 2002 2003 2004 2005 2006 2007 2008 2009 2010
Private Rental Market Apartment and Row HomeStock in the Calgary CMA, 2001-2010
F IG URE 2. CUM UL ATIV E ANNUAL NET LOSS OF RE NTAL STO CK , 2001-2010
901
2,331 2,332
3,647
4,604
5,933
8,507
9,913
10,588
11,371
0
2,000
4,000
6,000
8,000
10,000
12,000
2001 2002 2003 2004 2005 2006 2007 2008 2009 2010
Cumulative Annual Net Loss of Private Rental Market Apartment and Row Home Stock in the Calgary CMA, 2001-2010

Page 14 of 18 The City of Calgary, Community and Neighbourhood Services, Social Research Unit
F IG URE 3. ANNUAL NET LOSS OF RE NTAL STO CK , 2001-2010
-901
-1,430-1,315
-957
-1,329
-2,574
-1,406
-675-783
-3,000
-2,500
-2,000
-1,500
-1,000
-500
0
2001 2002 2003 2004 2005 2006 2007 2008 2009 2010
Annual Net Loss of Private Rental Market Apartment and Row Home Stock in the Calgary CMA, 2001-2010
-1
F IG URE 4. RE NT AL ST OCK LOST TO CONDO CONVE RS ION , 2001-2010
1,120
561
744
1,287
1,072946
1,917
912
592
311
0
500
1,000
1,500
2,000
2,500
2001 2002 2003 2004 2005 2006 2007 2008 2009 2010
Private Rental Market Apartment and Row Home Stock Lost to Condo Conversion in the Calgary CMA, 2001-2010

RS-01 – Affordable Rent and Home Ownership Limits for Calgary, 2010 Page 15 of 18
4.2 Secondary Market Rental Housing Stock in the Calgary CMA CMHC reports that among all condominium apartments in the Secondary Market in the Calgary CMA, 11,168 of them were rental units in 2010, which was 28% of the total stock. This was an increase over the 9,425 rental units identified in 2009, which was 26% of all condo apartments (CMHC, 2010: 25). This increase is thought to be due to ―higher inventories and softer prices,‖ which has investors waiting to sell ―in anticipation of firmer resale market conditions in 2011‖ (CMHC, 2010: 5). The number of households renting ‘other’ units in the Secondary Market was 51,476 in 2010, up from 47,893 in 2009. The number of households renting ‗other‘ units in the Secondary Market exceeded the combined total of all other rental stock, with just over 50% of all renter households in Calgary living in ‗other‘ Secondary Market units. Within the ‗other‘ Secondary Market category, the share of rental households living in single-detached dwellings made up 42% of rentals, while semi-detached, row and duplex units formed 47% of the total. Although 11% of tenants lived in all remaining dwelling types combined (see Box 2), this primarily consisted of accessory suites such as basement, garage, or garden suites (CMHC, 2010: 26). 4.3 Non-Market Rental Housing Stock in Calgary People faced with paying housing costs that far exceed what they can afford to pay for market rental housing have very few options. One is to spend much more than they can afford on housing, leaving very little disposable income for food, clothing, transportation, medical supplies, recreation fees, or other necessities such as children‘s school supplies. However, that would place them in the position of being ‗one crisis away‘ from losing their existing housing. If that happens, they may become homeless. A better option would be to live in Non-Market housing, where tenants pay a maximum of 30% of their gross household income for rent. Since people living in Non-Market housing pay rent geared to income, this type of housing is affordable. The Calgary Homeless Foundation (2003: 10) explains that Non-Market housing ―provides long-term, stable and affordable housing options for households unable to afford market housing in Calgary. The extent and focus of associated support services are matched to the needs of individual tenants.‖ In 2005, The City of Calgary (2005a; and 2005b) conducted a survey of the supply of all Non-Market housing units in the city. The combined total of all Non-Market (social or subsidized) rental housing units in Calgary formed only 3.4% of all Private Market dwelling units in the city at the time. Much has changed since then, especially with the development of Calgary’s 10-Year Plan to End Homelessness, which is being implemented by the Calgary Homeless Foundation (Calgary Committee to End Homelessness, 2008). With the Plan‘s emphasis on housing first initiatives, a fair number of new and repurposed units have been added to the stock of social housing units. To provide a more accurate picture of these changes, it is hoped that an updated survey of Non-Market housing units will be completed in 2011 as part of a collaborative research project in the city.
Page 16 of 18 The City of Calgary, Community and Neighbourhood Services, Social Research Unit
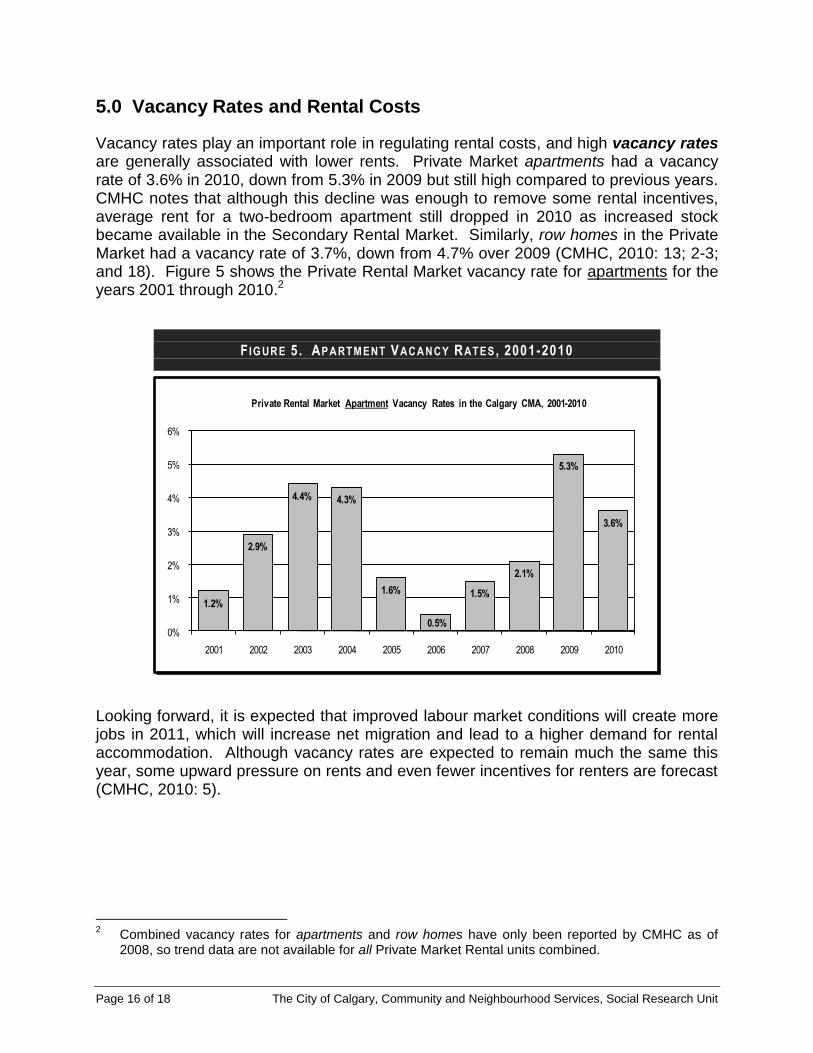
5.0 Vacancy Rates and Rental Costs
Vacancy rates play an important role in regulating rental costs, and high vacancy rates are generally associated with lower rents. Private Market apartments had a vacancy rate of 3.6% in 2010, down from 5.3% in 2009 but still high compared to previous years. CMHC notes that although this decline was enough to remove some rental incentives, average rent for a two-bedroom apartment still dropped in 2010 as increased stock became available in the Secondary Rental Market. Similarly, row homes in the Private Market had a vacancy rate of 3.7%, down from 4.7% over 2009 (CMHC, 2010: 13; 2-3; and 18). Figure 5 shows the Private Rental Market vacancy rate for apartments for the years 2001 through 2010.2
F IG URE 5. AP ARTM ENT VACANCY RATES , 2001-2010
1.2%
2.9%
4.4% 4.3%
1.6%
0.5%
1.5%
2.1%
5.3%
3.6%
0%
1%
2%
3%
4%
5%
6%
2001 2002 2003 2004 2005 2006 2007 2008 2009 2010
Private Rental Market Apartment Vacancy Rates in the Calgary CMA, 2001-2010
Looking forward, it is expected that improved labour market conditions will create more jobs in 2011, which will increase net migration and lead to a higher demand for rental accommodation. Although vacancy rates are expected to remain much the same this year, some upward pressure on rents and even fewer incentives for renters are forecast (CMHC, 2010: 5).
2 Combined vacancy rates for apartments and row homes have only been reported by CMHC as of
2008, so trend data are not available for all Private Market Rental units combined.
RS-01 – Affordable Rent and Home Ownership Limits for Calgary, 2010 Page 17 of 18
References Calgary Homeless Foundation. 2003. The Calgary Community Plan 2004-2008:
Building Paths Out of Homelessness. Calgary: Calgary Homeless Foundation. Available in PDF at www.calgaryhomeless.com.
Calgary Committee to End Homelessness. 2008. Calgary’s 10-Year Plan to End
Homelessness. Calgary: Calgary Homeless Foundation. City of Calgary. 2010. Research Summary #01 – Affordable Rent and Home
Ownership Limits for Calgary, 2009. Updated 2010 July 24. Calgary: City of Calgary, Community and Neighbourhood Services, Social Research Unit.
__________. 2008a. Research Brief #03 – Housing Affordability in Calgary. Updated
2008 December 15. Calgary: City of Calgary, Community and Neighbourhood Services, Social Research Unit.
__________. 2008b. Research Brief #06 – Housing Adequacy in Calgary. Updated
2008 December 15. Calgary: City of Calgary, Community and Neighbourhood Services, Social Research Unit.
__________. 2008c. Research Brief #09 – Housing Suitability in Calgary. Updated
2008 December 15. Calgary: City of Calgary, Community and Neighbourhood Services, Social Research Unit.
__________. 2005a. City of Calgary Survey of Non-Market Housing, January 2005.
Internal reference document (not for circulation). Calgary: City of Calgary, Corporate Properties and Buildings.
__________. 2005b. Civic Census. Calgary: City of Calgary, City Clerk‘s, Election
and Information Services Section. __________. 2002. City of Calgary: Corporate Affordable Housing Strategy.
Approved 2002 July 17 (CPS2002-57). Calgary: The City of Calgary, Corporate Properties and Community Strategies. 31 pp.
CMHC [Canada Mortgage and Housing Corporation]. 2010. Rental Market Report:
Calgary CMA. Released Fall 2010. Calgary: CMHC. __________. 2009. Rental Market Report: Calgary CMA. Released Fall 2009.
Calgary: CMHC. __________. 2008. ―Recent Trends in Housing Affordability and Core Housing Need.‖
Canadian Housing Observer 2008 (pp: 5-20). __________. 2007. Rental Market Report: Calgary CMA. Calgary: CMHC.
Page 18 of 18 The City of Calgary, Community and Neighbourhood Services, Social Research Unit
__________. 2002. Homebuying Step by Step: A Consumer Guide and Workbook. Ottawa: CMHC.
__________. 1991. Core Housing Need in Canada. Ottawa: CMHC. Government of Alberta. 2011. Minimum Wage. Edmonton: Government of Alberta,
Employment & Immigration. Safe & Fair Workplaces, Employment Standards, Standards & Definitions. Website. Accessed 2011 September 8. http://employment.alberta.ca/SFW/998.html.
HRSDC [Human Resources and Skills Development Canada]. 2011. Current and
Forthcoming Minimum Hourly Wage Rates for Experienced Adult Workers in Canada. Ottawa: HRSDC, Labour, Labour Law. Website. Accessed 2011 September 8. http://srv116.services.gc.ca/dimt-wid/sm-mw/rpt1.aspx?lang=eng.
Moore, Ian [Principal, Surveys, Canada Mortgage and Housing Corporation, Prairie and
Territories Market Analysis Centre]. 2010. Data on 2009 condominium conversion numbers for Calgary. Personal communication with Sharon Stroick. 2010 June 22.
Pomeroy, Steve. 2007a. Minimum Housing Wage 2006: Housing Continues to Move
Out of Reach for Minimum Wage Workers. Ottawa: Canadian Housing and Renewal Association.
__________. 2007b. Data on the number of minimum wage workers required to pay
only 30% of gross household income for four kinds of market rental apartments in the Calgary CMA in 2006. Personal communication with Sharon Stroick. 2007 January 10.
Statistics Canada. 2008a. Household Data 2006. Custom tabulation using 2006
Census data (20% sample) for the city of Calgary geography for non-farm, non-reserve, non-band private households with positive household income by: household income (15); tenure / shelter cost ratio (9); household type (8); Aboriginal origin of primary household maintainer (3); presence of activity limitations or reductions (3); immigrant status / period of immigration of primary household maintainer (10); and selected characteristics (31). Prepared for The City of Calgary, Community and Neighbourhood Services, Social Research Unit (City-wide license). August 2008. CD-ROM.
__________. 2008b. Specifications for Custom Census Table CRQ0100225.
Prepared for The City of Calgary, Community and Neighbourhood Services, Social Research Unit. June 2008.
__________. 2007. ―2006 Community Profiles: Calgary, Alberta.‖ 2006 Census.
Catalogue No. 92-591-XWE. Ottawa: Statistics Canada.