research report sales operations practices · 6.2 research timing and scope 22 6.3 research...
TRANSCRIPT

Research Report
Sales Operations Practices
Research underwriters
November 2015
Copyright © 2015 by the Sales Management Association. All rights reserved.

Copyright © 2014-15 the Sales Management Association. All rights reserved.2
First published November 2015.
Sales Management Association 1440 Dutch Valley Place NE Suite 990 Atlanta, Georgia 30324 USA +1 (404) 963-7992 http://salesmanagement.org
Copyright © 2014-15 The Sales Management Association, Inc.
All rights reserved; no part of this publication may be reproduced, stored in a re-trieval system, or transmitted in any form or by any means, electronic, mechani-cal, photocopying, recording, or otherwise, without prior written permission of the publishers.
Research Report: Sales Operations PracticesThis document has been prepared by The Sales Management Association for use by its members. The Sales Management Association has worked to ensure the accuracy of the information it provides to its members. This report relies upon data obtained from many sources, however, and The Sales Management Association is not engaged in rendering legal, accounting, or other professional services. Its reports should not be construed as professional advice on any particular set of facts or circumstances. Members requiring such services are advised to consult an appropriate professional. Neither the Sales Management Association nor its programs are responsible for any claims or losses that may arise from a) any errors or omissions in their reports, whether caused by The Sales Management Association or its sources, or b) reliance upon any recom-mendation made by the Sales Management Association.
Descriptions or viewpoints contained herein regarding organizations profiled in this material do not necessarily reflect the policies or viewpoints of those organi-zations.
About The Sales Management AssociationThe Sales Management Association is a global, cross-industry professional organization for sales operations, sales effectiveness, and sales leadership pro-fessions. We provide our members with tools, networking, research, training, and professional development.
Our research initiatives address topics relevant to practitioners across a broad spectrum of sales effectiveness issues. Our research is available to members on our site at www.salesmanagement.org.
In addition to research we publish best practice tools, archived webcasts, and expert content. Visit our website at http//salesmanagement.org to learn more.
Authors Robert J. Kelly Chairman The Sales Management Association
Greg ThomasManaging DirectorThe Sales Management Association

Copyright © 2014-15 the Sales Management Association. All rights reserved. 3
Research Brief: Sales Operations Practices
Contents
1 Research Summary 51.1 Study Objectives 51.2 Summary of Key Findings 5
2 Sales Operations Roles and Activities 72.1 Current Role of Sales Operations by Activity 72.2 Future Role of Sales Operations by Activity 10
3 Sales Operations Priorities, Focus, and Effectiveness 123.1 Importance of Sales Operations Core Activities 123.2 Sales Operations’ Effectiveness by Core Activity 133.3 Sales Operations Priorities 14
4 Sales Operations Departmental Structure, Headcount, and Leadership 174.1 Sales Operations Leadership Titles 174.2 Sales Operations Reporting Relationships 184.3 Sales Operations Headcount 19
5 Naming the Sales Operations Function 205.1 Most Firms Use the Name “Sales Operations.” 20
6 About the Research 226.1 Research Approach 226.2 Research Timing and Scope 226.3 Research Underwriters 22
7 Respondent Demographics 237.1 Job Role 237.2 Years of Experience and Tenure with Employer 237.3 Firm Size 247.4 Firm Performance 24

Copyright © 2014-15 the Sales Management Association. All rights reserved.4

Copyright © 2014-15 the Sales Management Association. All rights reserved. 5
Research Summary
1.1 Study Objectives
This study continues the Sales Management Association’s inquiry into sales operations’ practices, challenges, priorities, and emerging trends. This study is conducted to provide data and practice benchmarks for members of the association, many of whom are sales operations practitioners.
The term “sales operations” is used throughout this report to describe a set of activities that support sales force efficiency and effectiveness. Though many firms also use this moniker to describe internal sales support functions, its usage is not universal, as our research discovered. This report utilizes the term “sales operations” generically to refer to these various functions, even though formal names for similarly focused support departments vary significantly within firms.
1.2 Summary of Key Findings
Opportunity for Improvement: This research identified several key improvement areas for the sales operations function. Based on nine major activity categories researched, three were rated among the highest in importance, yet also rated among the lowest in current effectiveness. These activity categories are: (1) forecasting and pipeline management, (2) sales force development, and (3) incentive compensation and performance management. These areas might be considered management’s most important sales operations priorities – and improving effectiveness in these areas may provide a competitive advantage.
1
Research Brief: Sales Operations Practices

Copyright © 2014-15 the Sales Management Association. All rights reserved.6
Scope of Responsibilities: Sales operations departments are most often responsible for reporting, analytics and intelligence, and sales process. Responsibilities least likely to be assigned to sales operations include pricing and proposals, and enablement and content.
Sales Operations’ Changing Future Emphasis: The majority of sales operations departments expect to increase their future involvement in three areas: (1) reporting, (2) analytics and intelligence, and (3) forecasting and pipeline management. More than 50% of respondents indicated an increased future focus in these areas. (Exactly half of all respondents indicated an increased focus in sales process management.)
Not all firms call it “sales operations.” “Sales operations” is the most widely used departmental name; 42% of firms employ the term, whereas 58% of firms use other terms
The use of the term “sales operations” is an example of “activity” based naming, one of three prevalent naming conventions identified in this research. A total of 51% of firms use activity-based naming. “Goal” based naming includes “sales effectiveness,” “sales enablement,” or “sales productivity.” Goal-based names represent a combined 30% of respondents’ departmental names. Some firms deploy a hybrid approach, using both goal and activity naming, and this represents 18% of firms (note that numbers do not add up to 100% due to rounding).
Firms using the goal-oriented naming approach have slightly lower financial performance than firms using activity-based names, suggesting that goal-based naming may be more frequently adopted by firms with greater need for seeking business process improvement. Relative Expertise in Activities: Firms’ sales operations competency levels vary. The highest-rated competencies are sales process management, and aligning sales organization strategy. The least effective are content enablement, and events and programs.
Organizational Reporting Structure: The sales operations department reports directly to the sales function in 33% of firms, whereas in 68% of firms it reports to operations, finance, or executive leadership. Larger firms are more likely to have sales operations report to the sales function (note that numbers do not add up to 100% due to rounding).
Research Summary

Copyright © 2014-15 the Sales Management Association. All rights reserved. 7
Sales Operations Roles and Activities
This initiative identified sales operations departments’ current degree of focus in nine core activities. Respondents also provided insight into how their departments’ focus will change in the future.
2.1 Current Role of Sales Operations by Activity
2
2.1.1 Reporting, analytics and intelligence, and forecasting and pipeline management represent activities sales operations departments are most likely to manage.
Current Role of Sales Operations
32 5 761
Not Involved
Involved
Involvement Rating
Level of Involvement
Chiefly Accountable
4
Reporting
Analytics & Intelligence
Forecasting & Pipeline Mgt.
Sales Process
Incentives & Performance Mgt.
Strategy Alignment
Events & Programs
Sales Force Development
Pricing & Proposals
Enablement, Content
5.5
4.7
5.4
4.6
5.1
4.6
4.7
4.2
5.6
4.2

Copyright © 2014-15 the Sales Management Association. All rights reserved.8
This research found that sales operations departments are most likely focused in (1) reporting, (2) analytics and intelligence, and (3) forecasting and pipeline management. Additional areas of focus, in descending order of prevalence, are
1. Sales process
2. Incentive compensation and performance management
3. Aligning sales organization strategy
4. Events and programs
5. Sales force development
6. Pricing and proposals
7. Enablement and content
This study defined each of these nine activities as follows:
Reporting involves the design, management, implementation, or support of performance reporting.
Analytics and Intelligence includes sourcing data or intelligence used by salespeople; performance evaluation, analysis of results, and identification of trends using data.
Sales Process includes assessing, designing, or implementing sales processes; and establishing processes for territory, account, or call plans used by sales teams.
Forecasting and Pipeline Management includes the design, management, implementation, or support of sales forecasting processes.
Incentive Compensation and Performance Management includes quota setting for individual markets, sales people, or sales teams. It also covers sales territory assignments, re-alignments, and optimization; and design or administration of incentive compensation, contests, rewards, or recognition programs; and the establishing of performance measures.
Sales Force Development includes developing sales or sales management job descriptions or competency profiles; assessing, selecting, designing and delivering training programs for sales or sales management; managing sales onboarding processes, content, or administration; developing performance review processes and tools; and assessing salespeople or management through testing.
Sales Operations Roles and Activities

Copyright © 2014-15 the Sales Management Association. All rights reserved. 9
Pricing and Proposals includes pricing administration and proposal management including support, or administration.
Enablement and Content includes the development of collateral, sales aids, or other content used by salespeople. This also includes the design or management of content distribution platforms, such as portals, used by sales organization.
Events and Programs includes sales force implementation of programs developed by other departments (e.g., Marketing); and management of events (e.g., national sales meeting).
Research participants were asked to rate on a seven-point scale their sales operations functions’ level of involvement in each activity; a rating of “7” indicates the sales operations function is “highly accountable”, a rating of “1” equates to “no involvement.”
Sales Operations Involvement in Core Activities
Sales Process
1377
20 19 2418
3021
58
34 40
32 3833 43
1647
3427
Events & Programs
Forecasting & Pipeline Mgt.
90
80
60
100
70
50
40
30
20
10
0
Strategy Alignment
Analytics & Intelligence
Incentives & Performance
Mgt.
Reporting Sales Force Development
Pricing & Proposals
Enablement, Content
Percentage Distribution by Firm
Highly Accountable Involved Little to No Involvement
54 5348 44
43 3934 32
6064
2.1.2 Sales operations’ responsibilities include a range of strategic and tactical activities.
Examining response distribution by firm offers additional insight. Other functions within the firm are more likely to be chiefly accountable for “enablement and content,” “pricing and
Research Brief: Sales Operations Practices

Copyright © 2014-15 the Sales Management Association. All rights reserved.10
proposals,” and “events and programs.” More than half of all respondents are highly accountable for sales force reporting, analytics and intelligence, sales process management, and forecasting and pipeline management.
2.2 Future Role of Sales Operations by Activity
Interestingly, sales operations’ degree of focus is expected to increase across all activities over the next 18 months, though to varying degrees. “Reporting” and “analytics and intelligence” – activities sales operations is most likely to be responsible for currently, are also the activities with the highest expected growth in focus over the next 18 months. Expected to grow the least are “pricing and proposals,” and “enablement and content.”
Participants rated their expected change in focus using a seven-point scale, in which “7” represents “Much more involved,” and “1” “Much less involved.”
2.2.1 Sales operations departments expect to increase focus in all core activities.
Sales Operations’ Future Focus
32 5 761
MuchLess
No Change
Change in Sales Operations Focus Over Next 18 Months
MuchMore
4
Analytics & Intelligence
Reporting
Sales Process
Strategy Alignment
Forecasting & Pipeline Mgt.
Sales Force Development
Events & Programs
Enablement, Content
Incentives & Performance Mgt.
Pricing & Proposals
5.1
4.8
5.0
4.8
5.0
4.8
4.9
4.7
5.1
4.5
Less Focus More Focus
Sales Operations Roles and Activities

Copyright © 2014-15 the Sales Management Association. All rights reserved. 11
Had this research queried respondents on a comprehensive set of sales operations activities, we’d be concerned at the seeming impossibility of these results, since practitioners could not possibly increase focus on everything. The following context is important to consider: the activities included in this survey represent a core set of sales operations’ most important functions. Sales operations’ ancillary responsibilities will by necessity diminish in focus to support the focus shifts indicated toward core activities.
Suffice it to say that sales operations’ plate, already full, is expected to become fuller; and no activity currently in the core set included in this research will diminish in importance or emphasis. Where these aggregate results mirror a specific firm’s, that firm’s challenges will be two-fold: expanding capacity to address the growing importance and emphasis on sales operations’ core activities, and reducing emphasis on non-core, ancillary activities.
Reviewing the distribution of results suggests some firms are de-emphasizing specific activities, likely in an effort to increase focus on others. Activities most likely to receive less sales operations emphasis in the next 18 months are pricing and proposal management (on which 11% of respondents expect to increase focus in 18 months), and enablement and content management, on which seven percent of respondents expect diminished focus.
Sales Operations Projected Change in Focus in Next 18 Months
Sales Process
Events & Programs
Forecasting & Pipeline Mgt.
60
50
40
30
20
10
0Strategy
Alignment
Analytics & Intelligence
Incentives & Performance
Mgt.
Reporting
Sales Force Development
Pricing & Proposals
Enablement, Content
Percentage of Respondent Firms
Increasing Focus Decreasing Focus
2.2.2 Few sales operations departments see appreciable decreases in focus for core activities.
Research Brief: Sales Operations Practices

Copyright © 2014-15 the Sales Management Association. All rights reserved.12
Sales Operations Priorities, Focus, and Effectiveness
This research examines the importance of sales operations activities, and the effectiveness with which firms engage in these activities. This section highlights the top activities and looks at the relationship between activities by both importance and effectiveness.
3.1 Importance of Sales Operations Core Activities
Participants were asked to rate the importance of core sales operations activities, based on their impact on firm financial performance.
Activities rated most important are reporting; aligning sales organization strategy; forecasting and pipeline management; and sales force development. Respondents provided ratings using a seven-point scale, where “1” is “not at all important,” and “7” is “extremely important.” Activities considered least important (though still garnering ratings of five or higher on the seven-point importance rating scale) are events and programs; and enablement and content.
Reporting features as the most important sales operations role, and also the most prevalent responsibility among respondents’ sales operations departments.
3

Copyright © 2014-15 the Sales Management Association. All rights reserved. 13
3.1 Sales operations’ most important functions are reporting, strategy alignment, and forecasting and pipeline management.
Sales Operations Activities by Importance of Firm Performance
32 5 761
Not At All
Somewhat
Average Importance Rating
Extremely
4
Reporting
Strategy Alignment
Forecasting & Pipeline Mgt.
Sales Force Development
Incentives & Performance Mgt.
Analytics & Intelligence
Pricing & Proposals
Sales Process
Enablement, Content
Events & Programs
5.8
5.7
5.8
5.6
5.8
5.6
5.7
5.3
5.9
5.1
3.2 Sales Operations’ Effectiveness by Core Activity
Respondents rated their sales operations functions most effective in aligning sales organization strategy, followed by sales process management; reporting; and incentive compensation and performance management. Considered least effective (though still garnering ratings above the median value of “somewhat effective”) are enablement and content management, and analytics and intelligence.
Research Brief: Sales Operations Practices

Copyright © 2014-15 the Sales Management Association. All rights reserved.14
Sales Operations Activities by Importance of Firm Performance
32 5 761
Not At All
Somewhat
Average Effectiveness Rating
Extremely
4
Strategy Alignment
Sales Process
Reporting
Incentives & Performance Mgt.
Forecasting & Pipeline Mgt.
Pricing & Proposals
Events & Programs
Sales Force Development
Analytics & Intelligence
Enablement, Content
4.8
4.5
4.6
4.5
4.5
4.4
4.5
4.4
4.8
4.2
3.2 Analytics and intelligence garnered relatively low effectiveness ratings. This activity was also among the most prevalent responsibility assigned to sales operations, and among those expected to grow in focus over the next 18 months.
This latter activity, analytics and intelligence, is among the most prevalent responsibilities of sales operations departments, and expected to increase in focus more than almost every other core activity (second only to the related activity of reporting). Its relatively low effectiveness ratings suggest analytics and intelligence may represent an important improvement opportunity for the sales operations discipline as a whole.
3.3 Sales Operations Priorities
Considered in aggregate, respondent firms’ most important improvement priorities are in forecasting and pipeline management; incentive compensation and performance
Sales Operations Priorities, Focus, and Effectiveness

Copyright © 2014-15 the Sales Management Association. All rights reserved. 15
management; analytics and intelligence; and sales force development. These activities are rated among the highest in importance, and among the lowest in current effectiveness.
An “Importance-Effectiveness” grid was generated to better visualize the relationships between respondents’ ratings of importance and effectiveness. This analysis is useful in revealing which improvement opportunities represent priorities, based on the aggregated ratings of all respondents. As such, it offers interesting insight into the state of the sales operations function, and the priorities considered most important for the function.
The importance-effectiveness grid plots effectiveness and importance ratings for each core activity on an x-y axis, assigning effectiveness ratings to the vertical y-axis, and importance ratings to the horizontal x-axis. The two axes intersect at the respective mean value for each rating scale (a mean importance rating of 5.6, and effectiveness rating of 4.5, both on a seven-point scale); each core sales operations activity is thereby forced into one of four quadrants, as illustrated below. Activities ranked in the top 50% by importance rating are sorted on the right half of the chart; those ranked in the top 50% based on performance rating are forced to the top half of the chart.
The upper-right quadrant represents activities with relative high ratings for both importance and effectiveness. These include aligning sales organization strategy, and reporting. In relation to other activities, respondents will likely sustain focus in them.
The lower right quadrant contains activities which are relatively important yet which are not being performed with relative effectiveness. Activities in this quadrant are likely subjects for improvement initiatives. Forecasting and pipeline management, sales force development, and incentive compensation and performance management are activities that appear in this quadrant.
The lower left-hand quadrant contains resources that are neither relatively important nor performed effectively. In resource-constrained environments, reducing support, or outsourcing are frequently employed options for these activities. These may be performed at a lower threshold of capability or at that of competitive parity. Activities in this quadrant include events and programs; pricing and proposals; and enablement and content management.
Research Brief: Sales Operations Practices

Copyright © 2014-15 the Sales Management Association. All rights reserved.16
The upper left quadrant includes activities of relatively lesser importance yet which are done with relatively high effectiveness. Sales process management falls in this quadrant. Items in this quadrant are typically monitored to ensure continued effectiveness.
3.3 Five functional activities emerged as high-priority improvement opportunities for sales operations departments: pricing and proposals; analytics and intelligence; forecasting and pipeline management; sales force development; and incentives and performance management.
Importance-Effectiveness Grid
Pricing & proposals
Enablement, Content
Events & Programs
Strategy Alignment
Sales Force Development
Incentives & Performance Mgt.
4.1
4.9
5.0
x = 5.6
y = 4.5
6.0
Sales Process
Analytics & Intelligence
Forecasting & Pipeline Mgt.
Reporting
Effectiveness
Monitor
Subordinate
Sustain
Elevate
Importance
Sales Operations Priorities, Focus, and Effectiveness

Copyright © 2014-15 the Sales Management Association. All rights reserved. 17
Sales Operations Departmental Structure, Headcount, and Leadership
This research investigatedsales operations organizational topics, including governance, reporting relationships, and staffing levels.
4.1 Sales Operations Leadership Titles
The functional leader for sales operations in more than half of respondent firms has the title vice president or director;these titles make up 27% and 25%, respectively,of senior-most sales operations leader titles. Other titlesinclude manager (14%), CxO or president (13%) and senior vice president or executive vice president (8% SVP/EVP combined).
Larger firms are more likely to use the senior vice president or executive vice president title. From largest to smallest firms (based on annual sales revenue), the prevailing pattern in senior-most sales operations leadership titles range from senior vice president for the largest firms, to CxO, vice president, director, and manager in the smallest firms.
4.1 “Senior vice president” is most frequently used by larger firms in titling the sales operations head. Smaller firms are more likely to use a manager title.
Relation Between Firm Size and Head of Sales Ops
32 5 761
Less than US$1 million
Firm Size (Annual Revenue)
More than US$10 billion
4
SVP
CxO
VP
Director
Manager
4.6
4.6
4.4
3.9
4.8
4
Research Brief: Sales Operations Practices
Copyright © 2014-15 the Sales Management Association. All rights reserved.18
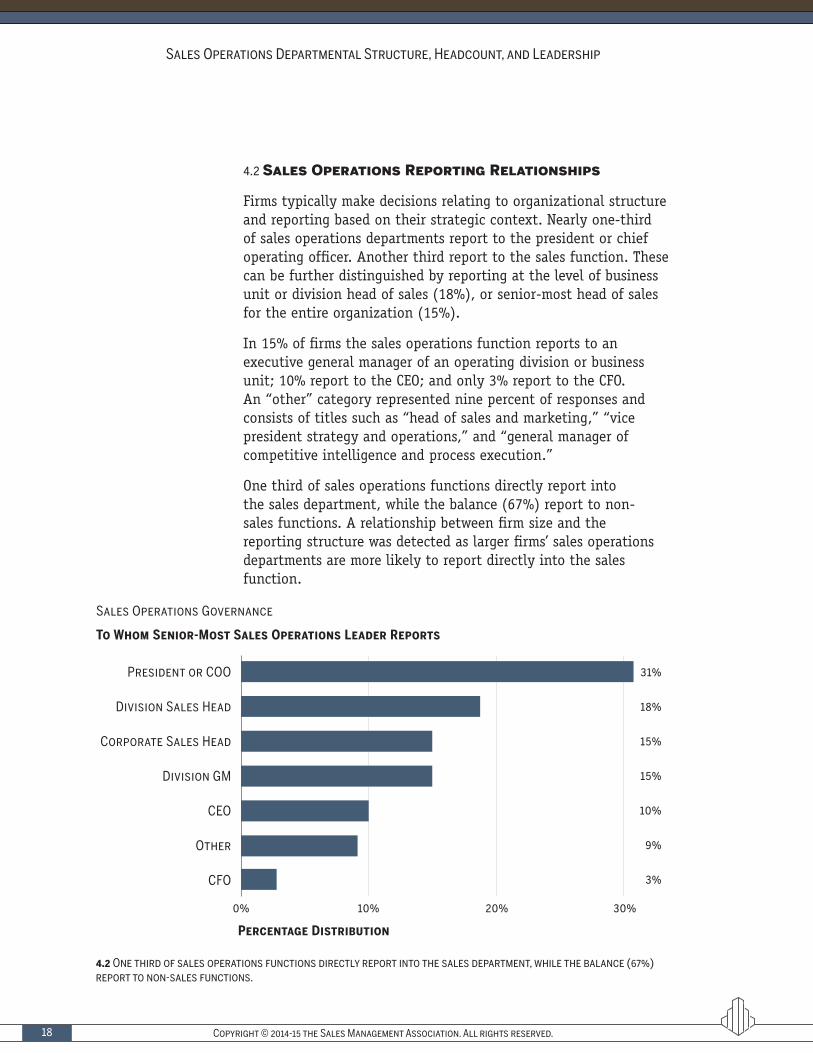
Sales Operations Governance
Percentage Distribution
President or COO
Division Sales Head
Corporate Sales Head
Division GM
CEO
Other
CFO
18%
15%
15%
10%
9%
3%
31%
To Whom Senior-Most Sales Operations Leader Reports
0% 10% 20% 30%
4.2 Sales Operations Reporting Relationships
Firms typically make decisions relating to organizational structure and reporting based on their strategic context. Nearly one-third of sales operations departments report to the president or chief operating officer. Another third report to the sales function. These can be further distinguished by reporting at the level of business unit or division head of sales (18%), or senior-most head of sales for the entire organization (15%).
In 15% of firms the sales operations function reports to an executive general manager of an operating division or business unit; 10% report to the CEO; and only 3% report to the CFO. An “other” category represented nine percent of responses and consists of titles such as “head of sales and marketing,” “vice president strategy and operations,” and “general manager of competitive intelligence and process execution.”
One third of sales operations functions directly report into the sales department, while the balance (67%) report to non-sales functions. A relationship between firm size and the reporting structure was detected as larger firms’ sales operations departments are more likely to report directly into the sales function.
4.2 One third of sales operations functions directly report into the sales department, while the balance (67%) report to non-sales functions.
Sales Operations Departmental Structure, Headcount, and Leadership

Copyright © 2014-15 the Sales Management Association. All rights reserved. 19
Sales Operations Staffing Ratio
Percentage Distribution
Greater than us$10 billion
us$1 to $10 billion
us$250 to $1 billion
us$100 to $250 million
us$10 to $100 million
us$1 to $10 million
9%
13%
10%
10%
10%
3%
Sales Ops Staff as a Percent of Sales Force Headcount, By Firm Size (Annual Revenue)
0% 10%5% 15%
4.3 Sales Operations Headcount
On average, respondent firms staff one sales operations employee, or full-time equivalent (FTE), for every 10 salespeople. Very large firms (those above US$10 billion in annual sales) appear to achieve staffing ratios far lower; they staff one sales operations FTE for every 33 salespeople.1
1 This specific analysis is based on a subsample of the data collected. The smaller number of observations limits the accuracy of this analysis, so it’s recommended to confirm these directional insights with further evidence.
4.3 Very large firms achieve far lower sales operations staffing ratios than smaller firms.
Research Brief: Sales Operations Practices

Copyright © 2014-15 the Sales Management Association. All rights reserved.20
Naming the Sales Operations Function
5.1 Most Firms Use the Name “Sales Operations”
Names for the “sales operations” vary across firms (the name “sales operations” is used generically throughout this report.).
5
What Do You Call Sales Operations in Your Firm?
Sales Operations
Sales Effectiveness
Sales Productivity
Sales Enablement
Commercial Effectiveness
Other
18%
13%
13%
2%
12%
42%
Percentage Distribution of Responses
0% 10% 20% 30% 50%40%
5.1.1 “Sales operations” is the most prevalent functional name utilized.
This research identified three prevalent naming approaches: one based on activity, e.g., “sales operations;” one based on a descriptive departmental goal, and a combination of both. Examples of goal naming include “sales effectiveness,” “sales productivity,” “sales enablement,” and “commercial effectiveness.” The findings show that 51% of firms use activity naming, 30% use goal naming, and 18% use a hybrid approach (note that these do not add up to 100% due to rounding).

Copyright © 2014-15 the Sales Management Association. All rights reserved. 21
It’s indicated that the firms using the goal naming designations have a stronger mandate to improve performance based on the need to improve. These firms exhibited slightly lower firm performance, as measured by revenue growth, compared to firms with the activity name (4.97 versus 5.09 on a scale of 1 to 7, where 7 is the highest growth).2
2 Note this specific analysis is based on a subsample of the data. Future evidence is recommended to support these directional findings.
5.1.2 Utilizing an “activity” naming convention – that is, naming the sales operations function for the activity it’s responsible for, is more widely used than the other predominant naming approach, “goal”-based naming.
Nomenclature System in Use by Firms
Percentage Distribution of Use by Firms
Goal Named (Sales Effectiveness, Sales
Productivity, Etc)30%
Hybrid18%
Activity Named (Sales Operations,
Market Operations)51%
Research Brief: Sales Operations Practices

Copyright © 2014-15 the Sales Management Association. All rights reserved.22
About the Research
6.1 Research Approach
This study aggregates participating firms’ responses to a web-based survey. The Sales Management Association developed the survey and recruited participants from the association membership base and broader audience of sales managers and sales operations professionals. In exchange for participating in the research the respondents are offered advance copies of the detailed study report.
Before reporting results, the data is cleaned thereby eliminating invalid or ineligible responses, and sometimes respondents are contacted to clarify their responses if questions arise. Survey results are only reported in aggregate, and never in a way that would compromise the identity of any single respondent. All individual respondent data are treated with strict confidentiality.
6.2 Research Timing and Scope
This research represents summarized data from 108 participating firms, directly employing more than 13,000 sales managers and 174,000 sales professionals. Data was collected between 1 March and 10 September, 2015. Respondent demographics and descriptive information is summarized in the following section.
6.3 Research Underwriters
This study was made possible in part through the underwriting support of Brainshark, InsightSquared, and SAP. Sales Management Association underwriters provide annual financial support to the Sales Management Association. Underwriters may suggest research topics, participate in ongoing research projects, and encourage participation or otherwise promote research initiatives.
Underwriters are not involved with research administration, data collection, analysis, interpretation, or report development, unless explicitly noted in the report. Also, unless noted, underwriters do not pay a research-specific fee or directly commission research initiatives.
6

Copyright © 2014-15 the Sales Management Association. All rights reserved. 23
Respondent Demographics
7.1 Job Role
Respondents are asked to indicate their job function. Anyone with a title of salesperson is disqualified from participating in the survey. Of the respondents who completed the survey 64% work in the sales operations function either as leaders (37%) or as sales operations professionals (27%). Sales management represents 27% of the reported pool, and consists of sales seaders (who manage sales managers; 12%) and sales sanagers (15%).
7
Research Brief: Sales Operations Practices
Respondents’ Job Role
Senior-most sales operations leader
Sales operations professional
Sales manager
Senior sales leader
Manager in function other then sales
Other
28%
15%
12%
4%
4%
31%
Percentage Distribution
0% 10% 20% 30%
7.1 Almost half (46%) of respondents were sales leaders (first-line managers or higher); an additional 28% are sales operations managers.
7.2 Years of Experience and Tenure with Employer
For the respondents who indicated their role is in the sales operations function, the survey requested additional employment details. This includes:
• How many years have you worked in your current position?
• How many years have you worked for your current employer?
• How many years have you worked in a sales operations role?

Copyright © 2014-15 the Sales Management Association. All rights reserved.24
Respondents’ Firm Size
Annual Revenue ($USD)
$1 billion to $10 billion
18 %
$100 million to $1 billion
39 %
$10 million to $100 million
23 %
Less than $10 million
11 %
More than $10 billion
8%
The average experience in sales operations is 9.6 years; the average experience with current employer is 7.6 years; and the average tenure in current position is 4 years. This indicates that most respondents have been promoted while working at their current employer, and have a depth of experience in sales operations that would positively impact the richness of the data collected.
7.2 Respondents’ average tenure with their current employer is 7.6 years.
Respondents’ Experience
Current Position In Sales OpsWith Employeer
9.6
7.6
4.0
10
5
0
Average Number of Years
7.3 Sixty-four percent of respondent firms had annual revenues in excess of US$100 million.
Respondent Demographics
7.3 Firm Size
Responding firms’ size ranged from small to very large. About one-third of participating firms are under US$100 million in annual revenue, and 26% have annual revenue in excess of US$1 billion.
7.4 Firm Performance
The survey requests firm performance data from the respondents. This provides a means of checking the performance against norms to ensure there is good cross-sectional representation across firms.
Respondents are asked to report achievement of revenue objectives, achievement of profit objectives, and overall revenue growth over the last 12 months. The data collected for this project falls within a relatively normal distribution in comparison to other projects.

Copyright © 2014-15 the Sales Management Association. All rights reserved. 25
Research Brief: Sales Operations Practices
7.4.1 Seventy-two percent of respondent firms met or exceeded their annual revenue objective.
7.4.2 Seventy-eight percent of respondent firms met or exceeded their annual profit objective.
Respondents’ Sales Objective Achievement
30
20
10
01 2 6 743 5
Percentage Distribution of Firms
Firm Performance
Far Below Goal Far Above GoalMet Goal
Respondents’ Profit Objective Achievement
40
20
10
01 2 6 743 5
Percentage Distribution of Firms
30
Firm Performance
Far Below Goal Far Above GoalMet Goal
7.4.3 Just eight percent of respondent firms experienced declining annual revenue.
Respondents' Year-Over-Year Sales Growth
50
40
20
10
01 2 6 743 5
Percentage Distribution of Responses
30
Firm Performance
Far Below Prior Year Far Above Prior YearNo Change