research report - pdf.usaid.govpdf.usaid.gov/pdf_docs/pnadl271.pdf · research report...
TRANSCRIPT
Research Report
Socio-economic Baseline studies Agroforestry and Sustainable Vegetables Production
in Southeast Asian Watershed Case Study: Nanggung Sub-district, Bogor, Indonesia
Kusuma Wijaya, Suseno Budidarsono, and James Roshetko

Copyright ICRAF Southeast Asia Further information please contact:: World Agroforestry Centre Transforming Lives and Landscapes ICRAF Southeast Asia Regional Office Jl. CIFOR, Situ Gede, Sindang Barang, Bogor 16680 PO Box 161, Bogor 16001, Indonesia Tel: 62 251 625415, fax: 62 251 625416 Email: �[email protected] ICRAF Southeast Asia website: �Hhttp://www.icraf.cgiar.org/sea or �Hhttp://www.worldagroforestrycentre.org/sea Text layout: Kusuma Wijaya

Acknowledgments
This research report is a farm/household level assessment focusing on smallholder vegetable farming,
inclusive of a household budget analyses, in Nanggung Sub-district, Bogor District, West Java, Indonesia
as part of the SANREM CRSP ‘Agroforestry and Sustainable Vegetable Production in Southeast Asia
Watersheds’ program. The program is implemented by a consorsium of international and national
organizations under the coordination of North Carolina A&T State University. In Indonesia the program is
coordinated and lead by the World Agroforestry Centre – ICRAF Southeast Asia and Bogor Agricultural
University. This study was conducted by ICRAF. The authors express gratefully thanks to M Rizqon,
Yogi Firdaus, and Nurpiansyah who contributed to data collection.


- iii -
Table of Contents
�HAcknowledgments ............................................................................................................ ��Hi �HList of Tables and Figures ............................................................................................... ��Hiv �HIntroduction ....................................................................................................................... ��H1 �HMethod ................................................................................................................................ ��H3 �HFindings .............................................................................................................................. ��H5
�HPhysical characteristics ................................................................................................. ��H5 �HInfrastructure and public utilities ............................................................................... ��H6
��Ha) Transportation .................................................................................................. ��H6 ��Hb) Public utilities ................................................................................................... ��H6 ��Hc) Market ................................................................................................................ ��H7 ��Hd) Education .......................................................................................................... ��H7
��HEconomic activities........................................................................................................ ��H7 ��HDemography .................................................................................................................. ��H9 ��HAssets .............................................................................................................................. ��H13
��Ha) Housing ............................................................................................................. ��H13 ��Hb) Landholdings and plot history....................................................................... ��H14 ��Hc) Other assets ....................................................................................................... ��H18
��HIncome and Expenditure .............................................................................................. ��H18 ��Ha) Income................................................................................................................ ��H19 ��Hb) Expenditure....................................................................................................... ��H22
��HFarming System Characteristics .................................................................................. ��H23 ��Ha) Physical Characteristics ................................................................................... ��H23 ��Hb) Labour and External Inputs............................................................................ ��H26 ��Hc) Farm Outputs .................................................................................................... ��H29 ��Hd) Gender Roles in Agricultural Undertaking.................................................. ��H32
��HConcluding remarks......................................................................................................... ��H34 ��HReferences .......................................................................................................................... ��H37 ��HAnnex .................................................................................................................................. ��H38

- iv -
List of Tables and Figures
Tables ��HTable 1. Characteristics of three sample villages.................................................................. ��H3 ��HTable 2. Population and Sample Size ..................................................................................... ��H4 ��HTable 3. Family Size, age structure and labor force by Village........................................... ��H9 ��HTable 4. Percentage distribution of respondent and family member by occupation ...... ��H11 ��HTable 5. Percentage distribution of Respondents and Family members
by educational attainment and elementary school enrolment rate..................... ��H12 ��HTable 6. Percentage distribution of respondents’ houses by physical attributes. ............ ���H13 ��HTable 7. Profile of surveyed households according to landholdings by village
and land use type ....................................................................................................... ���H15 ��HTable 8. Ways of obtaining the land by land status ............................................................. ���H16 ��HTable 10. Land use type before owned and recent................................................................. ���H17 ��HTable 11. Other assets ................................................................................................................. ���H18 ��HTable 12. Households’ Income and average time spent by source of income
and by village sample................................................................................................ ���H20 ��HTable 13. Descriptive statistics of family income of the surveyed households
and people under poverty line ................................................................................. ���H20 ��HTable 14. Households’ expenditure by items (per month).................................................... ���H22 ��HTable 15. Households’ expenditure by items (per month).................................................... ���H22 ��HTable 16. Physical Characteristics of plot controlled by household by land use type ...... ���H23 ��HTable 17. Physical Characteristics of plot controlled by household by Village.................. ���H24 ��HTable 18. Vegetables Species Cultivated by surveyed household (by landuse types) ...... ���H25 ��HTable 19. Trees and Annual Crops Species combination found in household survey...... ���H25 ��HTable 20. Number of Household experienced with Tree-annual crop Farming System . ���H26 ��HTable 21. Level of Labour Input by land use type.................................................................. ���H26 ��HTable 22. Labor inputs by land holding size and land use type........................................... ���H27 ��HTable 23. Level of External Input by type of land use type................................................... ���H27 ��HTable 24. Farm outputs by land use type (per plot) ............................................................... ���H29 ��HTable 25. Farm income by land use type (per ha) .................................................................. ���H30 ��HTable 26. Marketable commodities and the marketing chain used
(in percentage by commodities) ............................................................................... ���H31 ��HTable 27. Average Level of Labour Input by land use type (per plot) ................................ ���H32 ��HTable 28. Who control the expenditure for Agricultural inputs........................................... ���H32 ��HTable A1. Land Uses in Kecamatan Nanggung (ha).............................................................. ���H39 ��HTable A2. Physical Infrastructure and Public Utilities of Kecamatan Nanggung .............. ���H40 ��HTable A3. Household Income by Source of Income ................................................................ ���H41 ��HTable A4. Vegetables Species Cultivated by surveyed household
(by landuse types and Hectare)................................................................................ ���H42 Figures ��HFigure 1. The Study Site ............................................................................................................. ���H2 ��HFigure 2. The Villages Map........................................................................................................ ���H5 ��HFigure 3. Cumulative distribution of the surveyed household by landholding size ........ ���H16 ��HFigure 4. Plot samples utlization Before and during ownership ......................................... ���H17 ��HFigure 5. Cumulative distribution of the surveyed household by Income......................... ���H21

- 1 -
Introduction
This report is a farm/household level assessment focusing on vegetables farm and household budget
analyses, part of the SANREM CRSP program ‘Agroforestry and Sustainable Vegetable Production in
Southeast Asia Watersheds’ in Indonesia implemented by World Agroforestry Centre – ICRAF Southeast
Asia and Bogor Agricultural University. It provides an analytical basis for socio-economic impact
assessment of integrated vegetable-agroforestry systems. The basic socio-economic data collected
comprised of demographic data, farm characteristics, households’ income and expenditure, gender roles,
and labor availability. The data generated by this study will be used for economic analysis of vegetable
farming, specifically: (a) analysis of the current of demographic data of farmers, and (b) analysis of the
current of vegetable farm practices in social and economic.
The study was conducted in Kecamatan Nanggung, a sub-district located in the western part of West Java
Province. Kecamatan Nanggung, endow with relatively good accessibility to two lucrative urban centers
of Bogor and Jakarta, rich natural resources of forest and mineral, and an ideal climate for agricultural
development. Those endowment hold advantages to support market-based agricultural commodities
development through vegetables agroforestry innovation. Farmers in this sub-district are primarily
smallholders on or below the poverty line with access to less than one hectare of land. They have
limited access to professional technical assistance and poor market linkage, particularly to more lucrative
urban and regional market nearby Bogor and Jakarta.

- 2 -
Figure 1. The Study Site
KECAMATAN NANGGUNG

- 3 -
Method
Working hypothesis of the study is that the socio-economic characteristics of farmers’ household
influence the type of their vegetable farm system and its economic productivity. The data collected by
this survey, therefore, comprise of three interrelated aspects: (1) socio-economic aspect of households
farmers, such as demographic, education, employments, landholdings, incomes and expenditure; (2)
vegetable farming and agricultural activities and system of production; and (3) market aspects that will be
focusing on marketing practices of agricultural and farm production.
A sample household survey technique was selected to accomplish the study and was carried out in June -
July 2006. The survey was conducted in three sample villages (out of the sub-districts ten villages) that
were purposively selected according to their potential for vegetable production, their physical
characteristics and demography Table 1 presents the three sample villages and their key characteristics.
Table 1. Characteristics of three sample villages
Attributes Hambaro Parakan Muncang Sukaluyu Kecamatan
Nanggung
Physical characteristics 1. Altitude (m above sea level) 400 – 700 300 – 400 300 – 700 200 – 1800 2. Area (ha)
~ Total Area 355.78 605.2 207.3 10,999.10 ~ Agricultural Land (Excluded national park) 270 516.8 142.75 7,022.60 ~ Paddy fields 225 268.8 7.75 1,740.70 ~ Ladang/Kebun 45 248 87 1,836.50
Demography ~ Population (person) 6,044 10,722 4,530 75,109 ~ Number of households (hh) 1,268 1,536 1,047 19,321 ~ Population Density (ps km-1) 1,699 1,772 2,185 683 ~ Agriculture Density (ps ha-1) 22 21 32 11
Accessibility (km) ~ Distance to Nanggung Market 6.5 2 6 ~ Distance to Leuwiliang Market 12 10 11 ~ Distance to national park 23 – 24 18 – 19 22 – 23 ~ Distance to State Forest Company (SFC)
Land 2 – 3 8 – 9 1 – 2 ~ Distance to Gold Mining 11 – 12 11 – 12 10 – 11
Source: Survey data
A total of 185 households were selected in three sample villages to be interviewed. Within each
household the head of household, defined as adult with significant decision-making authority in the
households’ financial matters, were interviewed. Multistage Purposive sampling technique was applied

- 4 -
in this survey; with the intended target population being farmers who control land and practice vegetable
farming. Households cencus was done in the three villages, of the 4,302 households, 2,940 households
control land. The household samples were selected in accordance with landholding size. The population
is divided into six subpopulations (strata) base on land holding size. Proportionally with population
percentage, household samples are randomly selected from each stratum. Only household with vegetable
farming practice experience selected as sample respondent.
Table 2. Population and Sample Size
Hambaro Parakan Muncang Sukaluyu Total
1. Inhabitants of Village 1,257 1,880 1,165 4,302
2. Population of the Study (Households controlling land)
577 1,545 818 2,940
3. Sample by Land Size (m2)
n Pop
n samples
(% of Pop)
n Pop
n sampl
es
(% of Pop)
n Pop
n sample
s
(% of Pop)
n Pop
n sampl
es
(% of Pop)
5 – 100 194 20 (3.5) 670 26 (1.7) 128 10 (1.2) 992 56 (1.9) 101 – 1000 267 28 (4.8) 620 24 (1.6) 169 12 (1.5) 1056 64 (2.2) 1001 – 2000 72 7 (1.2) 149 6 (0.4) 140 10 (1.2) 361 23 (0.8) 2001 – 4000 28 3 (0.5) 71 3 (0.2) 152 11 (1.3) 251 17 (0.6) 4001 – 6000 9 2 (0.3) 13 2 (0.1) 102 8 (1.0) 124 12 (0.4)
> 6000 7 2 (0.3) 22 2 (0.1) 127 9 (1.1) 156 13 (0.4) Total (households) 577 62 (10.7) 1545 63 (4.1) 818 60 (7.3) 2940 185 (6.3)
Source: Survey data
It needs to note that prior to the survey, a village level study was carried out applying Rapid Rural
Appraisal (RRA)�F
1 technique to gather data and information about Kecamatan Nanggung as basis for
village selection (Budidarsono et al. 2006).
1 RRA consist of short, intensive and informal field surveys that focuses on people own views of their problem (Khon Kaen University 1987;
Chambers et al, 1989). Generally, the method involves open-ended exploration of important issues and more focused understanding on important themes from key informants’ perspectives. Two data collection techniques were applied i.e., field observation and in-depth interview with key informants using semi structured interview guide.

- 5 -
Findings
Physical characteristics Kecamatan (sub-district) Nanggung, located in the western part of West Java Province, is endowed with
good accessibility to two lucrative urban centers, about 100 km away from Jakarta and about 45 km away
from Bogor. The Sub-district covers a total area of 109.99 km2, spans from Bogor – Rangkasbitung
intercity road in the North to the mountain ranges of Gunung Halimun National Park in the South (See
Figure 2). Topographically the area constitutes of uplands, characterized with gently undulating to steep
landscape with the altitude is ranging between 400 and 1800 m above sea level. Annual rainfall is varies
between 3,000 mm to 4,000 mm and the average annual temperature ranging between 22o C and 34o C.
Figure 2. The Villages Map

- 6 -
The sub-district includes 7,022.3 (63.8%) hectare of arable land�F
2 comprised of paddy field (1,740.7 ha.),
ladang/kebun (1,836.5 ha.), community forest (144 ha.), and Perhutani/State Forest Corporation (SFC)
land (2,050 ha.). The remaining area is housing and other infrastructures and other uses . Table A1 in
the annex presents details of the land uses figures. A closer look at Table A1, combined with
information provided by kecamatan officers, enables us to assume that all paddy fields, ladang/kebun
lands and community forests are privately owned. In total these privately held (farmer owned) lands
compose 3,721.3 ha (52.3%). The rest (47.7%) are officially under the management of SFC and other
large scale plantations. However, discussion with farmers/government officials and observation found
that there are patches of government land that is being cultivated by farmers, however detailed data is not
available to quantify this situation.
Infrastructure and public utilities It is commonly agreed that infrastructure such as transportation infrastructure, domestic water and
electricity supply, marketing facility and telephone line are essential for economic development as well
as upliftment of the population. Table A2 of the Annex provides an overview of physical infrastructure
available in the study area.
a) Transportation There are 70 km paved/asphalted road (road density 636 m/km2) categorized as all weather road that
passable for four-wheeled vehicle, connecting most villages of Kecamatan Nanggung to the provincial
road network (Bogor – Rangkas Bitung). There are also graveled and dirt roads connecting all
settlements in this study area to the main asphalted road network. Road density of those two type of
roads are 1,004m/km2 and 1,058m/km2. Unpaved (dirt and gravel) roads may have limited accessibility
by four-wheeled vehicles, particularly during rainy periods. Reliable access to some of these unpaved
roads may be restricted to four-wheel-drive vehicles or motorcycles. There is ojeg�F
3 services (public
transportation by motorcycles) available to all villages. Four wheel public transport, largely restricted to
the paved roads, is available daily, transporting people and goods from kecamatan’s market canters in
Curug Bitung and Nanggung to the nearest bigger market centre in Leuwiliang and vice versa.
b) Public utilities Statistics of kecamatan Nanggung records that there are 7,619 (43.4%) out of 19,321 households has
electricity for their houses (Kecamatan Nanggung. 2006). The rest use privately owned power generator
or just kerosene lamp. Regarding telephone line, PT. Telkom serves seven out of ten villages of
Kecamatan Nanggung. There are 1,010 households (5.2%) with private telephone lines and there are
four private enterprises (concessions) thata provide public telephone services (wartel).
Clean water services provided by the local government (PDAM) is available in the sub-district. But it
only serves a few (2%) households in two villages (Nanggung and Parakan Muncang). Most people in
Kecamatan Nanggung get clean water for domestic use from springs or shallow wells. 2 Land that suitable for cultivation 3 a transportation mode using motorbike; cost per trip (service) depend on the distance and road condition.
- 7 -
c) Market Four markets service the sub-district. Three markets are within the kecamatan boundary – the weekly
Nanggung weekly market, twice a week Curug Bitung market, and daily Cibeber market. The largest
readily accessible market is the daily market in the neighboring sub-district of Leuwiliang.
d) Education Based on Kecamatan Nanggung Monthly Report (March, 2006), there were 44 primary schools in ten
villages, with 157 teachers and 8,780 pupils, and a junior secondary school (SLTP) located in kecamatan
centre with 15 teachers and 439 pupils. All primary and juniors secondary school are public school.
There is also a private senior secondary school, with 14 teachers and 78 pupils. The education situation
of Kecamatan Nanggung will be elaborated in further detail using demographic data of the surveyed
household.
Economic activities Agriculture is an economic mainstay of Nanggung population. According to the Statistics of Kecamatan
Nanggung, 63.4% of working population (economically active population) engages in agriculture, higher
than national data (46.3%) (Budidarsono et al. 2006). Food production is main focus of agriculture
activity in this study site and paddy cultivation constitutes an important farming activity in ‘wetland’,
while maize, cassava, sweet potatoes and vegetables and dry-land paddy are common on dry upland
areas.
Where ever possible, farmers cultivate paddy continuously for their own consumption. Paddy rice is
cultivated in flood plains and even in a steep land that can be irrigated (by creeks or springs). All paddy
rice areas are terraced. Although food security is the main objective of rice cultivation, some rice is also.
Paddy field in Nanggung covers an area of 1,741 hectare (15.83%) plus some area within Perhutani land.
Two private plantation companies operate in the sub-district : (1) a tea plantation (971 ha) in Malasari,
purchased by PT. Sari Wangi in 2002 from the previous owner (PT Nirmala Agung); and (2) a rubber
plantation run by PT Hevea Indonesia (94 ha). The rubber plantation was established in 1994 but
stopped operating in 2000; some of the land in the rubber plantation is cultivated by local farmers.
Mineral extraction also exists in the study area, specifically sand, bentonite and gold mining. Sand
mining is found in Sukaluyu and Kelong Liud, while bentonite mining is mainly in Curug Bitung and
Cisarua, with the bentonite collector based in Curug Bitung. Although PT Aneka Tambang has
exclusive legal rights to gold mining operations in the sub-district, traditional household level gold
extraction operations are common in the villages neighboring PT. Aneka Tambang operations.
Traditional gold extraction operations are called gurandil�F
4, and considered illegal government authorities.
No official statistics exist regarding the number of gurandil. Gurandil enterprises claim they legally
scavenge for gold from the wastes of PT Aneka Tambang. This waste, primarily in the form of mud, is
4 Gurandil is a sundanese word. This term is used to mention the people who work as illegal gold mining.

- 8 -
sold by the company for Rp 90,000/50-kg-sack. However the company claims that till, which has not yet
been processed for gold extraction, is often stolen from the concession area and sold for up to Rp
200,000/50 kg-sack, with price depending on the quality of the till.

- 9 -
Socio Economic Characteristics
Demography Population statistics of Kecamatan Nanggung shows that total population at present (March 2006) as
75,109 inhabitants, 104.1 sex ratio (meaning there are 104 males for every 100 females) in 19,321
households. Population growth during the last three years (since 2003) was 0.40% per year; it is lower
than West Java Province (2.20%) and even than national growth (1.50%) (BPS, 2003). Population
density of the area is 683 persons per square kilometers (ps.km-2) which is lower than for West Java in
year 2003 (1,100 ps.km-2) . At village level, population density varies from 155 ps.km-2 in Malasari (the
upper most village) to 2,347 ps.km-2 in Kalong Liud. Looking at agricultural density (ratio between
number of people to arable land), the figures indicate that agriculture intensification is necessary in many
villages of Kecamatan Nanggung. Agricultural density of Kecamatan Nanggung is 11 ps/ha, while at
village level the ratio varies from 6 ps ha-1 (Malasari) to 33 ps ha-1 in Sukaluyu. Seven out of 10 villages
are above the kecamatan average.
Regarding demographic characteristics of the household samples, the study considered three aspects to
describe: household size, age structure and labor force. These are summarized in Table 3. Total
population of households surveyed was 960 persons. There is no significant different in household size
among the three sample villages, which ranges from 1 to 12 persons, and averages 5.2 per households, it
is higher than West Java Province (3.5) and even than national data (3.8) (BPS, 2003). In further detail,
however, Sukaluyu is the highest in number of households with household size of four persons or less
(48.3% of the sample households), while in Hambaro and Parakan Muncang, 33.9% and 33.3% of sample
households surveyed. There are extended families among the household surveyed. About five
percentages of household sample in all villages are extended family.
Looking at the age structure, 66.1% of family member of the household samples are of working age or
part of the economically active population (15 to 65 years old), higher than West Java Province (60.6%)
and even than national data (65.7%) (BPS, 2003). Comparing the three villages, Parakan Muncang has
the highest proportion of the working age population (72.3%), thus the dependency ratio�F
5 of the
households in Parakan Muncang is the lowest. This indicates that labor force�F
6 of Parakan Muncang is
higher than the two other villages.
Table 3. Family Size, age structure and labor force by Village
Hambaro Parakan Muncang Sukaluyu Total
n = 62 n = 63 n = 60 n = 185
5 Ratio indicating the number of dependants family members (aged 0-14 and over the age of 65) to the total working age population (aged 15-64) 6 The term ‘labor force’ in this study is identified as working age/economically active population, hence age group of 15-65 years old

- 10 -
Family member 1. Total household members (persons) 343 328 289 960
2. Sex Ratio 111.73 105.00 97.95 105.13 Male 181 168 143 492
Female 162 160 146 468 3. Household Size
1 – 4 21 33.9% 21 33.3% 29 48.3% 71 38.4% 5 – 8 32 51.6% 40 63.5% 26 43.3% 98 53.0% > 9 9 14.5% 2 3.2% 5 8.3% 16 8.6%
4. Range Household Size (persons/household) 2 – 11 1 – 12 2 - 10 1 - 12
5. Average family size 5.5 5.2 4.8 5.2 6. Nuclear Family Member 330 96.2% 311 94.8% 276 95.5% 917 95.5% 7. Extended Family Member 13 3.8% 17 5.2% 13 4.5% 43 4.5%
Age Structure
< 15 121 35.3% 79 24.1% 97 33.6% 297 30.9% 15 – 65 216 63.0% 237 72.3% 182 63.0% 635 66.1%
> 65 6 1.7% 12 3.7% 10 3.5% 28 2.9% Labor Force
- Proportion of Labor Force 216 63.0% 237 72.3% 182 63.0% 635 66.1% - Average labor force per household 3.5 3.8 2.9 3.4
Dependancy Ratio 58.8% 38.4% 58.8% 51.2% Source: Household survey data
In relation to respondents’ occupation, as presented in Table 4, most of the respondents are self employee
(working for themselves) as farmers, carpenters and traders/merchants or in home industries; very few of
the respondents work as employees such as civil servants or for private companies. In general, most of
respondents (59.4%) engage in agriculture as their main occupation. But of the other family members’ of
the household surveyed only 7.1% consider farming to be their main occupation. Overall, 17.1% of
surveyed population engage in agriculture as their main occupation.

- 11 -
Table 4. Percentage distribution of respondent and family member by occupation
Hambaro Parakan Muncang Sukaluyu Sample Villages
Working age population % of
n= 62 % of
n= 281 % of n= 63
% of n= 265 % of
n= 60 % of
n= 229 % of n= 185
% of n= 775
Main Occupation 1. Farmer 56.5 6.8 34.9 3.8 33.3 8.3 41.6 6.2 2. Farm laborer 9.7 0.7 23.8 0.8 20.0 1.3 17.8 0.9 3. Trader/merchant 24.2 7.1 17.5 6.8 20.0 3.9 20.5 6.1 4. Home industry 1.6 1.7 1.1 5. Gold extraction 0.4 0.4 0.3 6. Services
~Transport 1.6 3.2 0.8 5.0 0.9 3.2 0.5 ~Other services 1.1 3.3 1.1 0.4
7. Civil servant 3.2 1.1 12.7 3.4 10.0 0.4 8.6 1.7 8. Private company employee 0.4 1.6 1.1 2.6 0.5 1.3 9. Off farm laborer 3.2 1.8 3.2 1.9 3.3 3.5 3.2 2.3 10.Unemployee 1.6 20.3 1.6 29.8 3.3 16.2 2.2 22.3
Total (%) 100 38.4 100 49.4 100 37.6 100 41.9
Side occupation
1. Farmer 22.6 1.1 46.0 0.4 50.0 0.4 39.5 0.6 2. Farm laborer 24.2 1.8 6.3 0.4 1.7 0.9 10.8 1.0 3. Trader/merchant 11.3 1.6 0.4 5.0 0.9 5.9 0.4 4. Home industry 1.7 0.5 5. Gold extraction 1.7 0.5 6. Services
~Transport ~Other services 3.2 1.7 1.6
7. Civil servant 4.8 1.6 1.7 0.4 2.7 0.1 8. Off farm laborer 1.6 0.4 1.6 0.4 8.3 0.9 3.8 0.5
Total (%) 64.5 3.2 60.3 1.5 71.7 3.5 65.4 2.7
Source: Household survey data
Concerning side occupation, defined as income generating activities additional to the main occupation,
about two-fifth of the respondents engage in other activities out side their farm for additional income.
The case of Sukaluyu, half of the respondents consider farming as their side occupations. As we can see
in the Table 4, two dominance activities are work as farm laborer (17.8%) and trader/merchant (20.5%).
In further detail, to relate those occupation data to the labor force of the household members, it is found
that there are 22.2% of the family member belong to working age population who have no occupation.
There are no significant different among the three sample villages in the proportion of the jobless family
member, ranging between 16.2% and 29.8%, it is much higher than West Java Province (12.3%) and
even than national data (9.5%) (BPS, 2003).

- 12 -
Educational attainment is another parameter considered. Statistics of Kecamatan Nanggung indicate that
education level is quite low; only 16.5% of the population in the study area attained senior secondary
education (SLTA/SMU/SMA). The household survey found that 5.9 % of the respondents were
illiterate, lower than national data (9.07%), and most of the respondents (87.6%) never went beyond
elementary level. As summarized in Table 5, among the family members, only 6.5% attained higher
level of education beyond elementary school, and primary school enrollment rate�F
7 is also low.
Table 5. Percentage distribution of Respondents and Family members by educational attainment and elementary school enrolment rate
Parakan
Muncang Curug Bitung Cisarua Sample
Villages
Respondents (number) (62) (63) (60) (185) Never goes to school 6% 5% 7% 6% Elementary school 88.7% 85.7% 88.3% 87.6% Junior secondary school 3.2% 1.1% Senior secondary school 1.6% 3.2% 1.7% 2.2% Academy/University 3.2% 3.2% 3.3% 3.2%
100% 100% 100% 100%
Family members (number) (281) (265) (229) (775) Schooling age but not yet enrolled 7.3% 7.0% 10.4% 8.1% Never goes to school 3.6% 1.5% 3.5% 2.6% Kindergarten 1.0% 0.3% Elementary school 66.5% 51.8% 55.7% 58.2% Junior secondary school 3.8% 9.5% 5.5% 6.3% Senior secondary school 1.2% 8.2% 3.1% 4.2% Academy/University 0.3% 2.7% 0.0% 1.0%
100% 100% 100% 100% Primary school enrolment rate 88.6% 90.5% 83.7% 87.8%
Source: Household survey data
7 Primary school enrolment rate is primary school enrolment ratio. Data refer to gross enrolment ratio, which is the total
enrolment of all ages divided by the population of the specific age groups, corresponding to the primary school age group. The ratio may exceed 100 if the actual age distribution of pupils extends beyond the official school ages. (UNESCAP)

- 13 -
Assets a) Housing As seen in Table 6 at the physical attributes of the houses where the surveyed household settle, such as
building materials, type of floor, type of roof, floor space and water closet availability in each house,
larger part of the household samples settle in reasonably appropriate houses for rural environment. As
seen in Table 6, most of the houses are made of concrete with appropriate floor; some houses are even
furnished with ceramic tile.
Table 6. Percentage distribution of respondents’ houses by physical attributes.
Hambaro Parakan Muncang Sukaluyu Total Physical Attribute
n = 62 n = 63 N = 60 n = 185 1. Building Material
Full Concrete 64.5% 79.4% 60.0% 68.1% Wood 1.6% 1.6% 3.3% 2.2%
Bamboo 33.9% 19.0% 36.7% 29.7% 2. Type of Floor
Ceramic tile 37.1% 36.5% 40.0% 37.8% Simple tile 17.7% 31.7% 6.7% 18.9%
Simple concrete cement 22.6% 22.2% 35.0% 26.5% Wood 6.5% 1.6% 3.3% 3.8%
Bamboo 14.5% 6.3% 10.0% 10.3% Dirt 1.6% 1.6% 5.0% 2.7%
3. Type of Roof Roof-tile 98.4% 100% 100% 99.5%
Plant Leafs 1.6% - - - 4. In House Bathroom
Available 46.8% 57.1% 30.0% 44.9% Not available 53.2% 42.9% 70.0% 55.1%
5. In House Closet Available 40.3% 54.0% 30.0% 41.6%
Not available 59.7% 46.0% 70.0% 58.4% 6. Floor Width
≤ 19 M2 0% 0% 1.7% 0.5% 20-29 M2 3.2% 3.2% 6.7% 4.3% 30-49 M2 30.6% 15.9% 36.7% 27.6% 50-99 M2 61.3% 77.8% 48.3% 62.7%
100-149 M2 4.8% 3.2% 3.3% 3.8% ≥ 150 M2 0% 0% 3.3% 1.1%
Floor Width Range (M2) 20 - 120 20 - 144 20 - 168 12 - 168 Avg Floor Width (M2) 56 58 56 Avg Floor Width per person (M2/ps) 10 11 12 11
Source: Household survey data
- 14 -
Besides, all the houses were roof-tiled. Average floor space of the houses were 57.1 m2, varies between
12 m2 and 168 m2; average floor space per person were 11 m2. Regarding toilet availability, less than
half of the households surveyed have inside toilet facilities.
With regard to electricity, almost all houses of the surveyed household are supplied by electricity power
from State Owned Electricity Power (PLN). While for telephone line very few houses in all villages
surveyed (7.0% of the houses) get connection this public services.
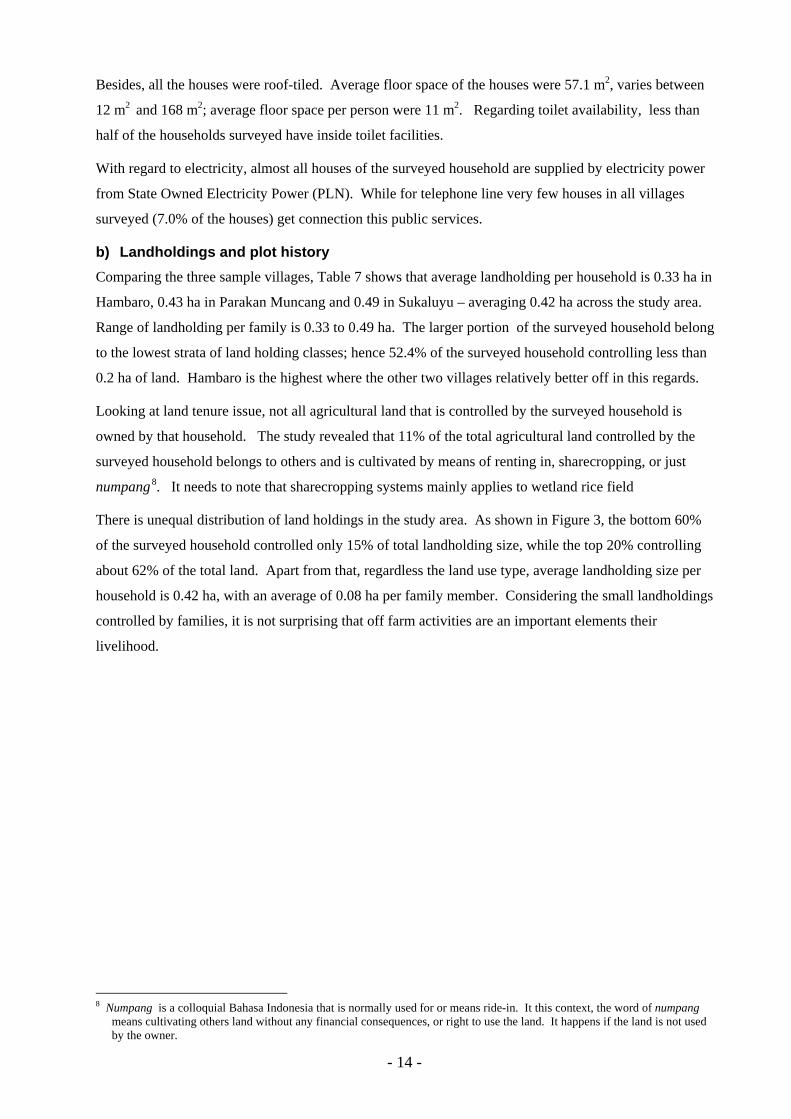
b) Landholdings and plot history Comparing the three sample villages, Table 7 shows that average landholding per household is 0.33 ha in
Hambaro, 0.43 ha in Parakan Muncang and 0.49 in Sukaluyu – averaging 0.42 ha across the study area.
Range of landholding per family is 0.33 to 0.49 ha. The larger portion of the surveyed household belong
to the lowest strata of land holding classes; hence 52.4% of the surveyed household controlling less than
0.2 ha of land. Hambaro is the highest where the other two villages relatively better off in this regards.
Looking at land tenure issue, not all agricultural land that is controlled by the surveyed household is
owned by that household. The study revealed that 11% of the total agricultural land controlled by the
surveyed household belongs to others and is cultivated by means of renting in, sharecropping, or just
numpang�F
8. It needs to note that sharecropping systems mainly applies to wetland rice field
There is unequal distribution of land holdings in the study area. As shown in Figure 3, the bottom 60%
of the surveyed household controlled only 15% of total landholding size, while the top 20% controlling
about 62% of the total land. Apart from that, regardless the land use type, average landholding size per
household is 0.42 ha, with an average of 0.08 ha per family member. Considering the small landholdings
controlled by families, it is not surprising that off farm activities are an important elements their
livelihood.
8 Numpang is a colloquial Bahasa Indonesia that is normally used for or means ride-in. It this context, the word of numpang
means cultivating others land without any financial consequences, or right to use the land. It happens if the land is not used by the owner.
- 15 -
Table 7. Profile of surveyed households according to landholdings by village and land use type
Hambaro Parakan Muncang Sukaluyu Total
n % Ha n % Ha n % Ha n % Ha n hh = 62 n hh = 63 n hh = 60 n hh = 185 n plot = 103 n plot = 102 n plot = 105 n plot = 310 1. Number of Plot Owned (plot)
1 plot 62 100% 14.76 63 100% 14.47 60 100% 16.16 185 100% 45.39 2 plots 37 59.7% 5.31 36 57.1% 11.26 36 60.0% 12.67 109 58.9% 29.24 3 plots 4 6.5% 0.52 3 4.8% 0.83 9 15.0% 0.9 16 8.6% 2.26
2. Type of Land Owned (plot) Irrigated Paddyfield 37 59.7% 9.85 38 60.3% 10.96 24 40.0% 7.57 99 53.5% 28.38 Rainfed Paddyfield 23 37.1% 4.59 20 31.7% 3.23 21 35.0% 7.21 64 34.6% 15.03
Dry Land 25 40.3% 3.04 23 36.5% 5.36 35 58.3% 8.83 83 44.9% 17.24 Monoculture Garden 7 11.3% 0.76 2 3.2% 0.35 9 15.0% 1.62 18 9.7% 2.73
Simple Agroforest 10 16.1% 1.37 18 28.6% 6.61 15 25.0% 4.48 43 23.2% 12.45 Complex agroforest 1 1.6% 1.00 1 0.5% 1.00
Shrub 1 1.6% 0.04 1 1.7% 0.01 2 1.1% 0.05 3. Land size (m2) by household
< 0.1 28 45% 1.35 17 27% 0.88 23 38% 1.25 68 37% 3.48 0.11 - 0.3 11 18% 1.73 25 40% 4.88 7 12% 1.36 43 23% 7.97 0.31 - 0.5 9 15% 3.64 4 6% 1.80 10 17% 4.18 23 12% 9.62 0.51 - 0.7 10 16% 5.94 3 5% 1.95 2 3% 1.13 15 8% 9.02
> 0.71 4 6% 7.94 14 22% 17.55 18 30% 21.30 36 19% 46.79
4. Descriptive statistics of landholding size Total Land Size Surveyed (Ha) 20.6 27.05 29.22 76.88 Avg Land Size (Ha/Hh) 0.33 0.43 0.49 0.42 Land Size Range (Ha) 0.003 - 3 0.002 - 2 0.003 - 1.8 0.002 - 3 Std. Deviation 0.33 0.30 0.31 0.31
Source: Household survey data

- 16 -
Cumulative Land Distribution
1%5%
13%
38%
100%
2%
7%
17%
41%
100%
1%5%
17%
46%
100%
1%5%
15%
38%
100%
0%
10%
20%
30%
40%
50%
60%
70%
80%
90%
100%
20% 40% 60% 80% 100%
Proportion of the surveyed households
% o
f Lan
dhol
ding
s
Hambaro Parakan Muncang Sukaluyu Total
Source: Household survey data
Figure 3. Cumulative distribution of the surveyed household by landholding size
Almost all of plot samples (89%) were privately owned, with more than half (67%) obtained through
inherintance. Land was acquired through purchase from other individual in 21% of the cases (See Table
8.). Obtaining land by forest clearance (logged-over forest) occured in 2% of the cases.
Table 8. Ways of obtaining the land by land status
Privatly Owned Perhutani Land National Park Numpang Total
Ways obtaining land n % Ha n % Ha n % Ha n % Ha n % Ha
Opened from Forest 6 2% 3.15 6 2% 3.15
Bought 65 (21%) 25.83 65 21% 25.83
Heritage 203 65% 38.02 5 2% 0.85 208 67% 38.87
Using other persons land 9 3% 3.50 6 2% 1.57 1 0.30% 1.00 15 5% 2.96 31 10% 9.03
277 89% 67.35 17 5% 5.57 1 0.30% 1.00 15 5% 2.96 310 100% 76.88
Source: Household survey data
Table 8, documents history of land ‘ownership’. Years of ‘ownership’ range from 1 to 61 years,
averaging 19.9 years.
- 17 -
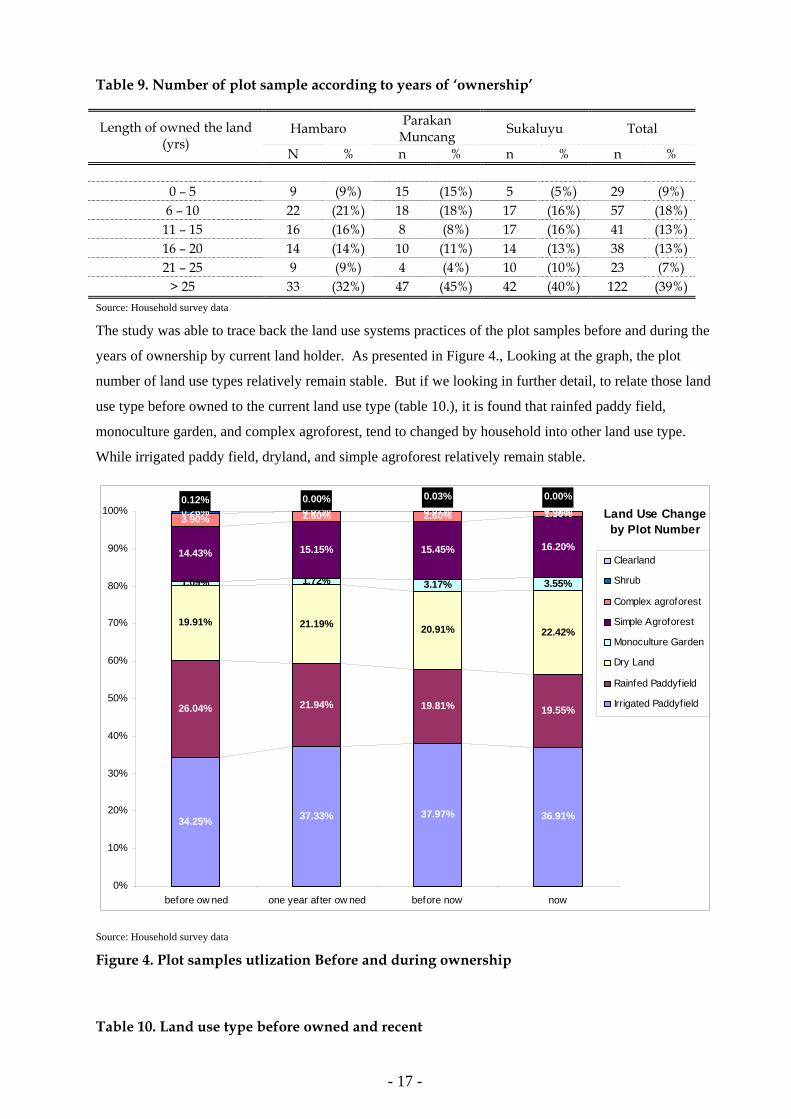
Table 9. Number of plot sample according to years of ‘ownership’
Hambaro Parakan Muncang Sukaluyu Total Length of owned the land
(yrs) N % n % n % n %
0 – 5 9 (9%) 15 (15%) 5 (5%) 29 (9%)
6 – 10 22 (21%) 18 (18%) 17 (16%) 57 (18%) 11 – 15 16 (16%) 8 (8%) 17 (16%) 41 (13%) 16 – 20 14 (14%) 10 (11%) 14 (13%) 38 (13%) 21 – 25 9 (9%) 4 (4%) 10 (10%) 23 (7%)
> 25 33 (32%) 47 (45%) 42 (40%) 122 (39%) Source: Household survey data
The study was able to trace back the land use systems practices of the plot samples before and during the
years of ownership by current land holder. As presented in Figure 4., Looking at the graph, the plot
number of land use types relatively remain stable. But if we looking in further detail, to relate those land
use type before owned to the current land use type (table 10.), it is found that rainfed paddy field,
monoculture garden, and complex agroforest, tend to changed by household into other land use type.
While irrigated paddy field, dryland, and simple agroforest relatively remain stable.
Land Use Change by Plot Number
34.25% 37.33% 37.97% 36.91%
26.04% 21.94% 19.81% 19.55%
19.91% 21.19% 20.91% 22.42%
1.09% 1.72% 3.17% 3.55%
14.43% 15.15% 15.45% 16.20%
3.90% 2.60% 2.60% 1.30%0.26% 0.07% 0.07% 0.07%0.00%0.03%0.00%0.12%
0%
10%
20%
30%
40%
50%
60%
70%
80%
90%
100%
before ow ned one year after ow ned before now now
Clearland
Shrub
Complex agroforest
Simple Agroforest
Monoculture Garden
Dry Land
Rainfed Paddyfield
Irrigated Paddyfield
Source: Household survey data
Figure 4. Plot samples utlization Before and during ownership
Table 10. Land use type before owned and recent

- 18 -
Land Use Type Now Irrigated
Paddyfield
Rainfed Paddyfield
Dry Land
Monoculture Garden
Simple Agroforest
Complex agroforest Shrub Clearland Total
Irrigated Paddyfield 89.0% 3.3% 2.2% 4.4% 1.1% 0% 0% 0% 100%
Rainfed Paddyfield 19.1% 66.3% 9.0% 4.5% 1.1% 0% 0% 0% 100%
Dry Land 1.3% 2.6% 88.5% 6.4% 1.3% 0% 0% 0% 100%
Monoculture Garden 0% 0% 33.3% 50.0% 16.7% 0% 0% 0% 100%
Simple Agroforest 0% 0% 2.6% 0% 97.4% 0% 0% 0% 100%
Complex agroforest 0% 0% 33.3% 0% 33.3% 33.3% 0% 0% 100%
Shrub 0% 0% 0% 33.3% 0% 0% 66.7% 0% 100%
Clearland 0% 0% 0% 100% 0% 0% 0% 0% 100%
Land
use
type
bef
ore
owne
d
Total 31.9% 20.6% 26.8% 5.8% 13.9% 0.3% 0.6% 0.0% 100%
Source: Household survey data c) Other assets Information concerning other assets such as farm implements, savings, motor bikes and electronic
equipment (TV and Radio) were also collected in this survey as a means of identifying the socio
economic conditions of the target population. The data are summarized as follows.
Table 11. Other assets
Hambaro Parakan Muncang Sukaluyu Total
Asset n 62 n 63 n 60 n 185
1. Radio/Tape 50.0% 57.1% 56.7% 54.6% 2. Television 75.8% 76.2% 61.7% 71.4% 3. VCD/DVD 43.5% 47.6% 43% 44.9% 4. Telephone/Cellphone 8.1% 9.5% 3.3% 7.0% 5. Refrigerator 11.3% 12.7% 8.3% 10.8% 6. Bike 6.5% 4.8% 7% 5.9% 7. Motobike 6.5% 15.9% 8.3% 10.3% 9. Car 3.2% 1.6% 0% 1.6%
Source: Household survey data
Televisions are more common as compared to Radios/Tape Cassette Players, as seen in Table 11.
Comparing to all assets, Parakan Muncang seems to be better off than the other two villages. The
difference in this figures does not seem significant - with possible except of motor bikes in Parakan
Muncang.
Income and Expenditure This section discusses the living standards of the Nanggung population using two socio-economic
indicators, i.e. income and expenditure. It describes family income (and per capita income), source of

- 19 -
income, family expenditure (and per capita expenditure) and expenditure allocation. It also assesses the
level of family income and expenditure of the surveyed household compared to national and provincial
poverty line to find out the status of their living standard; hence surveyed households are defined as poor
if their income or expenditure is below poverty line.
a) Income Although most of people in Nanggung are engaged in agriculture (work as farmer), it is unlikely that
agricultural income is the greatest contributor to family income. Income data derived from this survey
shows that agriculture is not the main contributor to family income. As seen in Table 12., agricultural
activities alone contribute only 14% to the total households’ income, with average time spent 5.16
hours/day. However, comparing these three villages, it is interesting to note that the share of agricultural
income of the surveyed household in Hambaro to the total family income is higher than in Parakan
Muncang and Sukaluyu, although the average of landholding size in Hambaro s slightly less than in
others two villages. More detail observation reveal that in Parakan Muncang, the most accessible village
among the three sample villages, there are 68% of surveyed household engage in trade activities. This
activity contributes about 42 % of the total off-farm income in Parakan Muncang (see Annex).
The fact that off-farm incomes contribute the most to the total family income, it explains that most of the
surveyed household can’t rely mainly on agricultural activities with relatively narrow landholding size
for their livelihood. It also indicates that large portion of people, must engage in other income generating
activities to meet their family livelihood needs.
For those households that have other sources of income (usually remittance from a son/daughter),
although these sources are irregular and relatively small as a portion of total family income, this
additional income is meaningful for their livelihood. In this regards, Sukaluyu is the ‘best’, meaning
amount of income receiving this kind of income is highest.

- 20 -
Table 12. Households’ Income and average time spent by source of income and by village sample
Hambaro Parakan Muncang Sukaluyu Total
n Rp 000 % n Rp 000 % n Rp 000 % n Rp 000 %
Agriculture Agriculture 44 6,239 11 43 6,541 7 50 10,688 14 137 23,468 10 Livestock & Fishery 13 6,498 11 14 1,463 2 12 382 0.5 39 8,344 4 Total Agriculture Income 46 12,737 22 46 8,004 9 52 11,070 14 144 31,812 14
Average time spent in agriculture activities (hours/day)
5.10 5.31 5.11 5.16
Off Farm Income 58 37,554 63 60 73,529 83 57 36,866 47 175 147,948 65 Average time spent in off-farm activities (hours/day)
5.54 5.83 5.34 5.59
Non-fixed Income 23 8,937 15 24 7,525 8 21 30,523 39 68 46,985 21 Total Household Income 62 59,228 100 63 89,058 100 60 78,459 100 185 226,745 10
0 Source: Household survey data
From living standard point of view, it is necessary to question whether the surveyed households can
fulfill their needs. To answer such questions, the study applies the poverty line of BPS – Statistics of
Indonesia that refers to the daily minimum requirement of 2,100 kilo-calories per capita plus the non-
food minimum requirement, such as for living, clothing, schooling, transportation, household necessities
and other individual needs. The value of expenditure (in rupiahs) needed for fulfilling the basic
minimum requirement including food and nonfood (that is called as poverty line) Indonesia in 2005 were
Rp. 150,000 capita-1 month-1 respectively or in annual basis were Rp 1,800,000. capita-1 year-1 (BPS,
2005).
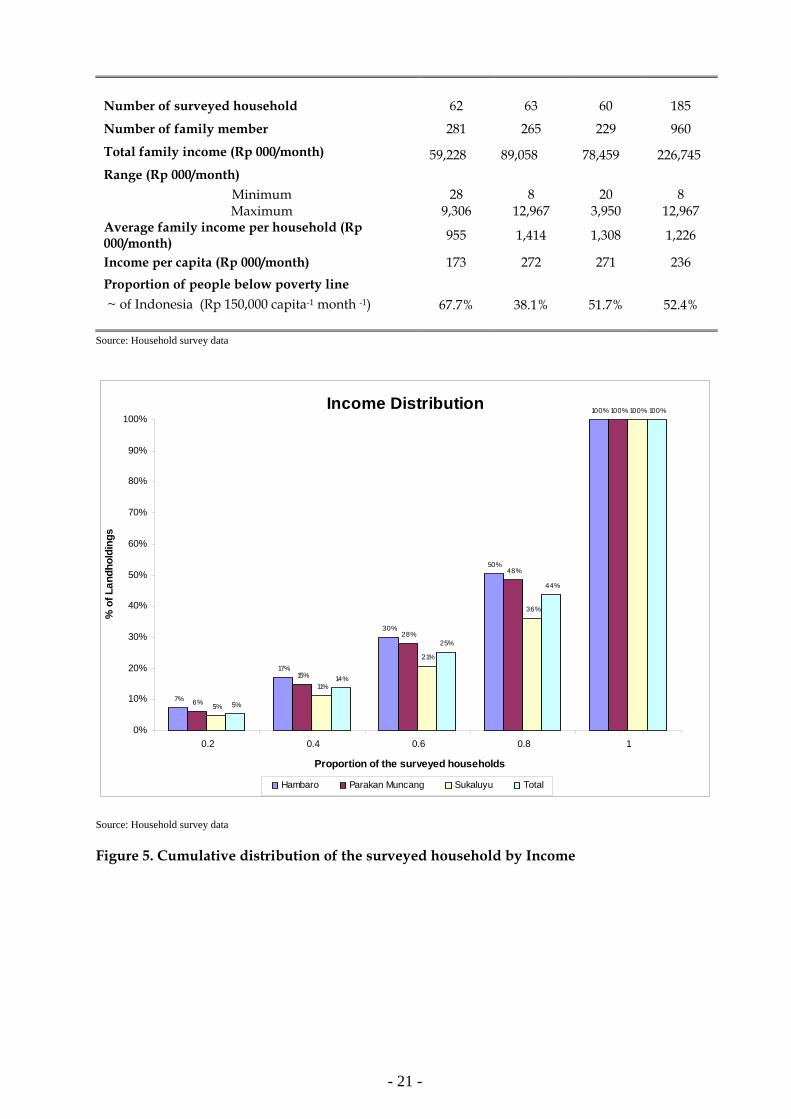
Using average per capita income of the surveyed household in three sample villages, the study reveals the
average person/family in Nanggung is still above the poverty line. As seen in Table 13, average per
capita incomes of the three sample villages are still higher than the poverty line of Indonesia. But,
because of skewed distribution of income (see Figure 5), it needs to be treated with cautions, especially if
number of people below poverty line is counted. The study found that more than half (52 %) of the
surveyed household are below poverty line, mean that those households cannot afford the basic
requirements, and thus are categorized as poor. Comparing the sample villages, Hambaro is the worst
among the three sample villages; hence, about 67.7% of the people below poverty line.
Table 13. Descriptive statistics of family income of the surveyed households and people under poverty line
Hambaro Parakan Muncang Sukaluyu Sample
Villages
- 21 -
Number of surveyed household 62 63 60 185
Number of family member 281 265 229 960
Total family income (Rp 000/month) 59,228 89,058 78,459 226,745 Range (Rp 000/month)
Minimum 28 8 20 8 Maximum 9,306 12,967 3,950 12,967
Average family income per household (Rp 000/month) 955 1,414 1,308 1,226
Income per capita (Rp 000/month) 173 272 271 236 Proportion of people below poverty line ~ of Indonesia (Rp 150,000 capita-1 month -1) 67.7% 38.1% 51.7% 52.4%
Source: Household survey data
Income Distribution
7%
17%
30%
50%
100%
6%
15%
28%
48%
100%
5%
11%
21%
36%
100%
5%
14%
25%
44%
100%
0%
10%
20%
30%
40%
50%
60%
70%
80%
90%
100%
0.2 0.4 0.6 0.8 1
Proportion of the surveyed households
% o
f Lan
dhol
ding
s
Hambaro Parakan Muncang Sukaluyu Total
Source: Household survey data
Figure 5. Cumulative distribution of the surveyed household by Income
- 22 -
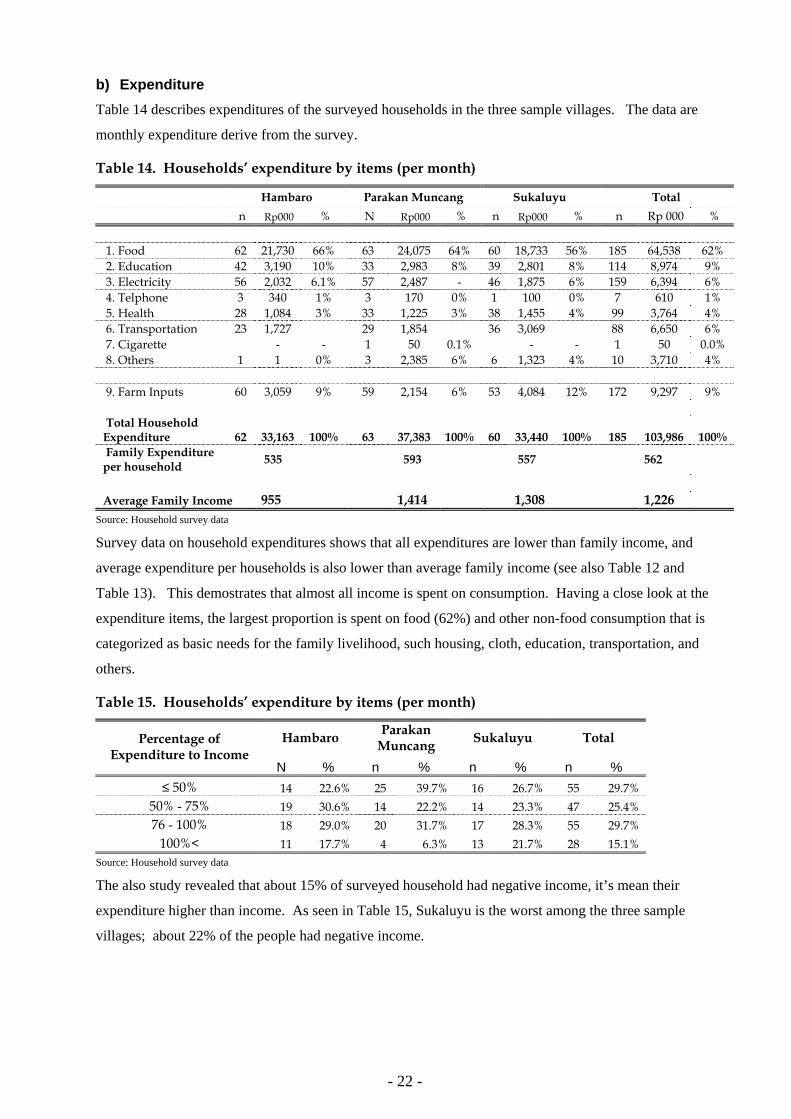
b) Expenditure Table 14 describes expenditures of the surveyed households in the three sample villages. The data are
monthly expenditure derive from the survey.
Table 14. Households’ expenditure by items (per month)
Hambaro Parakan Muncang Sukaluyu Total n Rp000 % N Rp000 % n Rp000 % n Rp 000 % 1. Food 62 21,730 66% 63 24,075 64% 60 18,733 56% 185 64,538 62% 2. Education 42 3,190 10% 33 2,983 8% 39 2,801 8% 114 8,974 9% 3. Electricity 56 2,032 6.1% 57 2,487 - 46 1,875 6% 159 6,394 6% 4. Telphone 3 340 1% 3 170 0% 1 100 0% 7 610 1% 5. Health 28 1,084 3% 33 1,225 3% 38 1,455 4% 99 3,764 4% 6. Transportation 23 1,727 29 1,854 36 3,069 88 6,650 6% 7. Cigarette - - 1 50 0.1% - - 1 50 0.0% 8. Others 1 1 0% 3 2,385 6% 6 1,323 4% 10 3,710 4% 9. Farm Inputs 60 3,059 9% 59 2,154 6% 53 4,084 12% 172 9,297 9% Total Household Expenditure 62 33,163 100% 63 37,383 100% 60 33,440 100% 185 103,986 100% Family Expenditure per household 535 593 557 562
Average Family Income 955 1,414 1,308 1,226
Source: Household survey data
Survey data on household expenditures shows that all expenditures are lower than family income, and
average expenditure per households is also lower than average family income (see also Table 12 and
Table 13). This demostrates that almost all income is spent on consumption. Having a close look at the
expenditure items, the largest proportion is spent on food (62%) and other non-food consumption that is
categorized as basic needs for the family livelihood, such housing, cloth, education, transportation, and
others.
Table 15. Households’ expenditure by items (per month)
Hambaro Parakan Muncang Sukaluyu Total Percentage of
Expenditure to Income N % n % n % n %
≤ 50% 14 22.6% 25 39.7% 16 26.7% 55 29.7% 50% - 75% 19 30.6% 14 22.2% 14 23.3% 47 25.4% 76 - 100% 18 29.0% 20 31.7% 17 28.3% 55 29.7%
100%< 11 17.7% 4 6.3% 13 21.7% 28 15.1% Source: Household survey data
The also study revealed that about 15% of surveyed household had negative income, it’s mean their
expenditure higher than income. As seen in Table 15, Sukaluyu is the worst among the three sample
villages; about 22% of the people had negative income.

- 23 -
Farming System Characteristics
This section presents the profile of farming practices of the surveyed household based on the information
gathered by interviewing the respondents. It describes how farmers manage their agricultural land and
the productions with special emphasis on vegetables farming management.
a) Physical Characteristics As mention earlier, agricultural land controlled by the surveyed household is comprise of rice fields,
dryland agriculture, monoculture gardens (ex. Cassava, timun), and traditional multispecies tree gardens.
As seen in Table 16, of 310 plots, there are 163 plots (43.4 ha) of rice field, 83 plots (17.2 ha) of dryland
agriculture (Tegal/ladang) and 18 plots (2.7 ha) of monoculture gardens and 43 plots (12.4 ha) of multi-
species tree garden controlled by the surveyed households.
Table 16. Physical Characteristics of plot controlled by household by land use type
Irrigated Paddyfield
Rainfed Paddyfield Dry Land Monoculture
Garden Simple
Agroforest Number of Plot 99 64 83 18 43 Total Area (Ha) 28.38 15.03 17.24 2.73 12.45 1. Distance from Village (M2)
≤ 500 m 82% 83% 95% 78% 77% 500 - 1,000 m 5% 6% 0% 22% 19%
1,000m < 13% 11% 5% 0% 5% 2. Time Needed to go to the plot (Minutes)
1 – 15 80% 84% 89% 83% 63% 16 – 30 16% 13% 10% 11% 35% 31 – 60 4% 3% 1% 6% 2%
> 60 3. Plot Fertility
Quite Fertile to Very Fertile 87% 53% 87% 83% 67% Less Fertile 13% 47% 12% 17% 33% Not Fertile 1%
4. Plot Slope Flat to Slightly Slope 88% 64% 93% 89% 47%
Gently Slope 12% 36% 5% 11% 40% Slightly Step to Step Slope 0% 0% 2% 0% 14%
5. Water Source for Irrigation Technical Drainage 14%
Simple Drainage 9% 2% 2% Direct from River 17% 5% 4% 11% 2%
Water Spring 53% 8% 14% 6% 7% Rain Fed 6% 86% 80% 78% 91%
Others 1% 6% Source: Household survey data
Intensive agriculture (paddy field, dryland and monoculture garden) mostly takes place in the relatively
flat area, more than 80% of the plots are considered by the respondents as gently to slightly steep area.
Regarding to soil fertility, most of respondents consider their land quite fertile to very fertile. With the
exception of the irrigated paddy fields, all other plots depend on rain as source of water to support crop
production.

- 24 -
Table 17. Physical Characteristics of plot controlled by household by Village
Hambaro Parakan Muncang Sukaluyu Total
Number of Plot 103 102 105 310 Total Area (Ha) 20.60 27.0537 29.2241 76.8793 1. Distance from Village (M2)
≤ 500 m 79.6% 75.5% 80.0% 78.4% 500 - 1,000 m 9.7% 20.6% 11.4% 13.9%
1,000m < 10.7% 3.9% 8.6% 7.7% 2. Time Needed to go to the plot (Minutes)
1 – 15 83.5% 88.2% 72.4% 81.3% 16 – 30 15.5% 10.8% 21.0% 15.8% 31 – 60 1.0% 1.0% 6.7% 2.9%
> 60 3. Plot Fertility
Quite Fertile to Very Fertile 70.9% 76.5% 81.9% 76.5% Less Fertile 28.2% 23.5% 18.1% 23.2% Not Fertile 1.0% 0.3%
4. Plot Slope Flat to Slightly Slope 71.8% 79.4% 82.9% 78.1%
Gently Slope 25.2% 20.6% 12.4% 19.4% Slightly Step to Step Slope 2.9% 4.8% 2.6%
5. Water Source for Irrigation Technical Drainage 9.7% 2.0% 1.9% 4.5%
Simple Drainage 3.9% 4.9% 2.9% 3.9% Direct from River 11.7% 2.0% 11.4% 8.4%
Water Spring 12.6% 36.3% 21.9% 23.5% Rain Fed 62.1% 53.9% 61.0% 59.0%
Others 1.0% 1.0% 0.6% Source: Household survey data
Using village as basis for plot characteristics in three villages, as seen in Table 17, the agricultural land
mostly situated in undulating area, from gently to steep slope. In soil fertility, most of the land is quite
fertile; only 0.3% of the plots are considered by the respondents as not fertile.
From the interview with the respondent, we founds 23 vegetables species and two staple crop species
(paddy and cassava). The top five vegetables species found in of plots samples were : Pisang (Musa sp.),
Kacang panjang (Vigna sinensis), Timun (Trichosanthes cucumeroides maxim), Kucai (Allium
tuberosum) and Buncis (Phaseolus vulgaris). This species are mostly cultivated by farmer in dryland and
simple agroforest plots.

- 25 -
Table 18. Vegetables Species Cultivated by surveyed household (by landuse types)
Irrigated Paddyfield
Rainfed Paddyfield Dry Land Monocultu
re Garden Simple
Agroforest Total No Commodity
(% of n=99) (% of n=64) (% of n=83) (% of n=18) (% of n=43) (% of n=307)
1 Bayam (Alternanthera amoena voss) 1.2% 0.3% 2 Buncis (Phaseolus vulgaris) 1.6% 4.8% 7.0% 2.6% 3 Cabe (Capsicum frutescens) 7.2% 5.6% 2.3% 2.6% 4 Caesin (Brassica rapa L.) 1.0% 3.6% 1.3% 5 Jagung (Zea mays L.) 4.8% 4.7% 2.0% 6 Jahe (Zingiber offcinale) 1.0% 1.6% 3.6% 5.6% 2.0% 7 Kacang kedelai (Soya max piper) 1.6% 0.3% 8 Kacang panjang (Vigna sinensis) 2.0% 12.0% 7.0% 4.9% 9 Kacang tanah (Arachis hypogaea ) 1.0% 1.6% 2.4% 5.6% 1.6%
10 Kangkung (Ipomoea aquatica forsk) 1.2% 0.3% 11 Katuk (Sauropus androgynus merr) 1.2% 0.3% 12 Kucai (Allium tuberosum) 3.6% 16.3% 3.3% 13 Kunyit (Curcuma longa) 1.0% 3.6% 2.3% 1.6% 14 Lengkuas (Alpinia galangal) 7.2% 4.7% 2.6% 15 Padi (Oryza sativa L.) 99.0% 95.3% 2.4% 52.4% 16 Pepaya (Carica papaya L.) 2.4% 0.7% 17 Pisang (Musa sp.) 2.0% 1.6% 26.5% 16.7% 18.6% 11.7% 18 Sawi (Brassica juncea (L.) chern) 1.2% 0.3% 19 Sereh (Andropogon citratus dc) 2.4% 4.7% 1.3% 20 Singkong (Manihot esculenta) 1.0% 7.8% 47.0% 20.9% 17.6% 21 Talas (Colocasia esculenta) 3.6% 2.3% 1.3% 22 Terong (Solanum melongena L.) 2.4% 0.7%
23 Timun (Trichosanthes cucumeroides maxim) 3.0% 9.6% 7.0% 4.6%
24 Tomat (Solanum lycopersicum) 3.6% 1.0% 25 Ubi Jalar (Ipomoea batatas) 5.6% 0.3%
Source: Household survey data
Simple agroforest or Dudukuhan are traditional tree farming system commonly found in West Java,
farmers realized that Dudukuhan are underproductive and hold great untapped potential for meeting the
raising demand for tree and annual crop products in West Java. Farmers are interested in intensifying the
management of their dudukuhans, but hesitate because they do not know where to focus their efforts
(Manurung, 2005).
The Dudukuhan process starts with fallow systems, which are cleared by farmer to establish ’huma or
tegalan’ upland systems of banana and annual crops for 3 to 4 years. During that period, farmer enriched
the huma by planting seedlings or wildlings of the priority tree species (Manurung, 2005).
In Table 19., the tree species used to plant in Dudukuhan are Alpukat (Persea Americana), Melinjo
(Gnetum gnemon), Nangka (Artocarpus heterophyllus), Jengkol (Pithecellobium jiringa), Durian (Durio
zibethinus), Kecapi (Sandoricum koetjape), Sengon (Paraserianthes falkataria), Mangga (Mangifera
indica), Petai (Parkia speciosa), and Pinus (Pinus sp). Kacang panjang (Vigna sinensis), Timun
(Trichosanthes cucumeroides maxim), Kucai (Allium tuberosum) and Buncis (Phaseolus vulgaris), are
the most common annual crops cultivated by farmer under Dudukuhan system.
Table 19. Trees and Annual Crops Species combination found in household survey
Tree Species Annual Crop Species Alpukat (Persea Americana), Nangka (Artocarpus Kucai (Allium tuberosum)

- 26 -
heterophyllus) Jengkol (Pithecellobium jiringa), Durian (Durio zibethinus)
Kucai (Allium tuberosum)
Jengkol (Pithecellobium jiringa), Petai (Parkia speciosa)
Kacang panjang (Vigna sinensis)
Kecapi (Sandoricum koetjape), Sengon (Paraserianthes falkataria), Mangga (Mangifera indica)
Buncis (Phaseolus vulgaris), Kacang panjang (Vigna sinensis)
Mahoni (Swietenia macrophylla King), Sengon (Paraserianthes falkataria) Melinjo (Gnetum gnemon)
Buncis (Phaseolus vulgaris), Kacang panjang (Vigna sinensis)
Melinjo (Gnetum gnemon) Buncis (Phaseolus vulgaris), Kacang panjang (Vigna sinensis)
Nangka (Artocarpus heterophyllus), Rambutan (Nephelium lappaceum)
Buncis (Phaseolus vulgaris), Kacang panjang (Vigna sinensis)
Petai (Parkia speciosa) Kacang panjang (Vigna sinensis), Timun (Trichosanthes cucumeroides maxim)
Pinus (Pinus sp) Timun (Trichosanthes cucumeroides maxim), Kucai (Allium tuberosum), Buncis (Phaseolus vulgaris), Kacang panjang (Vigna sinensis)
Sengon (Paraserianthes falkataria) Kucai (Allium tuberosum), ,Kacang panjang (Vigna sinensis,)Timun (Trichosanthes cucumeroides maxim)
Melinjo (Gnetum gnemon), Nangka (Artocarpus heterophyllus)
Buncis (Phaseolus vulgaris), Kacang panjang (Vigna sinensis)
Source: Household survey data
As seen in Table 20., household who experienced with tree-annual crop farming system only 10.3% to
the total households. Comparing these three villages, it is interesting to note that in Sukaluyu, about 25%
of surveyed household experienced with tree-annual crop farming system.
Table 20. Number of Household experienced with Tree-annual crop Farming System
Hambaro Parakan Muncang Sukaluyu Total
n % n % n % n % Household experienced 1 1.6% 3 4.8% 15 25.0% 19 10.3% Household not experienced
61 98.4% 60 95.2% 45 75.0% 166 89.7% Source: Household survey data
b) Labour and External Inputs This part of the report presents the level of inputs (external inputs application and labor inputs) allocated
to farm management by the surveyed household.
With regard to labor inputs, based on activities implemented, the data shows that land preparation is the
activity most commonly conducted in the farm. Harvesting, maintaining and planting, respectively are
the activities that require the most labor. As seen in the Table 21, the number of person-days involve in
land preparation is much higher than the number of person-days involved in other activities. Number of
person-days involved in nursery activities and fertilizing activities is the lowest compare with the others
activities.
Table 21. Level of Labour Input by land use type

- 27 -
Irrigated Paddyfiel
d
Rainfed Paddyfiel
d
Dry Land
Monoculture Garden
Simple Agrofores
t No of Plot 99 64 83 18 43 Total Area (ha) 28.38 15.03 17.24 2.73 12.45 Labor inputs 1.1 Land Preparation
~ Plot with land prep. Activity (%) 100% 100% 84% 89% 44% ~ Average Labor (ps-day/ha) 121.5 117.2 160.3 78.6 57.2
1.2 Nursery ~ Plot with land prep. Activity (%) 95% 92% 12% 6% 2% ~ Average Labor (ps-day/ha) 10.9 10.6 1.7 0.1 0.3
1.3 Planting ~ Plot with planting activity (%) 99% 98% 83% 89% 44% ~ Average Labor (ps-day/ha) 57.0 50.8 80.9 24.1 33.8
1.4. Maintaining ~ Plot with Crop care activity (%) 98% 97% 70% 89% 33% ~ Average Labor (ps-day/ha) 64.5 52.4 107.7 33.1 27.5
1.5. Fertilizing ~ Plot with Fertilizer. activity (%) 95% 86% 48% 72% 33% ~ Average Labor (ps-day/ha) 13.5 14.9 20.8 10.1 6.7
1.6. Harvesting ~ Plot with harvesting activity (%) 98% 97% 75% 72% 42% ~ Average Labor (ps-day/ha) 66.6 56.0 49.1 19.1 16.0
Source: Household survey data
Labor inputs, as presented in Table 22., shows that the larger area of plot samples the less labor input will
be. It can be understood that farmers who have small parcel of tends to intensify their land for their
livelihood. It does also relate to the availability of labor. Farmers who have larger area of agricultural
land, without a sufficient amount of labor tend to practice less labor intensive agricultural systems, such
tree-based systems.
Table 22. Labor inputs by land holding size and land use type
Irrigated Paddyfield
Rainfed Paddyfield Dry Land Monocultu
re Garden Simple
Agroforest Land size (ha) by household Average Labor Input (ps-day/ha)
< 0.1 483 433 580 274 185 0.11 - 0.3 234 215 261 93 118 0.31 - 0.5 128 59 160 19 124 0.51 - 0.7 113 45 30
> 0.71 254 45 73 21 Source: Household survey data
The use fertilizer, both chemical and green manure, was quite common in all sample plots in the study
site, except for complex agroforests and fallow lands. Table 23. presents the fertilizer rate of every land
use category. In general, the rate of fertilizer varies according to land use category and varies among plot
within the land use category. It reflects the variation of land use practices and agricultural undertaking.
As can be seen external agricultural inputs used by the surveyed household is quite high.
Table 23. Level of External Input by type of land use type

- 28 -
Irrigated Paddyfield
Rainfed Paddyfield Dry Land Monocultu
re Garden Simple
Agroforest No of Plot 99 64 83 18 43 Total Area (ha) 28.38 15.03 17.24 2.73 12.45 External Inputs
Chemical Fertilizer Urea ~ Plot applying (%) 100% 97% 39% 44% 23% ~ Average Rate (kg ha-1) 426.5 691.7 179.5 180.6 28.7 SP-36 ~ Plot applying (%) 91% 94% 54% 56% 35% ~ Average Rate (kg ha-1) 160.0 228.8 105.0 117.8 17.7 KCL ~ Plot applying (%) 24% 16% 20% 39% 16% ~ Average Rate (kg ha-1) 30.6 22.1 72.0 48.7 4.3 NPK ~ Plot applying (%) 2% 22% ~ Average Rate (kg ha-1) 1.5 11.9 Other ~ Plot applying (%) 5% 2% 5% 0% 5% ~ Average Rate (kg ha-1) 5.1 2.3 91.4 - 7.0 Organic Fertilizer ~ Plot applying (%) 21% 16% 52% 78% 30% ~ Average Rate (kg ha-1) 348.9 721.1 3,836.0 4,049.7 972.0 Pesticide ~ Plot applying (%) 88% 91% 33% 44% 16% ~ Average Rate (ml ha-1) 6,368.6 2,402.5 10,214.1 1,087.5 364.0
Source: Household survey data
The study found that chemical fertilizer was applied in all paddyfields and organic fertilizer mostly was
applied in monoculture garden and dryland plots. The rate of fertilizer application, for chemical fertilizer
was also quite high, ranging between 2 and 7,500 kg ha-1, whereas for organic fertilizer, some plots,
especially monoculture garden applies reasonably high, up to 34 ton ha-1.
Same as fertilizer applications, rate of pesticide application and type of pesticide used varies according to
land use category. As seen on Table 23.above, all types of pesticide applied for all land use category.
While paddy field in the study cite mostly applied herbicide to reduce labor cost for weedings. The rate
of pesticide application for dryland was the highest among the other land use category.

- 29 -
c) Farm Outputs Regarding to the farm outputs, Table 24 presents the vegetable commodities produced in the plot. It was
found that almost all commodities harvested in the plot were sold by the surveyed households. Most of
the harvested yields (89% or more) are sold for 22 annual commodities. Only 76.5% of corn yields are
sold and 29.6% of rice. All (100%) of the sawi produced is consumed by households.
Table 24. Farm outputs by land use type (per plot)
Yield No Commodity Unit n =
plot Total Avg (per plot)
Yield Consump
(%)
Yield Sold (%)
1 Bayam (Alternanthera amoena voss) ikat 1 900 900 100%
2 Buncis (Phaseolus vulgaris) kg 8 2,020 253 1.3% 98.7%
3 Cabe (Capsicum frutescens) kg 8 754 94 4.5% 95.5%
4 Caesin (Brassica rapa L.) kg 4 410 103 100%
5 Jagung (Zea mays L.) kg 6 1,500 250 23.5% 76.5%
6 Jahe (Zingiber offcinale) kg 6 400 67 100%
7 Kacang kedelai (Soya max piper) kg 1 50 50 10.0% 90.0%
8 Kacang panjang (Vigna sinensis) kg 15 8,925 595 0.6% 99.4%
9 Kacang tanah (Arachis hypogaea L) kg 5 580 116 1.7% 98.3%
10 Kangkung (Ipomoea aquatica forsk) ikat 1 120 120 100%
11 Katuk (Sauropus androgynus merr) ikat 1 600 600 100%
12 Kucai (Allium tuberosum) ikat 10 9,100 910 100%
13 Kunyit (Curcuma longa) kg 5 7,100 1,420 100%
14 Lengkuas (Alpinia galangal) kg 7 2,640 377 0.8% 99.2%
15 Padi (Oryza sativa L.) kg 161 100,805 626 70.4% 29.6%
16 Pepaya (Carica papaya L.) kg 2 1,200 600 100%
17 Pisang (Musa sp.) tandan 36 859 24 10.2% 89.8%
18 Sawi (Brassica juncea (L.) chern) kg 1 10 10 100%
19 Sereh (Andropogon citratus dc) kg 4 1,050 263 100%
20 Singkong (Manihot esculenta) kg 54 26,680 494 6.3% 93.7%
21 Talas (Colocasia esculenta) kg 4 565 141 7.1% 92.9%
22 Terong (Solanum melongena L.) kg 2 150 75 100%
23 Timun (Trichosanthes cucumeroides maxim) kg 14 13,045 932 0.3% 99.7%
24 Tomat (Solanum lycopersicum) kg 3 496 165 0.2% 99.8%
25 Ubi Jalar (Ipomoea batatas) kg 1 450 450 11.1% 88.9% Source: Household survey data
Paying attention to the returns gain from kebuns, data derived from respondents shows that among the
commodities produced in the plot (excluded Paddy), Timun, Cabe, Caesin, Jagung, Kacang kedelai, and
Ubi Jalar are the most valuable species, provided above five million rupiah per hectare.

- 30 -
Table 25. Farm income by land use type (per ha)
No Commodity Unit n = plot Price (Rp/unit)
Average Yield (per
ha)
Income (Rp000/ha)
1 Bayam (Alternanthera amoena voss) ikat 1 500 9,000 4,500 2 Buncis (Phaseolus vulgaris) kg 8 1,650 677 1,116 3 Cabe (Capsicum frutescens) kg 8 7,500 1,007 7,549 4 Caesin (Brassica rapa L.) kg 4 1,500 3,400 5,100 5 Jagung (Zea mays L.) kg 6 3,000 1,904 5,713 6 Jahe (Zingiber offcinale) kg 6 2,167 1,735 3,759 7 Kacang kedelai (Soya max piper) kg 1 2,000 2,500 5,000 8 Kacang panjang (Vigna sinensis) kg 15 1,321 2,008 2,653 9 Kacang tanah (Arachis hypogaea L) kg 5 2,200 1,680 3,696
10 Kangkung (Ipomoea aquatica forsk) ikat 1 500 1,200 600 11 Katuk (Sauropus androgynus merr) ikat 1 500 2,000 1,000 12 Kucai (Allium tuberosum) ikat 10 405 4,242 1,718 13 Kunyit (Curcuma longa) kg 5 833 3,824 3,187 14 Lengkuas (Alpinia galangal) kg 7 686 1,831 1,256 15 Padi (Oryza sativa L.) kg 161 2,369 4,151 9,834 16 Pepaya (Carica papaya L.) kg 2 650 2,625 1,706 17 Pisang (Musa sp.) tandan 36 7,741 428 3,315 18 Sawi (Brassica juncea (L.) chern) kg 1 40 - 19 Sereh (Andropogon citratus dc) kg 4 475 1,421 675 20 Singkong (Manihot esculenta) kg 54 510 6,924 3,531 21 Talas (Colocasia esculenta) kg 4 500 1,831 916 22 Terong (Solanum melongena L.) kg 2 1,025 300 308 23 Timun (Trichosanthes cucumeroides maxim) kg 14 975 8,999 8,774 24 Tomat (Solanum lycopersicum) kg 3 1,750 1,754 3,070
25 Ubi Jalar (Ipomoea batatas) kg 1 1,000 5,000 5,000 Source: Household survey data
The study found that most of the yields of the species planted in the plot were sold. Data recorded from
the surveyed household shows that high value species (Cabe, Caesin, Kacang kedelai ) mosly sold
directly through consumer, this show that farmers lack adequate market information and market access,
while others species (Jagung, Timun, Ubi jalar) mostly sold through collector.
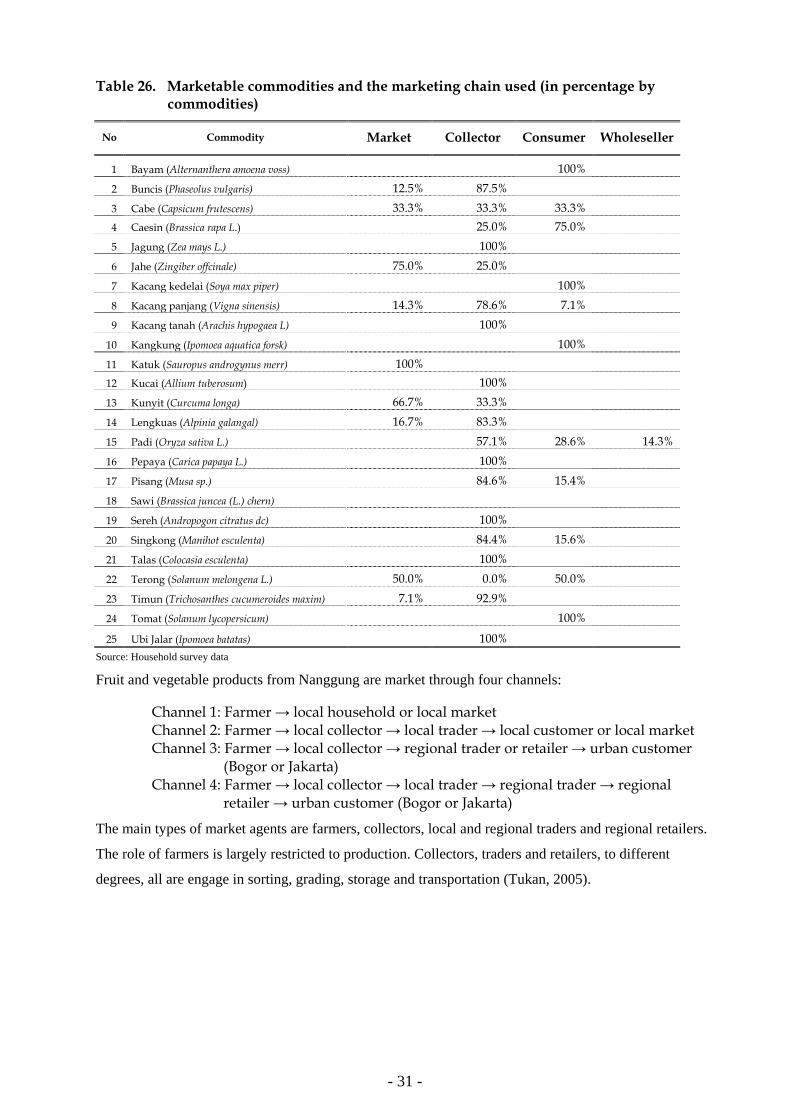
- 31 -
Table 26. Marketable commodities and the marketing chain used (in percentage by commodities)
No Commodity Market Collector Consumer Wholeseller
1 Bayam (Alternanthera amoena voss) 100% 2 Buncis (Phaseolus vulgaris) 12.5% 87.5% 3 Cabe (Capsicum frutescens) 33.3% 33.3% 33.3% 4 Caesin (Brassica rapa L.) 25.0% 75.0% 5 Jagung (Zea mays L.) 100% 6 Jahe (Zingiber offcinale) 75.0% 25.0% 7 Kacang kedelai (Soya max piper) 100% 8 Kacang panjang (Vigna sinensis) 14.3% 78.6% 7.1% 9 Kacang tanah (Arachis hypogaea L) 100%
10 Kangkung (Ipomoea aquatica forsk) 100% 11 Katuk (Sauropus androgynus merr) 100% 12 Kucai (Allium tuberosum) 100% 13 Kunyit (Curcuma longa) 66.7% 33.3% 14 Lengkuas (Alpinia galangal) 16.7% 83.3% 15 Padi (Oryza sativa L.) 57.1% 28.6% 14.3% 16 Pepaya (Carica papaya L.) 100% 17 Pisang (Musa sp.) 84.6% 15.4% 18 Sawi (Brassica juncea (L.) chern) 19 Sereh (Andropogon citratus dc) 100% 20 Singkong (Manihot esculenta) 84.4% 15.6% 21 Talas (Colocasia esculenta) 100% 22 Terong (Solanum melongena L.) 50.0% 0.0% 50.0% 23 Timun (Trichosanthes cucumeroides maxim) 7.1% 92.9% 24 Tomat (Solanum lycopersicum) 100%
25 Ubi Jalar (Ipomoea batatas) 100% Source: Household survey data
Fruit and vegetable products from Nanggung are market through four channels:
Channel 1: Farmer → local household or local market Channel 2: Farmer → local collector → local trader → local customer or local market Channel 3: Farmer → local collector → regional trader or retailer → urban customer
(Bogor or Jakarta) Channel 4: Farmer → local collector → local trader → regional trader → regional
retailer → urban customer (Bogor or Jakarta)
The main types of market agents are farmers, collectors, local and regional traders and regional retailers.
The role of farmers is largely restricted to production. Collectors, traders and retailers, to different
degrees, all are engage in sorting, grading, storage and transportation (Tukan, 2005).

- 32 -
d) Gender Roles in Agricultural Undertaking The purpose of this section is to contribute to a better understanding of the roles women and men play in
the different stages of agriculture as well as other production and income-generating activities. This
study looks at what different women and men are doing especially in agricultural activities. As seen in
Table 27., women involved in agriculture is limited to certain activities, in paddy field, women had
proportion more than 15% of labor input only in nursery, maintaining, fertilizing, and harvesting
activities. But for others land use, proportion of women labor very small. Involvement in agriculture
may therefore partly depend on whether the household can afford to hire in labour or not. Gender roles
in Nanggung are probably restricted by socio-cultural factors.
Table 27. Average Level of Labour Input by land use type (per plot)
Irrigated Paddyfield
Rainfed Paddyfield
Dry Land
Monoculture Garden
Simple Agroforest Total
No of Plot 99 64 83 18 43 307 Total Area (ha) 28.38 15.03 17.24 2.73 12.45 75.83 Labor inputs Land Preparation
~ Proportion of male (%) 99.7% 99.2% 99.2% 100% 99.6% 99.4% ~ Proportion of female (%) 0.3% 0.8% 0.8% 0% 0.4% 0.6%
Nursery ~ Proportion of male (%) 73.4% 92.7% 100% 100% 100% 82.4% ~ Proportion of female (%) 26.6% 7.3% 0% 0% 0% 17.6%
Planting ~ Proportion of male (%) 59.6% 54.7% 83.3% 84.9% 94.1% 71.1% ~ Proportion of female (%) 40.4% 45.3% 16.7% 15.1% 5.9% 28.9%
Maintaining ~ Proportion of male (%) 56.1% 52.1% 78.2% 78.7% 88.3% 67.9% ~ Proportion of female (%) 43.9% 47.9% 21.8% 21.3% 11.7% 32.1%
Fertilizing ~ Proportion of male (%) 75.1% 98.0% 89.8% 70.5% 99.5% 87.1% ~ Proportion of female (%) 24.9% 2.0% 10.2% 29.5% 0.5% 12.9%
Harvesting ~ Proportion of male (%) 66.5% 70.4% 78.9% 88.3% 98.3% 72.5% ~ Proportion of female (%) 33.5% 29.6% 21.1% 11.7% 1.7% 27.5%
Total Labor Input ~ Proportion of male (%) 76.0% 77.9% 87.9% 90.4% 95.9% 82.4% ~ Proportion of female (%) 24.0% 22.1% 12.1% 9.6% 4.1% 17.6%
Source: Household survey data
The Gender role in cultivating vegetables depend on father, mother, and children’s skills. Certain
perennial vegetable tree crop (Melinjo, Petai, etc) needed special skill in harvesting, such as climbing
skill. Gender role in selling product depends on the quantity. If the harvest product comes in a great
number, then father will be the one who sell it through wholeseller or directly to the market, but if there’s
only small amount, then mother will sell it retailly to local store in the neighborhood (Setiawan, 2006).
Table 28. Who control the expenditure for Agricultural inputs

- 33 -
Hambaro Parakan Muncang Sukaluyu Total
n 62 n 63 N 60 n 185
Family Head 49 79.0% 54 85.7% 49 81.7% 152 82.2% Wife 11 17.7% 3 4.8% 4 6.7% 18 9.7% No agricultural expenditure 2 3.2% 6 9.5% 7 11.7% 15 8.1%
Source: Household survey data
Looking at Table 28., the expenditure for agricultural inputs are mostly the domain of men. This means
that it may be difficult for women to make decisions over how money is spent.

- 34 -
Concluding remarks
1. The project site, Kecamatan Nanggung, includes 7,022.3 (63.8%) hectare of arable land comprised of
paddy field (1,740.7 ha.), ladang/kebun (1,836.5 ha.), community forest (144 ha.), and
Perhutani/State Forest Corporation (SFC) land (2,050 ha.). The remaining area is housing and other
infrastructures and other uses . All paddy fields, ladang/kebun lands and community forests are
privately owned. In total these privately held (farmer owned) lands compose 3,721.3 ha (52.3%).
The rest (47.7%) are officially under the management of SFC and other large scale plantations.
However, discussion with farmers/government officials and observation found that there are patches
of government land that is being cultivated by farmers, however detailed data is not available to
quantify this situation.
2. Population growth during the last three years (since 2003) was 0.40% per year, lower than West Java
Province and even than national growth. Population density of the area is 683 persons per square
kilometers (ps.km-2), lower than for West Java, varies from 155 ps.km-2 in Malasari (the upper most
village) to 2,347 ps.km-2 in Kalong Liud. Agricultural density of Kecamatan Nanggung is 11 ps/ha,
while at village level the ratio varies from 6 ps ha-1 (Malasari) to 33 ps ha-1 in Sukaluyu. Seven out
of 10 villages are above the kecamatan average. It’s indicated that agriculture intensification is
necessary in many villages of Kecamatan Nanggung.
3. Agriculture is an economic mainstay of Nanggung population, where 63.4% of working population
(economically active population) engages in agriculture, higher than national data (46.3%). The
survey clear demonstrated that problems stem not merely from the natural capital available for the
people, but also inform limitations of human capital and financial capital that are not easy to resolve.
The evidence of low level education attainment, such as 5.9 % of the respondents were illiterate,
and most of the respondents (87.6%) never went through beyond elementary level and primary
school enrollment rate is also low (87.8%), is an example.
4. The assessment of income and expenditure of the surveyed households found that the largest
proportion of family income were spent on food (62%) and other non-food consumption that is
categorized as basic needs for the family livelihood. Although most of people in Nanggung engage
in agriculture (work as farmer), agricultural does not contribute the most to family income.
Agricultural income contributed 14% to the total households’ income. From a living standard point
of view, applying the poverty line of BPS (2005), the study found that 52% of the surveyed
households are below poverty line, and thus are categorized as poor. Hambaro was the worst among
the three sample villages; hence, about 68% of the people were below poverty line.

- 35 -
5. There are 310 plots within 163 plots (43.4 ha) of rice field, 83 plots (17.2 ha) of dryland agriculture
(Tegal/ladang) and 18 plots (2.7 ha) of monoculture gardens and 43 plots (12.4 ha) of multi-species
tree garden controlled by the surveyed households. The study revealed that 11% of the total
agricultural land controlled by the surveyed household belongs to others and is cultivated by means
of renting in, sharecropping, or just numpang. Unequal land distribution is a characteristic of the
study site, where the bottom 60% of the surveyed household controlled only 15% of total
landholding size, while the top 20% controlling about 62% of the total landholding size. Land use
systems practices of the plot samples before and during the years of ownership by current land
holder, the plot number of land use types relatively remain stable. In further detail, to relate those
land use type before owned to the current land use type, it is found that rainfed paddy field,
monoculture garden, and complex agroforest, tend to changed by household into other land use type.
While irrigated paddy field, dryland, and simple agroforest relatively remain stable.
6. Intensive agriculture (paddy field, dryland and monoculture garden) mostly takes place in the
relatively flat area, more than 80% of the plots are considered by the respondents as gently to slightly
steep area. Regarding to soil fertility, most of respondents consider their land quite fertile to very
fertile. With the exception of the irrigated paddy fields, all other plots depend on rain as source of
water to support crop production.
7. We founds 23 vegetables species and two staple crop species (paddy and cassava). The top five
vegetables species found in of plots samples were : Pisang (Musa sp.), Kacang panjang (Vigna
sinensis), Timun (Trichosanthes cucumeroides maxim), Kucai (Allium tuberosum) and Buncis
(Phaseolus vulgaris). This species are mostly cultivated in dryland and simple agroforest plots. The
tree species used to plant in Dudukuhan are Alpukat (Persea Americana), Melinjo (Gnetum gnemon),
Nangka (Artocarpus heterophyllus), Jengkol (Pithecellobium jiringa), Durian (Durio zibethinus),
Kecapi (Sandoricum koetjape), Sengon (Paraserianthes falkataria), Mangga (Mangifera indica),
Petai (Parkia speciosa), and Pinus (Pinus sp). Kacang panjang (Vigna sinensis), Timun
(Trichosanthes cucumeroides maxim), Kucai (Allium tuberosum) and Buncis (Phaseolus vulgaris),
are the most common annual crops cultivated by farmer under Dudukuhan system.
8. Land preparation is the activity most commonly conducted in the farm. Harvesting, maintaining and
planting, respectively are the activities that require the most labor. The number of person-days
involve in land preparation is much higher than the number of person-days involved in other
activities. Number of person-days involved in nursery activities and fertilizing activities is the
lowest compare with the others activities. Labor inputs, shows that the larger area of plot samples
the less labor input will be. It can be understood that farmers who have small parcel of tends to
intensify their land for their livelihood. It does also relate to the availability of labor. Farmers who
have larger area of agricultural land, without a sufficient amount of labor tend to practice less labor
intensive agricultural systems, such tree-based systems.
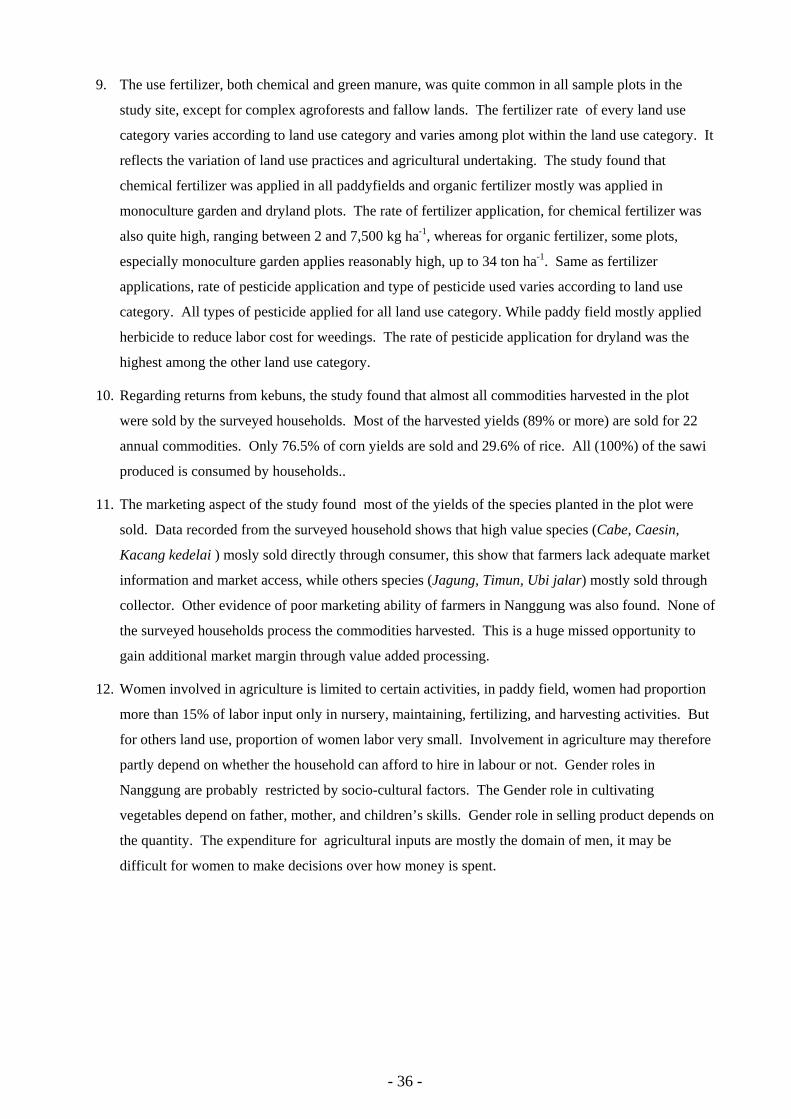
- 36 -
9. The use fertilizer, both chemical and green manure, was quite common in all sample plots in the
study site, except for complex agroforests and fallow lands. The fertilizer rate of every land use
category varies according to land use category and varies among plot within the land use category. It
reflects the variation of land use practices and agricultural undertaking. The study found that
chemical fertilizer was applied in all paddyfields and organic fertilizer mostly was applied in
monoculture garden and dryland plots. The rate of fertilizer application, for chemical fertilizer was
also quite high, ranging between 2 and 7,500 kg ha-1, whereas for organic fertilizer, some plots,
especially monoculture garden applies reasonably high, up to 34 ton ha-1. Same as fertilizer
applications, rate of pesticide application and type of pesticide used varies according to land use
category. All types of pesticide applied for all land use category. While paddy field mostly applied
herbicide to reduce labor cost for weedings. The rate of pesticide application for dryland was the
highest among the other land use category.
10. Regarding returns from kebuns, the study found that almost all commodities harvested in the plot
were sold by the surveyed households. Most of the harvested yields (89% or more) are sold for 22
annual commodities. Only 76.5% of corn yields are sold and 29.6% of rice. All (100%) of the sawi
produced is consumed by households..
11. The marketing aspect of the study found most of the yields of the species planted in the plot were
sold. Data recorded from the surveyed household shows that high value species (Cabe, Caesin,
Kacang kedelai ) mosly sold directly through consumer, this show that farmers lack adequate market
information and market access, while others species (Jagung, Timun, Ubi jalar) mostly sold through
collector. Other evidence of poor marketing ability of farmers in Nanggung was also found. None of
the surveyed households process the commodities harvested. This is a huge missed opportunity to
gain additional market margin through value added processing.
12. Women involved in agriculture is limited to certain activities, in paddy field, women had proportion
more than 15% of labor input only in nursery, maintaining, fertilizing, and harvesting activities. But
for others land use, proportion of women labor very small. Involvement in agriculture may therefore
partly depend on whether the household can afford to hire in labour or not. Gender roles in
Nanggung are probably restricted by socio-cultural factors. The Gender role in cultivating
vegetables depend on father, mother, and children’s skills. Gender role in selling product depends on
the quantity. The expenditure for agricultural inputs are mostly the domain of men, it may be
difficult for women to make decisions over how money is spent.

- 37 -
References
Biro Pusat Statistik. 2003. Statistik Indonesia (Statistical Yearbook of Indonesia). Central Bureau of Statistics. Jakarta, Indonesia.
Badan Pusat Statistik. 2005. Pelaksanaan Pendataan Rumah Tangga Miskin 2005. Jakarta: BPS.
BPS Bogor (Biro Pusat Statistik Kabupaten Bogor). 1998. Kecamatan Nanggung dalam Angka. Bogor.
BPS Bogor (Biro Pusat Statistik Kabupaten Bogor). 1999. Kecamatan Nanggung dalam Angka. Bogor.
BPS Bogor (Biro Pusat Statistik Kabupaten Bogor). 2000. Kecamatan Nanggung dalam Angka. Bogor.
BPS Bogor (Biro Pusat Statistik Kabupaten Bogor). 2001. Kecamatan Nanggung dalam Angka. Bogor.
BPS Bogor (Biro Pusat Statistik Kabupaten Bogor). 2003. Kecamatan Nanggung dalam Angka. Bogor.
Budidarsono S.; Wijaya K.; Roshetko J. 2006. Farm and household economic study of Kecamatan Nanggung, Kabupaten Bogor, Indonesia: a socio-economic base line study of agroforestry innovations and livelihood enhancement. Bogor, Indonesia: World Agroforestry Centre (ICRAF) ICRAF Working Paper no. 19, 49p.
Kecamatan Nanggung. 2006. Profil Kecamatan Nanggung Maret 2006. Bogor.
Khon Kaen University. 1987. Rapid Rural Appraisal: Proceedings of The 1985 International Conference on RRA. Khon Kaen University. Thailand.
Manurung G.E., Roshetko J. Budidarsono S, Tukan J.C.. 2005. Dudukuhan – Traditional Tree Farming Systems for Poverty Reduction. World Agroforestry Centre (ICRAF) ICRAF – Bogor, Indonesia.
Tukan J.C, Roshetko J, Budidarsono S, Manurung G.E. 2005. Market Chain Improvement: Linking Farmers to Markets in Nanggung, West Java, Indonesia. World Agroforestry Centre (ICRAF) ICRAF – Bogor, Indonesia.
Setiawan N.N. 2006. Baseline Study on Vegetable Priority Species, Current Practices, and Gender Role in Nanggung Sub-district Agroforestry System. Practical Activity Report. Program Study of Biology, Bandung Institute of Technology. Bandung.

- 38 -
ANNEX

39
Table A1. Land Uses in Kecamatan Nanggung (ha)
Malasari Bantar Karet Cisarua Curug
Bitung Nanggung Pangkal Jaya Sukaluyu Hambaro Kalong
Liud Parakan Muncang Jumlah
Total Area 4,756.40 841.04 1,411.00 1,397.00 697.40 398.92 207.30 355.78 329.00 605.20 10,999.05 Total Agricultural Land (Available Land Excluded TNGH)
2,801.00 434.68 635.00 1,268.07 374.44 319.30 142.75 270.00 260.55 516.79 7,022.58
Paddy fields 240.00 117.18 275.00 150.50 100.44 227.00 7.75 225.00 129.10 268.76 1,740.73 Ladang/Kebun - 162.18 325.00 767.57 14.00 56.30 87.00 45.00 131.45 248.03 1,836.53
Large Scale Plantation 971.00 - 30.00 50.00 200.00 - - - - - 1,251.00 Perhutani Land 1,590.00 155.32 5.00 300.00 - - - - - - 2,050.32
Community Forest - - - - 60.00 36.00 48.00 - - - 144.00 TNGH 1,787.00 - - 50.50 - - - - - - 1,837.50
Fishpond - 5.00 3.00 3.50 3.00 3.64 0.75 1.05 - 4.50 24.44 Housing 43.00 62.50 68.00 60.00 35.00 32.00 60.00 45.05 24.27 25.50 455.32
Source: Household survey data, processed

40
Table A2. Physical Infrastructure and Public Utilities of Kecamatan Nanggung
Physical infrastructures and
Public utilities Unit Ratio to the related significance unit.
Road network
- Paved/asphalted 70 km 636 m km-2, - Gravelled 110.5 km 1,004 m km-2 - Dirt road 116.4 km 1,058 m km-2
Irrigation facilities
- Dam (public work) 3 - Dam (self-reliance)
Domestic water - Sallow well - Community domestic water network
Electricity supply (PLN) 7,619 houses
in nine villages 43.40%
Telephone line 1.010 households 5.22%
Education Facility - Kindergarten : 1 1 - Elementary school (SD/MI) 44 / 16 - Junior secondary school (SLTP/MT) 1/3 - Senior secondary school (SMU) 0
Health Facility
- Puskesmas - Public health centre 2 - Puskesmas Pembantu 2 - Posyandu - Integrated health services for
mother and kids (settlement based) 92 9 village-1 - Family planning post 1
Marketing facilities
- Market 2 - Kiosk /warung 587 - Toko 39 - others 295
Source: Household survey data, processed
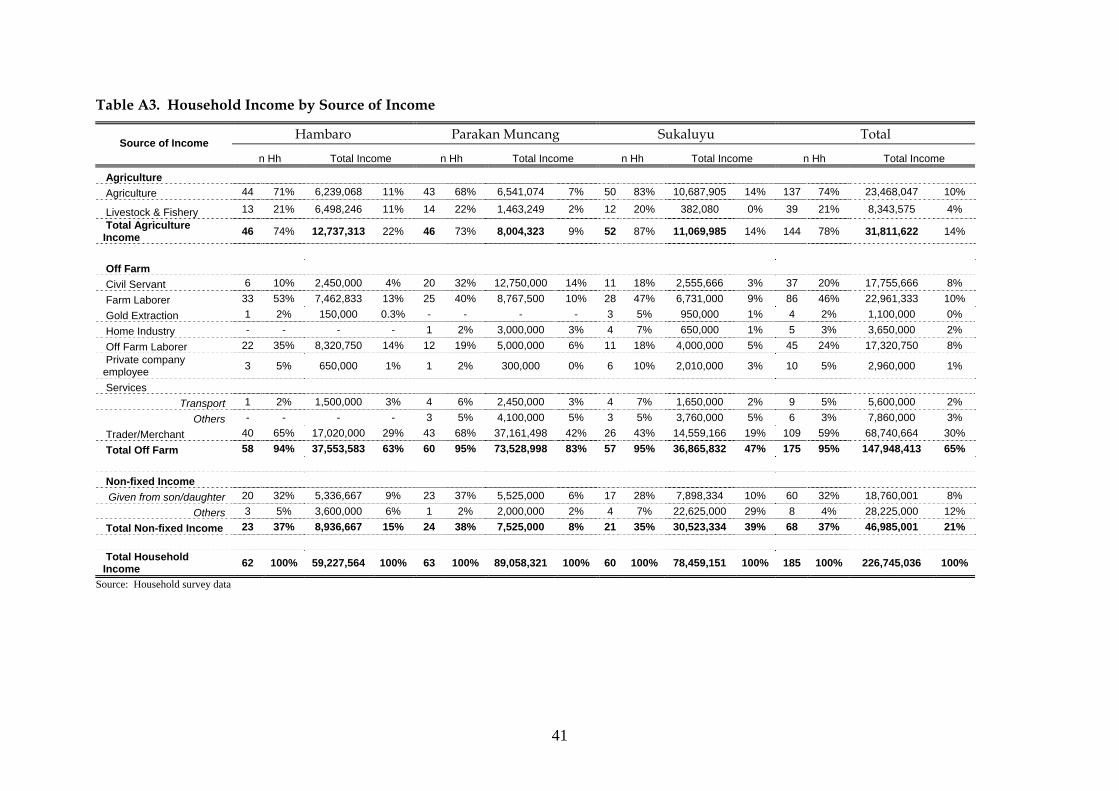
41
Table A3. Household Income by Source of Income
Hambaro Parakan Muncang Sukaluyu Total Source of Income
n Hh Total Income n Hh Total Income n Hh Total Income n Hh Total Income
Agriculture Agriculture 44 71% 6,239,068 11% 43 68% 6,541,074 7% 50 83% 10,687,905 14% 137 74% 23,468,047 10%
Livestock & Fishery 13 21% 6,498,246 11% 14 22% 1,463,249 2% 12 20% 382,080 0% 39 21% 8,343,575 4% Total Agriculture Income 46 74% 12,737,313 22% 46 73% 8,004,323 9% 52 87% 11,069,985 14% 144 78% 31,811,622 14%
Off Farm Civil Servant 6 10% 2,450,000 4% 20 32% 12,750,000 14% 11 18% 2,555,666 3% 37 20% 17,755,666 8% Farm Laborer 33 53% 7,462,833 13% 25 40% 8,767,500 10% 28 47% 6,731,000 9% 86 46% 22,961,333 10% Gold Extraction 1 2% 150,000 0.3% - - - - 3 5% 950,000 1% 4 2% 1,100,000 0% Home Industry - - - - 1 2% 3,000,000 3% 4 7% 650,000 1% 5 3% 3,650,000 2% Off Farm Laborer 22 35% 8,320,750 14% 12 19% 5,000,000 6% 11 18% 4,000,000 5% 45 24% 17,320,750 8% Private company employee 3 5% 650,000 1% 1 2% 300,000 0% 6 10% 2,010,000 3% 10 5% 2,960,000 1%
Services Transport 1 2% 1,500,000 3% 4 6% 2,450,000 3% 4 7% 1,650,000 2% 9 5% 5,600,000 2%
Others - - - - 3 5% 4,100,000 5% 3 5% 3,760,000 5% 6 3% 7,860,000 3% Trader/Merchant 40 65% 17,020,000 29% 43 68% 37,161,498 42% 26 43% 14,559,166 19% 109 59% 68,740,664 30% Total Off Farm 58 94% 37,553,583 63% 60 95% 73,528,998 83% 57 95% 36,865,832 47% 175 95% 147,948,413 65% Non-fixed Income Given from son/daughter 20 32% 5,336,667 9% 23 37% 5,525,000 6% 17 28% 7,898,334 10% 60 32% 18,760,001 8%
Others 3 5% 3,600,000 6% 1 2% 2,000,000 2% 4 7% 22,625,000 29% 8 4% 28,225,000 12% Total Non-fixed Income 23 37% 8,936,667 15% 24 38% 7,525,000 8% 21 35% 30,523,334 39% 68 37% 46,985,001 21% Total Household Income 62 100% 59,227,564 100% 63 100% 89,058,321 100% 60 100% 78,459,151 100% 185 100% 226,745,036 100%
Source: Household survey data

42
Table A4. Vegetables Species Cultivated by surveyed household (by landuse types and Hectare)
Irrigated Paddyfield
Rainfed Paddyfield Dry Land Monoculture
Garden Simple
Agroforest Total No Commodity
(% of n=99)
Area (ha)
(% of n=99)
Area (ha)
(% of n=99)
Area (ha)
(% of n=99)
Area (ha)
(% of n=99)
Area (ha)
(% of n=99)
Area (ha)
1 Bayam (Alternanthera amoena voss) 1.2% 0.10 0.3% 0.10 2 Buncis (Phaseolus vulgaris) 1.6% 0.25 4.8% 2.15 7.0% 1.10 2.6% 3.50 3 Cabe (Capsicum frutescens) 7.2% 1.18 5.6% 0.15 2.3% 0.10 2.6% 1.43 4 Caesin (Brassica rapa L.) 1.0% 0.05 3.6% 0.21 1.3% 0.26 5 Jagung (Zea mays L.) 4.8% 1.85 4.7% 0.28 2.0% 2.13 6 Jahe (Zingiber offcinale) 1.0% 0.60 1.6% 0.02 3.6% 0.51 5.6% 0.02 2.0% 1.15 7 Kacang kedelai (Soya max piper) 1.6% 0.02 0.3% 0.02 8 Kacang panjang (Vigna sinensis) 2.0% 0.16 12.0% 4.27 7.0% 0.98 4.9% 5.41 9 Kacang tanah (Arachis hypogaea L) 1.0% 0.10 1.6% 0.03 2.4% 0.60 5.6% 0.10 1.6% 0.83
10 Kangkung (Ipomoea aquatica forsk) 1.2% 0.10 0.3% 0.10 11 Katuk (Sauropus androgynus merr) 1.2% 0.30 0.3% 0.30 12 Kucai (Allium tuberosum) 3.6% 1.55 16.3% 2.55 3.3% 4.10 13 Kunyit (Curcuma longa) 1.0% 0.60 3.6% 1.01 2.3% 0.50 1.6% 2.11 14 Lengkuas (Alpinia galangal) 7.2% 2.46 4.7% 0.60 2.6% 3.06 15 Padi (Oryza sativa L.) 99.0% 28.28 95.3% 14.55 2.4% 0.19 52.4% 43.02 16 Pepaya (Carica papaya L.) 2.4% 0.50 0.7% 0.50 17 Pisang (Musa sp.) 2.0% 1.10 1.6% 0.05 26.5% 3.15 16.7% 0.53 18.6% 1.32 11.7% 6.15 18 Sawi (Brassica juncea (L.) chern) 1.2% 0.25 0.3% 0.25 19 Sereh (Andropogon citratus dc) 2.4% 0.70 4.7% 1.05 1.3% 1.75 20 Singkong (Manihot esculenta) 1.0% 0.10 7.8% 0.71 47.0% 7.56 20.9% 2.65 17.6% 11.01 21 Talas (Colocasia esculenta) 3.6% 0.25 2.3% 0.10 1.3% 0.35 22 Terong (Solanum melongena L.) 2.4% 1.10 0.7% 1.10
23 Timun (Trichosanthes cucumeroides maxim) 3.0% 0.61 9.6% 2.70 7.0% 0.68 4.6% 3.99
24 Tomat (Solanum lycopersicum) 3.6% 0.20 1.0% 0.20 25 Ubi Jalar (Ipomoea batatas) 5.6% 0.02 0.3% 0.02
Source: Household survey data