research report on virginia apple objective count … research report on virginia apple objective...
TRANSCRIPT

1;
Research Report on
Virginia Apple Objective Count Surveys
by
Tyler R. Sturdevant
Research and Development Branch
Standards and Research Division
Statistical Reporting Service
October 1967

•• 1 ,.... Table of Contents
~I
•,.'
I. Introduction'':I
II. Background·• ,'3..:
III. Field Procedures
A. Chronoll>gy
B. Tree Selection, ',,;;;.(!
C. Count Survey
1. 'count limb selection procedure
, 2l. 'c'~sition on limb where measurement taken
, :~ -3 ;i' ""Combiningof small limbs to make desired sample CSA
. 4~.;<~raentification of terminal limb# ."; ••
) ;5 .~,.:.,Counting technique, forecast and harve st
.,,:, ) D'.,: S1-ze Growth Stujy
.;~ ~. h~,i'Cq'aglimb seleCtion procedure
. ,', 2.i~' :Apple selection and numbering
, 3~':~)(Applemeasuring and data recording
, •. Harvest Weight Survey
, 1;: ::'<Taglimb apple weights
2.'-j: ' Count limb apple weights.~~
3'~ Tree harvest apple weights
F. Orchard Production Report
IV. Analysis of Data
A. Description of Forecast MOdel, Sample Size Necessary
B. Projection of Numberof Apples Available at Harvest
c. Estimation of Fruit Droppage and Harvest Loss
D. Projection of Harvest Weight
E. Size Distribution of Harvest

--continuedV. Summary Tables Relating to Analysis of Data
A. Table 2a, ::"963-64 Count Limb Random Paths, Cross SectionalB. Table 2b, 1965 Count Limb Selection, Random Paths, Cross SectionalC. Table 3, Derivation of Harvest Counts of Apples, Sample Trees 1963,
1964, 1965 ..D. Table 4a, Expanded Counts, Derived Harvest Counts, by Tree 1963,19fA1~E. Table 4b, Expanded Counts, Derived Harvest Counts, by Tree 1965F. Table 4c, Cross Sectional Areas of Sample Limbs with Associated
Counts and weights of Apples, 1963-1965G. Table 5, Number of Apples Measured by Survey Date and Tree 1963,
1964, 1965H. Table 6a, Va. Apple Counts Survey, 1963I. Table 6b, Va. Apple Counts Survey, (Sun:mary),1964J. Table 6c, Va. Apple Counts Survey, (Summary), 1965K. Table 7a, Size Distribution of Apples, Diameter for each Survey Date,
1963L. Table 7b, Size Distribution of Apples, Diameters for each Survey -
Date, 1964M. Table 7c, Size Distribution of Diameters for each Survey Date, 1965N. Table 8a, Apples HaEVested per 1" CSA for each tree, 1963O. Table'8b, Apples Harvested per 1" CSA for each tree, 1964P. Table 8c, Apples Harvested per 1" CSA for each tree, 1965Q. Table 9a, Average Weight per apple (Tag Limb) by Diameter Class by
tree, 1963R. Table 9b, Average 'We'ightper apple '(Tag Limb) by Diameter Class by
tree, 1964S. Table 9c, Average Weight per apple (Tag Limb) by Diameter Class by
tree, 1965T. Table lOa, Calculation of weighed average weight per apple, by tree
1963U. Table lOb, Calculation of weighed average weight per apple, by tree
1964V. Table 10c, Calculation of weighed average weight per apple, by tree
1965W. Table 11, Comparison of Expansions of Count Limbs Weights, Tree
Production Weights, and Actual Production, 1963, 1964, 1965X. Chart I, Increase in apple diameters by days after full bloomY. Chart II, Distribution of Diameters on July 1 by yearsZ. Chart III, Distribution of Diameters at Harvest by years
M. Chart IV, Predicted harvest distribution of diameter based ondiameters and set of fruit per 1" of CSA on July 1
VI. Conclusion

-1-
Report on Virginia Apple Objective Counts Survey
I. Introduction
The appl~. project was comucted for three seasons, 1963 through 1965, withina c~.r<tt-t¥- o.rctard in northern Virginia. The purpose was to developobjectiveYieli:I-procedures by periodic counts and measurements of apples onsample tree's . This project was umertaken jointly by the Research andDevelopment Branch of the standards and Research Dvislon and the Virginia 'State Office of the Field Operations Division, both of':.the StatisticalReport~ng Service, USDA. :';:;~:.k:. ~,
~J, ~'~i (:': ,...t, ~
II. Background
Before describiIIg field procedures iam analysis of data, it is helpful toexplore the thinking behim the chdf~e of the methods employed in the survey.
t he:: . '.;..;'First of all, Jt1st what is to be est!.ina.ted, am to what poi~t .in the ~eas'dn'lPrimarily, th~ 'objecti ve of the surVey is to be able 'bo preiict the num'bElr',of bushels '9f)apples to be harvest~d"per tree as early in the setison as- : !d., ",'possible. A supplementary objective is to be able to project size distributionof appf,es at harvest time as early in the season as possible ..
" . IJ'~,~~i1", , . , • '
Apple flower buds are ini ti~t.~,9;,.d~ing the season prior to their opening.Thus it is possible to get ~o~ '~i\ie to next year's prOduction potentialbefore the current crop is lii1~ested. Since environmental factors aff:ectfrui t bud development, howe.ve;r.1there is a great deal of uncertainty atthat point. For exatlIple, :f!i.~~4#l;Wand duration of light affect the dif-ferentiation of ~~7e fruit '1¥~',~.d':1.rl! \,;11 ;:~,1,;, ,.,L:. :'1.''
:~~:: ~~~d~~n a:~~s:~ce=~:~:;~ei'~~~:~ic~~t~~r:i:~~~fb~~~::~ms."the profusion of blOs,!3o~on a tree and' ~"~ harvest' Yie~~' ':~here is at1l:). toomuchuncert~inty concerning pollination,' d:amagipgfreezihg temper~.tures, ,June droppage, and thinning to justify a major effort' 'at tills point Irl' the.'season.
In Northern Virginia:, 'by July 1 the apples that remairi"on the tree undergo'little droppage from"thEm'until harvest. Consequen1:f1:y.;-'assoon as tMJunedrop h~8 6cdUrred;stiifirlient ,'stability MtF~~en adrl:evE!dta';providEfa' bl:isisfor prOjecting apples tt1l!be haI'Vested and sh.tindi&atloIi"df Wvel:i-eLsize .distribution. Si1bsequ.efttlY:,'duriOg ,the gro'Wirtg~6eason,periodiC!;'measuresof gro'Wth"6antbEVmadc'tb::"z~o'?.tn~' ~ro~h t'ataS. '....i ",i 'I,; ":, ',;:; ,"'I:, ;L' •
• :~" '" I '.' ;. ~J':,J.'."" .~'{' .. ' ,f'> :. i~~' i "t'~: ;:; \,~ '!'~I . ~
The r.umberof bushels to be"hal'Veated'l~anr-be:'projectedfrom July~l: (lata byestimating (1) numberof apples,"on.:'1:iree~at July l~' (2) exp~cteq.'"fru~tdroppage at harvest, (3) expected harvest' size of fruit, and (4) the expectedproportion of fru.It reaching maturity but not harvested.
'JJ "A Study of the 'RelatioMh~p Between·The Anx>untof'moom and Yieldof Apples", R. P. Langley, Canadian Journai of Plant Science, 40:52-57

-2---continued
Various methods are available for estimating the numbe~of apples on treeson July 1. A complete count of fruit on a tree is extremely t~ consuming,tedious, and prone to errors. Anunbiased arid consistent InethOdis to'sample terminal branches with probabilities proportional to the cross sectionalarea of the branch, since a correlation .exists between the size of a branchand the numberof fruit on a branch. ';l'I)1smethod for selecting terminalbranches is described by R. J. Jessen.~ This involves a randompa'tl1withinthe sample tree. Another sampling techn1~e that is sometimesused is thesector approach in which fruit is counted within a sample sector of the tree.The probabilities of selection are proportional to the size of sectOr ~ .Defining sector boundaries and accurately counting fru1~ within sectors aredifficulties encountered with this methOd,aithoUghits e!3'tiJJl8.tes·are alsounbiased and. consistent. The methodused in this study was to chose onerandompath in each sample tree. For efficient sample design, estimates ofvariances (l) between branches within tree, (2) between trees within orchards,and (3) between orchards within state should be available as 'Well as costestimates for each silage of cluster sampling. In addition, samples 'Wouldordinarily need to be allocated by varieties or varietal types.
Rate of fruit droppage after the June drop until harvest is relativelystable from year to year. The droppage rate is affected by (1) extreme'Weather, including temperature extremes and high winds, (2) animal andinsect pests and desease, ,(3) cultural practices such' as thinning, and (4)numbersof fruit on trees. Of these factors, the· :first three arediff'icultto predict but not considered as major variables over large regions. Thelatter factor should be considered in predictiag normal droppage since itis obvious that the larger the numberof fruit on trees, the more fru1t thereis to drop.
It has been observed that the greater the leaf area per fruit, the greater ~ItIle total size of fruit, althoUgh the relationship is not directly proportional.:OUSince leaf area on a branch is also highly correlated with the cross sectionalarea of the branch, the numberof apples per one square inch cross sectionalarea provides an indication of leaf area per fruit. Studies of the relation shipbetween fruit sizes tf temperat~e and rainfall have not showna sugnificantrelationship. Batjer!fl found highly significant correlation coefficientsbetween the diameter sizes of Winesaps at various periods after full bloomwith harvest diameter sizes for the seasons 1949-52 as follO'\ols:
?J "Determining the Fruit Count on a Tree by RandomizedBranch Sampling",R. J. Jessen, Biometrics, Vol. II, NO.1, March1955, p. 99-109
Y "Relation of Roilage to Fruit Size and Quallty in Apples and Pears",Magnessand all, State College of WashingtonExperimental Station, February,1931.
1lf "Predicting Harvest Size of Apples at Different TimesDuring theGrowingSeason", Batjer et 81, Wevatche, Washington.

-3---continued
No.Year Orchards 35 days 55 days 75 days
1~9 ',--.5 .85 .88 .891950 4 .66 1 .73 ..86,1951 4 ·72 :j ·19 .81",'
1952 5 ~80 " . .83 .81It can be observed that in each .year correla:t,ion coefficients becomehigheras the season progresses ani that variations '(betweenyears decrease. July 1survey data corresponds mst nearly to the 55 days after full bloom observations,ranging from 50 days to 63 days for 1963-1965 for the test orchard. Theseobservations indicated that while an estimation of harvest size distributionis obtainable from July 1 apple size measurements, August 1 measurements aremuchmore reliable imicators. To convert numberand sizes of apples tobushels is, relatively ,easy since ther~ is aIJ,,).nverseand fairly consistentrelationsb1p between harvest diameter~ and tIle numberof apples per bushel.
Th~ expected proportion of fruit reaching'hla'-en.tltybllt not utilized calledharvest loss, depends primarily upon two factors: (1) fruit le:ft in orchardsam (2) fruit harvested but not utilized. The latter is not usuallyconsidered muchof a factor because of the diverse pattern of utilization andextent of salvage available. The allDunt of fruit left in orchards is of mreimportance and of a complexnature. It is a fUnction of (1) numberof applesreaching maturity (2) degree of maturity at harvest (3) availability andquali ty of harvest labor, and (4) returns of apples for by-products. Mat.urityof apples at harvest c~n be affected by::~xt~nding:the harvest peridd pastthe optinwn stage due to a scar~~ lapor s~plY:. As apples becomefullymature, they tend to be attached les~,.fir*: to :'the' tree so that pi ckingladders cause heavier fruit fall. With less experienced crews, more fruit isknocked,to ,the ground duting harvest and trees are picked less clearly.Whether a grower will pick up ground falls depends upon the volume of fruiton the grol1Ildand the availability of labor. Returns of apples for by-products dQ not normally fluctuate widely from one year to the next, but doproviqe the grower guidelines as to the feasi bili ty of picking up groundfalls. Harvest losses would normally be objectively projected as a functionof apples on tree on July 1 with other factors .~ing considered equal .
III . Field Procedure . . ·.,····.1 ..,;:., ~ I •
Chronology Three types of observations were~~de : (1) a count' 'of appleson sample branches, (2) periodic diameter' me'asu.rementsof sample apples, and(3) harvest weight measurements of sample ap:p1.~~sand. sample tree production.The follOWing table shows the tiunng of the' survey:

-4---continued
Table 1: Calender of Apple Survey 1963-1965
~~~~:Days After: 15m :Days After: 1965 :Days Aft.
Event :Full B1.oom: :Full Bloom:Date :Full Bl·
Full Bloom April 24 0 May8 0 May10 0
First Measurement 2' June 26 63\, June "30 53 June 29 50(Forecast Count) '. '
Second Measurement Aug. 1 99 July 31 84 July 30 81
Third Measurement AUg. 29 ~7 Sept. 2 117 Aug. 31 113
Fourth Measurement Sept. 27 156 Sept. 25 140 Oct. 6 149."
Pre-Harvest Count ..and Measurement :9ct. 8 167 Oct. 14 159 Oct. 21 164
Harvest Period Oct. 10-17 169-176 Oct. 24 -25 169-170 Oct. 26- 169-17027
Post-Harvest Weights: None None Oct. 26 171 Oct. 27 170
Tree Section A block of 250 trees of the Red York variety was selected for study.This block was centrally located within the commercial orchard and consisted offour rows of trees. For the count survey a systematic ten percent sample of treeswas made from a. random start using a serpetine pattern. A twenty-five treesample was sEtlected in 1963 for the 1963 and 1964 counts, and a differentsample of twenty-five trees was taken in 1965. The size growth study was madefr0!Il a sub-sample of the tW£Lty-five trees. For this study in 1963 and 1964,every other tree was selected and in 1965, every third tree was used.
Count Survey From each of the t~n ty-fi ve sample trees, a count was taken ofall apples on a sample limb as of about July 1 and again just before harvest.The sample limbs, termed "Count Limbs, 11 was selected along a randompahhwith probabilities proportionate to the cross sectional area (CSA). Selectionwas designed to obtain a count limb whose CSAof primary branches five percentof the combined total CSAof primary branches. Measurements of CSAwas madewith steel tapes especially calibrated to indicate cross sectional area, insquare inches, from circumference measurements. Limbs were usually measuredabout one hand's width above the previous split with care taken to avoidlimb swells that would not be representative of the limbs size. The exceptionin this procedure was in cases where pruning several branches of the nextstage on these cases measurements were taken above pruning. The relationshipof cross sectional area to limb circumference is based upon the assumption thatlimbs are fairly circular. This is probably a safe assumption for mostapple trees. To prevent tape breakage, small sized branches were measuredby comparing their sizes with woodendowels of knownCSA. At each stage ofSlillection, branches were numberedam measured. These measurements, as wellas the cumulative measurements, were entered for each branch on the schedule.A numberwas then selected between one and the cumulative total CSAfor all

-5---continued
; "
".-, 'j;'
, , •......• ~
'.l
"·b
'j.,
branches, inclusive, from a table of ramom of numbers. The branch whosecumulative eSAwas equal to or exceeded the randomnumberwas selected. Ifthe branch so selected was considerably larger than the desired size, theselection process would continue out the branch. At each stclge, smallbranches were grouped together into units of about the desired sample' size.As a result, no intermediary fruit (fruit along path, but ,not on terminalbranches) was encounte~. Eventually, a terminal branch or; group of terminalbranches was selected; represen-w;ng five percent· of the combin,edprimarybranch eSAIS. The 'trees were ~~ed :tosh~ tree ~'bE!r ,and a y~llowstripe spray p~in~ around the. selec;1'e9.terln1.na1branch. To faci1iate ..'. \counting, th~ term1'tiai!'·branah~~s' divided' into up tofi ves:ub~branches, .;":called sub-sectionS ~ each marked witb, w~itJ'plastic tape. DuriI18 the 1965 ..season it was found desirable tQ, furt'her brealt"down there sub.•s~<;~ions into"numbered and labeled count units conta1n~~,;,~~~rally··OO. grea~er I ~~ .t,:,e~ :.' ,apples. ;Y'·,.,·,.,. I:J; '., "';" .... ' .." ," ,,':' ..1 •• J .' !.l' ·1····:;.,··
' •• ,.,,'. '0 t I •• ') /, •
For counting apples, two mancrews were us~, equipped. With ladders; countIng':'hooks, and clip boards. Each manwas to count each sub-section independentlly,and compare results. Any disparities in counts were to be examined andrecounts TlBremade to reconcile the differences. UnfortunatelY there was nottime for adequate timing or to allow reconciling differences. For some limbs,the ladders u~ed'Jre· ...not .tall eBoughto' allow the count of. ~pples .~n l1~~rbranches by feel. Sight counts were resorted to i'n:the July 1 survey inthese instances. This sometimes resulted in serious undercounts. In a4dition,other factors such as missed branches, intertwined branches, and small fruitsizes contributed to inaccurate July 1 counts. These; as well as the lack ofchecking cqunts' accounted for the large l1wlibersof July 1 counts being smallerthan harvest couhts on the same branch in each of'the three season. At .harveBt time, all fruit was removedfrom the count limbs, so- ~t ;-acCur8t~: "counts were obtained of fruit present.
Size Growth study On each of the twelve sub-sample trees in J.963 and 19611-and from each of the eight sub-sample trees 1n 1965, a sample limb differentfrom the count'limb was selected for tree size measurements of apples. Thesample limbs for size growth study, were Galled "tag limbs". They wereselecteP. .~prep'resei:.~ appro.x;Lmately.five.p~rcent:', of the combip.edeSAIs ofthe primary branches. "In selected the tag limbs, a limb in tbe sam~ stageas the count limb but other than the count limb was randomly sele.~teQ.withprobabilities proportionaJ. to CSA. Further stage selection continued if theselected limb was larg;er than five percent of the combined primary brancheSAI s until a termiIl&2..branch of the proper size was ~elected. Hence,except for the rare event on which limb was a primary branch, the tag limband count limb were from the same primary branch, and often from the samesecondary bra~cl:i'" .For 1963 and 1964, a systematic sample of 20':apples wasselected frs>P1th~.:t~g lim,?? and' a sample of :1:-5in 1965. Where fewer than
~.;' Several sizes ~f ~;~~~~ l~~de;~ ar~"necessary witb: a ~OI .1ad.a.:~lrbeing required for the large trees.
, ' .. 1,:.J.
. ;
it.
-6---continued
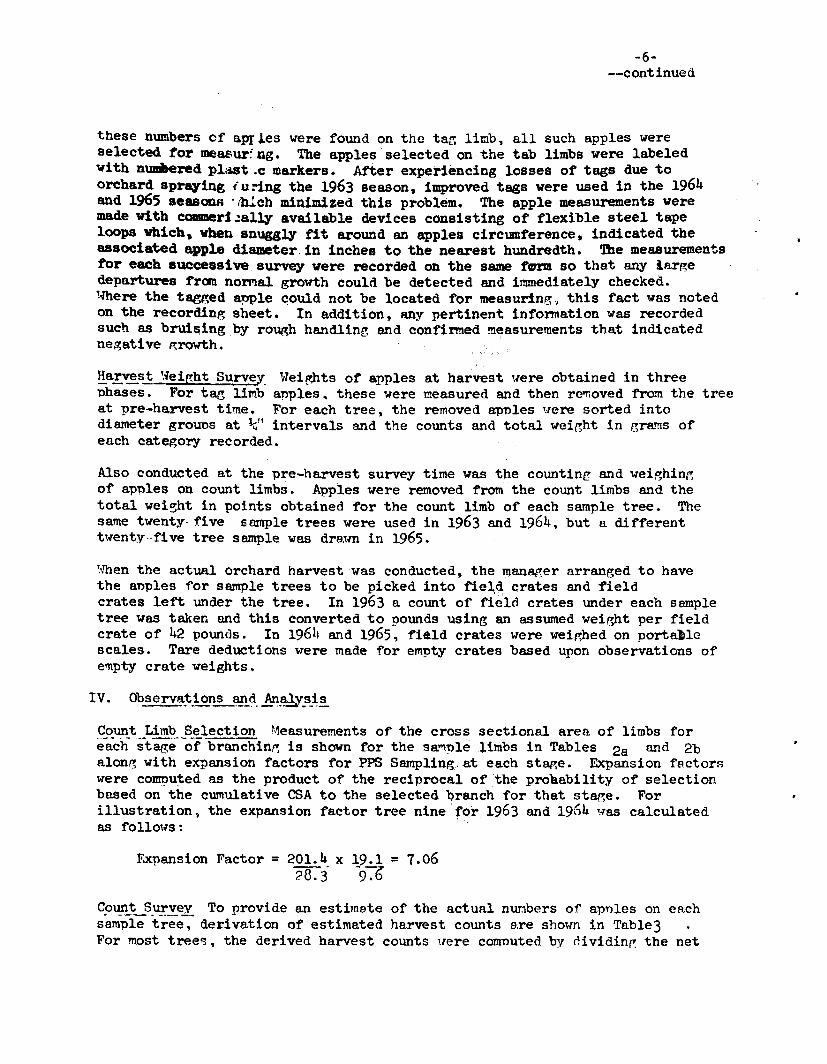
these numbersof aPIles were found on the tar; 11mb, all such apples wereselected tor me8f\ur:ng. The apples selected on the tab limbs were labeledwith n\Dll1teredpl;j,8t.c markers. After experiencing losses ot tags due toorchard sprq1ng (.u:-ing the 1963 season, improved tags were used in the 1964and 1965 seuOllR -'hlch minimized this problem. The apple measurementsweremadewith cc:.Derf~ally available devices consisting of flexible steel tapeloops which. whensnuggly fit around an apples circumference, indicated theassociated apple diameter. in inches to the nearest hundredth. '!he measurementstor each successive survey were recorded on the same 1'amn so that any larp;edepartures fram nOrMalgrowth could be detected and immediately checked.'.Jhere the tagged apple could not be located for measuring) this fact was notedon the recording sheet. In addition, any pertinent information was recordedsuch a'J bruidngby rough handlin~ and confimed measurementsthat indicatednegati ve p;rowth.
~al:~st ~ei~ht Surve~ Weights of apples at harvest were obtained in threephases. For tag limb a-pples. these were measured and then removedfrom the treeat pre-harvest time. For each tree, the removedapnles ,.,ere sorted intodiameter grouos at ~lf intervals and the counts and total wei~ht in era.rnsofeach category recorded.
Also conducted at the pre-harvest survey time was the counting and weighinr,of apples on count limbs. Apples were removedfrom the count limbs and thetotal weight in points obtained for the count limb of each sample tree. Thesametwenty- five sample trees were used in 1963 and 1964, but a differentt\-lenty-·f1ve tree sample was drawn in 1965.
~Vhenthe actual orchard harvest was conducted, the ~anarer arranged to havethe anples for sample trees to be picked into f1e~<icrates and fieldcrates left under the tree. In 1963 a count of field crates under each sampletree was taker. and this converted to pounds using an assumedwei~ht per fieldcrate of 42 pounds. In 19611 and 1965, field crates were weip,hedon portablescales. Tare deductions vTeremade for empty crates based upon observations ofe'llpty crate weights.
Count LimbSelection Measurementsof the cross sectional area of limbs fore-achstageof branchin~ is shownfor the sa"l\nlelimbs in Tables 2a and 2balon~ with expansion factors for PPSSampling.at each stap;e. Expansion fectorswere cOIll1?utedas the product of the reciprocal of the prohability of selectionbased on the cumulative CSAto the selected Qrtulch for that sta.e;e. Forillustration. the expansion factor tree nine· for 1963 and 1964 H·ascalculatedas fo110\-1s:
F~ansion Factor = 201.4 x 19.1 = 7.06::>8.3- -9b.
C.o~t-2_u.!ve'y"To provide an estimate of the actual nunbers of apnles on eachsam-pIetree, derivation of estimated harvest counts s.re shownin Table3For most trees, the derived harvest counts ,'ere comnutedby 01vidinr: the net

-7---continued
weight ot harvested ~roduction of the tree by the average harvest, wei~ht perapple for the tree aaing the apples from the sAmplelimb. In the two caseswhere net harvest '4'e1c;htswere not obte1ned f'or trees, expanded counts "Tereused from count limbs as dert ved harvest counts and the 1?roduct of theaver~~ harvest veip,ht per apple and the expanded count ,~as used as anestimate ot ,weight ot harvested production. In two other cases, no appleswere lett. on the count 11mbto be "Teighed, so on estimate was !Il8deof averageweil":ht'Per al7Ple by usinB Ii i-e~ression equation ot weights of apples harvestedfor the~l'ee. per one inch across sectional ot the combined primaries to'obtain an average weight per a'Dple. A comparison of counts ot apples on thes8.ll1plelil'tbs on July 1and at !)re-harvest alonrr,with tneir· expansions andthe derived harvest counts are shownin Tables 48 and 4b. Table shOt-1~the July count end harvest data for the' three years. Since the ded ved .harvest ,coun.'ts exclude harvest losses, they are not strictl,y cO!l\'Darableto
'the eXl)anded'Pre-harvest counts:,. Onewould expect the diff'erencebetweenexpanded forecast counts ana' pi-e~hfU.vestcounts to represent drops during~hat, ~riod •. ,As TJreviously menti,On~d,however, inaccuracies in Forecastcounts nulli tied their usefulness -tor this -purpose, ~d in many ce.ses~ouldseemln~ly infer a ne~ative drop. Accurate forecast 'counts ~·rou~dl}flve$ivena good idea of fruit dro:l)between July 1 and -nee-harvest. ~,f'QllowiMpercentages decline in numbers were observed during the three years:
Forecast to Forecast to Pre-lJarvest to!.e_8.!: E~-JTa.;:ves_t__ .!t.a..r..v~s.:L' ~qo.~e;:;_t_(!!.~~~_t..Lossl
196319641965
Ne~ative
3.65Nep;at1ve
15.3519.82
8.4112.15
9.45To the extent that forecast counts were low~ these indicated :percent~edeclines are underestimates. Thereme.y have been a slight offsettinc; factor.i.e. that fruit knocked off durin~ counting and sizin~ operations. This isnot considered a very large factor, however.
,S.izE!.Q.rt?"'!.~~~t~ For the sub-sample of" trees for ,",hich apple diametermeesurements were madeper10dically, Table 5 shows the number of applesobserved for each tree on each survey date.
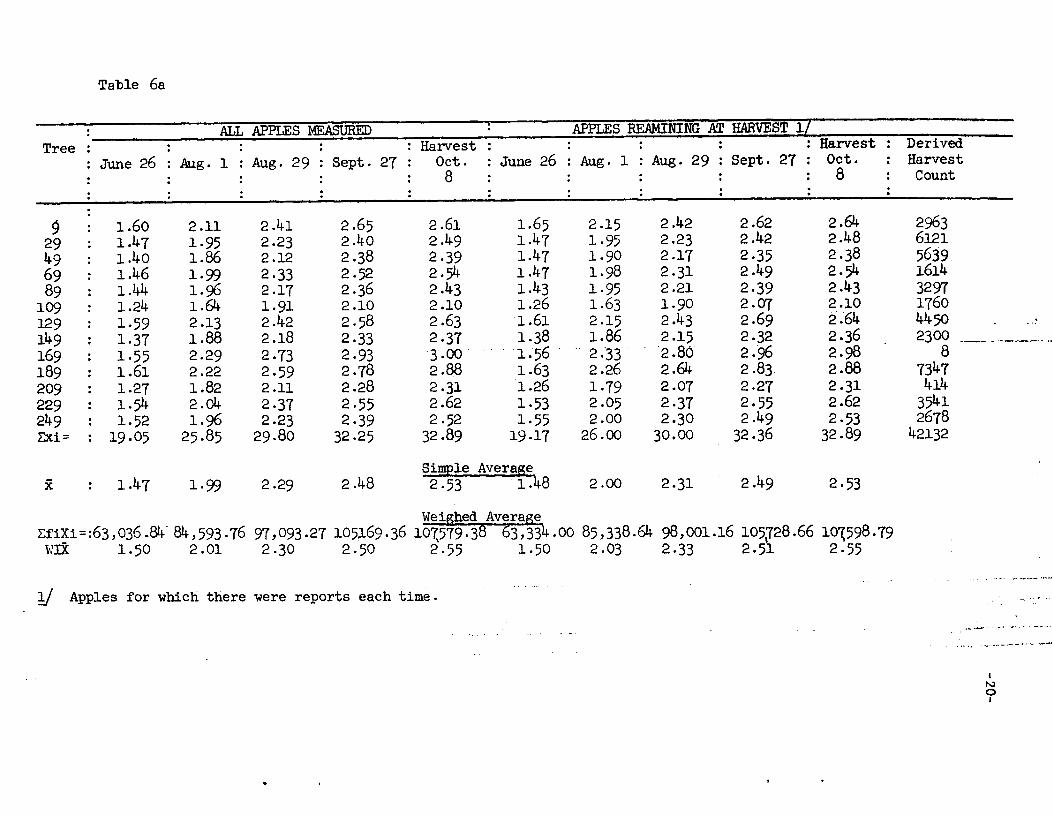
A c~parison of the decline of" apples measured durin~ the seasons tor 1963and the latter two years indicates the effectiveness of the l1'rProvedplastictB[!:in remaininr-;on the sample apple. Tables 6a • 6b, and 6c showtheaverage apple diameter for each tree by survey date. This is (P,ivenfor allapples "1easured on the survey date and also for .1ust those ap-ples remainin8at harvest. For 1963, there were many cases in which apples were misseddurinr( interim measurements but were found at harvest. For 1963 the averagesas shown in Table 6a , apples remainin~ at harve"t include onl,v those applesfor which a complete series ot reports were obtained during the season. Forvach year, the derived harvest counts were used as weights to compute awei~hed e.ver~e. Tables 7a, 7b ' and 7c shott the size distribution of applediameter meesurements by survey dates in tenths of inch intervals, for allan-ples measured. As one would expect, size distribution starts out witha stro~g contnl tendency and flattens out as the seeson proq;resses.

.~...•. ,: ..'''; ...~,,~-' .. ' ..,-8-
..••.. ," ,,' . ;1P, --contiJ\l,leG\:. . ~ -~I ~IJi ~.;-.' ~ '"~<,.; ,"',Aq
._, ,.,~- "'-;:";~: .''!i:.
Tables· .' Sat·,:.a,.. and"8e al)~~.~h. ~a11.y.dhlllete~' f'ronh rate .to;r. each t.ree,the n1l!l\)er.ot.apples: JW.fin~, 9ro,&S. ,ectional. area. for both the tree .and theco_t~l1J!1b,. the corre.latl-~"".oefficie.nts, bett·reen growth rates,-.and apples -per1"· caA•. SewN.intre.rest.ing r,elfl:t.~onshlps.C.$l1' be observed. At the becln'lllnl7,
,. of the growth season·:there h atQ~er p;J'OIIthra~e, ,for thoBe apples on treeswith a. light s~, but in ~e;.late·r:s~esofde~lQPll1entt the growth rate forthese. a~ples a.l~ down.arJt~~vp:i:J,.e· t,h~.e.pples,,_~n.1:1ee;rtJ.yladen trees con-tinue growi!1R;,'a~ only a. ~vhat, reduce~ 1 •••• te •. Tbe[.change,f'romn~ti Ye toJ)os~tive correlation eoem~lents·~,~s .strikin~ a.~tbe~.season reaches the finalst~s of growth. The tlp1)19S -per:l" 0). me(l.Sll.n!i ,~~a1ned frm the count 11mbappears to be l;Iatisfactol'7 me_\1re!,.f:~t.· .1'hls."J,s,j.mportant since it is theonly' 'PraetleaJ,..~§lee.sure~v.d.l&blea~, toreeas~ time. ~rrelfiLtion coefficientbetween apple, di8l!letere' GDxJuiv ~ .aM..A~~. 1 surwy~ate8 end Pre-Harvestdi-.eters are 88 follows:. ' \::... ' ,_ ,_
Teu:.
" ., .
1964,,· ,
1965-: .'
.. ,
: '.' .;J,uly 1 , '(1';', '"
..and.~re-I!!l!.e!:i·.'" , ,,, I
~,..0,.6994,,: "
0.86670.7135 ..
Al:J.'to. 1:.: -.!!pd Pre~JIarves;'
. !
·,0·.9].91..,
.<O~9.4l3· .
, O.'~.8427
This would se_to indicate that whtQ~correla.tion, I,· high at Jul,y 1,eonsiderable improvement tlould result in waftinp, until Aueust 1 to' projectbarvest si ze.t!,.'J .( • )
The vn.ria~·lOD>tn th~ si-ce'iof' .apples·,amoag,.trees andvit)Jin ~rees on July 1. is 0,1' inte~st;in. d~c1d1n~h_: manyapples to 1!leB.8~ .on each tre~,.•;· For theP\U'Pos, 01' tet~n1ng the aver~!~izeot appl,tt !for !»I'OJecting,to' a harvestweight per "apple' .,bued on a ree1:'esslOQ.equati~.(s.ee- page ), the v~iencecomponettts deriwd tram the table below indicate the variance is reduced b"
- BP})roximp.telytwo.:--thirdaby s8m'Pling'from t~~rees rather th,.,n one ~ree'Per block. , .Fo~ this stUdyab2 (.0137L~dO'n (.{)f\50Lare approxiJllatel,Vequal.
;"\ .... : ...J. ",.. ~,·c:--· - ---.~ '.
ANOVATable for Size of' Apples lUthin Block July 1, 1963<: ",
So~ces . D. F. S.B:t· .-d~._~.:-..-- .. '- -,' .. ~r . ,
:, Betveen Trees 12 3~'30·. ;275
~,.Within Trees ;. 242 3.63 .•015- :-r
,".;.- ,. I' i
'rotal .. ", 254· 6.•93 •.273..
", ~>. . '. ;.""
. ".,
H.8:~l!i _'''eip:ht_S_~l~~ For apples on taR limbs, after diameters vere measured,the o:nples-wereele:ssitt-ed by: diame-ter at, intffrvals :01' one quarter inch_' AnaVerage wel~ht ,tor enchdiameter· clus vas then obtained. 'Therewas a' .negat1~ correlati~ between 8.verage'vet~httor a;~rt1cular size categoryend apple 'Per 'lncha3A, which'was iliRDiftcient at this 5~ level. This wouldtend'to contirrnthat the apnles trom trees with lisht sets or fruit aresweeter, and.heneedenser than those with heavier sets. Tables9ri ~ gb' and9c shOt.,the distribution into each size category, by tree 9 and averaee
wei~ht per apple for the three ye81"s.

-9---co1'ltinued
Tables lOa, lOb , and 10cshowthe calculation of the average weight per applefor each tree, including the numbersof apples weighed on count liin.b.~and theirtotal weight. These average weights were used to derive harvested coUnts asshownin Table , along with the total weight of tree production which is·also shownon Tables , ,and
Table showsa comparisonof expansions of weights of apples· from countlimbs at Pre-Harvest time, expansion of tree production weights, arid reported " .orchard production. In order to project orchard production, it is obviousthat a sample of twenty-five trees wouldbe insufficient if this had been thepurpose of this study. Analysis of the sample standard deviations betweenproduction weights per tree, indicate a sample of over 180 would be needed (ifthe finite correction factor is ignored) to yield a precision of5~ of the meanat the 95%confidence level. While the intent of the study was not to estimatefor individual blocks, the variability within blocks is considerable and maybesubject to reduction through further study. However,the sample variabilityfor the finite population is evident whenone comparesthe harvested production.tor the twenty-five trees, column6, with the production for all 250 trees,-eolumnli. In 1965, the twenty-five trees did not represent the"E!.utire blockas well as the sample tree used in 1963 and 1964.
A comparison of columns (5) and (6) indicates an unharvested production, or acombination of bias in the count limb procedure and unharvested production of6-10 percent. Based on harvesting loss eXperiences with other crops, which-areusually average 5-10 percent, the procedure used at harvest time appears to beessentially free of bias.
PrOjection of Harvest Weight The major purpose of the study was to projectharvest yields. Since the weight of apples at harvest time is positivelycorrelated with its July 1 diameter and negatively correlated with the numberof apples per one inch cross sectional area, a multiple regression of the twoprovided somepromise. Also to be considered was cubing the July 1 diameterobservations since weight is directly related to volumne. A study of the 1965apples measuredthat were harvested revealed the following relationships:
(1)(2)
= -0.009252 + 0.26928284Xij - 0.006387254Vj= 0.273430 + 0.03525292Xi~ -0.00629700Vj
Where:Y '. =harvest weight of i th apple on jth tree.Xi~J=JulY1 diameter of ith apple on jth treeVj =numberof apples per 1" CSA(Forecast Survey-CountLimb) on jth tree

-10---continued
The regression is as follows :.":,Harvest Weight per fruit VS. July 1 Diameter and ~ru.it per I" CSA
Analysis of Var1ance~ 11 va. Xl and ~
-------------------------------------,Source
Total
RegreSsi~n on Xl' ~Regression Xl onlyRegression Xa only
Error (Xl' ~)
df,
'.
62
211
60
SS
•518807'
.328705'
.22654
.28302
~ •. -' ..
.164 3 5
.22654·.283~,f:'
.003168
51.89
J" .
Harvest Weight per fruit VB. July 1 Diameter Cubed and fruit per 1" CSA.Analysis of Variance: Yl vs. ,Je2 and X3.,
,
S(1,urce >.df 55, .
.
Total 62 . 518807.Regression on X2, X3 2 ·328798Regression on X3 only .. ;.'
.231781Regression on X2 only 1 .28302
Error (X2, X3) 60 .190009
.164399
.23178
.28302
.003167
F
51.89 ,,"
'.. :
The weight per fruit is more strongly related to the set per tree (in a hegati ve'Way)as measured by the fruit per 1" CSA,but both regression coefficients aresiginificantly different from zero.
From these, it can be seen that there 1s~'little advant~e in using the diametercubed. A further refinement that should be added to th1a estimating procedure.~is to change the July 1 diameter measurement to a Full moom Delte plus aspecified number of days. Since in 1965, the July 1 survey took place on June 29,or 50 days atter Full Bloom, the comparable survey dates for 1963 and 1964-'Wouldhave been June 13 and June 27 respectively. By applYing daily gro'Wthrate adjustment factors to the diameters observed on actual survey dates, (seechart I ) one rectrocti vely converts the observed diameters to a "Bloomplus50 day" equivalence. In operational cond1tiona, the survey would be timed totake place about the desired time. Adjustments to the exact date size could bemadebased upon a sub-survey which would indicate the appropriate growth ratefor the area and variety in that year. Once the regression equation 'Wasappliedto the sample apples measurements, a weighed average would be computed to arrive

-11---continued
, "
at the indicated 'avemge-apple weight at harvest. The expansion of forecastcounts less deductions for expected losses until harvest and harvest losseswould project, the number'of apples to be. harvested. Apple production, inbushels, would then be the project of projected apple numbers,and projected.av~rage a~~e ha,rve~~> weight divided by weight per bushel •.
.; .... ~.'Then: ' '£
'M,Ii
"Y - 1· '" E Y,..i. - M 1=1 ijj
and,n
"p=! E Zj Yj'n .1=1
nE Zj
.1=1
'. :1-. r : .~.
.. : ~.' .(Projecteci number apples per tree)
, "
(pX:<>jecteg.Weight'of APples"per tr..ee). j:d.J ,I :'-'; '.' ~ ·t··,.;~. " .i.,I' ('".!
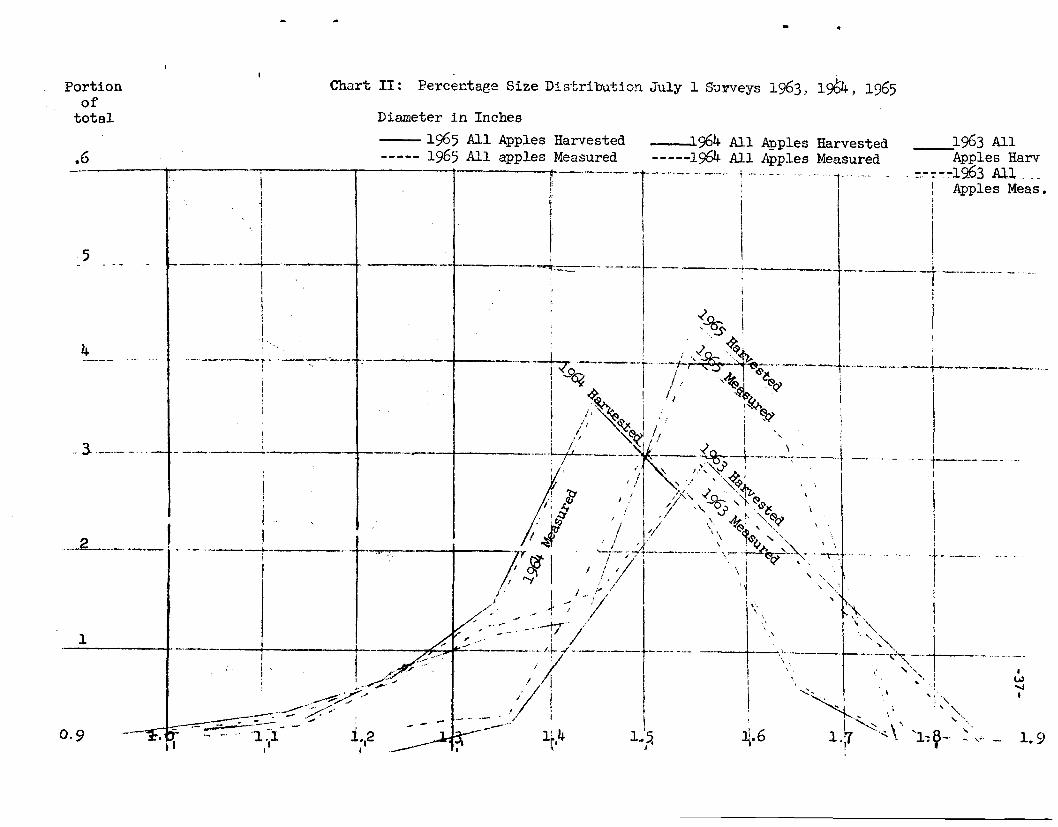
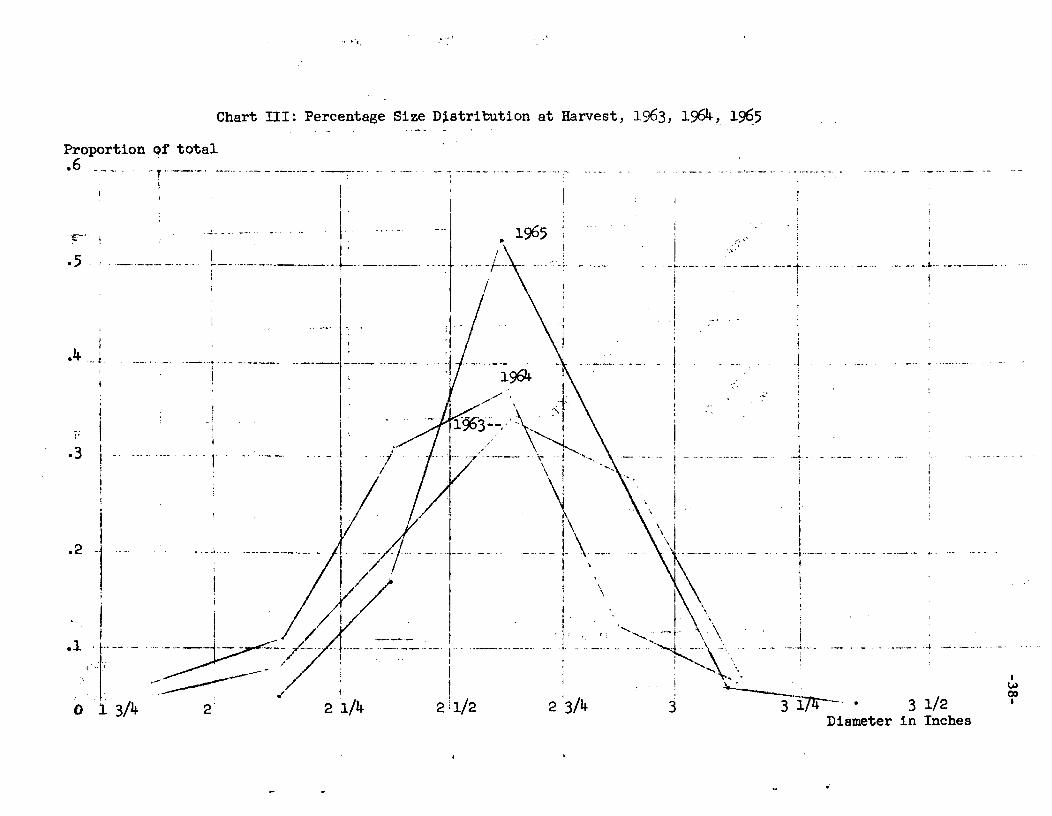
Size Distribution at tIarvest An early season projection 'Of harvest size' ..distri-bution would be valuable to the apple industry for marketing plann1:ngpu!'poses .:since the fruit is sold on the basis of harvest diameter size. While smallapples at Forecast generally remain small apples at harvest, the distri bu't:ionpatterns of apples me~sured and dated harvest at first glance do not appear tobe similar ¢luring the thre~ sellsons of the project;);. As can be seen· in ChartsII and ill. Using the regression approachmentio!lea in' the" pre'\l't6U.s'section.using harvest tiameters as the YjJ '.alue, gives a method of projecting harvest "size distribution. USing,l965 size data again the following equations were
.. '. Icomputed: , '.' "">4 !
. ~.~\.: Ii·~-.r: ..• > _ ~
"
Harvest Diameter per fruit vs. Julyl;Diameter and 'Fruit per 1" CSAAnalysis of Variance: Yl VS. Xi. anti '~, ,
,/,
Source df SS M3 R;'1"
Total 62 3·62851
Regression on Xl' X2 2 2.12893 1.00446 42·59'1 ~.
Regression Xl only 1 1.84740 1.84740:
Regression ~ only 1 1.44782' 1.44782-: -'-, ,'(r., .'
Error (Xl ,~) 60 1.49958 .024993

-12---continued
In this case, the July 1 diame',jeril;lthe most important single variable asmight be expected based on Batjer studies.
Applying the aoove equation to tbe July 1 apple, diameter measurements for 1964,one ~ould have projected a size distribution as in Chart IV as compar~~ ~iththe final observed. Since the regression equation is based on 1965 o.ata ~iththe projected fruit sizes being from different trees in the 1964 season, similarregression parameters based on scattered trees over a larger geographic area~ould probably be valid, but question of ~hether such a relatipnship maybevalid bet~een seasons must be tested. Ho~ever,-~ comparison .of the projecteddiameters ~ith actual diameters in Chart IV suggests that the prediGtion ofthe harvest size distribution may be practical. In deriving these sizedistribution charts, the distributions for each sample tree has been 'Weighed bythe expanded number of fruit at forecast time or derived n~bers of-fruit atharvest.
It 'Would appear that a similar approach based upon a multiple regresaion equationover several years may have merit. It may be desirable to introduce additionalvariables in such approaches.
VI . Concluaion
tJethods for using objective rniit counts and measurements for apples as earlyas July 1 ~ere realized in the research conducted over the three year period.The basic results are as follows:
(1)
(4 )
Procedures for accurate counting of fruit on sample limbs 'Weredeveloped. The task requires a painstaking detailed counting bysmall sub-sections of the sample limbs. The need to recount samplelimbs a second time and reconcile any large differences is necessaryfor accurate results. The sub-section counts are helpful for thispurpose. Counts by inexperienced cre~s are not likely to besufficiently accurate for forecasting purposes unless recounting andreconcilation of differences are resolved through adequate supervision.The droppage frOm July 1 to Harvest is fairly stable and measurableusing tagged individual fruit.The repeated measurement of apple diameters starting around July 1by tagging of indiviudal fruit is feasible and provides a basis forpredicting harvest sizes and 'Weights of apples. While care in handlingthe apples is required to avoid knocking off fruit, this problem ismost troublesome as harvest approaches.Provision for determining the amount of unpicked fruit is necessary.Also, the loss of fruit dropped on the ground and recovered by thegro~er must be measured to insure that commercial production andbiological production can be related.

Table 2aVirginia Apple Counts Survey
1963-64 Count Limb Selection Random Paths, Cross Sectional Areas, and Expansion Factors
- ...-; -, ..- .. .: ~--- ..•..--..- .........-._~:---.~.•.-'-".- ...- - --- :
Tree Selected Cumulative Selected Cumulative : Selected Cumulative ExpansionPrimary Primary Pdmary Primary 3rd 3rd Stage Factor
~ . StaKein~
" , :'2 " .CSA in CSA "\ in~ CSA
t· .,, "
9 ?8.3 201.4 ,,9:,·6 191 7.0619 14·5 254·1 17·5229 50·5 220·5.,' '13·7 68.9 21 9639 39·0 139·5 11.0 , " 38.0 7.6 12.6 20~949 40.2 268.7 ,'. I: '>.' 43·0.13·0 22,1159 62.0 205·6 15.6 70.8 15 0569 6.2 62.9 2.1 4 9 23 6779 36.5 117·1 c 15·1 49·1 10"43'89 49·0 124.0 13·0 60·9 8·5 13 0 18 ;J.3'T'
99 42·7 152.2 .~~:7.0 37·8 1925109 33·0 154.8 '9·1 39 1 20 16119 35·5 222.8 20·5 40.8 12'~4:~i"'
"·W
129 25.4 179·5 11·7 24.0 14 :50',139 15·0 214.0 ',9..,0 l""~.·
• r 16.4', 'C 25:QO149 31.5 202.2 ";\:9)3 32.2 22.2'3..'
":.' ~-
159 9·6 194·5 20.26 ;.'~:~'169 6·5 13·2 T:~:3
2.03179 10.8 108·3 10.8 25·19189 llL . t; ~57·R ~5·12 ' "
199 10.0 251.? 17.78-- "
ct;.._ .i:';'~- 6.45 2~ ',J --'/-
219 8.2 101.2 ,,3·3 8.2 .-~--'30.6r5'13 ", . ~\ / '.
229 26.2 113·6 '"'·~4.0 .- '~-;;i:' .. 14·3 ' 18.56+""' '
239 32·5 192·5 '9·1 39·0- 25 ·38 '249 22.0 148.2 . 't·8 ..8 J'c;"."'~;9 17·53 I
I-'--- -.-•....•-....•....., ....- -----~-.-•..", WI
. ,.-

Table 2b1965 Count Limb Selection Random Paths, Cross Secetiona1 Areas, and Expansion Factors
Tree :Se1ected:Comu1ative:Se1ected:Cumu1ative:Se1ected:Cumu1ative:Se1ected:Cumulative:Se1ected:Cumulative:ExpansionNo. :Primary : Primary : 2nd ~ : '2nd : 3rd 3rd 4th 4th : 5th 5th FactorStage Stage stage Stage Stage : Stage : st~e : Stagein~ CSA inc CSA inc CSA inc CSA in CSA
6 22·5 192·7 115 19·5 14·5216 54·8 154.1 26.0 56·7 7·9 33 .6- 26.08226 52.0 123·5 22.0 46.0 6.2 18.4 14 .62036 50.0 157·0 20 46·3 13·0 22.4 7·1 54·1 24.87446 13·5 67.0 5·2 12.2 11.64456 64·5 146·5 16.6 93·6 14.2 22.6 8.2 15·7 39.02666 65·0 106.0 46.0 62 24.0 42.0 15·1 28.1 7·7 15·2 14.13076 40.0 307·3 15·1 46.2 23·50586 70.0 256.4 10.0 55·0 20.14696 12·7 180.1 14.180106 72·1 202.1 22·5' 78.8 12·7 24.1 18.629116 11.0 22.8 3·7 12.4 6.946126 40.0 228.0 33·0 44·5 13·5 29·0 16.511136 7.0 69·0 9·857146 54.5 143·5 9·0 61.0 17 846156 64.5 257·7 19·0 57·0 11·986166 24.0 162.0 20·5 23·5 12.0 21,0 13 541176 26·5 141.4 8.0 29·1 19·409186 43·0 86·5 25·0 35·5 6.0 31.5 14 .997196 42·5 192·1 24~0 . 48··5 11·9 26.2 20.110206 16.0 51.2 13·6 16·3 8.8 16.4 3·3 9·6 c:.u.790216 41.0 88·7 20.0 45·7 6.8 17·8 12 .940226 49·0 138.6 37·5 46.8 12.4 37·6 16.543236 13·0 216·5 16.654246 15·5 287·6 , ...-....• ,..... 18·555
I~~I
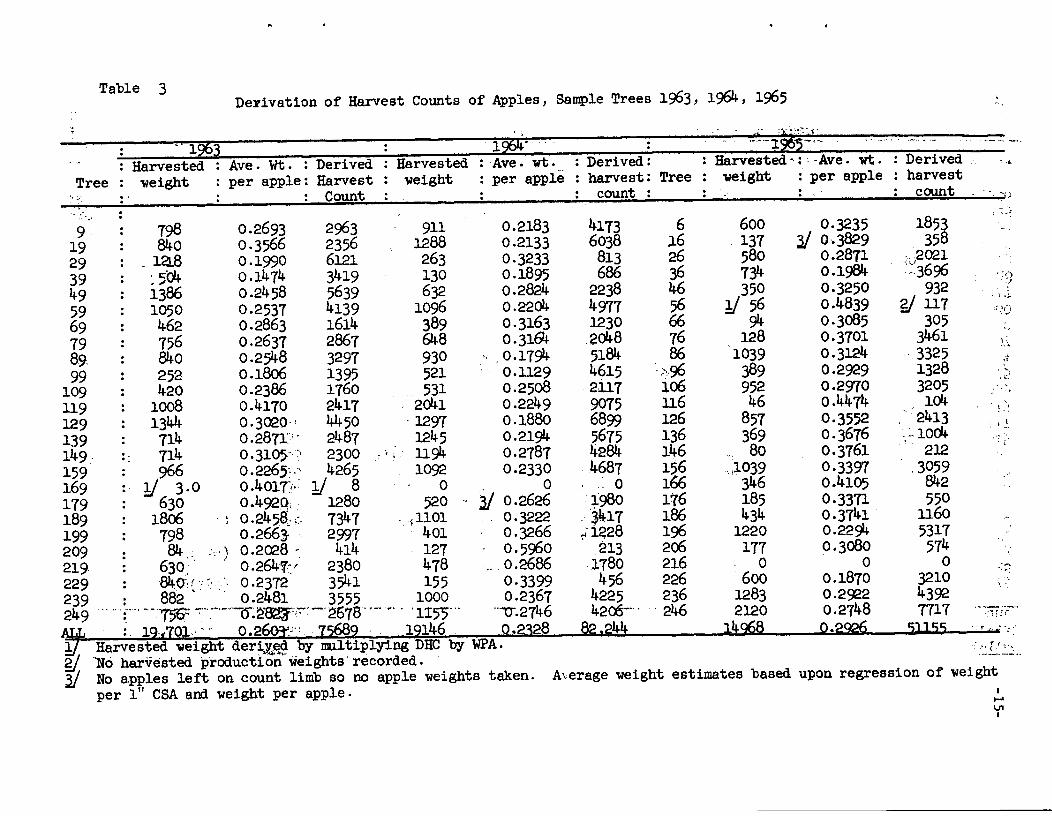
Table 3 Del!'ivationof Harvest Counts of Apples, Sample Trees 1963, 1964, 1965 ,-
, . .• _ •. ~ _." • ", ~•...-.. . 1: •
.,'1963 1964* ,, ' ... ':':-1~~'~'-'
: Harvested : Ave. Wt. : Derived : Harvested : Ave. wt. : Derived: : Harvested -.:".Ave. wt. : Derived . : .;.
Tree weight : per apple: Harvest . weight : per apple : harvest: Tree 'Weight : per apple : harvest... Count . count . . .. . count -. "'r ~. ' . . . .. . . . . ''''
.."
~-:: ..~
9 198 0.2693 2963 911 0.2183 4173 6 600 0·3235 185319 840 0·3566 2356 1288 0.2133 6038 .16 ,137 ;J 0·3829 35829 .121.8 0.1990 6121 263 0·3233 813 26 580 0.2871 ·,,202139 ~ 5014- 0.1474 3419 130 0.1895 686 36 1~ 0.1984- :~:3696 r:;-l
49 1386 0.2458 5639 632 o .2824 2238 46 350 0·3250 932 :j
4139 1096 0.2204 4977 56 Y 56 0.4839 gj 111 ; "~
59 1050 0.2537 ·r .~l)
69 462 0.2863 1614 389 0·3163 1230 66 94 0·3085 305756 0.2637 2867 648 o .3164 ,201f.8 76 128 0·3701 3461 ..
19 ,:
89. 840 0.2548 " .0.1794 5184 86 1039 o .3124 :,:'"
3297 930 .3325 .,
99 252 0.1806 1395 521 0.1129 4615 '··96 389 0.2929 1328.',
109 420 0.2386 1760 531 0.2508 2117 i06 952 0.2970 3205 «.
..' '
119 1008 0.4170 2417 2041 0.2249 9075 n6 46 o .4474 104 . ,
129 1344 0·3020·, 4450 '1297 0.1880 6899 126 857 0·3552 ,';'2413 . I!,139 114 0.28n'j· 2487 1245 0.2194 5615 136 369 0·3676 • C' 10olf.149· : 714 0·3105~) 2300 - .' 1194 0.2787 4284 146 80 0·3761 212159 966 0.226;::' 4265 1092 0.2330 4687 156 .,1039 0·3397 .3059169 Y 3·0 o .4017?·'Y 8 0 0 0 166 346 0.4105 842179 630 o.492Q, 1280 520 3J 0.2626 1980 116 185 0·3371 550189 1806 o .245~t~:. 7347 .,1101 0·3222 ,03417 186 434 0·3741 . 1160199 798 0.2663- ' 2997 401 0·3266 ~.i~28 196 1220 0.2294 5317209 84.: :,' ) 0.2028 - 414 127 0·5960 213 206 177 0.3080 574219 630; 0.264r~f" 2380 478 ..,0.2686 1780 216 0 0 0 .~
84(r'{ '.':' \ 0.2372 3541 456 226 600 0.1870 3210 ")0'
229 155 0·3399239 . 882' :. 0.2481 3555 1000 0.2367 4225 236 1283 0.2922 4392.249 ..··T·'--"75~';"'::·'-'-'--O:~~'-:-~-·2678··-'*' " '115)" "-0-.2746 4200-'", 246 2120 0.2148 7717 .--"-'1) ~;-
., }:. ,01·_. 0.26 - , 68 1146 o. 8 4 4 ",. . :.....
Harvested weight deriv,ed by nn1tip1ying DHC by WPA. :~.." J.' .•'~• Jo".•••• ~ ••..
"No hal"vested production weights'recorded . .--- ..
No a.pp1es left on count limb so no apple weights taken. Average weight estimates based upon regression of weightper 111CSA and weight per apple. I
I-'VII

Table 4aand Derived Harvest Counts, by tree 1963 and 1964Apple Counts, Expanded Counts,
: Expanded : Expanded. : Derived : : Pre- : Expanded: Expanded : DerivedTree Forecast : Pre-Harvest : Forecast : Pre-Harvest: Harvest: Forecast: Harvest: Forecast:Pre-Harvest: Harvestcount 1/ Count Count Count count 2/: count : count count count count.'9 :428/123(130) 127 918 897 2,963 294 296 2,076 2 ,090 4,17319 . 82 106 1,436 1,857 2,356 307 308 5,379 5,396 6,03829 :346/362(354) 370 7,774 8,125 6,121 7 9 154 198 81339 148 348 3,033 7,131 3,419 18 19 369 389 68649 :355/359(357) 378 7,893 8,358 5,639 64 69 1,415 1,526 2,23859 98 147 1,475 2,212 4,139 598 553 9,000 8,323 4, 97769 35 34 828 805 1,614 65 74 1,539· 1,752 1,23079 207 226 2,159 2,357 2,867 130 146 1,356 1,523 2,04889 :261/264(262) 263 4,750 4,768 3,297 448 446 8,122 8,086 5,18499 33 36 635 ,693 1,395 278 ~64 5,352 5,682 4,615109 165 198 3,326 3,992 1,760 273 296 5,5014- 5,967 4,117119 187 312 2,336 3,897 2,417 966 903 12,065 11,278 9,075129 157 150 2,277 2,175 4,450 587 484 8,512 7,018 6,899139 34 70 850 1,750 2,487 298 299 7,450 7,475 5,675149 123 162 2 ,734 3,601 2,300 212 243 4,713 5,400 4,284159 183 215 3,708 4,356 4,265 200 179 4 ,052 3,627 4,687169 5 4 10 8 8 274 0 556 0 0179 146 25 3,678 630 1,280 1 0 25 0 1,980189 213 176 3,787 3,129 7,347 44 38 782 676 3,417199 290 255 7,285 6,406 2,997 63 64 1,583 1,608 1,228209 1 0 21 0 414 13 13 - 280 280 213219 21 17 644 521 2,380 38 35 1,167 1,073 1,780229 178 211 3,304 3,916 3,541 51 40 947 742 456239 132 233 3,350 5,914 ,-3,555 329 316 8,-350 8,020 4 ;225'24:9 ..', 319 293 5,592 5,136 2,678 366 347 6,416 6,083 4,206" --
ALL 73,803 82,634 75 r689 '·9111.62 .93',614 82,244-..!/p''Where two counts are shown, no reconciliation 'Wasmade. Counts in parenthases were expanded.Y See Table 3 for derivation of Harest Counts. I
t-'(j\
I

'Table 4bApple Cowrts, Expanded Coun:ts, and Derived Harvest, Qounts, by tree,l9?5
Tree : Forecastcount 1/'
Pre-HarvestCount
ExpandedForecast
Count
Expanded. Pre -Harvest
Count
Derived, ,Harvest
Count
616263646.5666768696
106116126136146156166176186196206216226236246
)
J::, , 16 17• ,0 , . 0:125/+31(128)' 100
183 149· 22 24: 8/10(9) 3: 74/107(91) 117:159/185(172) 184:165/182(174) 151: 18/ 21(20) 14:309/336(323) 267· 20 19:146/163(155) 154: 26/ 28(27) 34: 33/ 34(34)' 22
83/ 93(86) 7836/ 40(30) 19
: 71/ 72(72) 80:126/153(140) 108:389/405(397) , 402: 47/ 53(50) 58·20';409/443(4261" ",. 301'-- ,:223/228(226) : 282':400/435(418) '}'536
,~.'
232 '0,
1,887.5, 546, 314, 312',.:,1,8935,lgl1.
" 3,667 '298
6,260139
2,691276607
1,241542
, 1,3982,055
:,)8,145,1,102
26"6,898' '4,9958,074
63,798
247 '..o
1,474 ' .,·3,705",:-'
, 279 ..:·'j li7
'),,6534,324 :. ~3,ciJ.3
~.'..199 . I4,9"(4132
2,543355393935 -"257
1,553 .1,6208,0841,2ciJ.
o4,780 .~4,695.9,948
56,494
1,853358
2,021, 3,696
932" 117, 305
,-3,461'3,325
, 1,3283,205
104.2,413
. 1,004~12
3,059. 842
5501,1605,317
574
°3,210--4,3927,717
51,155·11. Where tw~ counts are shown, no reconciliation was made. Counts in parenthases were expanded.g; See Table for derivation of Harvest Counts. I...•.....•
t,

Table 4cCross Sectional Areas of Sample Limbs with Associated Counts and Weights of App1e~J 1963-1965
: Count: --I ../ -,~/ .'~ :.-- ... .. /.;, T" .. -- / ? (,. ~'-1963-1964:'11mb : July :Ha.rvest:Harvest: July :Harvest:Harvest : 1965 :'C6uii't. :..J'uiy '::Varif'ication:Harvest:HarvestSample : GSA :count count :weight :count count :weight :Sample: limb :count Count count :weightTree . sq . : 1/ 1bs. 1bs. : tree : CSA :1/ gj :(lbs.).
:inches: : sq.: inchesStage:
9 2 9·6 130 127 34.1 294 296 64.4 6 11.5 16 17 5·519 1 14·5 82 106 37.8 307 308 65·7 16 7·9 0 0 029 2 : 13·7 354 370 73·3 7 9 2.6 26 6.25 108 128 100 28.639 3 7·6 148 348 51·3 18 19 3·6 36 7·1 183 223 149 29·649 2 13·0 357 378 93·3 64 69 19·8 46 5·2 22', 27 24 9·059 2 15.6 98 147 37·3 598 53 121·9 56 8.2 9 8 3 1·569 2 2.1 35 34 10.1 65 74 24.4 66 7·7 91 134 117 36.179 2 15·1 207 226 59·6 130 146 46.2 76 15·1 172 221 184 68.189 3 8·5 263 263 67.6 448 446 79·3 86 10.0 174 151, 47·699 2 7·0 33 36 6·5 278 264 29.8 96 12·7 20 14 4.1109 2 9·1 165 198 48.4 273 296 75·9 106 12·7 323 267 79·3119 2 20·5 187 312 130.1 966 903 203·1 116 3·7 20 19 8.8129 2 11.7 157 150 45·8 587 484 90·9 126 13·5 155 154 54·7139 2 9·0 34 70 20.1 298 299 65·6 136 7·0 27 34 12·5149 2 9·3 123 162 51.8 212 243 68·3 146 9·0 34 22 8.1159 1 9·6 183 215 48·7 200 179 41.7 156 19·0 86 104 78 26·5169 1 6·5 5 4 1.6 274 0 0 166 12.0 38 19 7·8179 2 4·3 146 25 12·3 1 0 0 176 8.0 72 80 ~6·5189 1 14·5 213 176 41.4 44 38 12.2 186 6.0 140 137 108 40.4199 1 10.0 290 255 67.9 63 64 20·9 196 11.9 391 402 92·2209 'h 2 6.4 1 0 0 13 13 1.2 206 3·3 50 58 17·7219 2 3·3 21 17 4·5 38 35 9.4 216 6.8 2 0 0229 3 5·8 178 211 49.8 51 40 13.6 226 5·5 426 --- 307 57·4239 2 9·1 132 233 57.8 329 316 74.8 236 13·0 226 300 282 83·0249 2 8.8 319 293 84.4 366 347 96.6 246 15·5 418 536 147·3 I
I-'00I
Y Where two counts are shown there is nonreconcilation of countsy Varification counts made 07 tj/6~/65 by segmenting count limbs into small count units except for trees f/!26 and 56 forwhich recounts were made 7 1 .

Table 5Number of' Apples Measured by Survey Date and Tree, 1963, 1964, 1965
1963 19611- 1965Tree . :Harvest: Tree :Harvest: Tree :Harvest. Oct .. : :Sept . :Sept .: Oct. :Aug, :Oct. : Oct.:June : Aug • . : July'.
: 26 1 8 1 : 2 : 2 14 1 : 6 21..9 : 18 17 17 12 12 9 10 10 10 9 9 (26)3 12 11 9 8 8
29 : 16 14 11 10 10 29 17 17 17 17 15 f56l6 3 3 2 2 2.49 : 20 16 14 11 11 49 14 14 14 l~ 13' 86 9 15 14 .. 12 11 9
69 -,: 22 20 20 20 15 69 18 16 14 13':'.-;.13-'_,-~1J,.6 12 12- Xt 11 9 989" . :25 18 18 17 16 89 17 17 16 14 . 1:3 146)15 i5 12 10 9 8
104 : 22 19 13 13 10 109 16 16 16 15 15 ~176~18 8 7 7 7 6129 :.19- 16 13 13 13 129 20 19 17 16: 16 ____206 21 - 15 12 10 7 7149 : 20 17 18 16 16 149 - 2::> 20 18 15 15 - (236)24 15 15 15 15 14169 : 11 9 4 5 3 169 26 21 18 13 01~9 : 20 18 17 15 14 189 24 24 24 2l1- _.22209 :-16 12 11 9 8 209 15 15 ,',14 - .13 U229 :.21 20 18 18 18 229 15 15 13 : 11' 11249 :.25 . 23 22 21 18 249 32 33 32 3:! 3F
~ •• t -. , - ,.Total :255 219 196 180 164 Total 244 237 ,223 2QE5 185 --Total 95 85 76 68 63
. :~-
_ .......•._-~ - _ .. --- ..---- ..._-----~•.. -
,-.':.......••
II-'\0I
..... --,.~.... ' -- .... ------.".,. .-,, 1--- __
INoI

Table 6b 1964--Virginia Apple Counts Survey (Summary)
ALL APPLESMEASURED APPLESREMAININGAT HARVEST : Derived.Tree :Harvest :Harvest : No. of
: June 30 July 31 Sept. 2 : Se'Pt. 25 :Oct. 14- June 30 : July 31 Sept. 2 : Sept. 25 :Oct. 14- APples:
9 : 1·4-55 1. 968 2·352 2.4-87 2·521 1.4-39 1·950 2·331 2 ,4-87 2·521 4-17329 : 1.4-86 2.166 2·592 2·721 2.767 1·507 2.193 2.616 2 .74.4 2.767 8134-9 : 1.4-26 2.002 2·381 2·533 2 569 1.4-16 1. 996 2.378 2.4-75 2·569 223869 : 1.4-85 1.984- 2·360 2·4-75 2·507 1 4-82 2.00J.i. 2·360 2.4-72 2 .507 123089 : 1.4-16 1 .954- 2·319 2.4-36 2 .4-4-1 1.429 1·972 2·306 2.4-22 2.4.41 5184
109 : 1.123 1.634- 1.946 2.056 2.080 1.125 1.635 1 .9'1-8 2.056 2.080 2117129 : 1.4-40 1.934- 2.217 2·34-2 2·388 1.436 1.928 2 088 2 .34-2 2·388 6899149 : 1.4-74- 2.~8 2.363 2.4-68 2 .512 1.4-73 2.042 2·352 2.4-71 2·512 4-284169 : 1.156 1·555 1.672 1.691 1.154- 1·561 1. 671 1.691 556189 : 1·558 2.193 2·570 2·725 2.820 1·564 2.215 2.605 2.764 2 820 3417209 : 1·308. 1.848 2.156 2·317 2.388 1. 363 i.912" 2.24-6 2·380 2·388 213229 : 1·559 2.206 2 .605 2.811 2 852 1·554 2.200 2.631 2.804 2.852 45624-9 : 1.4-77 1. 999 2·313 2.4-21 2 .4-62 _ 1..473 1.994· 2 ~313 2.4-21 2.4-62 4-206 ...IXi= :18·363 25·491 29·846 31.4-83 30·307 .. ~~'~A-/.~~;·:~t:~~~.::·!'~~·~4:'~_.31·529 30.36i ~.. 35786
Simple Average y
2.526"-x :. 1'.4-13 1.961 2.296 2.4-22 2·526 ;J.. .•4J.l 1.919 2.296 2.4-25.;" -
. Weighed. AverageEfiXi=:514-33~.074-70,764. .645 82800.J31 87,224-,258 87,696-128 514-09·036 70319.361 81~_8!5.108 87,193·229 8T:~696.728
(w)x=: 1.4.4 1.98 2.31 2.44. . 2.49 1.4.4 1·98 Z·g9 2~44 2.49
Ef1=35,230
".Efi=35,230
It.)•...I

Table 6c 1965--Virginia Apple Counts Survey (summary)ALL .APPLES MEASURED APPLES REMAINING AT HARVEST :Derived
Tree :Harvest :Harvest :No. ofJane 2 .Tulv 0 P:LlrT • 1 Oct. 6 :Oct. 21 June 2 Oct. 6 :Oct. 21 :A 1es
26 1.478 1·965 2.422 2.706 2.728 1·512 2.019 2.454 2.706 2.728 202156 1.807 2·337 2·320 2·740 3·030 1.795 2·320 2.740 2.990 3·030 11786 1.562 1.945 2·350 2 .527 2.601 1.588 1.989 2·357 2·552 2.601 3325
116 1.713 2.293 2·717 2·906 2·913 1.698 2.281 2.707 2·906 2·913 104146 2.684- 2·303 2·749 2·971 2·963 1.699 2.259 2.751 2.945 2·963 212176 1·549 2.106 2 .527 2.734 2.918 1.578 2.140 2.625 2.875 2·918 550206 1.674 2.161 2·582 2.730 2·770 1.613 2.-080 2·529 2.·730 2·770 574236 1·533 1·931 2.271 2.468 2·563 1·539 1·946 2.308 2·514 2·563 4392.Exi= 13·000 17·dn 19·938 22.486 13 .022 17·034 20.471 22.218 22 .486 11.295
Simple Average:it= 1.625 2.130 2.492 2.723 2.8ll 1.628 2.129 2·559 2·777 2.811
Weighed Average by derived apple number per tree!:fixi=:17,473.029 22,318.193 26,691.558 29,033.938 29898.807 17635·697 22,599·148 27,014.011 29,420.37829,898.807ITxIT -. 1.55 1·98 2·36 2.57' 2.65 1.56 2.00 2·39 2.60 2.65-.
INNI
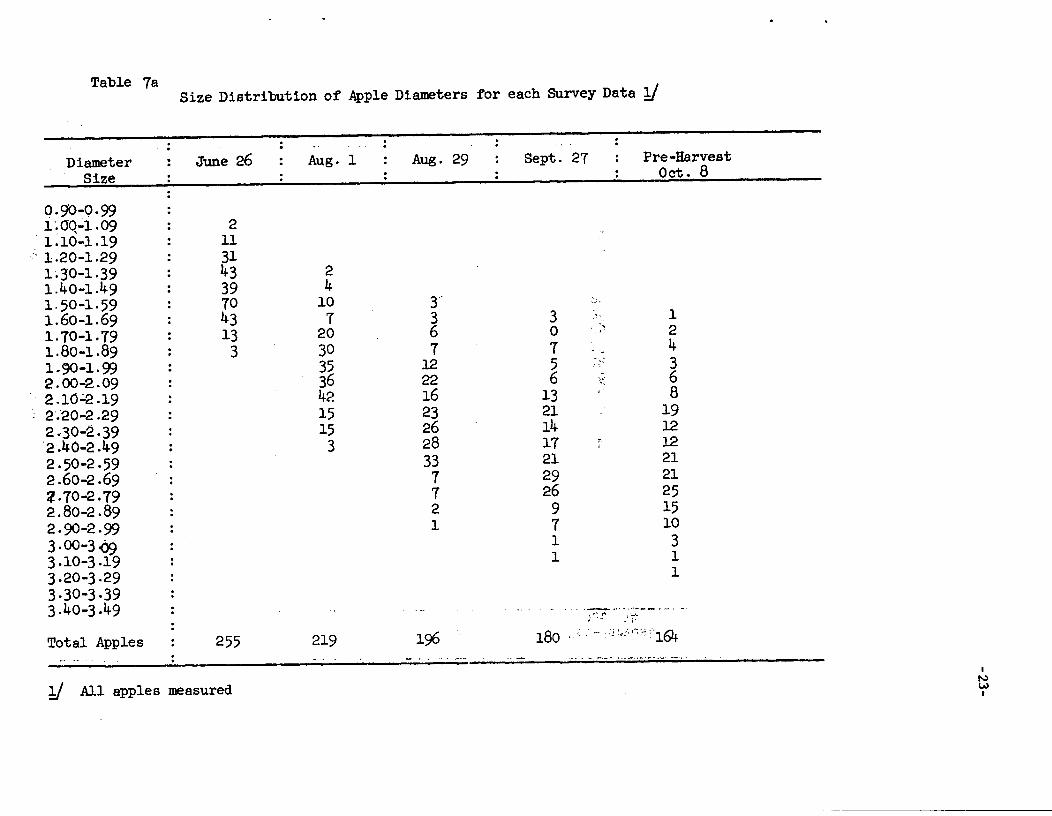
Table 7a Size Distribution of Apple Diameters for each Survey Data !I
Diameter June 26 Aug. 1 Aug. 29 Sept. 27 Pre-HarvestSize Oct. 8
0·90-<;)·99l'~OQ";1.09 21.10-1.19 11
,"1.20-1.29 311·30-1.39 43 21.40-1.49 39 41·50-1. 59 70 10 3' '~,
1.60-1.69 43 7 3 3 11.70-1. 79 13 20 6 0 -.. ' 21.80-1.89 3 30 7 7 - 41.90-1. 99 35 12 5 32.00-2.09 36 22 6 - 6'(.
2.10';'2.19 42 16 13 82.'20-2.29 15 23 21 192·30-2·39 15 26 14 12'2:40-2 .49 3 28 17 .- 12,
2·50-2·59 33 21 212.60-2.69 7 29 21~.70-2.79 7 26 252.80-2.89 2 9 152 .90-2.99 1 7 103·00-3 -69 1 33·10-3·19 1 13·20-3·29 13·30-3·393·40-3.49 .. _- .'- .."--- "."" -
-l ••.•••f"l. .:'(, '
Total Apples 255 219 196 180 ' '-,,'i' :,,: '.;"'164'. ' __ .-3 ••..• ~.
'_'" •• 'h_~ •.• _._ ••.._.• _•.....__ ,..
I
!I All apples measured NwI


Table 7c Size Distribution of Diameters for each Survey Date
DiameterSize June 29 July 19 July 30 Aug. 31 Oct. 6 Pre-Harvest
Oct. 21
. ,.'..
...• ~.,.
. ,-./.,'
..... --...---
".;;\
"J~ ~
...:--- ---."'\
..--.--
.,.:.J .
. -. ~ -
..----
)
6.3
23 ' .37
12 .;JC.~7, -,r
10,'10
341," "1
68.. __ ....wr..- .. ,
,,!\'.7':'
. _.... ' r:
~_ .•••••••• w __ ••• • •
'..";1;;; ',.'J:- ".: ;.."
1.5.:4_ .. ~
22':'- :8: ;'17'.9. .10;: ; ...8: :>l.t.:d.1'1r..y:;!",,"
"-~~:(:~',;...~);
. ~-:""' .•; ,.'
~~"jJ",', ..
263
2417139
102
;:P!;2~V:~'j~):\ __+2,~:~:.: -j, ~ r)''!~,~.·-. ' '.
~ •....••• '_' ••• ~.l ;;......- •• -:--.~:-- •. _.:~ ••• '1'_
I'
95
32
122431158
.. .
Total apples: .
0'09-0·991.'60-1.091.10-1.19 .1.20-1.291·30-3·391.40-4·391.50-1·591.60-1.691. 70-1. 791.80-1.891. 90-1. 992.00-2.092.10-2.192.20-2.292·30-2·392.40-2.492·50-2·592.60-2.692·70-2·792.80-2.892·90-2·993·00-3·093·10-3·193·20-3·293·30-3·393·40-3·493·50-3·59
It-.)VII

Tallle 8aApples Harvested per 1" CSA for each tree
Tree 8-1 to 8-29 to-10-8 10-89 days o days
9 14 .7120 13·2292 ..0139 .0096 ·.0069 .0018 .0095 .0071 .005529 27·7778 27·0073 .0133 .0100 .0066 .0055 .0097 .0077 .006249 20·9974 29·0769 .0147 .0096 .0062 .0027 .0097 .0070 .005269 25·7393 16.1905 < 0142 .oll8 .0062 .od!.5 .0103 .0081 .005889 26.6210 30·9412 ...0144 .0093 .0062 .0036 .0096 .0070 .0055109 11.5310 21.7582 .0103 .0096 .0059 .0027 •0081 .0068 .0050129 24.8245 12.8205 .0150/ .0100 .0059 .0036 .0099 ·0071 .0052149 11·5183 17.4194- .0133 .0104 .0059 .0036 .0094- .0072 .0052169 . .6061 0.6154 .0214 .0168 .0055 .0018 .0137 .~ .0045.
189 : 28·9294 12.1379 .0175 .0136 .0066 .0045 .0120 .0090 .0060209 : 2·9237 0 .0147 .0100 .0069 .0036 .0101 .0075 .0060229 : 31.1776 36·3793 .0144 .0114 .0062 .0064 .0105 .0083 .0062249 : 18.2119 33·2955 .0125 .0107 .0066 .0036 .0094 .0077 .0062Y1 Y2 Xl X2 X3 X4 X5 X6 X7
Sample Correlation CoefficientsApples per 1" CSA (Tree) -.225397 - .263931 + .178457 +.704762 -.175880 -.0346804 +·549524Apples per 1" CSA (Count Limb) -·542125 -.458451 +.0490273+·465432 -.495923 -·323755 +.39492211. Total derived apple prod. number divided by cumulative primaries on each tree.y Pre-Harvest count of apples divided by CSA for the sample limb for each tree .
.. ....•. -... --' -- ...
tN~,

Table 8bApples Harvested per 1" CSAfor each tree
Tree- LY DIAMETER GROWl'H RATE PER APPLE
: 9-25 to :6-30 to : 7-31 to: 9-2 to: 10-14 10-14: 19-14: 10-14
19 days 1 days 75 days 2 days
9 : 20·7299 30.8333 .0165 .0115 .0068 .0018 .010229 : oJ .8176 .6569 .0221 .0128 .0056 .0012 .011949 : 8·3402 5 ·3017 .0187 .0116 .ooli.2 .0028 .010969 : 19.8092 35.2381 .0168 .0108 .0049 .0018 .0097.89 :41.9032 ····52.4706 '.011-5 .0101 ',0050·"· .0010 .0095
109 :.:! 13 ·9083 .. 32,52751 .,- .0165-, .·0095" .~rOO4T':, .·0013 .0090
~ ~:o~~:~~oo-----~ij~~···-··--·:gi~··'-'--'-'~~'~""-'--:-&'~~'---:~~"--..:g~~16~F.', .V·~ .;. ••.. 0 ~~.~:;jJ1i • ", ;0 ~QJ.3l;·.OO33 .. 0009: . ---189 ·;~:',13",,2~5 ·';ilL:.'.-.: 2.6207 ":0210, ;01l8 .. 0069" .0009:-·209 : 7.2246 2 .0312 .0177 .0101 .0058 .0004 .229 : 4.0141 6.8966 .0208 :.... 0131 .. -->.0075 .0025249 : 28.4615 39.4318 .0168 .0097 .ooli.7 .0022
Y1 J1 . Xi ;, 2 X3 X4
Sample Correlation Coefficients
- •Q118. ..0091.0122.0093
:}C5
. i
.0076 .0045
.0077 .0036
.0076 .ooli.5
.0067 .0035
.0063 .0032·0059 .0031.0061 .0070:0063 ..6dj8
.... '--- ;,.;.-.-:0'.- ;0081 ·0051· ..0063 •OO~·.0087 .0053.0062 .0035
X6 X7.',"0,
".,
Apples per 111 CSA(T~ee)Apples per 1" CSA(Count Limb)
- .64159-.76676
- .70154--.59810
+.25940+•05673
-.0078r-.1l615
..
-.617295 -·59556~ +.1556~5-.773036 - .656295 - .071404
!I Total derived apple prod. numbers divided by cumulative primaries on each tree.Y Pre-Harvest count of apples divided by CSAfor the sample limb for each tree.
IN....•I
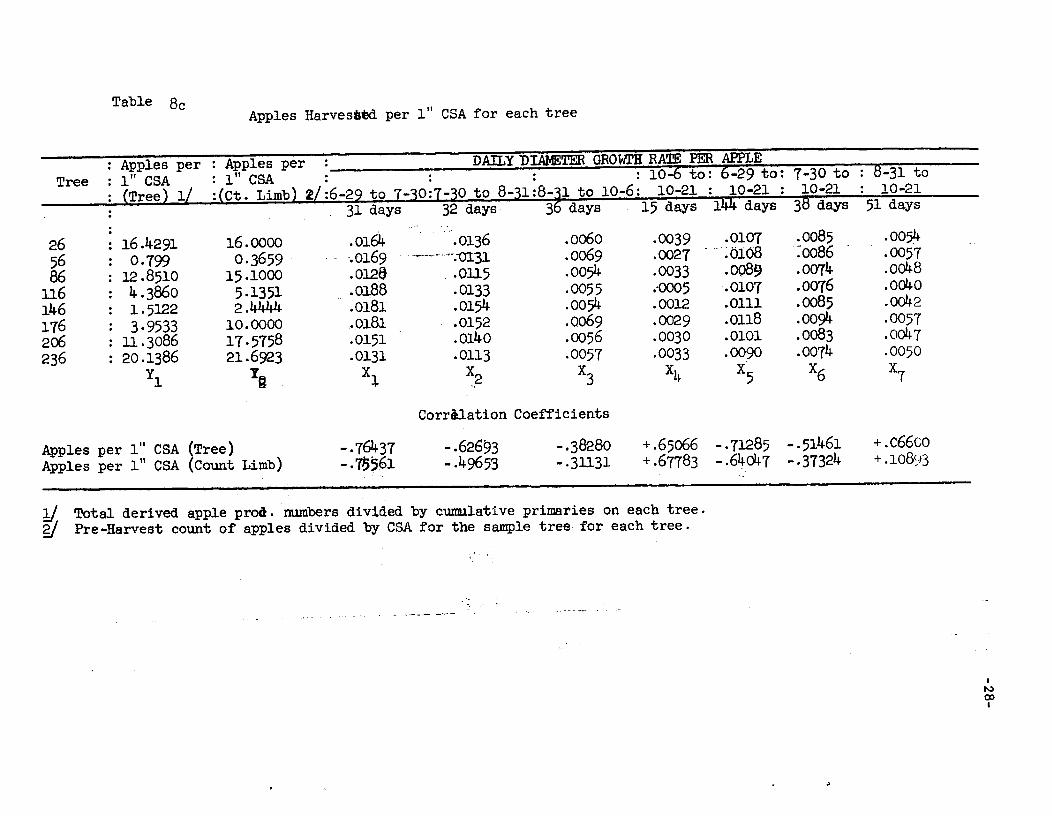
Table 8c Apples Harvesaed per III CSA for each tree
Tree 7 -30 to 8-31 to10-21 10-21
3 days 51 days
26 16 .4291 16 .0000 .0164 .0136 .0060 .0039 .0107 .0085 .0054-56 0·799 0·3659 . ,.0169 --.-.' - '--·-01:31 .0069 .0027 ;0168 :0086 .005786 12.8510 15·1000 .0128 ..01l5 .0054 .0033 .0089 .0074 .0048
116 4 .3860 5·1351 .QJB8 .0133 .0055 .0005 '.0107 .0076 .0040146 1·5122 2.4444 .0181 .0154 .0054 .0012 .0111 .0085 .0042176 3·9533 10.0000 .0181 .0152 .0069 .0029 .0118 .0094- .0057206 1l.3086 17·5758 .0151 .0140 .0056 .0030 .0101 .0083 .0047236 20.1386 21.6923 .0131 .0113 .0057 .0033 .0090 .0074 .0050
Y1 y~ X~ ~,2 X3 X4 X5 X6 X7
Corrllation Coefficients
Apples per I" CSA (Tree) -.76437 -.62693 -.38280 +.65066 -·71285 - ·51461 +.c66coApples per III CSA (Count Limb) -·75561 - .49653 -·31131 +.67783 -.64047 -.37324 +.10893
U-Total derived apple prod. numbers divided by cumulative primaries on each tree.y Pre-Harvest count of apples divided by CSA for the sample tree for each tree.
, r
I
N00I

Table 9a1963 Average Weight Per Apple (T...g Limb) by Diameter Class by Tree (1 gm. = .0022046 Ibs.)
0 5 0.2707' 3 '0·3836 l' 0.4123 .~ 12 0.2180 .___ ,3 0.1874 5, 0.2452 1 0·3638 0 +,0 0.23064' 0.1775 5·0-: 0.2469 1 0.2888 0 11 0,2112 .-' (;-
4 g:i~il'~ .-.·g:~~§6..-~.- 0·3457 0 17 0.26372 . '{);2976 - 0· "--·~ ...-.J.6 O,~Q ____4 0.1885 0 . , 0 0
'. ~~ 0.15062 0.1786 l' 0.2758 4 o .3289 0 " ,:1 0.26684 0.2165 4: o .2888 2 0·3395 0" -: . ~i.6 0.2152 •••r ••...,- ......
0 0 2 0·3649 2 0.~431 "
--4 0.40390 3 . 0.2961 1.Q . 0·3635 2 0:'082 '~'15 '.0.3693 .IJ~5 0,,2059 2· 0.2458 0 b 8 0.20264 0.1900 ,7._ , 0.2507 6 . 0·3120 0 18, 0.2513 ."~.•...7 0.1920 .9-, 0.2546 1 0·3241 '0 22 o~2050
: All CIRsses
0.24360.4630 "17650·34280.1955 60. 0.2639 37
0.14510.15500.13010.1404
0.1451 39
0.13670.1396
Tree :a,··....,., . 9' · '
0 3•, 29 0 I ,'.'49 1 o .0904 069 2 0·9015 0,.89 · 1 0.1190 4'.
109 3 0.0910 6129 0 1149 3 0.1074 3169 0 0189 0 O·209 1 o .0992 0':'229 0 l'. ,
249 2 0·0772 3
Total 13 0.0955 22, ..
". ~..':" :f-" .. ' .. -- '.....
,",,:,",'" ...' ", ...•...',. \
.:....--"·7~~~;.:; , --.-}~ ..- '"-'''
.i.-.----.." -.•.-- ",:,.>'*<.~r. ..; "~ ~_._, _.
• ..r '. _-:J.- j--- •. '- .
'-. ":.. ~-" ... tg.,.----I
.' .l.," '. : t-- . .,"- ..',.'-.

Tree
Table 9b1964 Average Weight per Apple (Tag Limb) by Diameter Class by Tree (1 gm. == .0022046 1bs.)
9 0 0 4 0.2067 4 .2590 1 0.•2954 0 9 0.239829 0 0 0 4 .2921 11 o .3642 0 15 0·344949 0 0 3 0.2315 10 .2670 o. 0 13 0.258869 1 0.1102 0 6 o .2201 6 .2833 0 0 13 o .240889 1 0.1036 2 0.1466 3 0.2589 6 .2579 1 0·3219 .. 0 --- - 13 0.2340
109 4 0.0816 5 0.1349 6 0.1870 0 0 0 15 0.1415129 1 0.0728 2 0.1543 8 0.1904 5 .2421 0 0 16 0.1947149 1 0.0860 3 0.1543 2 0.2050 6 .2748 2 0·31611- 1 0·3104 15 0.2407169 0 0 0 0 0 0 0189 0 0 0 8 .2792 10 o .3280 4 0.4012 22 . 0·3236
).'
209 1 0.0948 3 0.1529 2 0.2238 4 .2436 1 0·3351 0 11 0.2100229 0 0 0 2 .2568 8 0·3467 1 0.4365 11 0·3385249 2 0.1047 3 0.1360 14 0.1989 8 .2770 5 0·3519 0 32 0.2305
455 1182Total 11 o .0912 18 0.1448 48 0.2064 63 .2685 39 0·3437 6 0.4020 185 0.2500
Y No apples left on tree; probably won't be harvested.
IWoI

•
. , .•... ~- - - .
IU)I-'I

Table lOa Calculation of Weighed Average Harvest Weight Per Apple, by tree, 1963
: Total wt. :Tota1 wt.: Av. wt. :Weighed averageTree of apples :of apples: per apple :(Weight per
a IeCt. & Tag Limb)
:9 : 201.40 798 3·962 127 34.1 0.2685 12 3·3 0.2780 0.2693
19 : 254 .10 840 3·306 106 37.8 0·3566 0·356629 : 220·50 1218 5·524 370 73·3 0.1989 10 2·3 0.2306 o 199039 : 139·50 5d+ 3·613 348 51·3 0.1474 0.147449 : 268·70 1386 5·158 378 93·3 0.2468 11 2·3 0.2112 o .245859 : 205·60 1050 5·107 147 37·3 0.2537 0.253769 62·90 462 7 ·345 34 10,1 _..9 ·.?971q. q11.- .. .4··5 0.2637 0.286379 : 117·10 756 6.456 226 59·6 0.2537 0.263789 : 124.00 840 6·774 263 67.6 0.2570 ,'16 3·5 0.2180 0.254899 : 152.20 252 1.656 36 6.5 0.1806 0.1806
109 : 154.80 420 2·713 198 48.4 0.2444 13 1·9 0.1506 0.2386119 : 222.80 1008 4·524 312 .. 0.4160 . 0.4170130.1129 : 179·50 1344 7·487 150 45·8 0·3053 14 3·7 0.2668 o .3020139 : 214.00 714 3·336 70 20.1 0.2871 0.2871149 : 202 .20 714 3·531 162 51.8 0·3198 16 3·5 0.2152 0,3105159 : 194 ·50 966 4.967 215 48·7 0.2265 0;2265169 : 13·20 0 0.000 4 1.6 0.4000 4 1.6 0.4039 0.4017179 : 108·30 630 5·817 25 12·3 0.4920 0.4920189 257.80 1806 7.005 176 41.4 0.2352 15 5·6 0·3693 0.2458199 251.20 798 3·177 255 67.9 0,2663 0.2G63209 141.60 84 0·593 0 0 8 1.6 0.2028 0.2028219 : 101.20 630 6.225 17 4.5 0.2647 0.2647.?29 113·60 840 7·394 211 49·8 0.2360 18 4·5 o .2513 0,2372239 192 ·50 882 4·582 233 57.8 o 2481 0.24B1249 148.20 756 5·101 293 84.4 0.2881 22 4·5 o .2050 0,2823
IWNI

••
Table lObCalculation of Weighed Average Harvest Weight Per Apple, by tree, 19614-
.....'.~ ..
:Harvest wt.: Wt. of : No. of : Total wt. : Av. wt.Tree :apples per: appies' :of app1.~8.:per apple
: I" CSA :tree Ibs.
:9 : 201.40 911 4·523 296 64.4 0.2176 9 2.2 0.2398 - -..0.2183
19 : 254 .10 1288 5·069 308 65·7 .0.2133 0.213329 : 220·50 263 1.193 9 2.6 0.2889 15 5·2 0·3449 0·323339 : 139·50 130 0·932 19 3.6 0.1895 ·0.189549 : 268·70 632 2·352 69 19·8 0.2870 13 3.4 0.2588 0.282459 205·60 1097 5·336 553 . 121·9 0.2204 ·0.22~69 62.90 389 6 .184 74,·' 24.4 0·3297 13 3·1 0.2408 . :0·316379 117·10 648 5·534 146 46.2 0·3164. o .316489 124 .00 930 7·500 446 79·3 0.1718 13 3·0 0.2340 0.17~99 . 152.20 521 3·423 264 29·8 0.1129 0.1129.
109 : 154 .80 531 3.430 296 75·9 0.2564 14 2.1 0.1415 0.2508119 : 222 .80 2041 9·161 903 . 203·1 0.2249 0.2249129 : 179·50 1297 7·226 484. 90·0 0.1878 16 3·1 o .1~ 7 0.1880
)
139 214.00 1245 5·818 299, 65·6 0.2194- . :~.' 0.21g...149 202 .20 1194 5·905 243 . 68·3 0.2811 15 3·6 0.2407 .. 0.2787159 194 ·50 1092 5·614 179 41.7 .. 0.2330 .)P0.2330169 13·20 0 0.000 0 0 0 ;::~ ----179 108·30 520 4.801 0 0 ·!:,'jy0.2626189 257·80 1101 4.271 . 38 12.2 0·3211 22 7·1 0.3236 0·3222199 : 251.20 401 1 .596 64 20·9 [ 0·3266 0·3266209 : 141.60 127 0.897 13 1.2 0·9231 11 2·3 o .2100 , 0·5960219 : 101.20 478 4.723 35 9.4 0.2686 0.2686229 : 113·60 155 1·364 40 13·6 0·3400 11 3·7 0·3385 0·3399239 !"-:;,: 192·50 1000 5·195 316 74.8 0.2367 o .2367 ~
\ . 7.794 347 '96.6 0.2784:' 0.2746'·--·249----:;-·::148 :20 1155 32 7·2 . 0.2305..'::/;~-...: : - ;~... "~:';: . ~~f~
.! •.~._ t'---"if --'Derlved throUgh' regression ~ysis of the (wt:}-average wt. per apple (ct. and tag) on wt. of .applesperT''"'"CSA.
: I: ;- ';.·""f IWWI

Table 10cCalculation of Weighed Average Harvest Weight Per Apple, by tree, 1965
:Harvest wt.: Wt. of : No. of : Total wt.: Av. Wt. : No. of : Total wt.: Av. wt. :'Weighed AverageTree :Cumu1ative: per :app1es per: apples : :per apple: apples: of app1es:per apple: (Weight per
CSA tree : 1" CSA : wei hed: : wei hed: a 1e. in (lbs .) tree (lbs.) (lbs.) (Ct. & Tag Limb).
6 : 192·70 599·50 3·111 17 5·5 0·3235 0·323516 : 154 .10 137·00 0.889 0 0.0 ?J 0.364226 123·50 580.25 4.698 100 28.6 0.2860 8 ': 2.4 0·3009 0.287136 : 157.00 734 ·34 4.677 149 29·6 0.1987 0.198746 : 67.00 349 ·50 5.216 24 9·0 0·3750 0·375056 : 146·50 0 0.000 3 1.5 0·5000 2 0·9 0.4597 0.483966 : 106.00 9'4-.00 0.887 117 36.1 0·3025 0·308576 : 307·30 1280.75 4.168 184 68.1 0·3701 0·370186 : 256.40 1038.75 4 .051 151 47·6 0·3152 9 2.4 0.2653 o .312496 : 180.10 388.98 2.160 14 4.1 0.2929 0.2~9
106 : 202.10 952.00 4.711 267 79·3 0.2970 0.2970116 : 22.80 46 .50 2.039 19 8.8 0.4632 9 3·7 0.4140 0.4474126 : 228.00 857·00 3·759 154 54·7 0·3552: 0·3552136 69·00 369·00 5·348 34 12·5 0·3676 o. 3676146 143 ·50 79·75 0·556 22 8.1 o .3682 8 3·2 0·3977 0·3761156 257·70 1039·00 4.032 78 26.5 0·3397 0·3391166 162.00 345 .76 2.134 19 7·8 0.4105 0.4105176 141.40 185·25 1.310 80 26·5 0·3312 6 2·5 0.4156 0·3371186 86.50 434 .00 5·017 108 40.4 0·3741 0·3741196 192 .10 1219·75 6·350 402 92·2 o .2294 0.2294206 51.20 176.75 3·452 58 17·7 0·3052 7 2·3 0·3310 o .3080216 88.70 0 0.000 0 0 ?J ----226 138.60 600.25 4·331 307 57.4 0.1870 0.1870236 : 126·50 1283·25 5·927 282 83·0 0.2943 14 3·5 0.2493 0.2922246 : 287.60 2120·50 7·373 536 147·3 0.2748 o .2748
Efi=715 Efi=63
Y Derived from a regression of average wt. per apple (ct. and tag limb.>on weight of app1ef3 _ per 1" CSA (tree).I
VJ+'-I

Table 11Comparison of Expansions of Count Limb Weights, Tree Production Weights, and Actual
Production, 1963, 1964, 1965
: No. of : Expanded Average : Harvest : OrchardYear : trees : weights : weight : weight :Prod. from
: weighed: from per . for :count limb.count 11mbs : tree :.sample weights
(pounds) :(pOUInS ) : trees (2) x Ten:(pounds) .: (pounds)
(1) (2) (3) (4) (5)
1963 25 21,065.288 842.612 - 19,701 210,653--.1964 25 21,368.070 854·723 19,146 213,6811965 25 16,065·385 642.615 14,968 J6 0,654
197,010191,460149,680
4,2873,9204,573
o504
o
4,2874,4244,573
185,284 185,284169,422 191,205197,645 197,645
I!.oJU1I

Diameter in Inches3.0- ----.--- -- -:'-"-
I
--.-- •.-
1.0---'
.5 --
o
Chart I: Increase in Apple Diameters by Days After Full Bloom
. -. ~.._ ..•._-,-
iI
Days After Full Bloom
.......-.-..•--,....-".,' ..,
I~Cl'I
1
I, ,.__.2.. .._--.- .. -- ..---t----------
Portionof
total
.6
5
4
.. 3. .------ -' .
Chart II:
II1
I. II\I-- ..--..----+--.---III
II.
----------,. -- ._._ ... ~~.~~ ..,
. --_. 1_-
Percentage Size Distribution July 1 SUJ7Veys1963,. 1964, 1965
i--.r--------- .0-
I
\Ii--t - -----,
, ., •..!
Chart III: Percentage Size D;i.stribution at Harvest, 1963, 1964, 196.5Proportion of total.6
IiI'Ii;
I--- .-----.-------.-.t--. - ..---- .I i
iI
IW00I
, .-.- ..."
__ • _ ••. "_.,, _.4 .. .....•...•
·1
i!
.J
,..1. __.. .
jI!
..',".'.
I -- .•... --.--
I
,II
I._~.._....- -----··---t-· ....· ---.....-.--"'-----~--.---- ...j ! I: !
\\
!\ .\JK\~H_
. I \., ,···-i \ .
_. __ 'd' >~~....._'.\\~''-\_: ""'.", , .I ~
3 3 l/Tf""---• 3 1/2Diameter in Inches
\
1965
I/
..---- ..--. 1·-··-··----·-- ...III
I211/2 2 '3/4
I'
III
I"
,2 1/4
j
.._.-~.... -. -.----j
!
o 1. 3/4
.5 .
I.2 -1
,jj
.1 ' -.-- -
.3

Chart J)l ~ 1964 Projection of Apple Diameters FromJuly 1 Diameter Measurements and Fruit per 1" CSACompared'With
Harvest DiametersProportion of total0.25
!1--- -
" \I •• ,
I
Prdjectedl
\,. ~I'
.....// .\'Actual---.' \
IYIi
i
. .,i
I.I
/I/:1 .-,h - -. -\-
/ .,/
Ii//
;
.I---;-_.. -i
I,,.
0·05
0.10
0.15
0.20
o1.6 1. 7 1.8 1.9 2.0 2.1 2.2 2.3 2.4 2.5 2.6 2·7 2.8 2·9 3 0 3.1 3·2
IW\DI