research report examining the role of advertising in …
TRANSCRIPT

RESEARCH REPORT
EXAMINING THE ROLE OF ADVERTISING IN BRAND EQUITY
CREATION: INDOMIE INSTANT NOODLE
“Among Perspective of University Students In Yogyakarta”
Written by:
Name of Lecturer : Anas Hidayat, Drs., MBA., Ph.D
Name of Student : Ali Akbar Ghifari
Student Number : 14311038
Departement : Management
Major Study : Marketing
DEPARTEMENT OF MANAGEMENT
INTERNATIONAL PROGRAM
FACULTY OF ECONOMICS
UNIVERSITAS ISLAM INDONESIA
YOGYAKARTA
2018

ii

iii

iv

v
ACKNOWLEDGMENTS
Asssalamualaikum wr. wb.
With the blessing of our one and only Lord, this thesis entitled “Examining The
Role Of Advertising In Brand Equity Creation: Indomie Instant Noodle Among
Perspective of University Students In Yogyakarta” can be done. Thesis writing is
one of the requirements for student to get a bachelor degree in Department of
Management, Faculty of Economics, Universitas Islam Indonesia.
This thesis was finished with the support and the encouragement from
several parties. In this occasion, reseacher would like to give gratitude to the
parties that helped researcher during the making of this research:
1. My Mother Dewi Karomah, S.H., Not., my Father M.A Desky Drs.,
S.H., M.H. and my whole family who always support every aspects in
my life.
2. Mr. Anas Hidayat, Drs., M.B.A., Ph.D. as the content advisor of this
research, who has given the direction and support in finishing the
research.
3. Mr. Willy Prasetya, S.Pd., M.A. as the language advisor who helped
me correcting my imperfect grammar and sentences.
4. All the staffs in International Program, Faculty of Business and
Economics, Universitas Islam Indonesia, who have given the best
service while I study.
5. All best friends and awesome colleagues that I got during the study in
UII, they are : Ardian Praba Agung (Agung), Ihsan Manshur Putra

vi
(Inan), Bian Rachmadani (Bian), Ridho Nur Syamsu (Ridho), Abdul
Fatach Ichwan (Fatach), Rahartyo Gigar (Gigar), Faris Asrof Al Fatih
(Asrof), Akhmad Naufal (Naufal), and Mas Archie Yanuardy (Archie).
Thank you for bring so much experience, trigger insightful thoughts
during my journey in the university. I know you all will be something
awesome soon. See you on top!
6. My best friend that always trigger insightful thoughts and inspiration,
they are: Boby Prabowo (Boby), Yudha Triantoro (Yudha, Zenmatho)
7. Rascal boys (Social Two Tirtonirmolo year of 2014) who help build
tough mentality to face the world, they are: Angga Fajar (Ciawi),
Akmal, Dimas, Adib, Axel, Hans, Dio, Josapath, Odi, Arditya, Eddo,
Thomas.
8. All the members of Entrepreneur Community FE UII during the period
of 2014/2015 and 2015/2016. Indonesian Business Carnival 2015 and
2016. Outbound Management Training Facilitator 2016. Gerakan
Kepanduan UNISI 2017/2018.
9. All the students of International Program, Departement of
Management, Faculty of Business and Economics, Universitas Islam
Indonesia year of 2014. Thank you, may all of us be success in the
future.
10. My lecturer, advisory, alliances, and friends during the Student Study
Services (KKN) batch 56 years of 2018: Mr. Sumedi P. Nugraha,
Ph.D. (DPL 1), Mr. M. Rizal Nasrulloh, SEI. (DPL 2), Mr. Nirman

vii
(Head of Village Nglaris), Mr. Niecken Ardiansyah (Secretary of
Village Nglaris), Mrs. Murdiningsih (Head of PKK Nglaris) and all
lovely friends from Kaligalih, Ngaglik, Jati, Jumbleng and Siburat.
11. All the parties and people who gave me direct or indirect support.
This research is far from perfect, but, hopefully, this research could be useful
for the marketing management study in the future.
Wassalamualaikum wr. wb.
Yogyakarta, March 29th
, 2018
Ali Akbar Ghifari

viii
Table of Content
Cover ....................................................................................................................... i
Legalization Page ..................................................... Error! Bookmark not defined.
Approval Page .......................................................... Error! Bookmark not defined.
Declaration of Authenticity ..................................... Error! Bookmark not defined.
Acknowledgmenets ................................................................................................ ii
Table of Content ................................................................................................. viii
Abstract (English) ................................................................................................. x
Abstrak (Bahasa Indonesia) ................................................................................ xi
1. Introduction ................................................................................................... 1
1.1. Background ............................................................................................................... 1
1.2. Problem Formulation ............................................................................................ 5
1.3. Research Objective................................................................................................ 5
1.4. Benefit of Research ................................................................................................. 6
1.4.1. Theoretical Benefits ...................................................................................... 6
1.4.2. Practical Benefits ........................................................................................... 6
2. Literature Review.......................................................................................... 7
2.1. Advertising spending ............................................................................................ 7
2.2. Attitudes toward advertisements ...................................................................... 8
2.3. Brand awareness ..................................................................................................... 9
2.4. Perceived quality ................................................................................................. 10
2.5. Brand associations .............................................................................................. 11
2.6. Brand loyalty ........................................................................................................ 12
2.7. Conceptual Framework of the Study .............................................................. 14
3. Research Methodology................................................................................ 14
3.1. Research Location .............................................................................................. 14
3.2. Populations and Sample Research ................................................................ 15
3.3. Types and Data Collection Techniques ...................................................... 15
3.4. Definition of Variable Operational and Measurement Research ............ 15
3.4.1. Advertising spending ............................................................................... 16
3.4.2. Attitudes toward advertising ................................................................. 16
3.4.3. Perceived quality ....................................................................................... 17
3.4.4. Brand awareness ........................................................................................ 18

ix
3.4.5. Brand associations .................................................................................... 18
3.4.6. Brand Loyalty ............................................................................................. 19
3.5. Validity and Reliability Research Instruments ...................................... 19
3.5.1. Questionnaire Validity Test ..................................................................... 20
3.5.2. Questionnaire Variable Reliability Test ............................................... 23
3.6. Analysis Technique.............................................................................................. 24
4. Analysis and Discussion .............................................................................. 25
4.1. Respondents Characteristic................................................................................ 26
4.2. Data Analysis ......................................................................................................... 30
4.2.1. Variable Description Analysis ................................................................ 30
4.2.2. Evaluation of Measurement Model ....................................................... 31
4.2.3. Measuring the Model Fit .......................................................................... 32
4.2.4. Validity and Reliability Test Result ...................................................... 36
4.2.5. Structural Equation Analysis ................................................................... 40
4.3. Hypothesis Testing ............................................................................................... 44
4.4. Discussion ............................................................................................................... 50
4.4.1. Direct Effects of The Variable ................................................................ 56
4.4.2. Indirect Effects of The Variable ............................................................. 60
4.4.3. Total Effects of The Variable ................................................................. 61
5. Conclusion and Suggestion ......................................................................... 63
5.1. Conclusion .............................................................................................................. 63
5.2. Suggestion .............................................................................................................. 64
References ............................................................................................................ 65
Appendix .............................................................................................................. 70

x
Examining the Role of Advertising in Brand Equity Creation: Indomie
Instant Noodle
“Among Perspective of University Students in Yogyakarta”
Ali Akbar Ghifari
Faculty of Economics of Universitas Islam Indonesia
ABSTRACT
Advertising is one of marketing communication components that commonly
used by organizations or other entities to build the desired brand equity.
According to David Aaker concept of brand equity in 1991, it consists of 4
components which are perceived quality, brand awareness, brand associations,
and brand loyalty. The objective of this research is to make business,
organizations, and other entities more effective in making a decision on their
advertising investment. The researcher tries to examining the correlation
between how Indomie instant noodle conducted advertisement and how the
consumers react and perceived the perspective on Indomie instant noodle brand
equity components. The data was obtained by distributing online questionnaire
to 300 university student in Yogyakarta. The data processed with Structural
Equation Modeling method by using AMOS and SPSS as the software. The
empirical result show that advertising had a positive impact to the brand equity
creation.
Keyword: Advertising, Brand equity, Brand loyalty,Advertising spending,
Attitude toward advertising

xi
Menguji Peranan Iklan Terhadap Ekuitas Merek: Mie Instan Indomie
“Perspektif dari Mahasiswa/i di Yogyakarta”
Ali Akbar Ghifari
Fakultas Ekonomi Universitas Islam Indonesia
ABSTRAK
Iklan adalah satu dari beberapa komponen pada komunikasi pemasaran yang
sering kali digunakan oleh organisasi atau kesatuan lain demi membangun
ekuitas merek yang di inginkan. Mengacu pada konsep dari ekuitas merek oleh
David Aaker pada tahun 1991, ekuitas merek terdiri dari empat komponen yang
mana adalah; kualitas yang dirasakan, kesadaran merek, asosiasi merek, dan
kesetiaan merek. Tujuan dari dilakukannya penelitian ini adalah demi
meningkatkan tingkat efektifitas dari keputusan perusahaan dalam melakukan
investasi pada iklan. Peneliti mencoba untuk mengkaji hubungan dari iklan
yang telah diluncurkan oleh Indomie dan dampaknya terhadap ekuitas merek
Indomie dari sudut pandang para konsumen. Data diperoleh dengan
menyebarkan kuesioner secara online kepada 300 Mahasiswa yang berdomisili
di Yogyakarta. Perolehan data diolah menggunakan metode Model Persamaan
Struktural dengan AMOS dan SPSS sebagai perangkat lunak pendukung. Bukti
empiris menunjukan bahwa iklan memberikan pengaruh positif terhadap
ekuitas merek.
Kata kunci: Iklan, Ekuitas merek, Kesetiaan merek, Pengeluaran iklan,
Perilaku terhadap iklan


1
1. Introduction
1.1. Background
The desire of firms and organizations to formulates a competitive
advantage were pretty obvious. In this attempt, branding frequently
assumes as a critical part. Commonly, it is regularly less expensive to
hold clients rather than gain new ones (Rosenberg and Czepiel, 1983);
also, the loyalty of the customers are less price sensitive (Krishnamurthi
and Raj, 1991); and thirdly, that a company's transactional degree is
increasingly relevant with the loyalty expands (Aaker, 1991). Therefore,
the loyalty to the brand is seen as a core for some organizations to
manage its competitive advantages and considered as a key idea in
marketing communication practice (Schiffman and Kanuk, 2010). Oliver
(1999) characterizes brand loyalty as a profound that attach a sense of
reliablility to repurchase a chosen (or an arrangement) over different
brands, it happens autonomously by the outer strengths. For example, the
settings in certain situation or showcasing the potential of the brands that
attract an exchanging conduct of a certain product or services by the
customers (Oliver, 1999). A fundamental definition is provided by Jacoby
and Kyner (1973) who characterize brand loyalty as a "one-sided i.e. non-
random, behavioral reaction i.e. purchase, that communicated overtime by
a similar unit regarding at least one option of a brand and it is a part of
human-nature process". Both these definitions suggest that brand loyalty
has a behavioral and additionally an attitudinal part. The behavioral

2
segment alludes to real purchase behavior, rather than expressed by aims
(attitudinal component). Moreover, the behavioral part experiences
various estimation confinements which, in a developing business sector,
are frequently happened because of an absence of fundamental assets to
secure the images of the brand.
Advertising has for quite some times been utilized by business
firms to drive in, and hold potential customers through various form of
communication (Yang, Bi, and Zhou, 2005). It is regularly trusted that
advertising tends to give positive influences to brand loyalty (Agrawal,
1996), with firms particularly rehash the advertising to energize and
trigger purchasing (Yang et al., 2005). Thus, the researcher assume that
business and organizations believes that advertising is one of the most
effective ways to building desired brand equity. This research was trying
to analyze how the consumers' response toward advertising that
conducted by certain organizations, it is measured by how the consumer
react and relate it to the brand equity. Based on the framework also refer
to Brand Equity Model by (Aaker, 1991) the writer had been agreeing
that brand equity were forming with some aspects which are brand
awareness, perceived quality, brand associations, and brand loyalty.
Whereas, in this research, the writer attest that brand awareness,
perceived quality, brand associations and brand loyalty were affected by
advertising spending and consumer attitudes towards the advertisements
that launched by the brand.

3
However, many fractions still wonders how advertising works in
brand equity creation of certain product or services. In this research, the
writer assume that advertising effects depend on the types of messages
that delivered. Thus, massive advertising will affect the message received
by the audience. In particular, the belief is that a subject that presented as
a stimulus in the advertisement will lead to the responds (i.e. purchase,
recall, associations) to that stimulus will produce "behavior" (the object of
psychology's study, as a field). It slightly explains how advertising or
marketing communication work on the target audience through
stimulation of the messages.
At the point when consumers are shelled with a plenty of stimulants
from various sources, especially hedonic items, it evokes a higher level of
positive feelings than utilitarian items (Shiv and Fedorikhin, 1999) and
positive feelings prompt positive reactions towards cause-related items
(Kim and Johnson, 2013). As specified, when confronting decisions,
customers may likewise feel remorseful, given the difficulty in
advocating the purchasing choice (Winterich and Barone, 2011). Disgrace
and blame are unsavory and negative exciting reactions that may, thus, act
as an excuse for unselfish conduct as a kind of remuneration component
(Allen et al., 1992; Rosenhan et al., 1981). Research exhibited that
advertising offers may influence target customer's attitudes towards the
advertisements (Liu et al., 2009; Hornik and Miniero, 2010) and brand
attitude (Wang et al., 2000; Kim and Lee, 2012). In any case, it is obvious

4
that there is numerous research showing the interconnections among
various sorts of advertising appeals, attitude toward advertising, and
brand attitude in an integrated model.
Researcher select Indomie as the object of the study. The researcher
assumes Indomie had a strong brand equity in perspective of Indonesian
customers, particularly university students considering the cost that makes
Indomie instant noodle categorized as low involvement product. This
assumption also supported with data published by Nielsen Indonesia in
2017 that composing most advertising spender in Indonesia. Indomie
instant noodle with Rp765.2 Billion investment on advertising stands in
the third position, following by Vivo GSM and Samsung.
Considering the data above, led the researcher to construct a set of
hypothesis that with the huge amount of investment on advertising, it
does give positive impact in the brand equity of Indomie. Moreover, the
research also projecting to reveal the most significant variable in the
brand equity referring to Brand Equity Model by David Aaker in 1991
that affected by advertising. The variables are perceived quality, brand
awareness, brand associations, and brand loyalty. The findings will enrich
insights to the brands and advertisers to formulate effective advertising to
give maximum impact on enhancing brand equity.

5
1.2. Problem Formulation
1. Does advertising spending affect perceived quality?
2. Does advertising spending affect brand awareness?
3. Does advertising spending affect brand associations?
4. Do attitudes toward advertisements affect perceived quality?
5. Do attitudes toward advertisements affect brand awareness?
6. Do attitudes toward advertisements affect brand associations?
7. Does brand awareness give impact to perceived quality and brand
associations?
8. Do perceived quality and brand associations affect brand loyalty?
9. Does advertising give positive impact to the brand equity creation?
1.3. Research Objective
From the problem formulation above, it can be classified that, the
objectives of this research are:
1. To clarifiy whether advertising spending relates to perceived quality
2. To clarify whether advertising spending relates to brand awareness
3. To describe whether advertising spending affect brand associations
4. To describe whether attitudes toward advertisements affect
perceived quality
5. To describe whether attitudes toward advertisements affect brand
awareness

6
6. To describe whether attitudes toward advertisements affect brand
associations
7. To investigate on how brand awareness, give impact to perceived
quality and brand associations
8. To investigate on how perceived quality and brand associations give
impact to brand loyalty
9. To know the correlation of advertising in brand equity creations,
identifying the most affected variable influenced by advertising in
brand equity creations.
1.4. Benefit of Research
1.4.1. Theoretical Benefits
This examination is a process to a full comprehension in
advertising and marketing communication advancements to brand
equity creation. In spite of the limitation, the findings that revealed
in this paper will offer new perspective to be considered into how
to maximize the brand equity enhancement by utilizing
advertisements.
1.4.2. Practical Benefits
The research will show how the correlation of capital
invested by the advertisers also how the target audience reacts
within the advertisement. In this case, the researcher select
Indomie as the object of the research and university student from

7
Yogyakarta as the target audience. The result will be beneficial for
brands and advertisers to considers the capital that invested on the
advertisement and give some insight about how it affect the brand
equity creation of the product or services.
2. Literature Review
2.1. Advertising spending
Advertising spending is the cost caused by issuing a certain
advertisement. Spending on advertising to develop brand awareness and
improves brand loyalty (Nguyen, Barrett and Mill operator, 2011, Clark,
Doraszelski, and Draganska, 2009). Aduloju, Odugbesan, and Oke
(2009) are of the supposition this advertising spending should be
completely integrated into the communication of marketing mix in order
to get the best outcomes from it. A decent strategy for advertising should
decide the most proper media mix and distinguish the most appropriate
path expected to successfully deliver the message wanted by the
organizations. This should be a proper budget that is adequate to carry
out the occupation (Rotfeld, 2007). Tai (2007) is the viewpoint that
organizations having a low market of the market share should develop
their advertising spending plan so as to help their competitive advantage
and awareness of their product or services endeavors. These endeavors
will at last help in extending the market share of the industry.

8
H-1a: Consumers' perceptions of a brand's advertising spending have
a positive influence on perceived quality
H-1b: Consumers' perceptions of a brand's advertising spending have
a positive influence on brand awareness
H-1c: Consumers' perceptions of a brand's advertising spending have a
positive influence on brand associations
2.2. Attitudes toward advertisements
Attitudes toward advertising are induced more by advertisements
(Mehta, 2000). In a comparable vein, we anticipate that people who hold
a dominatingly positive perspective of advertising are more promptly
influenced by the "advertising esteems" than participants with a
predominantly negative view.
There are distinctive effects behind foreseeing that attitude toward
advertising may affect the extent of the primping impacts of advertising
on value-driven behavior. In this study, we conduct attitudes toward
advertisements as an indicator to measure whether the advertisement by
certain business or entity are considered as how the advertiser desired the
target audience to response. How people behave and decide to buy a
product or services are affected by some factors. Advertising is
considered as one of key factors in the creations of values, beliefs, and
behaviors of a certain target audience (Usman et al., 2010).

9
Several studies also found that the advertisements show how the
product or services position themselves in the market, when comparing
strength and substitution positioning strategies of certain brand, it is
strongly considered that benefit positioning is the most superior
positioning strategy (Schiffman and Kanuk, 2007; Wind, 1982).
H-2a: Individuals' attitudes toward the advertisements undertaken for
a brand have a positive influence on perceived quality
H-2b: Individuals' attitudes toward the advertisements undertaken for
a brand have a positive influence on brand awareness
H-2c: Individuals' attitudes toward the advertisements undertaken for a
brand have a positive influence on brand associations
2.3. Brand awareness
Brand awareness defined as “the strength of a brand’s presence
in the consumer’s mind” (Aaker, 1996, p. 10). Brand awareness are
about the recognize level of certain brand in consumer perspective.
However, it assumes that a product that has high level of brand
awareness is reflect with the consumer perceived quality of the
product. Because, in order to have high level of brand awareness in
consumer mind, the product should have a certain characteristic such
as number one, initiator in the market, or any other reason that caused
the product have high awareness.

10
Contribution of this study is to empirically compare the impacts
of perceived quality, brand awareness, advertising attitudes and store
image on brand loyalty in Thailand and Vietnam.
The result shows that manager of international brands in
emerging market should recognize the differences between markets in
order to design effective loyalty program each market.
H-3: Brand awareness has a positive influence on perceived quality.
H-4: Brand awareness has a positive influence on brand
associations.
2.4. Perceived quality
As indicated by (Zeithmal, 1988) defined that perceived quality
as customer's supposition in subjective recognition about the quality
and amazingness of a product or services. (Parasuraman, et al., 1985)
in the other hand expressed that perceived quality as an attitude of
customers, in view of the relative consequences of purchasing and real
execution of a product or services. This perception is the pre-
experience of quality (Hamer, 2006). Bahia and Nantel (2011)
recognize that all sort of business or entity look-up for quality,
regardless of their form of the business. Perceive quality As stated by
Kotler (1997, p. 185) that “there is not only physical stimuli that
affects, but also the circumstances or surrounding condition within the
individual.” Durianto (2001) perceived quality considered as

11
perception of a whole quality of product or services that desired by
the customers.
According to the research indicate by Rüçhan & Huseyin
(2007), the components of perceived quality impact either direct and
indirect to the brand loyalty. In addition, (Saleem et al., 2015) agree
when perceived quality appears trough certain brand, there is a
possibility that the customer will loyal to the brand and showing brand
loyalty.
H-5: Perceived quality has a positive influence on brand loyalty.
2.5. Brand associations
Brand associations are a relation among a certain brand, product
with the consumer. Brand associations are anything that consumers
connect to the brand in their memory (Aaker, 1991). Brand
associations also considered as anything deep seated in consumer
mind that giving some action, impact, similarity to the brand with
their personality (Dreyer, 2012). Simply, brand association is how the
consumer think that brand is fit with them. Either with their interest,
mindset and their behavior.
Brand associations has some attributes that delivered to the
market. In this case is advertisement spent, in order to delivering the
attributes of the brands to the consumer, a company or other entity
need to communicate with them, normally through the marketing
communication tools such as Advertising, Public Relations,

12
sponsorship, event or any other methods (Slabbert, 2012). Bauer et al.
(2005) even found a correlation of attitudinal loyalty on behavioral
loyalty that give highly significant impact.
H-6: Brand associations have a positive influence on brand loyalty.
2.6. Brand loyalty
Refer to Oliver (1999) characterizes brand loyalty as a strong
point to repurchase a specific item/benefit in certain period time. This
rehash purchase intention is not influenced by any significant factor.
An examination (Jensen and Hansen, 2006) reasons that loyal
customers don't get influenced by the offer of rival product or
services. They will probably spread positive informal word-of-mouth
regarding a brand to their colleagues and relative. These are the
customers walk into the outlet to repurchase the brand when needed.
Ha (1998) is of the view that in order to know that whether or not we
are dealing with a loyal customer, the attitude causing the purchase
decision must be investigated. Advertiser working in multi-social
environments have got hold of brand loyalty by modifying the image
of a brand to fit the individual cultures (Palumbo and Herbig, 2000).
Contrary to this, Oh and Fiorito (2002) are view that brand loyalty is
not related to the demographic factors. The repeat purchase behavior
of the customers can be improved by increasing customer’s relative

13
attitude towards a particular brand. Attitude building marketing
strategies can help marketers in this regards (Jensen and Hansen,
2006).
H-5: Perceived quality has a positive influence on brand loyalty.
H-6: Brand associations has a positive influence on brand loyalty.

14
2.7. Conceptual Framework of the Study
The conceptual framework provides a foundation for research
study. The framework consists of 2 independent variables which are
Advertising spending and Attitudes toward advertisements, 3 mediating
variables which are Perceived quality, Brand awareness, and Brand
associations and 1 dependent variable which is Brand loyalty.
3. Research Methodology
3.1. Research Location
The location of this research is in Yogyakarta without any specific
area. The reason why the researcher decides to do research here is
because it will be more effective for the researcher that currently a
student in Faculty of Economics, Universitas Islam Indonesia and also
originally from Yogyakarta. The city also known as the city of student
whereas proper to get university student respondents.

15
3.2. Populations and Sample Research
Population is known as a certain group or collection of individuals
or object under the study. The sample is collection of several part that has
identical characteristic with the population that taken for study. In this
study population are the university student in Yogyakarta that had an
experience in consuming Indomie and ever watch Indomie
advertisements. To minimize the biases, minimum 200 samples are
required on every estimated SEM (Loehlin, 1997). The respondents
consists of male and female student, numbering 300 samples.
3.3. Types and Data Collection Techniques
The data that used in this research is primary data. Primary data is
data that obtained by direct observation by using specific research
methodology. In this research, the data obtained through questionnaire
which was randomly distributed online to university student in
Yogyakarta.
The type of the questionnaire is closed question, which means that
the option of the answer is already given.
3.4. Definition of Variable Operational and Measurement Research
The variables that will be analyzed in this study are Advertising
spending, Attitudes toward advertisements, Perceived quality, Brand
awareness, Brand associations, and Brand loyalty. Advertising spending,
Attitudes toward advertisements as the independent variables, the next is
four dependent variables which are Perceived quality, Brand awareness,

16
and Brand associations. The researcher suggest that Perceived quality
and Brand associations will affect Brand Loyalty. All items were
measured on a six-point agreement scale ranging from 1 = “Strongly
disagree” to 6 = “Strongly agree.”
3.4.1. Advertising spending
Researcher conclude that perceptions of high
advertising spending contribute to developing a more
positive perception of brand quality, higher brand
awareness and stronger brand associations (Rao and
Monroe, 1989). This variable is measured by the following
indicators:
Brand X is intensively advertised
Brand X seems to spending a lot on its advertising
compared to advertising for competing (product
category) brands
The advertisements for brand X are frequently shown
3.4.2. Attitudes toward advertising
Through an original and innovative advertising
strategy, business or entity may be more likely to capture
consumer’s attention. As mentioned earlier, advertising
creates brand awareness, links strong, favorable, and
unique associations to the brand in consumers' memory,

17
and elicits positive brand judgments and feelings (Keller,
2007). This variable is measured by the following
indicators:
The advertisements for brand X are original
The advertisements for brand X are different from the
advertisements for competing brands of (product
category)
3.4.3. Perceived quality
Perceived quality can be described as the
indicator of quality by customer. In this study, the
researcher assume that this variable will affected by
marketing promotions such as advertising, monetary
promotions, and non-monetary promotions (Lavidge and
Steiner, 1961). This variable is measured by the
following indicators:
Brand X offers very good quality products
Brand X offers products of consistent quality
Brand X offers very reliable products
Brand X offers products with excellent features

18
3.4.4. Brand awareness
Brand awareness here is becoming the indicator
on how the promotions of the organizations affect the
customer awareness or the level of conscious of the
product or services by certain company (Keller and
Lehmann, 2003). This variable is measured by the
following indicators:
When I think of (product category), brand X is one
of the brands that comes to mind
X is a brand of (product category) I am very
familiar with
3.4.5. Brand associations
While brand awareness is intended to be the
indicator of the level conscious, brand associations is
more about the credibility or familiarities of a product or
services (Keller, 1993) by certain business or entity. This
variable is measured by the following indicators:
Brand X is good value for the money
Within (product category) I consider brand X a
good buy
Brand X has a personality

19
3.4.6. Brand Loyalty
The level of where customer became loyal to their
product or services is tend to be every business or other
entity desire to achieved. The situation where customer
became committed to the product and make repeat orders
from the same brands overtime (Oliver, 1999). This
variable is measured by the following indicators:
I consider myself to be loyal to brand X
I will not buy other brands of PC if brand X is
available at the store
3.5. Validity and Reliability Research Instruments
Before the questionnaire was spread to the sample of the research,
the questionnaire would be tested. Firstly, the questionnaire would
distributed to 30 (thirty) respondents. After that, the validity and
reliability of the data would be tested, the methods also known by pilot
test.
The number of question in the questionnaire are 16 questions,
which are consist of some variable:
Variable about Advertising Spending consist of 3 questions
Variable about Attitude Toward Advertisements consist of
2 questions
Variable about Perceived Quality consist of 4 questions

20
Variable about Brand Awareness consist of 2 questions
Variable about Brand Associations consist of 3 questions
Variable about Brand Loyalty consist of 2 questions
The measurement model was evaluated by inspecting the reliability
of the individual item loadings and the convergent validity of the
measures associated with each construct (Hulland, 1999). Individual item
reliabilities were first assessed by examining measures of respective
constructs for loadings of. 0.70 (which implies a shared variance of .50
percent between the measure and construct).
3.5.1. Questionnaire Validity Test
The validity of the questionnaire was determined by
how the questionnaire able to elaborate the measured
variable (Ghozali, 2005). The function of product moment
formula is to measure the validity of the questionnaire that
given to the respondent (Soehardi Sigit, 2003)
The analysis conducted in order to determine how
far the relation of one variable to another. To test the level
of validity of the variable, the writer use the SPSS 16.0 for
Windows. Product moment formula is: When the r value
was able to see with the correlation where (α) = 0.05 if
Rvalue was greater than Rtable or the level of significant <
α then the questionnaire would be considered as invalid.

21
The requirement for an instrument that categorizes
as valid if the coefficient correlation is same or greater than
0.3 (Sugiyono, 2005). Valid here means that the
instruments were able to utilize to measure the value
desired. The result of validity test was attached in Table
3.1.

22
Table 3.1
Questionnaire Validity Test
Variable Indicators Value Cut Off Result
Advertising Spending
AS 1 0,751 0,361 Valid
AS 2 0,857 0,361 Valid
AS 3 0,784 0,361 Valid
Attitude Toward Advertisiement ATA 1 0,918 0,361 Valid
ATA 2 0,929 0,361 Valid
Perceived Quality
PQ 1 0,822 0,361 Valid
PQ 2 0,846 0,361 Valid
PQ 3 0,862 0,361 Valid
PQ 4 0,760 0,361 Valid
Brand Awareness BAW 1 0,932 0,361 Valid
BAW 2 0,904 0,361 Valid
Brand Associations
BAS 1 0,862 0,361 Valid
BAS 2 0,868 0,361 Valid
BAS 3 0,843 0,361 Valid
Brand Loyalty BL 1 0,923 0,361 Valid
BL 2 0,92 0,361 Valid
Sources: Processed Primary Data (2017)
As mentioned in table 3.1 most of the pilot test result are qualified, refer to
validity > Rtable, hereby the indicators of the variable are classified as valid.

23
3.5.2. Questionnaire Variable Reliability Test
Variable reliability testing is proposing to ensure that the
indicator is accurate by not showing any indication of bias
or inconsistency of each item (Sekaran, 2000). Therefore,
by indicating variable reliability testing, the result be
expected to give an better accuracy and consistent result in
measuring the variable. In this research, to test the
reliability of variable, the researcher’s use Cronbach alpha
coefficient as the benchmark. Refer to Cronbach alpha
concept, the value considered is α > 0.60, while the
maximum score considered is 1.0.
Result of the variable reliability test are shown in table 3.2
Table 3.2
Questionnaire Reliability Test
Sources: Processed Primary Data (2017)
No Variable Cornbach's
Alpha Requirement Status
1 Advertising Spending 0,714 0,60 Reliable
2 Attitude Toward
Advertising 0,826 0,60 Reliable
3 Perceived Quality 0,833 0,60 Reliable
4 Brand Awareness 0,809 0,60 Reliable
5 Brand Associations 0,820 0,60 Reliable
6 Brand Loyalty 0,823 0,60 Reliable
24
3.6. Analysis Technique
Whereas the analytical tools was proposing to process the data to
prove reliability and validity. The researcher’s used SPSS. In the other
hand, for the hypothesis testing this study used analysis of structural
equation modeling or known as (SEM), and AMOS for the software.
SEM analysis is methods that allows analyzing the influence of some
other variable concurrently (Ghozali, 2008).

25
4. Analysis and Discussion
This chapter elaborate and discuss the result of data that the
writer’s has analyze regarding "Examining The Role Of Advertising In
Brand Equity Creation: Indomie Instant Noodle Among Perspective of
University Students In Yogyakarta". The discussion start by showing the
result of quantitative data that already collected through questionnaire and
proceed by several statistic software. The analysis is covering the
goodness of fit index, Structural Equation Modeling or known as SEM,
and hypothesis testing.
After the questionnaires are distributed, the researcher does
filtering the data in order to separate the outlier and invalid response. It
resulted of 300 respondents in total. All received data are attached in the
appendix and data recapitulation chapter.

26
4.1. Respondents Characteristic
a) Gender
The study has been divided respondents gender characteristic as
follows:
Table 4.1
Respondents Gender Classificiation
No Gender Frequency Percentage
1 Male 140 46,7%
2 Female 160 53,3%
Total 300 100,0%
Source: Processed Primary Data, 2018
Refering to table 4.1 above, the table describes that female
respondents shows a higher percentage than male respondents.
However, it did not means that female respondents are more aware
of Indomie advertisements rather than male. The gender
classifications show that the study result would have a slight
tendency to the female response because the gap between male and
female respondents is 6,6% or 20 respondent.

27
b) Age
In the age distribution, the respondents are classifying as follows:
Table 4.2
Respondents Age Distribution
No Age Frequency Percentage
1 < 20 38 12,7%
2 20-35 262 87,3%
3 36-50 0 0%
4 >50 0 0%
Total 300 100,0%
Source: Processed Primary Data, 2018
As described in Table 4.2 the respondents that came from
less than 20 years old were represent 12,7% of the respondents,
and the rest are represented by those who 20-35 years old. It is
because the study was focused on the university student in
Yogyakarta that makes the age distribution were not significant.
The result concludes that the study would only discuss the
perspective of respondents who are less than 20 to 35 years old.

28
c) Occupation
Regarding the occupations of the respondents, the distribution was
shown as follows:
Table 4.3
Respondents Occupation
No Occupation Frequency Percentage
1 Student/University student 300 100,0%
Total 300 100,0%
Source: Processed Primary Data, 2018
As discussed earlier in the previous chapter, the focus of
the study was university students in Yogyakarta. The data shows
that all of the respondents are active student/university students. It
is mean that the respondents are accurate from what the writer has
planned to observe.
d) Income
The study also use income as the demography distribution
of the data collected.
Table 4.4
Respondents Income/Allowance
No Income/Allowance Frequency Percentage
1 Rp0 - Rp1,000,000 136 45,3%
2 Rp1,000,001- Rp3,000,000 145 48,3%
3 Rp3,000,001 - Rp5,000,000 15 5,0%
4 More than Rp5,000,000 4 1,3%
Total 300 100,0%
Source: Processed Primary Data, 2018

29
As shown in Table 4.4 the respondents had differences in
terms of income/allowance, even though that the difference were
not significant. Most of the students receive Rp1,000,001 –
Rp3,000,000 every month, it represented by 48,3% while the other
significant percentage is 45,3% that receive Rp0 – Rp1,000,000
every month. It means that 93,6% of our respondents receive no
more that Rp3,000,000 each month. Those who earn more were
only the slight of the respondents, that representing 6,4% of the
data.

30
4.2. Data Analysis
4.2.1. Variable Description Analysis
Table 4.5
Respondents Classification to All Variable
No Variable
Total
Mean
Variable
Mean
Variable
Rounding
Up Category
1 Advertising
Spending 13,8 4,60 5 Agree
2 Attitude Toward
Advertising 9,08 4,54 5 Agree
3 Perceived Quality 18,97 4,74 5 Agree
4 Brand Awareness 10,52 5,26 5 Agree
5 Brand Associations 14,61 4,87 5 Agree
6 Brand Loyalty 8,28 4,14 5 Agree
Average 12,54 4,69 5 Agree
Source: Processed Primary Data, 2018
Refer to Table 4.5 it shows that the respondents
tend to give positive responses to the indicators. The mean
of the variable was 4,69 out of 6 which categorized as
agree. It shows that the respondents were responds
positively in how the advertising spending and attitude
toward advertising affect the brand equity dimension which
consists of perceived quality, brand awareness, brand
associations, and brand loyalty.

31
4.2.2. Evaluation of Measurement Model
Measurement model analysis essentially used to test
the unidimensionality of the indicators that represent
factors or a latent variable. In context to verify that the
indicators are qualified to represent the dimension of the
factors. Evaluation methods that used were based on the t
score from the parameters and its significance value.
According to Holmes-Smith (2001) it stated when α = 0,05
the parameters that have t value greater than 1.96 indicate
that the parameters were significant or categorize as valid.
Another approach to model-fit is to accept a model that
approximates the true model through the index, Root Mean
Square Error of Approximation (RMSEA), with typically
an RMSEA of less than 0.05 indicating close fit, and values
between 0.05 and 0.08 indicating acceptable fit.
The result of measurement model Analysis could be
seen in Table 4.6 on the next page.

32
Table 4.6
t-value and Level of Significant
Item t-value p-value Result
AS 1 1 - Valid
AS2 8,835 0,000 Valid
AS 3 9,906 0,000 Valid
ATA 1 1 - Valid
ATA 2 1 - Valid
PQ 1 1 - Valid
PQ 2 16,645 0,000 Valid
PQ 3 20,778 0,000 Valid
PQ 4 13,971 0,000 Valid
BAW 1 1 - Valid
BAW 2 1 - Valid
BAS 1 1 - Valid
BAS 2 8,104 0,000 Valid
BAS 3 8,225 0,000 Valid
BL 1 1 - Valid
BL 2 1 - Valid
Source: Processed Primary Data, Structural Equation Modeling (SEM), 2018
4.2.3. Measuring the Model Fit
In context of Structure Equation Modeling (SEM),
there are no main statistical tools in order to test the
hypothesis. In purpose to measure the degree of model-fit,
the resaearchers were able to combine some of goodness of
fit index (Hair et al; 1998).
The section below will be discussed several
methods that commonly used in order to measure the
degree of goodness of fit of a model. There also will be
discussed some of cut-off criteria that used in this research.

33
Chi-Square (χ²). The test was conducted to
measure if there any differences between population
covariance matrix and sample covariance matrix. In this
study, the researcher expects that the population covariance
matrix was equaled to sample covariance matrix. Refer to
goodness of fit index, model that considered as good if it
has low chi-square score and has p > 0,05 cut-off value
(Holmes, 2001).
Root Mean Square Error of Approximation
(RMSEA). The test was purposed to compress the chi-
square in a large amount of sample. RMSEA may reflect
the degree of model fit in a certain sample. The model has
considered if it has value RMSEA ≤ 0,08 (Browne and
Cudeck, 1993)
The Goodness of Fit Index (GFI). GFI was known
as the analog of R square value in multiple-regression
(Tabachnick, 2001). The index fit of GFI used to calculate
the proportion of variance in sample covariance matrix that
elaborated by estimated population covariance matrix. The
range of GFI value is between 0 - 1, if the value was higher
than 0,90 it shows that the model was fit (Jöreskog and S
örbom, 1996)

34
Tucker Lewis Index (TLI). The test is an
alternative to an incremental fit index which comparing a
certain model toward baseline model. The value that
considered in the test is ≥ 0,90 if the value closer to 1, it
indicates that the model was considered a good model (Hair
et al, 1998).
The Comparative Fit Index (CFI). Alongside with
TLI, this test was recommended to measure the degree of
goodness of fit model because it is not sensitive to the
amount of sample also the complexity of the model. The
range of CFI value was 0 to 1. In order to considered as
good, the model should has the value of CFI ≥ 0,95,
however, if the value is ≥ 0,90 also acceptable (Holmes,
2001).
Table 4.7
Goodness of Fit Index
Goodness of Fit Index Cut off Value
X2 (Chi-Square) Small value
CMIN/DF ≤ 2.00
GFI (Goodness of Fit Index) ≥ 0.90
RMSEA (Root Mean Square Error of Approximation) ≤ 0.08
AGFI (Adjusted Goodness of Fit) ≥ 0.90

35
TLI (Tucker Lewis Index) ≥ 0.90
CFI (Comparative Fit Index) ≥ 0.90
Source: Ferdinand (2002)
The result of model fit-test could be seen in Table
4.8 on the next page.

36
Table 4.8
Goodness of Fit Index Result
Source: Processed Primary Data, Structural Equation Modeling (SEM), 2018
According to the normality test it shows that
RMSEA score < 0,08, GFI > 0,90, TLI and CFI > 0,90.
This result describes that the structural equation modeling
is considered as fit.
4.2.4. Validity and Reliability Test Result
Validity is the degree of appropriation of some
point or indicators in order to measure a construction, or it
is mean that validity is made sure that the items really
representing what should be represented (Anderson and
Gerbing, 1998). It is an obligation for the researcher to
conduct validity test to make sure the unidimensionality of
the constructed indicators that involve in the study before
conducting the reliability test.
Researcher testing the observed variable by the
approach of convergent validity. Convergent validity may
be seen from the measurement model by deciding whether
Constructs χ² RMSEA GFI TLI CFI Status
AS 1,000 0 1,000 1,000 1,000 Good Fit
ATA 1,000 0 1,000 1,000 1,000 Good Fit
PQ 4,419 0,064 0,993 0,990 0,997 Good Fit
BAW 1,000 0 1,000 1,000 1,000 Good Fit
BAS 1,000 0 1,000 1,000 1,000 Good Fit
BL 1,000 0 1,000 1,000 1,000 Good Fit

37
each estimated indicators correctly measured the dimension
from the tested concept. Indicators that showing the
significant convergent validity if the coefficient variable of
the indicator were greater than twice of the standard error
(Anderson and Gerbing, 1988) or contain twice greater
critical ratio from the standard error square (Ferdinand
2002). AMOS version 24 facilitate the measurement of the
convergent validity by observing the critical value or t-
value of each indicator. The criteria if indicators t-value ≥
1,96 means that the indicators is significant in the level of α
= 0,05 (Holmes-Smith, 2001).
Joreskog and Sorbom (1996) also stated that if the
index of GFI ≥ 0,90 it shows that the indicators measured
were valid and categorizes as unidimensionality of the
tested construct, with the result that the construct was
appropriate to test the hypothesis in the study.
Reliability is the measurement of internal
consistency for the indicators in a certain construct that
showing the degree of each indicator to indicate the general
construction, or simply a consistency level and stability of
the instrument (Ferdinand, 2002). In SEM there are some
statistical tools in context to measure the reliability of

38
constructs which are construct reliability and variance
extracted.
In this study, the reliability constructs tested with the
approach of construct reliability by calculating the
instrument reliability index that used by the analyzed SEM
model. The construct reliability obtained from the formula
by Fornell and Laker’s (1981) as seen below:
Construct Reliability = ( )
( )
= Standard loading of each indicators (observed
variable)
= The degree of error of each indicators (1 – indicators
reliability).
The result of validity and reliability test could be
seen on Table 4.8 in the next page:

39
Table 4.9
Validity and Reliability Test of The Study
Source: Processed Primary Data, 2018
Refer to Table 4.8 it shows that the probability
statistic was> 0,50, therefore, all the indicators in the
questionnaire in the variable Advertising Spending,
Attitude Toward Advertising, Perceived Quality, Brand
Awareness, Brand Associations, and Brand Loyalty < Level
of Significant = 0,05 or above the average of 0,113 from
Indicator λ ₁ ε ₁ Status Construct
Reliability Status
Advertising Spending
AS1 0,785 0,069 Valid
0,921
Valid
AS2 0,546 0,066 Valid Valid
AS3 0,882 0,054 Valid Valid
Attitude Toward Advertising
ATA1 0,740 0,057 Valid 0,914
Valid
ATA2 0,635 0,072 Valid Valid
Perceived Quality
PQ1 0,853 0,035 Valid
0,956
Valid
PQ2 0,793 0,037 Valid Valid
PQ3 0,938 0,025 Valid Valid
PQ4 0,705 0,056 Valid Valid
Brand Awareness
BAW1 0,815 0,043 Valid 0,954
Valid
BAW2 0,869 0,038 Valid Valid
Brand Associations
BAS1 0,653 0,060 Valid
0,910
Valid
BAS2 0,752 0,071 Valid Valid
BAS3 0,681 0,076 Valid Valid
Brand Loyalty
BL1 0,781 0,101 Valid 0,865
Valid
BL2 0,679 0,127 Valid Valid
40
the rtable are considered as valid. Considering that
Construct Reliability coefficient > 0,60, therefore, all the
questions or indicators in the questionnaire in variable
Advertising Spending, Attitude Toward Advertising,
Perceived Quality, Brand Awareness, and Brand Loyalty
are reliable.
4.2.5. Structural Equation Analysis
Analysis instrument that used in this study is Structural
Equation Model (SEM). The instrument was used to find
out whether Advertising Spending will give positive impact
to Perceived Quality, Brand Awareness, and Brand
Associations. Attitude Toward Advertising will give
positive impact to Perceived Quality, Brand Awareness,
and Brand Associations. Brand Awareness will give
positive impact on Perceived Quality, and Brand
Associations. Perceived Quality will give positive impact to
Brand Loyalty, and Brand Associations will give positive
impact to Brand Loyalty.

41
Table 4.10
Goodness Fit Result
Source: Processed Primary Data, Structural Equation Modeling (SEM), 2018
Refer to the normality test, it resulted that the value
of RMSEA < critical value = 0,08, GFI > 0,90, TLI and
CFI ≥ 0,90. Therefore, it represents that the structural
equation modeling in this study is fit.
Here is the result of Structural Equation Model (SEM):
Picture 4.1
Structural Model
Constructs χ² RMSEA GFI TLI CFI Status
Model 151,063 0,046 0,941 0,914 0,973 Good Fit

42
Table 4.11
Result of Structural Equation Modeling (SEM)
Source: Processed Primary Data, Structural Equation Modeling (SEM), 2018
According to the calculation of the analysis and
statistical program AMOS 24 it obtained a score of
probability between Advertising Spending toward
Perceived Quality, Advertising Spending toward Brand
Awareness, Advertising Spending toward Brand
Associations, Attitude Toward Advertising toward
Perceived Quality, Attitude Toward Advertising toward
Brand Awareness, Attitude Toward Advertising toward
Hypothesis Regression
Weight
Regression
Coefficient
Standard
Error
t-
value Probability Status
H1a AS-PQ 0,259 0,082 3,172 0,002 Significa
nt
H1b AS-BAW 0,380 0,079 4,835 0,000 Significa
nt
H1c AS-BAS 0,149 0,055 2,725 0,006 Significa
nt
H2a ATA-PQ 0,313 0,109 2,869 0,004 Significa
nt
H2b ATA-BAW 0,416 0,105 3,952 0,000 Significa
nt
H2c ATA-BAS 0,230 0,075 3,068 0,002 Significa
nt
H3 BAW-PQ 0,486 0,088 5,538 0,000 Significa
nt
H4 BAW-BAS 0,395 0,066 6,009 0,000 Significa
nt
H5 PQ-BL 0,485 0,082 5,880 0,000 Significa
nt
H6 BAS-BL 0,783 0,150 5,212 0,000 Significa
nt

43
Brand Associations, Brand Awareness toward Perceived
Quality, Brand Awareness toward Brand Associations,
Perceived Quality toward Brand Loyalty, and Brand
Associations toward Brand Loyalty is < Level of
Significant = 0,05, therefore all the variables have positive
impact.

44
4.3. Hypothesis Testing
T-test used to proven the correlation between Advertising
Spending toward Perceived Quality, Advertising Spending toward
Brand Awareness, Advertising Spending toward Brand
Associations, Attitude Toward Advertising toward Perceived
Quality, Attitude Toward Advertising toward Brand Awareness,
Attitude Toward Advertising toward Brand Associations, Brand
Awareness toward Perceived Quality, Brand Awareness toward
Brand Associations, Perceived Quality toward Brand Loyalty, and
Brand Associations toward Brand Loyalty. According to the
calculation of AMOS 24 statistical program, the hypothesis testing
was such as the following:
1. The test of variable Advertising Spending toward Perceived
Quality.
H1a : Consumers' perceptions of a brand's advertising spending
have a positive influence on perceived quality.
With the significant level (α) = 5% = 0,05 and the
calculation result of Structural Equation Modeling (SEM) it
obtained a value of = 3,172 with the probability of
0,002.
Refer to the result of processing data it obtained score of
probability = 0,000 < Level of Significant = 0,05,

45
therefore it conclude that there is a positive impact between
Advertising Spending and Perceived Quality.
2. The test of variable Advertising Spending toward Brand
Awareness.
H1b : Consumers' perceptions of a brand's advertising spending
have a positive influence on brand awareness.
With the significant level (α) = 5% = 0,05 and the
calculation result of Structural Equation Modeling (SEM) it
obtained a value of = 4,835 with the probability of
0,000.
Refer to the result of processing data it obtained score of
probability = 0,000 < Level of Significant = 0,05,
therefore it conclude that there is a positive impact between
Advertising Spending and Brand Awareness.
3. The test of variable Advertising Spending toward Brand
Associations.
H1c : Consumers' perceptions of a brand's advertising spending
have a positive influence on brand associations.
With the significant level (α) = 5% = 0,05 and the
calculation result of Structural Equation Modeling (SEM) it
obtained a value of = 2,725 with the probability of
0,006.
46
Refer to the result of processing data it obtained score of
probability = 0,000 < Level of Significant = 0,05,
therefore it conclude that there is a positive impact between
Advertising Spending and Brand Associations.
4. The test of variable Attitude Toward Advertising toward Brand
Perceived Quality.
H2a : Individuals' attitudes toward the advertisements
undertaken for a brand have a positive influence on perceived
quality.
With the significant level (α) = 5% = 0,05 and the
calculation result of Structural Equation Modeling (SEM) it
obtained a value of = 2,869 with the probability of
0,004.
Refer to the result of processing data it obtained score of
probability = 0,000 < Level of Significant = 0,05,
therefore it conclude that there is a positive impact between
Attitude Toward Advertising and Perceived Quality.
5. The test of variable Attitude Toward Advertising toward Brand
Awareness.
H2b : Individuals' attitudes toward the advertisements
undertaken for a brand have a positive influence on brand
awareness.

47
With the significant level (α) = 5% = 0,05 and the
calculation result of Structural Equation Modeling (SEM) it
obtained a value of = 3,952 with the probability of
0,000.
Refer to the result of processing data it obtained score of
probability = 0,000 < Level of Significant = 0,05,
therefore it conclude that there is a positive impact between
Attitude Toward Advertising and Brand Awareness.
6. The test of variable Attitude Toward Advertising toward Brand
Associations.
H2c : Individuals' attitudes toward the advertisements
undertaken for a brand have a positive influence on brand
associations.
With the significant level (α) = 5% = 0,05 and the
calculation result of Structural Equation Modeling (SEM) it
obtained a value of = 3,068 with the probability of
0,002.
Refer to the result of processing data it obtained score of
probability = 0,000 < Level of Significant = 0,05,
therefore it conclude that there is a positive impact between
Attitude Toward Advertising and Brand Associations.

48
7. The test of variable Brand Awareness toward Perceived
Quality
H3 : Brand awareness has a positive influence on perceived
quality.
With the significant level (α) = 5% = 0,05 and the
calculation result of Structural Equation Modeling (SEM) it
obtained a value of = 5,538 with the probability of
0,000.
Refer to the result of processing data it obtained score of
probability = 0,000 < Level of Significant = 0,05,
therefore it conclude that there is a positive impact between
Brand Awareness and Perceived Quality.
8. The test of variable Brand Awareness toward Brand
Associations.
H4 : Brand awareness has a positive influence on brand
associations.
With the significant level (α) = 5% = 0,05 and the
calculation result of Structural Equation Modeling (SEM) it
obtained a value of = 6,009 with the probability of
0,000.
Refer to the result of processing data it obtained score of
probability = 0,000 < Level of Significant = 0,05,

49
therefore it conclude that there is a positive impact between
Brand Awareness and Brand Associations.
9. The test of variable Perceived Quality toward Brand Loyalty.
H5 : Perceived quality has a positive influence on brand
loyalty.
With the significant level (α) = 5% = 0,05 and the
calculation result of Structural Equation Modeling (SEM) it
obtained a value of = 5,880 with the probability of
0,000.
Refer to the result of processing data it obtained score of
probability = 0,000 < Level of Significant = 0,05,
therefore it conclude that there is a positive impact between
Perceived Quality and Brand Loyalty.
10. The test of variable Brand Associations toward Brand Loyalty.
H6 : Brand associations have a positive influence on brand
loyalty.
With the significant level (α) = 5% = 0,05 and the
calculation result of Structural Equation Modeling (SEM) it
obtained a value of = 5,212 with the probability of
0,000.
Refer to the result of processing data it obtained score of
probability = 0,000 < Level of Significant = 0,05,

50
therefore it conclude that there is a positive impact between
Brand Associations and Brand Loyalty.
4.4. Discussion
The result of the analysis shows that the score of probability =
0,002 < Level of Significant = 0,05, therefore it can be conclude that there
is a positive impact on Advertising Spending and Perceived Quality. This
result means that how a certain brand spends on their advertising would
affect the consumer perception on the perceived quality of the product or
services that offer by the brand. In this study, means that Indomie already
spent a proper amount of capital in their advertising in order to improve
the perceived quality of their product. Align with the study that conducted
by (Buil, et al, 2013) advertising spending has slight impact on the
perceived quality even the enhancement was not significant. Consistent
with the previous study, consumers seem to be forming their quality
perceptions through the different mechanism for durable goods and non-
durable, consumers may acquire more objective information about
durables before purchase because of the greater commitment and financial
outlay that involve in the brand itself (Moorthy, and Zhao, 2000). It
reflects that how the brand invest on their advertisement seems to give
positive impact to consumer perceived quality of the product or services.
The result of the analysis shows that the score of probability =
0,000 < Level of Significant = 0,05, therefore it can be concluded that
there is a positive impact between Advertising Spending and Brand

51
Awareness. This result means that how certain brand spends on their
advertising would affect the consumer awareness of the brand. The
previous study also reveals that perceived advertising spending has a
positive impact on brand awareness, even though that advertising
investment seems do not necessarily enhance perceived quality and brand
associations (Buil, et al., 2013). For a brand that at the top of the market
should formulating a larger communications strategy in order to create
brand awareness (Human, et al., 2011) and to formulating a larger
communication strategy in order enhance the advertising awareness, surely
a brand need to invest more on their advertising.
The result of the analysis shows that the score of probability =
0,006 < Level of Significant = 0,05, therefore it can be concluded that
there is a positive impact on Advertising Spending and Brand
Associations. This result means that how certain brand spends on their
advertising would affect the consumer associations of the brand. Gwinner
and Eaton (1999) agree that the brand image is brand associations in the
memory of the consumers to concerning the brand, it might be the
similarity of them to the brand or how familiar some brand in the
perspective of the consumers. The writers suspect that brand associations
are a slightly above the awareness, which brand associations reflect that
the consumers already know well the brand and make them repeat to
utilize the product or services of the brand. In the study that conducted by
Buil, et al (2013) the investment on the advertising is not sufficient to

52
positively influence the brand associations, however, the research is
conducted in different product category also different demography with
this study. There is many factors that influence the behavior of the
consumers to act toward the advertisement (Keller, 2003).
The result of the analysis shows that the score of probability =
0,004 < Level of Significant = 0,05, therefore it can be concluded that
there is a positive impact between Attitude Toward Advertising and
Perceived Quality. This result means that how certain brand executes their
advertising would affect the consumer perception of the quality of the
product or services offers by the brand. Farris and Albion (1980) stated
that persuasive advertising affects the consumer preferences, tastes,
changes product attributes and differentiates the product or services
toward the competitors. This study also reveals that there is a correlation
between how the advertising delivers its messages regarding the consumer
perception of the quality, proven by the t-value of 2,725. Thus, it is
important for the business or entity to develop well their advertisement to
be able to represent its product quality.
The result of the analysis shows that the score of probability =
0,000 < Level of Significant = 0,05, therefore it can be concluded that
there is a positive impact between Attitude Toward Advertising and Brand
Awareness. This result means that how certain brand executes their
advertising would affect the consumer awareness of the brand. This also in
line with the statement of Farris and Albion (1980) in their study that "We

53
propose that persuasive advertising is more likely to encourage consumers
to ask their doctors about an advertised drug than reminder and
informational advertising", means that the customers likely to seek another
information about the product that they see in the advertisement, it is good
for the business that the customers already aware of their product or
services and probably will become their loyal customers. The correlation
between attitude toward advertising and brand awareness also gives most
significant impact compared with the other correlation to brand equity
dimension, with t-value of 3,952.
The result of the analysis shows that the score of probability =
0,002 < Level of Significant = 0,05, therefore it can be conclude that there
is a positive impact between Attitude Toward Advertising and Brand
Associations. This result means that how certain brand executes their
advertising would affect the consumer associations on the brand.
Consistently, how the brand communicates with the customers may be the
key factor to increase brand equity. Thus, as the study conducted,
individuals' attitudes toward advertisements give significant impact to
influencing perceived quality, brand awareness, and brand associations
(Buil, et al., 2013).
The result of the analysis shows that the score of probability =
0,000 < Level of Significant = 0,05, therefore it can be conclude that there
is a positive impact between Brand Awareness and Perceived Quality.
This result means that how the degree of consumers awareness of certain

54
brands will reflect their perspective on the quality of the product or
services that offers by the brand. Customers are occasionally unsure about
the quality of the product or services, and therefore perceive their
decisions as risky. According to the theory of information economics,
brand awareness may decrease buyer perceived risk because it can reduce
buyer information costs (Erdem and Swait 1998). More specifically, brand
awareness role as a significant signal of outstanding good reputation of
certain brand product or services (Hoyer and Brown 1990). Thus,
purchasing high-awareness brands is considered with reducing the risk for
the consumers.
The result of the analysis shows that the score of probability =
0,000 < Level of Significant = 0,05, therefore it can be conclude that there
is a positive impact between Brand Awareness and Brand Associations.
This result means that how the degree of consumers awareness of certain
brands will reflect their perspective of how the brands might be familiar
with them. It seems that consumers tend to buy a brand that associated
with high awareness levels such the brand that has strong brand equity. In
the other hand, brand awareness affects customer purchase process
through the strength of its associations to the brand (Keller 1993; Erdem
and Swait 1998). Improving brand awareness may increase the degree of
its brand association (Aaker 1996). Besides, brand awareness will
positively influence the perceived value of the brand. Consumers often

55
prefer to buy brands that they already familiar and well-known(Aaker
1996).
The result of the analysis shows that the score of probability =
0,000 < Level of Significant = 0,05, therefore it can be conclude that there
is a positive impact between Perceived Quality and Brand Loyalty. This
result means that how the product quality are developed will gives impact
to their loyalty of a certain brand. Perceived quality is considered to be one
of the contributing factors of brand loyalty. Khan, Zain-ul-Aabdean,
Nadeem and Rizwan (2016) investigated the impact of perceived quality
on brand loyalty and the correlation analysis results showed that perceived
quality is considered as highly correlated with brand loyalty and have a
and significant relationship. It means that an increase or decrease in
perceived quality will give an impact on brand loyalty (Khan, Zain-ul-
Aabdean, Nadeem & Rizwan 2016). Reich, McCleary, Tepanon, &
Weaver, (2006) investigated in their study that the product or service
quality affect brand loyalty. Their results showed that quick-service
restaurants in Nigeria need to be more concerned with product quality
especially in taste, freshness, and temperature, and focus on the overall
service quality to build brand loyalty. In line with the previous study, the
study that conducted in this research also reveals that the perceived quality
of Indomie has a highly significant impact on the brand loyalty,
considering the t-value of 5,880.

56
The result of the analysis shows that the score of probability =
0,000 < Level of Significant = 0,05, therefore it can be concluded that
there is a positive impact between Brand Associations and Brand Loyalty.
This result means that how familiar them with the brand will gives impact
to their loyalty of a certain brand. According to Atilgan, Aksoy, and
Akinci (2005) a strong brand association creates higher loyalty. In the
previous study conducted by Azadi, Esfahani and Mohammadpoori (2015)
investigated the correlations between the brand association and brand
loyalty in the customers of private clubs in Iran. The result has shown that
there was a significant relationship between brand association and brand
loyalty in the customers of the private club. Moreover, a study done by
Atilgan, Aksoy, and Akinci (2005) revealed that if customers have more
positive association with the brand, they would be loyal to the brand and
vice versa. It is in line with the study that conducted by the writer, that the
correlation between brand associations and brand loyalty were the most
significant correlation in compare to the other. Brand association which
lay on some aspects such the familiarity of the customers with the product
or services, the reflection of the customers on the brand itself, it will
highly influence them to become loyal to the brand.
4.4.1. Direct Effects of The Variable
The result of direct effect analysis of
advertising spending, attitude toward advertising,

57
perceived quality, brand awareness, brand
associations, and brand loyalty of Indomie instant
noodle among university students in Yogyakarta as
seen on the next page:

58
Table 4.12
Direct Effects of The Variable
Source: Processed Primary Data, 2018
According to the calculating above, it describes that
there is a direct effects of advertising spending toward
perceived quality in the amount of 0,204, effects of
advertising spending toward brand awareness in the amount
of 0,351, effects of advertising spending toward brand
associations in the amount of 0,186, effects of attitude
toward advertising toward perceived quality in the amount
of 0,225, effects of attitude toward advertising toward
brand awareness in the amount of 0,351, effects of attitude
toward advertising toward brand associations in the amount
of 0,262, effects of brand awareness toward perceived
quality in the amount of 0,415, effects of brand awareness
toward brand associations in the amount of 0,534, effects of
Variable Advertising
Spending
Attitude
Toward
Advertising
Perceived
Quality
Brand
Awareness
Brand
Associations
Perceived
Quality 0,204 0,225 - 0,415 -
Brand
Awareness 0,351 0,351 - - -
Brand
Association
s
0,186 0,262 - 0,534 -
Brand
Loyalty - - 0,394 - 0,403

59
perceived quality toward brand loyalty in the amount of
0,394, effects of brand associations toward brand loyalty in
the amount of 0,403.

60
4.4.2. Indirect Effects of The Variable
The result of indirect effect analysis of advertising
spending, attitude toward advertising, perceived quality,
brand awareness, brand associations, and brand loyalty of
Indomie instant noodle among university students in
Yogyakarta as seen on the table below:
Table 4.13
Indirect Effects of The Variable
Variable Advertising
Spending
Attitude
Toward
Advertising
Perceived
Quality
Brand
Awareness
Brand
Associations
Perceived
Quality 0,146 0,145 - -
Brand
Awareness - - - - -
Brand
Associations 0,187 0,187 - - -
Brand
Loyalty 0,288 0,327 - 0,379 -
Source: Processed Primary Data, 2018
According to the calculating above, it describes that
there is a indirect effects of advertising spending toward
perceived quality in the amount of 0,146, effects of
advertising spending toward brand awareness in the amount
of 0,187, effects of advertising spending toward brand
loyalty in the amount of 0,288, effects of attitude toward
advertising toward perceived quality in the amount of

61
0,145, effects of attitude toward advertising toward brand
associations in the amount of 0,187, effects of attitude
toward advertising toward brand loyalty in the amount of
0,327, effects of brand awareness toward brand loyalty in
the amount of 0,379.
4.4.3. Total Effects of The Variable
The result of total effect analysis of advertising
spending, attitude toward advertising, perceived quality,
brand awareness, brand associations, and brand loyalty of
Indomie instant noodle among university students in
Yogyakarta as seen on the table below:
Table 4.14
Total Effects of The Variable
Variable Advertising
Spending
Attitude
Toward
Advertising
Perceived
Quality
Brand
Awareness
Brand
Associations
Perceived
Quality 0,350 0,371 - 0,415 -
Brand
Awareness 0,351 0,351 - - -
Brand
Associations 0,374 0,449 - 0,534 -
Brand
Loyalty 0,288 0,327 0,394 0,379 0,403
Source: Processed Primary Data, 2018
According to the calculating above, it describes that
there is a total effect of advertising spending toward

62
perceived quality in the amount of 0,350, effects of
advertising spending toward brand awareness in the amount
of 0,351, effects of advertising spending toward brand
associations in the amount of 0,374, effects of advertising
spending toward brand loyalty in the amount of 0,288,
effects of attitude toward advertising toward perceived
quality in the amount of 0,371, effects of attitude toward
advertising toward brand awareness in the amount of 0,351,
effects of attitude toward advertising toward brand
associations in the amount of 0,449, effects of attitude
toward advertising toward brand loyalty in the amount of
0,327, effects of brand awareness toward perceived quality
in the amount of 0,415, effects of brand awareness toward
brand associations in the amount of 0,534, effects of brand
awareness toward brand loyalty in the amount of 0,379,
effects of perceived quality toward brand loyalty in the
amount of 0,394, effects of brand associations toward brand
loyalty in the amount of 0,403.

63
5. Conclusion and Suggestion
This conclusion and suggestion is part of the research about “Examining
The Role Of Advertising In Brand Equity Creation: Indomie Instant Noodle
Among Perspective of University Students In Yogyakarta”. In the research that
already conducted, it can be concluded that there is a positive impact among the
variables. Between Advertising Spending toward Perceived Quality, Advertising
Spending toward Brand Awareness, Advertising Spending toward Brand
Associations, Attitude Toward Advertising toward Perceived Quality, Attitude
Toward Advertising toward Brand Awareness, Attitude Toward Advertising
toward Brand Associations, Brand Awareness toward Perceived Quality, Brand
Awareness toward Brand Associations, Perceived Quality toward Brand Loyalty,
and Brand Associations toward Brand Loyalty.
5.1. Conclusion
Compared with the previous study and considering the background
of the research, the researcher sums up into several points. All the
hypothesis are supported, led the researcher to conclude that advertising
has proven to give positive impact to the creation of brand equity.
Besides, comparing the findings that already occur, brand awareness give
the most significant value that affected by advertising, in comparison of
other three variables in David Aaker Brand Equity Model which are
perceived quality, and brand associations. In contrast, brand association is
the most insignificance variables that affected by advertising. However,

64
the value is still considering as positive. This findings hopefully will give
insights to marketing enthusiast, particularly brands and advertising
practitioner to generate effective advertising for their product or services,
specifically in low involvement category.
5.2. Suggestion
Firstly, The result of brand equity dimension which are: perceived
quality, brand awareness, brand associations, and brand loyalty. From
those four variables, brand awareness is the most significant component
that affected by the amount of advertising spending on brands. Therefore,
it is important for the brand to focussing design advertisements that target
a massive awareness, even the perceived quality and also brand
associations are also should be considered. However, formulate
advertising that focuses on the awareness are the most effective.
Alongside with the advertising spending, the next variable which is the
attitude toward advertising also give most significant impact in the brand
awareness in the amount of 0,416 or 41,6% it means that creating
advertising that focuses on the awareness is most effective for the brand.
Secondly, The researcher believes that there will be some update
regarding brand equity in the future, this field was never settled and
always be dynamical. It is important if there will be another study
regarding this topic in the future, increasing the amount of the sample,
improving the indicators, also add the observed variable would increase
the future research accuracy and credibility.

65
References
Aaker, D. A. (1991), Managing brand equity: Capitalizing on the value of a
brand name. New York: Free Press.
Aaker, D. A. (1996), Building strong brands. New York: Free Press.
Agrawal, D. (1996), “Effect of brand loyalty on advertising and trade
promotions: A game theoretic analysis with empirical evidence”.
Marketing Science, 15(1): 86-106.
Allen, C.T., Machleit, K.A. and Kleine, S.S. (1992), “A comparison of
attitudes and emotions as predictors of behavior at diverse levels of
behavioral experience”, Journal of Consumer Research, Vol.18. No.4,
pp.493-504.
Anderson, J. C., & Gerbing, D. W. (1988), “Structural Equation Modeling in
Practice: A Review and Recommended Two-Step Approach”.
Psychological Bulletin, 103(3), 411-423.
Atilgan, E., Aksoy, S., & Akinci, S, (2005), “Determinants Of The Brand
Equity: A Verification Approach In The Beverage Industry In
Turkey”, Marketing Intelligence & Planning, 23(3), pp. 237-248.
Azadi, E.M. (2015), “Relationship Between Brand Association And Brand
Loyalty In The Fans Of Private Clubs In Iran”, Biomed Pharmacol
Journal, 8(2), pp. 1
Bahia,K., Nantel, J., Nantel,J.,and Hautes,Â.E. (2011), “A reliable and valid
measurement scale for the perceived service qualityof banks”.
International Journal of Bank Marketing, 18(2), 84 -91
Bauer, J., Schmitt, P., Morwitz,V. and Winer, R. (2005), “Managerial
decision making in customer management: adaptive, fast and frugal?”,
Journal of the Academy of Marketing Science, Vol.41No.4,pp. 436-
455.
Browne, M.W. & Cudeck, R. (1993), “Alternative ways of assessing model
fit. In Bollen, K.A. & Long, J.S.” [Eds.] Testing structural equation
models. Newbury Park, CA: Sage, 136–162.
Buil, I., Chernatony L.D. and Martinez, E. (2013), “Examining The Role Of
Advertising And Sales Promotions In Brand Equity Creation“,
Journal of Business Research, vol.66 pp.115-122.
Clark, C.R., Doraszelski, U. & Draganska, M. Quant Mark Econ (2009), 7:
207. https://doi.org/10.1007/s11129-009-9066-
Dreyer, A (2012), “The perceptions of tourists regarding the branding of
South African National Parks. Potchefstroom” : North West
University of Potchefstroom.
Durianto, Darmadi. (2001), “Strategi Menaklukan Pasar Melalui Riset
Ekuitas Dan Perilaku”. Jakarta : PT Gramedia Pustaka Utama.

66
Erdem, T., Swait, J. (1998), “Brand Equity as a Signaling Phenomenon”,
Journal of Consumer Psychology, 7(2), pp. 131–157.
Ferguson, J. (1982), “Comments On "The Impact Of Advertising On The
Price Of Consumer Products", Journal of Marketing, 46(1), pp.102-
105.
Ferdinand, A. (2002), “Structural Equation Modelling dalam Penelitian
Manajemen”. Semarang: FE UNDIP.
Fornell, C., and Larcker, D. F. (1981), “Evaluating Structural Equation
Models with Unobservable Variables and Measurement Error”,
Journal of Marketing Research, (18:1), pp. 39-50.
Ghozali, I. (2005), “Aplikasi Analisis Multivariate dengan SPSS” Semarang:
Badan Penerbit UNDIP.
Gwinner K., P. Eaton, J. (1999), “Building Brand Image Through Event
Sponsorship: The Role Of Image Transfer”, Journal of Advertising,
28(4): pp.47 - 57.
Ha, C. L. (1998), “The Theory Of Reasoned Action Applied To Brand
Loyalty”, Journal of Product and Brand Management, 7(1), pp. 51 –
61.
Hair Jr., J. F. et al. (1998), “Multivariate Data Analysis with Readings.
Englewood Cliffs, NJ: Prentice-Hall”.
Hamer, L. O. (2006), “A confirmation perspective on perceived service
quality”, Journal of Services Marketing, 20(4), pp. 219–232.
Holmes-Smith, P. (2001) “Introduction to Structural Equation Modeling
Using LISREL”. ACSPRI Winter Training Program, Perth.
Hornik, J. and Miniero, G. (2010), “A Comparative And Cumulative Meta-
Analysis Of Advertising Appeals”, Working Paper No 7/2010.
Hoyer, W.D., Brown, S.P. (1990), “Effects of Brand Awareness on Choice
for a Common, Repeat-Purchase Product”, Journal of Consumer
Research, 17(2), pp.141–148.
Hulland, J. (1999), “Use Of Partial Least Squares (PLS) In Strategic
Management Research: A Review Of Four Recent Studies”, Journal
of Strategic Management(20), pp. 195–204.
Human, G., Ascott-Evans, B. and Xabanisa, SS. (2011), “Advertising, Brand
Knowledge And Attitudinal Loyalty In Low-Income Markets: Can
Advertising Make A Difference At The ‘Bottom-Of-The-Pyramid’?”,
Management Dynamics, vol.20 no.2
Jacoby, Jacob., B. Kyner, David. (1973). “Brand Loyalty vs. Repeat
Purchasing Behavior”. “Journal of Marketing Research". 10. 1.
10.2307/3149402. Jakarta.
Jensen, J. M., and Hansen, T. (2006), “An Empirical Examination Of Brand
Loyalty”. Journal of Product and Brand Management, 15(7), 442–
449.
Jöreskog, K.G. & Sörbom, D. (1996), “LISREL 8 User's Reference Guide.
Chicago: Scientific Software”.

67
Keller, K.L. (1993), “Conceptualizing, Measuring, and Managing Customer-
Based Brand Equity”. Journal of Marketing, 57, 1-22.
http://dx.doi.org/10.2307/1252054
Keller, K.L. and Lehmann, D.R. (2003), “How Do Brands Create Value?”,
Marketing Management, Vol. 12 No. 3, pp. 27-31.
Khan, M. N., Zain-ul-Aabdean, M. S., Nadeem, B., & Rizwan, M. (2016),
“The Impact of Product and Service Quality on Brand Loyalty:
Evidence from Quick Service Restaurants”, American Journal of
Marketing Research, 2(3), pp. 84-94
Kim, H. and Lee, C. (2012), “Differential effects of fear-eliciting DTCA on
elaboration, perceived endorser credibility, and attitudes”,
International Journal of Pharmaceutical and Healthcare Marketing,
Vol. 6 No. 1, pp. 4-22.
Kim, J., Johnson, K.K. (2013), “The impact of moral emotions on cause-
related marketing campaigns: a cross-cultural examination”, Journal
of Business Ethics, Vol. 112 No. 1, pp.79-90.
Kotler, Philip. (1997), “Standing Room Only: Strategies for Marketing the
Performing Arts”. Boston: Harvard Business School Press.
Kotler., Keller. (2007), Manajemen Pemasaran, Edisi 12, Jilid 1, PT.Indeks,
Krishnamurthi, L., Raj, S. P. (1991). “An Empirical Analysis of the
Relationship between Brand Loyalty and Consumer Price Elasticity” ,
Marketing Science, 10, 172-183
Lavidge, R., & Steiner, G. (1961), “A Model for Predictive Measurements of
Advertising Effectiveness”, Journal of Marketing, 25(6), 59-62.
doi:10.2307/1248516
Limbu, Y., & Torres, I. M. (2009), “The Effects Of Involvement And Ad
Type On Attitudes Toward Direct-To-Consumer Advertising Of
Prescription Drugs”, Journal of Health and Human Services
Administration, 32(1), pp. 51-38.
Liu, F., Cheng, H. and Li, J. (2009), “Consumer responses to sex appeal
advertising: a cross-cultural study”, International Marketing Review,
Vol. 26 No. 4, pp. 501-20.
Loehlin, J.C. (1997), Latent Variable Models: An Introduction to Factor,
Path, and Structural Analysis. Hillsdale, NJ: Erlbaum.
Lubis, Mila. (2017, September 13). Belanja Iklan Tumbuh Perlahan. Retrived
from http://www.nielsen.com/id/en/press-room/2017/BELANJA-
IKLAN-TUMBUH-PERLAHAN.html
Mehta, A. (2000), “Advertising attitudes and advertising effectiveness”,
Journal of Advertising Research, Vol. 40 No. 3, pp. 67-72.
Moorthy, S. and Zhao, H. (2000), “Advertising Spending and Perceived
Quality”, Marketing Letters, vol.11 no.3, pp. 221
Oh, J., and Fiorito, S. S. (2002), “Korean women’s clothing brand loyalty”,
Journal of Fashion Marketing and Management, 6(3), 206-222.
Oliver, R. (1999). “Whence Consumer Loyalty?”, Journal of Marketing, 63,
pp. 33-44. doi:10.2307/1252099

68
Palumbo, F., Herbig, P., and Palumbo, F. (2000), “The multicultural context
of brand loyalty”, European Journal of Innovation Management, 3(3),
pp. 116 –125.
Parasuraman, A., Zeithaml, V.A. and Berry, L.L. (1985), "A conceptual
model of service quality and its implication", Journal of Marketing,
Vol. 49, Fall, pp. 41-50.
Reich, A. Z., McCleary, K. W., Tepanon, Y., & Weaver, P. A., (2006), “The
Impact Of Product And Service Quality On Brand Loyalty: An
Exploratory Investigation Of Quick-Service Restaurants”, Journal of
Foodservice Business Research, 8(3), pp.35-53.
Rosenhan, D.L., Karylowski, J., Salovey, P. and Hargis, K. (1981), “Emotion
and altruism”, in Rushton, J.P. and Sorrentino, R.M. (Eds), “Altruism
and Helping Behaviour”, Lawrence ErlbaumAssociates ,Hillsdale, NJ
, pp.233-248.
Rotfeld, H. J. (2007), “Is There A Strategy Behind Buying Advertising Time
And Space?”, Journal of Consumer Marketing, 24(3), pp.131–132.
Rüçhan Kayaman, Huseyin Arasli, (2007), "Customer based brand equity:
evidence from the hotel industry", Managing Service Quality: An
International Journal, Vol. 17 Issue: 1, pp.92-109
S.A. Aduloju, A.O. Odugbesan, S.A. Oke, (2009), "The effects of advertising
media on sales of insurance products: a developing‐country case", The
Journal of Risk Finance, Vol. 10 Issue: 3, pp.210-227.
Saleem, M., S. Yang, Grace., and Ramasubramanian, S. (2016), “Reliance on
Direct and Mediated Contact and Public Policies Supporting Outgroup
Harm”, Journal of Communication.
Schiffman, L. and Kanuk, L. (2010). Consumer behavior. 10th ed.
Englewood Cliffs, N.J.: Pearson education.
Sekaran, U. (2000), “Research Methods For Business: A Skill-Building
Approach”. New York: J. Wiley.
Shiv, B., Fedorikhin, A. (1999), “Heart And Mind In Conflict: The Interplay
Of Affect And Cognition In Consumer Decision Making”, Journal of
Consumer Research, Vol. 26 No. 3, pp.278-292.
Sigit, Soehardi. 2003. “Pengantar Metodologi Penelitian Sosial-Bisnis-
Manajemen Cetakan Ke-Tiga”,
Swanepoel, B., Slabbert, J. A., De, B. A., & Joubert, Y. (2012), “Introducing
labour relations management in South Africa: Adding value to
Africa”. Durban: LexisNexis.
Tabachnick, B.G., & Fidell, L. S. (2001), “Using Multivariate Statistics” (5th
ed.). Pearson.
Tai, S. H. C. (2007), “Correlates of successful brand advertising in China.
Asia Pacific” , Journal of Marketing and Logistics, 19(1), pp.40–56
Tho D. Nguyen., Nigel J. Barrett, Kenneth E. Miller, (2011), "Brand loyalty
in emerging markets", Marketing Intelligence & Planning, Vol. 29
Issue: 3, pp.222-232.

69
Usman, M., Ilyas, S., Hussain, M.F. and Qureshi, T.M. (2010), “General
attitude towards advertising: cultural influence in Pakistan”,
International Journal of Marketing Studies, Vol. 2 No. 2, pp.124-34.
Wang, C.L., Bristol, T., Mowen, J.C. and Chakraborty, G. (2000),
“Alternative modes of self-construal: dimensions of connectedness-
separateness and advertising appeals to the cultural and gender-
specific self”, Journal of Consumer Psychology, Vol. 9 No. 2, pp.
107-15.
Wind, Yoram (1982), “Product Policy: Concepts, Methods and Strategy” .
Reading: Addison
Winterich, K. and Barone, M. (2011), “Warm glow or cold, hard cash? Social
identify effects on consumers choice for donation versus discount
promotion”. Journal of Marketing Research, Vol. 48 No.5, pp.855-
868
Yang, Z., Bi, Z. and Zhou, N. (2005). “The double jeopardy phenomenon and
the mediating effect of brand penetration between advertising and
brand loyalty”. Journal of Advertising Research , 45(2): pp.211-221
Zeithaml, V. A. (1988), “Consumer perceptions of price, quality, and value:
A means-end model synthesis of evidence”, Journal of Marketing,
52, pp.2-22.

70
Appendix

71
AS
1
AS
2
AS
3
AT
A1
AT
A2
PQ
1
PQ
2
PQ
3
PQ
4
BA
W1
BA
W2
BA
S1
BA
S2
BA
S3
BL
1
BL
2
5 4 5 4 4 6 3 5 6 6 6 6 5 5 4 5
4 5 4 5 4 4 5 4 5 4 5 4 4 5 4 4
4 5 5 3 4 4 4 5 4 6 6 5 5 5 5 5
5 4 5 5 5 5 5 5 5 5 5 4 5 5 4 4
5 5 5 5 4 5 5 5 5 5 6 5 6 5 5 5
5 6 6 5 5 5 5 5 6 4 5 6 5 4 4 4
4 4 4 5 4 5 4 5 4 5 4 6 4 5 5 4
6 5 4 4 4 5 3 5 5 6 6 6 6 6 5 6
3 5 4 3 2 5 5 5 3 4 4 5 5 5 3 3
5 4 5 4 4 5 5 5 5 4 4 5 4 5 5 4
4 4 4 5 4 4 4 5 5 4 4 6 5 5 5 5
4 3 3 4 4 4 5 5 4 4 5 6 6 6 6 6
5 4 5 4 3 4 3 4 3 3 4 3 4 3 3 3
4 4 4 5 4 5 4 4 4 6 5 5 6 5 4 6
5 4 4 4 4 5 5 5 5 5 5 5 5 5 5 5
5 6 5 6 6 6 6 6 6 6 6 6 6 6 6 6
5 5 4 6 6 6 6 6 6 6 6 5 5 5 6 6
6 6 5 5 4 6 6 6 6 6 6 6 6 6 6 6
4 4 4 4 4 4 3 3 5 6 5 3 3 3 3 4
4 5 5 4 4 6 6 6 6 6 6 4 5 6 4 5
5 5 6 5 5 6 6 6 5 6 6 6 6 5 4 5
6 5 4 4 5 6 6 6 5 6 6 6 6 6 5 4
6 5 5 5 5 6 6 6 5 6 6 5 4 5 5 5
6 6 5 4 4 4 6 6 4 6 4 5 6 4 4 5
4 4 5 5 4 5 5 5 5 6 6 5 5 4 6 6
6 6 5 5 5 5 5 5 5 6 6 6 5 5 4 5
6 4 4 4 4 4 4 4 4 4 4 4 4 3 5 4
4 3 3 4 4 4 3 4 3 3 4 4 3 4 4 4
5 5 5 5 4 4 5 6 5 6 4 6 5 4 6 6
5 5 6 5 5 5 6 5 5 6 6 5 5 4 4 5
6 3 6 5 4 4 4 4 5 6 6 4 4 4 4 4
5 5 5 3 5 5 5 5 5 6 6 5 6 6 4 3
5 4 5 4 5 6 6 6 5 6 6 5 6 4 5 3
4 4 4 4 4 6 6 6 5 6 6 6 6 6 6 6
4 5 5 5 5 5 5 5 5 6 6 5 5 5 5 4
4 5 5 4 5 3 3 3 3 5 6 5 5 2 3 3
6 4 6 6 6 6 6 6 6 6 6 6 6 6 5 6
4 5 4 5 4 4 5 5 5 6 5 5 5 4 5 6
4 6 5 6 4 6 6 6 6 4 6 5 6 6 4 4
4 4 2 5 5 3 4 4 3 2 3 4 4 4 3 2

72
3 5 3 4 5 4 5 2 1 4 5 6 5 4 3 3
6 5 4 6 5 6 5 4 4 6 6 5 6 5 4 6
6 4 5 3 2 6 6 6 6 6 6 6 6 6 5 4
4 4 4 3 3 5 5 5 3 5 5 5 5 3 4 3
5 5 6 3 3 5 6 6 4 6 6 2 6 5 5 2
6 5 5 5 5 6 6 6 6 6 6 6 6 6 5 3
5 6 6 5 5 6 5 6 5 6 6 6 6 5 4 4
5 6 6 4 6 4 5 4 5 6 5 6 5 5 5 4
5 4 5 4 4 5 5 4 4 5 5 4 5 4 5 3
4 2 3 3 3 3 3 4 4 3 4 4 3 3 3 4
5 5 5 4 3 4 4 4 4 5 4 6 6 4 4 6
5 5 4 4 2 5 5 4 5 6 6 5 6 6 5 4
3 6 3 2 3 3 4 4 4 4 6 5 6 1 2 2
6 6 6 6 6 6 6 6 6 6 6 6 6 6 6 5
5 5 5 4 4 4 5 4 4 6 5 5 6 5 3 5
5 4 5 6 5 4 4 4 5 6 5 5 6 5 3 4
5 5 5 5 4 5 5 5 5 5 5 5 5 5 5 5
6 3 4 5 3 2 2 3 1 5 5 6 4 4 4 3
5 5 5 4 4 5 6 5 5 6 6 6 6 6 6 4
5 3 5 4 3 3 3 3 3 2 3 5 4 4 2 6
4 3 4 4 4 4 4 4 3 5 5 5 5 4 5 5
5 5 5 5 5 3 5 3 2 6 5 5 6 5 3 3
6 6 6 5 6 6 6 6 6 6 6 6 6 6 6 6
5 6 5 5 6 6 6 6 5 6 6 5 4 3 4 4
5 4 4 4 3 5 5 5 4 6 6 5 6 4 5 6
4 6 4 5 4 5 5 5 2 6 6 5 5 5 4 4
5 5 4 4 5 4 4 4 5 5 5 4 4 4 5 4
4 5 4 5 4 5 5 4 4 5 5 5 4 3 2 3
6 5 5 5 4 4 5 5 2 5 4 5 5 5 2 1
5 5 6 6 3 5 5 6 4 4 5 5 6 4 5 2
5 5 5 4 4 5 5 5 5 6 6 5 5 4 4 4
5 6 5 6 6 5 6 5 5 6 6 6 6 6 5 4
5 5 5 4 3 5 5 5 3 5 5 5 5 5 5 5
4 4 4 4 3 3 3 4 3 2 3 3 3 3 3 2
4 5 4 4 5 4 4 4 4 4 4 4 4 4 4 4
5 5 5 5 5 5 5 5 5 5 4 5 5 5 4 4
6 6 5 5 3 4 4 4 4 4 4 6 6 6 6 6
5 4 6 6 4 5 6 6 6 6 6 6 6 6 6 4
5 6 5 4 1 5 5 6 5 5 5 5 4 5 5 6
4 5 4 4 4 5 4 4 4 5 4 5 5 5 4 3
4 4 4 4 3 4 5 6 6 6 5 5 5 5 3 4
4 4 4 5 4 5 5 5 5 4 5 4 4 3 4 4
5 4 4 5 6 1 3 2 2 6 5 3 5 4 1 4
5 4 4 4 4 4 4 4 4 5 4 5 4 4 4 4
4 6 5 4 5 6 5 6 5 6 6 4 5 6 4 5
6 4 4 4 4 4 6 4 4 4 4 4 4 4 4 4
4 4 4 4 5 5 5 6 4 5 5 6 5 6 3 2
6 5 4 5 2 6 6 4 3 6 6 6 6 5 4 1
73
5 5 5 5 6 5 5 5 5 6 6 5 6 5 5 4
5 5 5 4 4 4 4 4 4 5 5 5 4 4 3 4
6 3 6 5 4 5 6 4 3 6 6 5 6 4 5 1
5 5 5 5 5 5 5 5 5 4 4 5 5 3 3 4
5 5 5 5 5 5 4 4 4 6 6 5 5 6 5 5
5 5 5 5 5 4 5 5 4 6 6 5 5 5 4 4
6 5 5 4 5 5 5 5 5 5 6 5 5 4 4 4
5 5 5 5 5 6 5 6 5 6 6 6 6 5 6 6
4 5 5 4 4 5 5 4 5 4 6 5 5 5 5 3
4 6 5 4 4 6 6 5 3 6 6 5 6 4 6 5
6 6 6 4 5 6 6 6 2 6 6 6 6 6 5 2
6 5 5 6 6 5 5 5 5 6 6 6 6 6 6 3
6 6 6 3 1 1 3 4 2 3 4 6 5 4 2 1
6 5 5 5 4 4 6 5 5 6 4 6 5 5 4 4
4 4 4 4 4 5 6 5 4 5 4 5 4 4 5 3
6 6 6 6 6 5 6 6 5 6 5 6 5 6 6 6
4 6 4 6 6 6 6 6 5 6 6 4 6 6 6 1
5 5 5 4 3 4 5 5 5 5 5 4 5 4 3 2
4 3 4 4 4 3 4 3 3 3 4 4 3 3 3 3
5 5 5 5 3 5 5 5 3 6 4 5 5 5 3 2
4 4 4 5 5 4 4 4 5 4 4 4 5 5 4 4
3 3 3 3 3 3 4 4 4 4 4 4 3 3 3 3
4 4 4 4 4 5 5 5 5 4 4 5 5 4 4 4
6 6 6 5 5 4 5 5 5 6 6 5 5 4 5 6
4 4 4 4 5 5 5 4 4 5 4 4 5 4 4 4
4 5 4 4 3 5 5 5 5 3 5 5 4 3 3 2
6 6 6 5 5 4 4 5 5 6 6 5 6 5 5 5
6 6 6 4 4 4 4 4 4 4 6 6 5 4 1 4
6 6 6 6 4 6 6 6 6 6 6 6 6 6 6 4
4 5 4 5 5 5 5 5 4 6 5 5 4 4 2 3
5 5 6 6 5 5 4 5 5 5 5 5 5 5 5 6
5 5 6 5 5 5 5 5 5 6 6 5 6 5 4 5
5 6 5 5 6 6 5 6 5 5 4 5 6 6 3 5
4 4 4 4 4 4 4 4 4 5 5 6 5 3 2 3
4 5 4 5 5 5 4 6 4 6 6 5 5 4 6 5
4 5 6 6 5 6 5 6 6 6 6 6 6 5 5 6
4 4 5 4 5 5 6 5 5 4 4 5 4 4 4 4
1 6 1 6 1 1 1 1 1 3 4 6 1 1 1 1
5 5 4 4 6 5 4 4 3 6 6 5 5 3 3 2
4 3 5 4 4 5 4 4 4 6 5 5 4 4 3 3
5 5 5 6 5 6 6 6 5 6 6 6 6 5 5 3
3 2 2 6 5 3 3 3 3 5 5 3 3 3 2 2
4 4 4 6 6 5 5 5 5 4 5 4 4 5 4 3
5 6 4 4 5 5 5 5 6 6 5 4 4 4 5 5
6 5 6 5 4 6 6 5 5 6 6 6 5 6 5 6
6 6 6 6 6 6 6 6 6 6 6 6 6 6 6 6
5 6 4 4 4 5 6 6 4 6 6 6 5 4 3 2
5 5 5 4 5 5 4 4 4 5 4 5 4 3 4 4

74
6 6 5 5 6 6 5 5 5 6 6 6 6 6 6 6
3 3 4 5 3 4 5 4 4 4 5 4 3 3 3 4
6 4 6 6 4 6 6 6 2 6 6 6 6 6 6 5
5 5 5 4 4 5 5 5 5 5 5 5 5 5 4 2
5 6 5 5 5 6 6 6 6 6 6 6 6 6 6 6
5 4 5 4 5 5 5 5 6 6 4 5 3 3 3 2
4 5 4 4 4 4 4 5 4 4 4 5 4 4 5 4
4 4 4 5 5 4 5 5 5 5 5 5 5 5 5 6
6 6 6 5 4 5 6 6 5 6 6 6 6 6 6 3
4 4 5 4 5 4 4 4 4 5 4 5 5 4 4 4
4 4 5 4 4 5 5 5 5 6 5 6 5 5 4 4
4 5 5 5 3 4 5 5 5 5 6 6 6 6 6 2
6 4 5 6 6 6 6 6 6 6 6 6 6 6 5 2
5 5 4 3 5 3 4 3 3 4 4 4 4 3 4 4
5 5 5 5 4 5 6 6 5 6 6 4 5 4 5 4
5 6 5 5 5 6 6 6 5 6 6 6 6 6 6 2
5 5 5 4 4 5 5 5 5 6 6 5 5 4 4 4
4 5 5 4 4 5 5 5 5 6 6 5 6 4 4 4
5 5 5 5 5 5 5 5 5 5 5 6 6 4 5 4
4 3 4 5 4 3 4 3 2 6 3 5 5 2 1 6
5 5 5 5 5 6 5 5 5 6 6 6 6 4 5 3
4 4 4 5 5 4 4 4 4 6 5 4 5 4 4 5
5 5 5 5 4 4 5 4 4 5 5 4 4 4 3 2
3 4 5 4 5 1 1 1 1 4 4 4 5 5 1 1
4 4 4 5 4 4 4 5 5 6 5 4 4 4 3 4
6 6 5 5 5 5 6 5 5 5 5 5 5 4 5 3
5 5 5 5 5 5 5 5 5 5 5 5 5 4 4 3
4 4 5 4 4 5 6 5 6 6 5 5 5 4 4 4
6 5 6 6 5 6 5 6 5 6 5 6 5 5 6 6
5 5 5 5 5 5 6 6 4 5 5 4 3 5 6 1
6 5 5 5 4 5 5 5 4 5 6 5 4 4 5 4
6 6 4 3 5 6 4 6 6 6 6 5 5 6 3 2
5 5 6 6 6 6 6 6 5 6 6 6 6 6 6 6
5 5 5 5 5 4 5 5 5 6 6 5 5 5 4 4
5 5 6 4 5 4 5 5 5 4 5 5 5 5 5 4
4 5 5 4 4 5 5 5 5 6 5 6 4 5 5 6
3 5 4 5 5 5 5 5 5 5 5 5 5 5 5 5
4 5 4 5 4 4 4 5 5 4 5 4 4 4 3 4
4 5 4 6 3 6 6 6 6 6 6 6 6 6 6 6
4 4 5 5 5 6 5 5 5 6 6 6 6 6 4 4
5 5 6 6 6 6 6 6 6 6 6 6 5 6 6 6
4 5 3 5 5 5 5 5 5 5 5 5 5 5 4 2
5 6 4 4 4 5 5 5 4 4 5 5 3 5 4 2
4 4 4 4 5 4 4 4 4 5 4 4 3 4 4 4
5 4 4 4 3 4 5 5 4 6 6 6 5 4 4 3
4 4 5 5 5 6 6 6 4 5 6 6 6 4 5 3
6 6 6 6 6 5 5 5 3 5 6 4 5 5 4 5
5 2 5 4 5 5 5 5 5 6 6 5 5 6 6 6

75
3 3 4 3 3 5 5 4 3 4 3 3 4 3 4 3
6 6 6 6 5 5 5 5 5 6 6 6 6 6 4 5
5 4 3 6 6 3 4 5 5 6 4 2 6 6 4 5
4 4 4 5 5 5 5 5 5 5 5 5 4 5 4 3
4 6 4 6 5 4 4 4 3 5 6 5 6 6 5 5
4 4 5 3 5 6 6 6 5 6 6 6 6 5 5 6
5 5 5 5 5 2 2 2 4 5 6 5 5 6 3 1
5 4 3 5 4 4 4 4 5 5 5 5 6 4 3 4
6 6 6 5 5 5 5 5 5 6 6 5 5 5 3 3
5 5 5 5 5 5 5 5 5 5 5 5 5 5 5 4
4 4 3 3 2 4 4 4 4 5 5 5 5 4 4 5
6 4 4 6 4 6 6 6 6 6 6 6 6 4 5 5
5 5 5 6 6 5 5 5 3 6 6 5 5 5 6 6
6 6 6 4 4 6 5 5 5 6 6 6 6 4 6 2
4 5 4 6 6 5 4 5 5 6 6 5 5 5 5 3
4 5 5 4 4 4 4 4 4 4 4 4 4 4 4 4
4 4 4 3 5 4 4 4 3 4 4 5 4 4 3 4
5 6 6 6 2 6 6 6 6 6 6 6 6 6 6 6
3 3 3 5 4 4 5 5 5 5 5 4 5 3 1 1
4 5 4 6 5 5 5 4 5 5 5 5 6 4 3 3
4 5 4 6 5 3 5 5 5 5 5 6 6 3 4 5
5 5 5 4 4 4 5 4 3 6 5 5 6 4 5 3
5 4 6 5 5 4 5 5 5 4 4 6 5 5 3 3
5 5 4 6 6 6 6 6 5 6 6 6 6 5 6 6
4 5 5 4 5 4 4 4 4 5 5 4 5 4 4 4
4 3 4 4 5 4 4 4 4 5 5 4 4 3 2 2
4 2 4 4 4 5 5 5 5 6 5 5 5 3 5 5
4 3 4 3 3 3 3 3 1 6 4 5 5 3 3 2
3 3 4 4 4 6 6 6 6 5 5 5 4 3 3 3
3 5 3 3 2 3 2 3 4 6 6 5 6 3 5 5
4 4 3 3 4 4 4 4 4 6 6 5 6 3 6 6
4 3 3 6 5 6 6 5 5 5 5 5 5 5 3 5
3 3 3 6 6 6 6 6 6 6 6 6 6 6 4 3
5 6 5 5 4 6 6 5 5 6 6 4 6 6 4 1
1 1 1 4 4 1 1 1 1 1 1 1 1 4 3 1
6 6 5 6 4 5 6 4 6 6 4 4 4 6 5 4
4 5 5 5 6 6 6 6 6 6 6 3 6 4 6 6
5 5 5 6 6 6 6 6 6 6 6 6 6 6 6 6
3 2 3 5 6 4 4 4 4 5 5 5 4 4 4 4
5 5 5 5 6 6 6 6 3 6 6 5 5 4 5 4
4 3 3 5 5 4 4 3 4 4 4 4 5 5 4 3
4 4 4 5 5 4 5 4 3 6 5 4 4 5 3 3
4 5 4 4 4 5 5 5 5 6 6 6 6 5 4 3
4 4 3 4 4 3 5 3 3 6 6 6 3 5 3 6
2 6 2 6 6 6 6 6 6 3 3 6 6 6 6 6
5 2 4 4 4 5 5 5 5 6 6 5 5 4 4 3
4 4 4 5 5 4 5 5 5 5 5 5 5 4 3 2
5 5 5 3 3 4 4 5 5 3 3 5 1 3 1 1

76
3 4 2 4 4 4 4 5 4 6 6 4 6 6 2 3
4 3 3 3 3 6 6 6 6 4 3 5 5 5 5 3
5 5 5 5 3 4 6 4 4 4 2 5 5 4 4 3
5 6 3 3 3 2 2 1 1 5 5 1 1 1 1 1
5 2 4 5 4 6 6 6 6 6 6 4 6 4 5 5
5 4 4 3 4 4 4 4 5 5 5 4 5 2 3 2
4 2 3 5 5 4 5 4 4 5 5 4 4 4 2 6
5 5 5 4 3 4 5 5 5 4 4 5 3 5 3 3
6 6 6 4 4 6 5 5 5 6 6 6 6 5 5 4
3 5 2 5 3 3 3 4 5 6 6 6 6 6 6 5
3 3 3 3 3 3 3 3 3 3 3 2 2 2 3 2
4 4 5 4 1 6 5 6 6 6 6 1 6 3 6 6
5 4 5 5 4 5 5 5 5 6 6 6 6 5 5 5
5 5 5 4 4 6 5 6 4 6 6 4 5 3 5 2
5 5 5 5 5 5 6 6 6 6 6 6 6 5 6 4
3 4 3 3 3 4 4 4 4 4 5 5 5 4 4 5
5 5 5 5 5 6 6 6 6 6 6 6 6 6 6 6
4 5 5 4 3 4 4 5 4 4 5 4 5 4 3 4
5 5 5 5 6 4 6 5 5 6 6 5 6 6 6 2
4 4 4 4 5 6 4 5 5 6 6 4 6 5 4 5
5 5 5 4 5 6 6 6 6 6 6 6 6 6 6 6
5 6 5 5 5 6 4 5 5 5 5 5 4 6 4 4
3 4 2 5 5 5 5 5 5 5 5 5 5 4 4 4
5 6 4 4 4 3 6 4 5 6 6 3 5 3 5 3
5 4 5 5 5 5 5 5 4 6 6 4 5 4 4 6
4 3 4 3 5 4 4 4 5 5 5 5 5 5 5 5
4 5 4 6 5 5 5 5 5 6 6 6 6 3 6 6
6 4 5 6 4 5 6 6 5 6 6 5 5 5 6 6
4 4 5 5 3 6 6 6 5 6 6 5 6 5 5 6
5 5 5 5 5 5 5 5 5 5 5 5 5 5 1 1
6 6 6 5 5 5 5 5 5 5 5 5 5 5 5 5
3 4 4 6 3 4 6 4 1 3 6 3 4 4 4 4
4 5 4 5 6 5 4 5 5 6 6 5 5 5 3 3
4 3 4 3 5 3 5 4 4 6 6 4 5 2 2 3
4 4 4 4 4 5 5 5 5 5 5 5 5 5 3 4
3 4 4 2 4 3 4 4 4 4 4 4 4 4 4 4
4 6 6 6 5 6 6 6 5 6 6 6 6 6 6 6
3 3 2 5 5 6 6 6 6 5 5 6 6 5 5 5
5 5 6 6 6 6 6 6 6 6 6 6 6 6 6 6
4 4 5 5 4 4 4 5 3 5 5 6 5 4 4 3
4 4 4 6 6 6 6 6 6 6 6 6 6 6 6 6
5 4 5 4 5 6 5 5 6 4 5 6 5 6 6 5
5 5 5 5 5 4 5 5 6 5 5 5 6 5 4 5
3 4 3 4 4 5 5 5 5 5 5 5 5 5 5 3
6 5 6 5 4 6 6 6 5 6 6 6 6 5 5 5
5 5 5 6 6 6 2 4 4 6 6 6 4 5 3 3
3 3 3 6 6 4 4 4 4 6 6 6 6 5 6 5
4 4 3 4 4 6 6 6 4 6 6 6 6 6 6 6

77
5 2 5 5 5 5 5 5 5 6 6 6 6 4 5 6
4 3 4 3 3 3 4 3 3 4 4 3 3 4 3 3
5 2 4 4 2 5 4 5 5 6 6 5 6 5 2 2
6 6 6 6 6 5 6 6 6 5 6 6 3 4 3 1
5 5 5 5 4 5 5 5 5 6 6 6 6 5 3 3
5 5 5 5 4 5 5 5 5 6 6 6 6 5 3 3
4 5 4 5 6 3 3 4 4 5 6 5 6 4 5 6
5 5 4 4 4 6 6 5 4 5 5 5 5 5 4 5
3 3 2 6 5 5 5 5 5 6 6 2 3 3 5 5
6 6 6 6 6 4 5 5 5 6 6 6 5 6 3 4
4 5 4 4 5 5 5 5 5 6 6 6 4 4 4 3
6 6 6 6 6 6 6 6 6 6 6 5 5 6 5 5
5 5 4 5 6 6 3 6 5 6 5 4 5 4 5 6
4 4 4 4 3 4 5 5 5 4 4 5 4 4 4 4
4 5 5 4 6 6 5 6 4 6 6 5 6 6 6 6
5 6 5 5 5 4 5 4 4 6 6 5 5 5 4 3
5 4 4 4 5 6 6 6 5 6 5 4 4 4 3 3
6 6 6 5 5 6 5 5 5 6 6 6 6 5 5 3
5 5 5 5 4 5 5 5 4 4 6 5 5 4 5 4
5 4 4 5 5 5 3 4 3 5 5 5 4 5 4 3

78
QUESTIONNAIRE
Profil demografi
Mohon jawab pertanyaan dibawah ini dengan memberi tanda centang atau silang
pada jawaban yang anda anggap sesuai
1. Apa jenis kelamin Bapak/ Ibu/ Saudara/ Saudari?
a) Pria b) Wanita
2. Berapakah usia Bapak/ Ibu/ Saudara/ Saudari?
a) <20 tahun b) 20-35 tahun
c) 36-50 tahun d) >50 tahun
3. Apa pekerjaan Bapak/ Ibu/ Saudara/ Saudari?
a) Pelajar/ Mahasiswa b) Wirausaha
c) Pegawai swasta d) Pegawai Negeri
e) lainnya, sebutkan ..........
4. Pendidikan terakhir Bapak/ Ibu/ Suadara/ Saudari?
a) SMP b) SMA
c) Diploma d) Sarjana
e) Pasca Sarjana/ Sederajat
5. Berapa pendapatan perbulan (Uang saku bila pelajaran/Mehasiswa)
Bapak/ Ibu/ Saudara/ Saudari?
a) Sampai dengan 1,000,000 b) 1,000,000 – 3,000,000
c) 3,000,000 – 5,000,000 d) lebih dari 5,000,000
6. Apakah Bapak/ Ibu/ Saudara/ Saudari pernah melihat iklan dari merek
Indomie?
a) Pernah b) Belum pernah
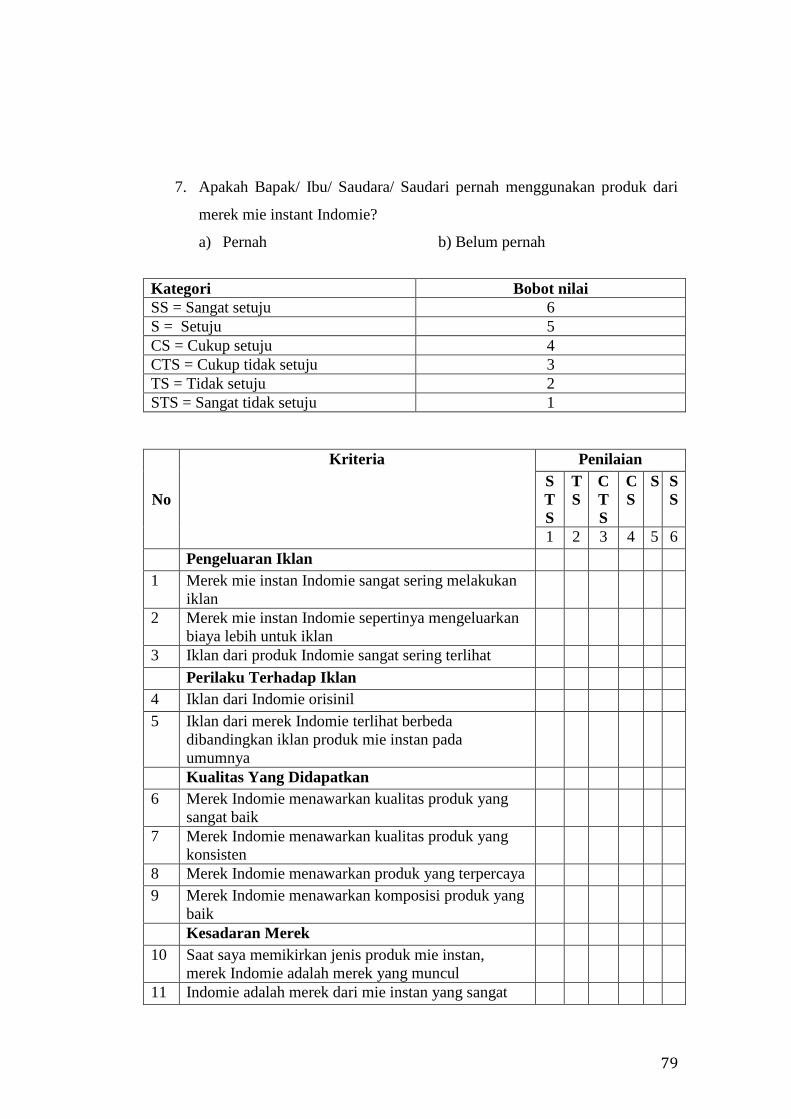
79
7. Apakah Bapak/ Ibu/ Saudara/ Saudari pernah menggunakan produk dari
merek mie instant Indomie?
a) Pernah b) Belum pernah
Kategori Bobot nilai
SS = Sangat setuju 6
S = Setuju 5
CS = Cukup setuju 4
CTS = Cukup tidak setuju 3
TS = Tidak setuju 2
STS = Sangat tidak setuju 1
No
Kriteria Penilaian
S
T
S
T
S
C
T
S
C
S
S S
S
1 2 3 4 5 6
Pengeluaran Iklan
1 Merek mie instan Indomie sangat sering melakukan
iklan
2 Merek mie instan Indomie sepertinya mengeluarkan
biaya lebih untuk iklan
3 Iklan dari produk Indomie sangat sering terlihat
Perilaku Terhadap Iklan
4 Iklan dari Indomie orisinil
5 Iklan dari merek Indomie terlihat berbeda
dibandingkan iklan produk mie instan pada
umumnya
Kualitas Yang Didapatkan
6 Merek Indomie menawarkan kualitas produk yang
sangat baik
7 Merek Indomie menawarkan kualitas produk yang
konsisten
8 Merek Indomie menawarkan produk yang terpercaya
9 Merek Indomie menawarkan komposisi produk yang
baik
Kesadaran Merek
10 Saat saya memikirkan jenis produk mie instan,
merek Indomie adalah merek yang muncul
11 Indomie adalah merek dari mie instan yang sangat

80
akrab dengan saya
Asosiasi Merek
12 Merek Indomie sepadan dengan harganya
13 Diantara produk mie instan, saya mengakui Indomie
adalah pembelian yang tepat
14 Merek Indomie memiliki sebuah kepribadian
Kesetiaan Merek
15 Saya menganggap diri saya setia terhadap merek
Indomie
16 Saya tidak membeli produk mie instan lain jika
merek Indomie tersedia di toko

81
Correlations
AS1 AS2 AS3 SkorTotal_AS
AS1 Pearson Correlation 1 .457* .322 .751
**
Sig. (2-tailed) .011 .083 .000
N 30 30 30 30
AS2 Pearson Correlation .457* 1 .583
** .857
**
Sig. (2-tailed) .011 .001 .000
N 30 30 30 30
AS3 Pearson Correlation .322 .583** 1 .784
**
Sig. (2-tailed) .083 .001 .000
N 30 30 30 30
SkorTotal_AS Pearson Correlation .751** .857
** .784
** 1
Sig. (2-tailed) .000 .000 .000
N 30 30 30 30
*. Correlation is significant at the 0.05 level (2-tailed).
**. Correlation is significant at the 0.01 level (2-tailed).

82
Correlations
ATA1 ATA2 SkorTotal_ATA
ATA1 Pearson Correlation 1 .706** .918
**
Sig. (2-tailed) .000 .000
N 30 30 30
ATA2 Pearson Correlation .706** 1 .929
**
Sig. (2-tailed) .000 .000
N 30 30 30
SkorTotal_ATA Pearson Correlation .918** .929
** 1
Sig. (2-tailed) .000 .000
N 30 30 30
**. Correlation is significant at the 0.01 level (2-tailed).

83
Correlations
PQ1 PQ2 PQ3 PQ4 SkorTotal_PQ
PQ1 Pearson Correlation 1 .520** .623
** .624
** .822
**
Sig. (2-tailed) .003 .000 .000 .000
N 30 30 30 30 30
PQ2 Pearson Correlation .520** 1 .760
** .431
* .846
**
Sig. (2-tailed) .003 .000 .017 .000
N 30 30 30 30 30
PQ3 Pearson Correlation .623** .760
** 1 .466
** .862
**
Sig. (2-tailed) .000 .000 .009 .000
N 30 30 30 30 30
PQ4 Pearson Correlation .624** .431
* .466
** 1 .760
**
Sig. (2-tailed) .000 .017 .009 .000
N 30 30 30 30 30
SkorTotal_PQ Pearson Correlation .822** .846
** .862
** .760
** 1
Sig. (2-tailed) .000 .000 .000 .000
N 30 30 30 30 30
**. Correlation is significant at the 0.01 level (2-tailed).
*. Correlation is significant at the 0.05 level (2-tailed).

84
Correlations
BAW1 BAW2 SkorTotal_BAW
BAW1 Pearson Correlation 1 .689** .932
**
Sig. (2-tailed) .000 .000
N 30 30 30
BAW2 Pearson Correlation .689** 1 .904
**
Sig. (2-tailed) .000 .000
N 30 30 30
SkorTotal_BAW Pearson Correlation .932** .904
** 1
Sig. (2-tailed) .000 .000
N 30 30 30
**. Correlation is significant at the 0.01 level (2-tailed).

85
Correlations
BAS1 BAS2 BAS3 SkorTotal_BAS
BAS1 Pearson Correlation 1 .634** .573
** .862
**
Sig. (2-tailed) .000 .001 .000
N 30 30 30 30
BAS2 Pearson Correlation .634** 1 .603
** .868
**
Sig. (2-tailed) .000 .000 .000
N 30 30 30 30
BAS3 Pearson Correlation .573** .603
** 1 .843
**
Sig. (2-tailed) .001 .000 .000
N 30 30 30 30
SkorTotal_BAS Pearson Correlation .862** .868
** .843
** 1
Sig. (2-tailed) .000 .000 .000
N 30 30 30 30
**. Correlation is significant at the 0.01 level (2-tailed).

86
Correlations
BL1 BL2 SkorTotal_BL
BL1 Pearson Correlation 1 .699** .923
**
Sig. (2-tailed) .000 .000
N 30 30 30
BL2 Pearson Correlation .699** 1 .920
**
Sig. (2-tailed) .000 .000
N 30 30 30
SkorTotal_BL Pearson Correlation .923** .920
** 1
Sig. (2-tailed) .000 .000
N 30 30 30
**. Correlation is significant at the 0.01 level (2-tailed).

87
RELIABILITY
/VARIABLES=AS1 AS2 AS3
/SCALE('ALL VARIABLES') ALL
/MODEL=ALPHA
/STATISTICS=DESCRIPTIVE SCALE
/SUMMARY=TOTAL.
Case Processing Summary
N %
Cases Valid 30 100.0
Excludeda 0 .0
Total 30 100.0
a. Listwise deletion based on all variables in the
procedure.
Reliability Statistics
Cronbach's
Alpha N of Items
.714 3
RELIABILITY
/VARIABLES=ATA1 ATA2
/SCALE('ALL VARIABLES') ALL
/MODEL=ALPHA
/STATISTICS=DESCRIPTIVE SCALE
/SUMMARY=TOTAL.
Case Processing Summary
N %
Cases Valid 30 100.0
Excludeda 0 .0
Total 30 100.0
a. Listwise deletion based on all variables in the
procedure.

88
Reliability Statistics
Cronbach's
Alpha N of Items
.826 2
RELIABILITY
/VARIABLES=PQ1 PQ2 PQ3 PQ4
/SCALE('ALL VARIABLES') ALL
/MODEL=ALPHA
/STATISTICS=DESCRIPTIVE SCALE
/SUMMARY=TOTAL.
Case Processing Summary
N %
Cases Valid 30 100.0
Excludeda 0 .0
Total 30 100.0
a. Listwise deletion based on all variables in the
procedure.
Reliability Statistics
Cronbach's
Alpha N of Items
.833 4

89
RELIABILITY
/VARIABLES=BAW1 BAW2
/SCALE('ALL VARIABLES') ALL
/MODEL=ALPHA
/STATISTICS=DESCRIPTIVE SCALE
/SUMMARY=TOTAL.
Case Processing Summary
N %
Cases Valid 30 100.0
Excludeda 0 .0
Total 30 100.0
a. Listwise deletion based on all variables in the
procedure.
Reliability Statistics
Cronbach's
Alpha N of Items
.809 2
RELIABILITY
/VARIABLES=BAS1 BAS2 BAS3
/SCALE('ALL VARIABLES') ALL
/MODEL=ALPHA
/STATISTICS=DESCRIPTIVE SCALE
/SUMMARY=TOTAL.
Case Processing Summary
N %
Cases Valid 30 100.0
Excludeda 0 .0
Total 30 100.0
a. Listwise deletion based on all variables in the
procedure.

90
Reliability Statistics
Cronbach's
Alpha N of Items
.820 3
RELIABILITY
/VARIABLES=BL1 BL2
/SCALE('ALL VARIABLES') ALL
/MODEL=ALPHA
/STATISTICS=DESCRIPTIVE SCALE
/SUMMARY=TOTAL.
Case Processing Summary
N %
Cases Valid 30 100.0
Excludeda 0 .0
Total 30 100.0
a. Listwise deletion based on all variables in the
procedure.
Reliability Statistics
Cronbach's
Alpha N of Items
.823 2

91
Jenis_Kelamin
Frequency Percent Valid Percent
Cumulative
Percent
Valid Pria 140 46.7 46.7 46.7
Wanita 160 53.3 53.3 100.0
Total 300 100.0 100.0
Usia
Frequency Percent Valid Percent
Cumulative
Percent
Valid <20 Tahun 38 12.7 12.7 12.7
21-35 Tahun 262 87.3 87.3 100.0
Total 300 100.0 100.0
Pekerjaan
Frequency Percent Valid Percent
Cumulative
Percent
Valid Pelajar/ Mahasiswa 300 100.0 100.0 100.0
Pendidikan_Terakhir
Frequency Percent Valid Percent
Cumulative
Percent
Valid Diploma 5 1.7 1.7 1.7
Pasca S 1 .3 .3 2.0
Sarjana 32 10.7 10.7 12.7
SMA 262 87.3 87.3 100.0
Total 300 100.0 100.0

92
Penghasilan
Frequency Percent Valid Percent
Cumulative
Percent
Valid Lebih dari Rp5,000,000 4 1.3 1.3 1.3
Rp1,000,000 - Rp3,000,000 145 48.3 48.3 49.7
Rp3,000,000 - Rp5,000,000 15 5.0 5.0 54.7
Sampai dengan
Rp1,000,000 136 45.3 45.3 100.0
Total 300 100.0 100.0
Pernah_Melihat_Iklan_Indomie
Frequency Percent Valid Percent
Cumulative
Percent
Valid Pernah 300 100.0 100.0 100.0
Pernah_Menggunakan_Produk_Indomie
Frequency Percent Valid Percent
Cumulative
Percent
Valid Pernah 300 100.0 100.0 100.0

93
Statistics
AS1 AS2 AS3
ATA
1
ATA
2 PQ1 PQ2 PQ3 PQ4
BA
W1
BA
W2
BAS
1
BAS
2
BAS
3 BL1 BL2
N Vali
d 300 300 300 300 300 300 300 300 300 300 300 300 300 300 300 300
Miss
ing 0 0 0 0 0 0 0 0 0 0 0 0 0 0 0 0
Mean 4.63
00
4.61
00
4.54
00
4.64
67
4.43
33
4.75
00
4.85
67
4.84
00
4.52
00
5.27
67
5.24
33
5.00
67
5.01
67
4.59
00
4.27
67
4.00
67
Std.
Deviat
ion
.932
38
1.02
701
.989
10
.904
37
1.05
321
1.07
300
1.01
302
.995
51
1.11
673
.953
85
.894
50
.960
75
1.00
653
1.07
038
1.25
114
1.43
998
Minim
um 1.00 1.00 1.00 2.00 1.00 1.00 1.00 1.00 1.00 1.00 1.00 1.00 1.00 1.00 1.00 1.00
Maxi
mum 6.00 6.00 6.00 6.00 6.00 6.00 6.00 6.00 6.00 6.00 6.00 6.00 6.00 6.00 6.00 6.00
Sum 1389
.00
1383
.00
1362
.00
1394
.00
1330
.00
1425
.00
1457
.00
1452
.00
1356
.00
1583
.00
1573
.00
1502
.00
1505
.00
1377
.00
1283
.00
1202
.00

94
Goodness of Fit =================== Chi-square = 1,000
GFI = 1,000
AGFI = \agfi
TLI = \tli
CFI = \cfi
RMSEA = \rmsea
Scalar Estimates (Group number 1 - Default model)
Maximum Likelihood Estimates
Regression Weights: (Group number 1 - Default model)
Estimate S.E. C.R. P Label
AS3 <--- Advertising_Spending 1,000
AS2 <--- Advertising_Spending ,643 ,077 8,352 ***
AS1 <--- Advertising_Spending ,839 ,085 9,906 ***
Standardized Regression Weights: (Group number 1 - Default model)
Estimate
AS3 <--- Advertising_Spending ,882
AS2 <--- Advertising_Spending ,546
AS1 <--- Advertising_Spending ,785
Variances: (Group number 1 - Default model)
Estimate S.E. C.R. P Label
Advertising_Spending
,758 ,102 7,399 ***
e1
,217 ,069 3,140 ,002
e2
,738 ,066 11,122 ***
e3
,332 ,054 6,115 ***

95
Goodness of Fit =================== Chi-square = 1,000
GFI = 1,000
AGFI = \agfi
TLI = \tli
CFI = \cfi
RMSEA = \rmsea
Estimates (Group number 1 - Default model)
Scalar Estimates (Group number 1 - Default model)
Maximum Likelihood Estimates
Regression Weights: (Group number 1 - Default model)
Estimate S.E. C.R. P Label
ATA1 <--- AttitudeToward_Advertising 1,000
ATA2 <--- AttitudeToward_Advertising 1,000
Standardized Regression Weights: (Group number 1 - Default model)
Estimate
ATA1 <--- AttitudeToward_Advertising ,740
ATA2 <--- AttitudeToward_Advertising ,635
Variances: (Group number 1 - Default model)
Estimate S.E. C.R. P Label
AttitudeToward_Advertising
,446 ,061 7,359 ***
e1
,369 ,057 6,461 ***
e2
,659 ,072 9,094 ***
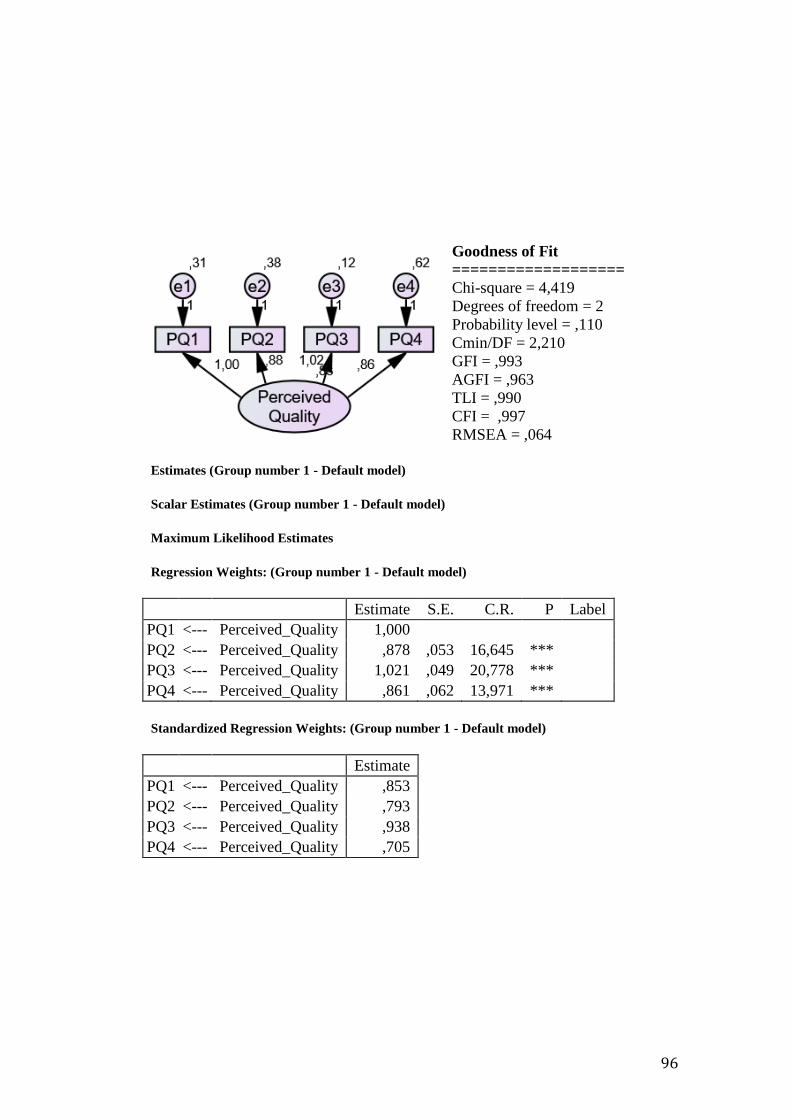
96
Goodness of Fit
=================== Chi-square = 4,419
Degrees of freedom = 2
Probability level = ,110
Cmin/DF = 2,210
GFI = ,993
AGFI = ,963
TLI = ,990
CFI = ,997
RMSEA = ,064
Estimates (Group number 1 - Default model)
Scalar Estimates (Group number 1 - Default model)
Maximum Likelihood Estimates
Regression Weights: (Group number 1 - Default model)
Estimate S.E. C.R. P Label
PQ1 <--- Perceived_Quality 1,000
PQ2 <--- Perceived_Quality ,878 ,053 16,645 ***
PQ3 <--- Perceived_Quality 1,021 ,049 20,778 ***
PQ4 <--- Perceived_Quality ,861 ,062 13,971 ***
Standardized Regression Weights: (Group number 1 - Default model)
Estimate
PQ1 <--- Perceived_Quality ,853
PQ2 <--- Perceived_Quality ,793
PQ3 <--- Perceived_Quality ,938
PQ4 <--- Perceived_Quality ,705

97
Variances: (Group number 1 - Default model)
Estimate S.E. C.R. P Label
Perceived_Quality
,834 ,093 8,938 ***
e1
,313 ,035 8,991 ***
e2
,379 ,037 10,343 ***
e3
,118 ,025 4,653 ***
e4
,625 ,056 11,195 ***

98
Goodness of Fit =================== Chi-square = 1,000
GFI = 1,000
AGFI = \agfi
TLI = \tli
CFI = \cfi
RMSEA = \rmsea
Estimates (Group number 1 - Default model)
Scalar Estimates (Group number 1 - Default model)
Maximum Likelihood Estimates
Regression Weights: (Group number 1 - Default model)
Estimate S.E. C.R. P Label
BAW1 <--- Brand_Awareness 1,000
BAW2 <--- Brand_Awareness 1,000
Standardized Regression Weights: (Group number 1 - Default model)
Estimate
BAW1 <--- Brand_Awareness ,815
BAW2 <--- Brand_Awareness ,869
Variances: (Group number 1 - Default model)
Estimate S.E. C.R. P Label
Brand_Awareness
,603 ,060 9,999 ***
e1
,304 ,043 7,124 ***
e2
,195 ,038 5,102 ***

99
Goodness of Fit =================== Chi-square = 1,000
GFI = 1,000
AGFI = \agfi
TLI = \tli
CFI = \cfi
RMSEA = \rmsea
Estimates (Group number 1 - Default model)
Scalar Estimates (Group number 1 - Default model)
Maximum Likelihood Estimates
Regression Weights: (Group number 1 - Default model)
Estimate S.E. C.R. P Label
BAS1 <--- Brand_Associations 1,000
BAS2 <--- Brand_Associations 1,206 ,149 8,104 ***
BAS3 <--- Brand_Associations 1,163 ,141 8,225 ***
Standardized Regression Weights: (Group number 1 - Default model)
Estimate
BAS1 <--- Brand_Associations ,653
BAS2 <--- Brand_Associations ,752
BAS3 <--- Brand_Associations ,681
Variances: (Group number 1 - Default model)
Estimate S.E. C.R. P Label
Brand_Associations
,392 ,075 5,249 ***
e1
,528 ,060 8,734 ***
e2
,439 ,071 6,161 ***
e3
,612 ,076 8,054 ***
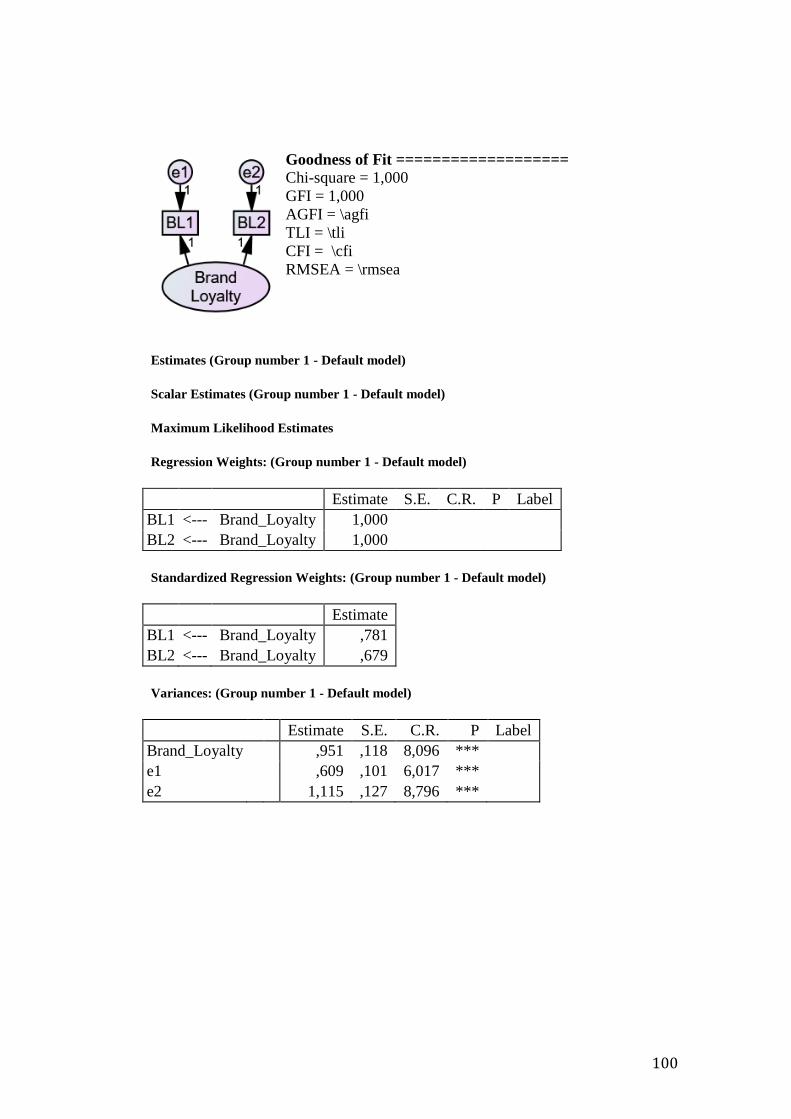
100
Goodness of Fit =================== Chi-square = 1,000
GFI = 1,000
AGFI = \agfi
TLI = \tli
CFI = \cfi
RMSEA = \rmsea
Estimates (Group number 1 - Default model)
Scalar Estimates (Group number 1 - Default model)
Maximum Likelihood Estimates
Regression Weights: (Group number 1 - Default model)
Estimate S.E. C.R. P Label
BL1 <--- Brand_Loyalty 1,000
BL2 <--- Brand_Loyalty 1,000
Standardized Regression Weights: (Group number 1 - Default model)
Estimate
BL1 <--- Brand_Loyalty ,781
BL2 <--- Brand_Loyalty ,679
Variances: (Group number 1 - Default model)
Estimate S.E. C.R. P Label
Brand_Loyalty
,951 ,118 8,096 ***
e1
,609 ,101 6,017 ***
e2
1,115 ,127 8,796 ***

101
Analysis Summary
Date and Time
Date: Jumat, 23 Maret 2018
Time: 03.23.09
Title
All variable: Jumat, 23 Maret 2018 03.23
Notes for Group (Group number 1)
The model is recursive.
Sample size = 300
Variable Summary (Group number 1)
Your model contains the following variables (Group number 1)

102
Observed, endogenous variables
AS1
AS2
AS3
ATA1
ATA2
PQ1
PQ2
PQ3
PQ4
BAW1
BAW2
BAS1
BAS2
BAS3
BL1
BL2
Unobserved, endogenous variables
Perceived_Quality
Brand_Awareness
Brand_Associations
Brand_Loyalty
Unobserved, exogenous variables
Advertising_Spending
e1
e2
e3
AttitudeToward_Advertising
e4
e5
e6
e7
e8
e9
e10
e11
e12
e13
e14
e15
e16
z1
z4
z2
z3

103
Variable counts (Group number 1)
Number of variables in your model: 42
Number of observed variables: 16
Number of unobserved variables: 26
Number of exogenous variables: 22
Number of endogenous variables: 20
Parameter Summary (Group number 1)
Weights Covariances Variances Means Intercepts Total
Fixed 26 0 0 0 0 26
Labeled 0 0 0 0 0 0
Unlabeled 20 1 22 0 0 43
Total 46 1 22 0 0 69
Notes for Model (Default model)
Computation of degrees of freedom (Default model)
Number of distinct sample moments: 136
Number of distinct parameters to be estimated: 43
Degrees of freedom (136 - 43): 93
Result (Default model)
Minimum was achieved
Chi-square = 151,063
Degrees of freedom = 93
Probability level = ,000
Estimates (Group number 1 - Default model)
Scalar Estimates (Group number 1 - Default model)
Maximum Likelihood Estimates
Regression Weights: (Group number 1 - Default model)

104
Estima
te
S.
E. C.R. P
Lab
el
Brand_Awarene
ss
<--
- Advertising_Spending ,380
,07
9
4,83
5
**
*
Brand_Awarene
ss
<--
-
AttitudeToward_Adver
tising ,416
,10
5
3,95
2
**
*
Perceived_Qual
ity
<--
- Advertising_Spending ,259
,08
2
3,17
2
,00
2
Brand_Associat
ions
<--
- Advertising_Spending ,149
,05
5
2,72
5
,00
6
Perceived_Qual
ity
<--
-
AttitudeToward_Adver
tising ,313
,10
9
2,86
9
,00
4
Brand_Associat
ions
<--
-
AttitudeToward_Adver
tising ,230
,07
5
3,06
8
,00
2
Perceived_Qual
ity
<--
- Brand_Awareness ,486
,08
8
5,53
8
**
*
Brand_Associat
ions
<--
- Brand_Awareness ,395
,06
6
6,00
9
**
*
Brand_Loyalty <--
- Perceived_Quality ,485
,08
2
5,88
0
**
*
Brand_Loyalty <--
- Brand_Associations ,783
,15
0
5,21
2
**
*
AS1 <--
- Advertising_Spending 1,000
AS2 <--
- Advertising_Spending ,780
,08
5
9,15
9
**
*
AS3 <--
- Advertising_Spending 1,174
,09
5
12,3
22
**
*
ATA1 <--
-
AttitudeToward_Adver
tising 1,000
ATA2 <--
-
AttitudeToward_Adver
tising ,970
,15
2
6,37
8
**
*
PQ1 <--
- Perceived_Quality 1,000
PQ2 <--
- Perceived_Quality ,869
,05
1
17,1
73
**
*
PQ3 <--
- Perceived_Quality ,988
,04
6
21,7
00
**
*
PQ4 <--
- Perceived_Quality ,848
,06
0
14,2
12
**
*
BAW1 <--
- Brand_Awareness 1,000
BAW2 <--
- Brand_Awareness ,943
,06
9
13,7
27
**
*

105
Estima
te
S.
E. C.R. P
Lab
el
BAS1 <--
- Brand_Associations 1,000
BAS2 <--
- Brand_Associations 1,353
,13
9
9,76
4
**
*
BAS3 <--
- Brand_Associations 1,251
,13
8
9,04
1
**
*
BL1 <--
- Brand_Loyalty 1,000
BL2 <--
- Brand_Loyalty ,715
,09
3
7,70
4
**
*
Standardized Regression Weights: (Group number 1 - Default model)
Estimate
Brand_Awareness <--- Advertising_Spending ,351
Brand_Awareness <--- AttitudeToward_Advertising ,351
Perceived_Quality <--- Advertising_Spending ,204
Brand_Associations <--- Advertising_Spending ,186
Perceived_Quality <--- AttitudeToward_Advertising ,225
Brand_Associations <--- AttitudeToward_Advertising ,262
Perceived_Quality <--- Brand_Awareness ,415
Brand_Associations <--- Brand_Awareness ,534
Brand_Loyalty <--- Perceived_Quality ,394
Brand_Loyalty <--- Brand_Associations ,403
AS1 <--- Advertising_Spending ,788
AS2 <--- Advertising_Spending ,557
AS3 <--- Advertising_Spending ,872
ATA1 <--- AttitudeToward_Advertising ,741
ATA2 <--- AttitudeToward_Advertising ,617
PQ1 <--- Perceived_Quality ,867
PQ2 <--- Perceived_Quality ,798
PQ3 <--- Perceived_Quality ,923
PQ4 <--- Perceived_Quality ,706
BAW1 <--- Brand_Awareness ,833
BAW2 <--- Brand_Awareness ,838
BAS1 <--- Brand_Associations ,612
BAS2 <--- Brand_Associations ,790
BAS3 <--- Brand_Associations ,686
BL1 <--- Brand_Loyalty ,922
BL2 <--- Brand_Loyalty ,570

106
Covariances: (Group number 1 - Default model)
Estima
te
S.
E.
C.R
. P
Lab
el
Advertising_Spen
ding
<--
>
AttitudeToward_Adve
rtising ,166
,04
2
3,99
7
**
*
Correlations: (Group number 1 - Default model)
Estimate
Advertising_Spending <--> AttitudeToward_Advertising ,339
Variances: (Group number 1 - Default model)
Estimate S.E. C.R. P Label
Advertising_Spending
,537 ,074 7,244 ***
AttitudeToward_Advertising
,447 ,088 5,101 ***
z2
,422 ,060 6,999 ***
z1
,463 ,056 8,215 ***
z3
,122 ,029 4,243 ***
z4
,663 ,146 4,550 ***
e1
,329 ,044 7,489 ***
e2
,725 ,065 11,185 ***
e3
,234 ,051 4,606 ***
e4
,368 ,071 5,172 ***
e5
,685 ,083 8,279 ***
e6
,285 ,032 8,911 ***
e7
,371 ,036 10,404 ***
e8
,145 ,023 6,231 ***
e9
,623 ,055 11,222 ***
e10
,277 ,041 6,692 ***
e11
,238 ,036 6,525 ***
e12
,576 ,054 10,626 ***
e13
,380 ,050 7,648 ***
e14
,604 ,062 9,800 ***
e15
,229 ,135 1,701 ,089
e16
1,386 ,132 10,474 ***
Matrices (Group number 1 - Default model)

107
Total Effects (Group number 1 - Default model)
AttitudeTow
ard_Advertis
ing
Advertisin
g_Spendi
ng
Brand_
Awaren
ess
Brand_A
ssociatio
ns
Perceive
d_Qualit
y
Brand
_Loyal
ty
Brand_A
wareness ,416 ,380 ,000 ,000 ,000 ,000
Brand_A
ssociatio
ns
,394 ,299 ,395 ,000 ,000 ,000
Perceive
d_Qualit
y
,515 ,443 ,486 ,000 ,000 ,000
Brand_L
oyalty ,558 ,449 ,544 ,783 ,485 ,000
BL2 ,399 ,321 ,389 ,560 ,346 ,715
BL1 ,558 ,449 ,544 ,783 ,485 1,000
BAS3 ,493 ,374 ,493 1,251 ,000 ,000
BAS2 ,533 ,404 ,534 1,353 ,000 ,000
BAS1 ,394 ,299 ,395 1,000 ,000 ,000
BAW2 ,392 ,358 ,943 ,000 ,000 ,000
BAW1 ,416 ,380 1,000 ,000 ,000 ,000
PQ4 ,437 ,376 ,412 ,000 ,848 ,000
PQ3 ,509 ,438 ,480 ,000 ,988 ,000
PQ2 ,447 ,385 ,422 ,000 ,869 ,000
PQ1 ,515 ,443 ,486 ,000 1,000 ,000
ATA2 ,970 ,000 ,000 ,000 ,000 ,000
ATA1 1,000 ,000 ,000 ,000 ,000 ,000
AS3 ,000 1,174 ,000 ,000 ,000 ,000
AS2 ,000 ,780 ,000 ,000 ,000 ,000
AS1 ,000 1,000 ,000 ,000 ,000 ,000
Standardized Total Effects (Group number 1 - Default model)
AttitudeTow
ard_Advertis
ing
Advertisin
g_Spendi
ng
Brand_
Awaren
ess
Brand_A
ssociatio
ns
Perceive
d_Qualit
y
Brand
_Loyal
ty
Brand_A
wareness ,351 ,351 ,000 ,000 ,000 ,000
Brand_A
ssociatio
ns
,449 ,374 ,534 ,000 ,000 ,000

108
AttitudeTow
ard_Advertis
ing
Advertisin
g_Spendi
ng
Brand_
Awaren
ess
Brand_A
ssociatio
ns
Perceive
d_Qualit
y
Brand
_Loyal
ty
Perceive
d_Qualit
y
,371 ,350 ,415 ,000 ,000 ,000
Brand_L
oyalty ,327 ,288 ,379 ,403 ,394 ,000
BL2 ,186 ,164 ,216 ,229 ,225 ,570
BL1 ,302 ,266 ,349 ,371 ,364 ,922
BAS3 ,308 ,256 ,366 ,686 ,000 ,000
BAS2 ,355 ,295 ,421 ,790 ,000 ,000
BAS1 ,275 ,228 ,326 ,612 ,000 ,000
BAW2 ,294 ,294 ,838 ,000 ,000 ,000
BAW1 ,292 ,292 ,833 ,000 ,000 ,000
PQ4 ,262 ,247 ,293 ,000 ,706 ,000
PQ3 ,342 ,323 ,383 ,000 ,923 ,000
PQ2 ,296 ,279 ,331 ,000 ,798 ,000
PQ1 ,321 ,303 ,360 ,000 ,867 ,000
ATA2 ,617 ,000 ,000 ,000 ,000 ,000
ATA1 ,741 ,000 ,000 ,000 ,000 ,000
AS3 ,000 ,872 ,000 ,000 ,000 ,000
AS2 ,000 ,557 ,000 ,000 ,000 ,000
AS1 ,000 ,788 ,000 ,000 ,000 ,000
Direct Effects (Group number 1 - Default model)
AttitudeTow
ard_Advertis
ing
Advertisin
g_Spendi
ng
Brand_
Awaren
ess
Brand_A
ssociatio
ns
Perceive
d_Qualit
y
Brand
_Loyal
ty
Brand_A
wareness ,416 ,380 ,000 ,000 ,000 ,000
Brand_A
ssociatio
ns
,230 ,149 ,395 ,000 ,000 ,000
Perceive
d_Qualit
y
,313 ,259 ,486 ,000 ,000 ,000
Brand_L
oyalty ,000 ,000 ,000 ,783 ,485 ,000
BL2 ,000 ,000 ,000 ,000 ,000 ,715
BL1 ,000 ,000 ,000 ,000 ,000 1,000
BAS3 ,000 ,000 ,000 1,251 ,000 ,000

109
AttitudeTow
ard_Advertis
ing
Advertisin
g_Spendi
ng
Brand_
Awaren
ess
Brand_A
ssociatio
ns
Perceive
d_Qualit
y
Brand
_Loyal
ty
BAS2 ,000 ,000 ,000 1,353 ,000 ,000
BAS1 ,000 ,000 ,000 1,000 ,000 ,000
BAW2 ,000 ,000 ,943 ,000 ,000 ,000
BAW1 ,000 ,000 1,000 ,000 ,000 ,000
PQ4 ,000 ,000 ,000 ,000 ,848 ,000
PQ3 ,000 ,000 ,000 ,000 ,988 ,000
PQ2 ,000 ,000 ,000 ,000 ,869 ,000
PQ1 ,000 ,000 ,000 ,000 1,000 ,000
ATA2 ,970 ,000 ,000 ,000 ,000 ,000
ATA1 1,000 ,000 ,000 ,000 ,000 ,000
AS3 ,000 1,174 ,000 ,000 ,000 ,000
AS2 ,000 ,780 ,000 ,000 ,000 ,000
AS1 ,000 1,000 ,000 ,000 ,000 ,000
Standardized Direct Effects (Group number 1 - Default model)
AttitudeTow
ard_Advertis
ing
Advertisin
g_Spendi
ng
Brand_
Awaren
ess
Brand_A
ssociatio
ns
Perceive
d_Qualit
y
Brand
_Loyal
ty
Brand_A
wareness ,351 ,351 ,000 ,000 ,000 ,000
Brand_A
ssociatio
ns
,262 ,186 ,534 ,000 ,000 ,000
Perceive
d_Qualit
y
,225 ,204 ,415 ,000 ,000 ,000
Brand_L
oyalty ,000 ,000 ,000 ,403 ,394 ,000
BL2 ,000 ,000 ,000 ,000 ,000 ,570
BL1 ,000 ,000 ,000 ,000 ,000 ,922
BAS3 ,000 ,000 ,000 ,686 ,000 ,000
BAS2 ,000 ,000 ,000 ,790 ,000 ,000
BAS1 ,000 ,000 ,000 ,612 ,000 ,000
BAW2 ,000 ,000 ,838 ,000 ,000 ,000
BAW1 ,000 ,000 ,833 ,000 ,000 ,000
PQ4 ,000 ,000 ,000 ,000 ,706 ,000
PQ3 ,000 ,000 ,000 ,000 ,923 ,000
PQ2 ,000 ,000 ,000 ,000 ,798 ,000
PQ1 ,000 ,000 ,000 ,000 ,867 ,000

110
AttitudeTow
ard_Advertis
ing
Advertisin
g_Spendi
ng
Brand_
Awaren
ess
Brand_A
ssociatio
ns
Perceive
d_Qualit
y
Brand
_Loyal
ty
ATA2 ,617 ,000 ,000 ,000 ,000 ,000
ATA1 ,741 ,000 ,000 ,000 ,000 ,000
AS3 ,000 ,872 ,000 ,000 ,000 ,000
AS2 ,000 ,557 ,000 ,000 ,000 ,000
AS1 ,000 ,788 ,000 ,000 ,000 ,000
Indirect Effects (Group number 1 - Default model)
AttitudeTow
ard_Advertis
ing
Advertisin
g_Spendi
ng
Brand_
Awaren
ess
Brand_A
ssociatio
ns
Perceive
d_Qualit
y
Brand
_Loyal
ty
Brand_A
wareness ,000 ,000 ,000 ,000 ,000 ,000
Brand_A
ssociatio
ns
,164 ,150 ,000 ,000 ,000 ,000
Perceive
d_Qualit
y
,202 ,184 ,000 ,000 ,000 ,000
Brand_L
oyalty ,558 ,449 ,544 ,000 ,000 ,000
BL2 ,399 ,321 ,389 ,560 ,346 ,000
BL1 ,558 ,449 ,544 ,783 ,485 ,000
BAS3 ,493 ,374 ,493 ,000 ,000 ,000
BAS2 ,533 ,404 ,534 ,000 ,000 ,000
BAS1 ,394 ,299 ,395 ,000 ,000 ,000
BAW2 ,392 ,358 ,000 ,000 ,000 ,000
BAW1 ,416 ,380 ,000 ,000 ,000 ,000
PQ4 ,437 ,376 ,412 ,000 ,000 ,000
PQ3 ,509 ,438 ,480 ,000 ,000 ,000
PQ2 ,447 ,385 ,422 ,000 ,000 ,000
PQ1 ,515 ,443 ,486 ,000 ,000 ,000
ATA2 ,000 ,000 ,000 ,000 ,000 ,000
ATA1 ,000 ,000 ,000 ,000 ,000 ,000
AS3 ,000 ,000 ,000 ,000 ,000 ,000
AS2 ,000 ,000 ,000 ,000 ,000 ,000
AS1 ,000 ,000 ,000 ,000 ,000 ,000
Standardized Indirect Effects (Group number 1 - Default model)

111
AttitudeTow
ard_Advertis
ing
Advertisin
g_Spendi
ng
Brand_
Awaren
ess
Brand_A
ssociatio
ns
Perceive
d_Qualit
y
Brand
_Loyal
ty
Brand_A
wareness ,000 ,000 ,000 ,000 ,000 ,000
Brand_A
ssociatio
ns
,187 ,187 ,000 ,000 ,000 ,000
Perceive
d_Qualit
y
,145 ,146 ,000 ,000 ,000 ,000
Brand_L
oyalty ,327 ,288 ,379 ,000 ,000 ,000
BL2 ,186 ,164 ,216 ,229 ,225 ,000
BL1 ,302 ,266 ,349 ,371 ,364 ,000
BAS3 ,308 ,256 ,366 ,000 ,000 ,000
BAS2 ,355 ,295 ,421 ,000 ,000 ,000
BAS1 ,275 ,228 ,326 ,000 ,000 ,000
BAW2 ,294 ,294 ,000 ,000 ,000 ,000
BAW1 ,292 ,292 ,000 ,000 ,000 ,000
PQ4 ,262 ,247 ,293 ,000 ,000 ,000
PQ3 ,342 ,323 ,383 ,000 ,000 ,000
PQ2 ,296 ,279 ,331 ,000 ,000 ,000
PQ1 ,321 ,303 ,360 ,000 ,000 ,000
ATA2 ,000 ,000 ,000 ,000 ,000 ,000
ATA1 ,000 ,000 ,000 ,000 ,000 ,000
AS3 ,000 ,000 ,000 ,000 ,000 ,000
AS2 ,000 ,000 ,000 ,000 ,000 ,000
AS1 ,000 ,000 ,000 ,000 ,000 ,000
Modification Indices (Group number 1 - Default model)
Covariances: (Group number 1 - Default model)
M.I. Par Change
z1 <--> z3 19,632 ,098
e14 <--> AttitudeToward_Advertising 5,794 ,092
e14 <--> z2 10,043 -,119
e14 <--> z1 10,355 ,120
e13 <--> z2 13,235 ,119
e11 <--> e14 4,951 -,065

112
M.I. Par Change
e10 <--> e16 4,415 ,095
e9 <--> e16 6,741 ,150
e7 <--> e16 5,237 -,105
e6 <--> z2 4,313 ,056
e5 <--> e10 5,028 ,077
e2 <--> e11 4,110 ,062
e1 <--> e10 7,739 ,068
Variances: (Group number 1 - Default model)
M.I. Par Change
Regression Weights: (Group number 1 - Default model)
M.I. Par Change
Brand_Associations <--- Perceived_Quality 9,112 ,098
Perceived_Quality <--- Brand_Associations 4,110 ,168
BL2 <--- AS2 4,475 -,145
BAS3 <--- AttitudeToward_Advertising 6,138 ,216
BAS3 <--- Perceived_Quality 5,362 ,127
BAS3 <--- Brand_Loyalty 4,313 ,095
BAS3 <--- BL1 4,863 ,087
BAS3 <--- PQ4 5,421 ,102
BAS3 <--- PQ3 5,113 ,111
BAS3 <--- PQ1 5,431 ,106
BAS3 <--- ATA2 4,148 ,095
BAS3 <--- ATA1 6,292 ,136
BAS2 <--- BAW1 4,190 ,091
BAS2 <--- ATA2 4,587 -,086
BAS2 <--- ATA1 5,193 -,107
PQ4 <--- BL2 5,147 ,075
PQ3 <--- ATA2 4,353 -,058
PQ1 <--- BAW2 4,161 ,080
Modification Indices (Group number 1 - Default model)
Covariances: (Group number 1 - Default model)
M.I. Par Change
z1 <--> z3 19,632 ,098

113
M.I. Par Change
e14 <--> AttitudeToward_Advertising 5,794 ,092
e14 <--> z2 10,043 -,119
e14 <--> z1 10,355 ,120
e13 <--> z2 13,235 ,119
e11 <--> e14 4,951 -,065
e10 <--> e16 4,415 ,095
e9 <--> e16 6,741 ,150
e7 <--> e16 5,237 -,105
e6 <--> z2 4,313 ,056
e5 <--> e10 5,028 ,077
e2 <--> e11 4,110 ,062
e1 <--> e10 7,739 ,068
Variances: (Group number 1 - Default model)
M.I. Par Change
Regression Weights: (Group number 1 - Default model)
M.I. Par Change
Brand_Associations <--- Perceived_Quality 9,112 ,098

114
M.I. Par Change
Perceived_Quality <--- Brand_Associations 4,110 ,168
BL2 <--- AS2 4,475 -,145
BAS3 <--- AttitudeToward_Advertising 6,138 ,216
BAS3 <--- Perceived_Quality 5,362 ,127
BAS3 <--- Brand_Loyalty 4,313 ,095
BAS3 <--- BL1 4,863 ,087
BAS3 <--- PQ4 5,421 ,102
BAS3 <--- PQ3 5,113 ,111
BAS3 <--- PQ1 5,431 ,106
BAS3 <--- ATA2 4,148 ,095
BAS3 <--- ATA1 6,292 ,136
BAS2 <--- BAW1 4,190 ,091
BAS2 <--- ATA2 4,587 -,086
BAS2 <--- ATA1 5,193 -,107
PQ4 <--- BL2 5,147 ,075
PQ3 <--- ATA2 4,353 -,058
PQ1 <--- BAW2 4,161 ,080

115
Model Fit Summary
CMIN
Model NPAR CMIN DF P CMIN/DF
Default model 43 151,063 93 ,000 1,624
Saturated model 136 ,000 0
Independence model 16 2288,560 120 ,000 19,071
RMR, GFI
Model RMR GFI AGFI PGFI
Default model ,055 ,941 ,914 ,644
Saturated model ,000 1,000
Independence model ,381 ,323 ,233 ,285
Baseline Comparisons
Model NFI
Delta1
RFI
rho1
IFI
Delta2
TLI
rho2 CFI
Default model ,934 ,915 ,974 ,965 ,973
Saturated model 1,000
1,000
1,000
Independence model ,000 ,000 ,000 ,000 ,000
Parsimony-Adjusted Measures
Model PRATIO PNFI PCFI
Default model ,775 ,724 ,754
Saturated model ,000 ,000 ,000
Independence model 1,000 ,000 ,000
NCP
Model NCP LO 90 HI 90
Default model 58,063 28,318 95,718
Saturated model ,000 ,000 ,000
Independence model 2168,560 2016,894 2327,592
FMIN
Model FMIN F0 LO 90 HI 90
Default model ,505 ,194 ,095 ,320
Saturated model ,000 ,000 ,000 ,000
Independence model 7,654 7,253 6,745 7,785

116
RMSEA
Model RMSEA LO 90 HI 90 PCLOSE
Default model ,046 ,032 ,059 ,692
Independence model ,246 ,237 ,255 ,000
AIC
Model AIC BCC BIC CAIC
Default model 237,063 242,248 396,326 439,326
Saturated model 272,000 288,397 775,714 911,714
Independence model 2320,560 2322,489 2379,820 2395,820
ECVI
Model ECVI LO 90 HI 90 MECVI
Default model ,793 ,693 ,919 ,810
Saturated model ,910 ,910 ,910 ,965
Independence model 7,761 7,254 8,293 7,768
HOELTER
Model HOELTER
.05
HOELTER
.01
Default model 231 253
Independence model 20 21

117
NILAI-NILAI r PRODUCT MOMENT
N Taraf Signif
N Taraf Signif
N Taraf Signif
5% 1% 5% 1% 5% 1%
3 0.997 0.999 27 0.381 0.487 55 0.266 0.345
4 0.950 0.990 28 0.374 0.478 60 0.254 0.330
5 0.878 0.959 29 0.367 0.470 65 0.244 0.317
6 0.811 0.917 30 0.361 0.463 70 0.235 0.306
7 0.754 0.874 31 0.355 0.456 75 0.227 0.296
8 0.707 0.834 32 0.349 0.449 80 0.220 0.286
9 0.666 0.798 33 0.344 0.442 85 0.213 0.278
10 0.632 0.765 34 0.339 0.436 90 0.207 0.270
11 0.602 0.735 35 0.334 0.430 95 0.202 0.263
12 0.576 0.708 36 0.329 0.424 100 0.195 0.256
13 0.553 0.684 37 0.325 0.418 125 0.176 0.230
14 0.532 0.661 38 0.320 0.413 150 0.159 0.210
15 0.514 0.641 39 0.316 0.408 175 0.148 0.194
16 0.497 0.623 40 0.312 0.403 200 0.138 0.181
17 0.482 0.606 41 0.308 0.398 300 0.113 0.148
18 0.468 0.590 42 0.304 0.393 400 0.098 0.128
19 0.456 0.575 43 0.301 0.389 500 0.088 0.115
20 0.444 0.561 44 0.297 0.384 600 0.080 0.105
21 0.433 0.549 45 0.294 0.380 700 0.074 0.097
22 0.423 0.537 46 0.291 0.376 800 0.070 0.091
23 0.413 0.526 47 0.288 0.372 900 0.065 0.086
24 0.404 0.515 48 0.284 0.368 1000 0.062 0.081
25 0.396 0.505 49 0.281 0.364
26 0.388 0.496 50 0.279 0.361