research report employers, young people, and training and
TRANSCRIPT
RE S E A R C H RE P O R T
Employers, Young People, and Training and Support Implementation Study of the Urban Alliance High School Internship Program
Brett Theodos Michael R. Pergamit Amelia Coffey Devlin Hanson
Matthew Gerken Katherine Thomas
January 2021
E D U C A T I O N A N D T R A I N I N G
A B O U T T H E U R BA N I N S T I T U TE The nonprofit Urban Institute is a leading research organization dedicated to developing evidence-based insights that improve people’s lives and strengthen communities. For 50 years, Urban has been the trusted source for rigorous analysis of complex social and economic issues; strategic advice to policymakers, philanthropists, and practitioners; and new, promising ideas that expand opportunities for all. Our work inspires effective decisions that advance fairness and enhance the well-being of people and places.
Copyright © January 2021. Urban Institute. Permission is granted for reproduction of this file, with attribution to the Urban Institute. Cover image courtesy of Urban Alliance.
Contents Acknowledgments vi
Executive Summary vii What Is the Program Model? vii Who Are the Young People in the Study? viii How Is the Program Implemented? ix What Do We Know About Attrition in the Program? xi What Are the Organization’s Plans for Growth and Change? xii How Can Urban Alliance Improve Its Internship Program? xiii
Introduction 1
Overview of Programs and Supports for Young People 3 Work Experience 5 Work-Based Learning 5
Programs for High School and Younger Students 5 Programs for Post–High School Young People 6
Job Training Programs 7 High School Opportunities and Supports 8
Career Academies and Magnet Schools 8 Dual Enrollment and Career and Technical Education (CTE) 8 High School Counseling and Other Supports 9
Coaching, Case Management, and Mentoring 9 College Access and Readiness 10 Urban Alliance 11
Urban Alliance High School Internship Program Model 12 Logic Model 12 Target Population and Recruitment 12 Program Components 13
Skills Training 14 Direct Work Experience 14 Mentorship 14 Coaching and Case Management 15 Alumni Services 15
Data and Approach 16
Urban Alliance Applicants 18

i v C O N T E N T S
Program Implementation 23 Recruitment and Application 23 Skills Training: Pre-work and Workshops 25
Format 25 Style 26 Content and Applicability 27 Methods 30 Public Speaking Challenge 31
Internship Experience 31 Matching Young People to Job Sites 32 Internship Experience 33 Communication with Job Sites 35 Attracting and Retaining Job Sites 37 Youth Outlook on Internship 38 Employer Outlook on the Internships 40
Mentorship 42 Mentor Role and Expectations 43 Mentor-Intern Relationship 45
Coaching: Program Coordinators 46 Coaching and Youth Support 46 Post–High School Planning 48 Program Coordinator Role 49
Post–High School Plans and Alumni Services 52 Program Fidelity 57
Program Take-Up and Persistence 58 Preventing Attrition 65
Program Funding and Costs 67
Organizational Growth and Change 69
Implications for Practice 72
Appendix A. Data Sources 76 Interviews 76 Focus Groups 77 Observations 78 Surveys 78 Program Data 79 Secondary Data 79
C O N T E N T S v
Appendix B. Urban Alliance Applicants’ Neighborhoods 81
Appendix C. Program Fidelity 89
Appendix D. Site-Level Predictive Models 90
Notes 94
About the Authors 99
Statement of Independence 100

v i A C K N O W L E D G M E N T S
Acknowledgments This report was funded with a Department of Education Investing in Innovation (i3) award. We are
grateful to them and to all our funders, who make it possible for the Urban Institute to advance its
mission.
The views expressed are those of the authors and should not be attributed to the Urban Institute,
its trustees, or its funders. Funders do not determine research findings or the insights and
recommendations of Urban experts. Further information on the Urban Institute’s funding principles is
available at urban.org/fundingprinciples.
We would like to thank Eshauna Smith, Dan Tsin, and Lauren Rice at Urban Alliance for their
support and guidance during this study, as well as Barbara Goodson at Abt for i3 support. Thanks to
Nancy Pindus and Shayne Spaulding for reviewing and commenting on a draft version of this report.
E X E C U T I V E S U M M A R Y v i i
Executive Summary Headquartered in Washington, DC, Urban Alliance provides training, mentorship, and work experience
to high school seniors from underresourced communities in Washington, DC, Baltimore, Northern
Virginia, Chicago, and Detroit. The program serves young people before they become disconnected
from school and work, with the goal of helping them successfully transition to higher education or
employment after graduation.
To evaluate its High School Internship Program in Washington, DC, and Baltimore, Urban Alliance
commissioned the Urban Institute to conduct a randomized controlled trial impact and process
evaluation beginning in 2012. That evaluation found positive impacts on high school graduation and soft
skills attainment for those who completed the program, and on college attendance for young men and
college enrollment for middle-GPA students, specifically.
In 2016, Urban Alliance commissioned the Urban Institute to conduct a second impact and process
evaluation of its High School Internship Program, expanding the scope to include Chicago and Northern
Virginia. The evaluation does not include the Detroit program, which launched after the study began.
This report presents findings from the process evaluation based on analyses of program
observations; conversations with young people, program staff, job mentors, and school counselors; and
program data. It presents baseline information about Urban Alliance and the young people participating
in its High School Internship Program in Washington, DC, Baltimore, Chicago, and Northern Virginia in
the 2016–17 and 2017–18 school years. This report is the first in a series of three. Interim and final
reports will describe the program’s impacts on students’ educational attainment and economic self-
sufficiency and skill development.
What Is the Program Model? Goals: Urban Alliance’s organizational goals center around “empowering economically-
disadvantaged youth to aspire, work, and succeed.” The High School Internship Program is
designed to accomplish this goal through workplace skills training, exposure to professional
work and mentorship, support from dedicated case managers, and continued access to
resources and support for program alumni.
Target students: the High School Internship Program targets high school seniors at schools in
neighborhoods with historically limited access to economic opportunity and with an academic
v i i i E X E C U T I V E S U M M A R Y
schedule that allows for early school dismissal. The program aims to serve “middle-of-the-road"
students, with GPAs between 2.0 and 3.0, but it does not restrict eligibility to this group.
Program components: the program’s key elements are skills training, direct work experience,
mentorship and coaching, and alumni services.
Who Are the Young People in the Study?
The study sample included 1,435 young people who applied to the Urban Alliance program and agreed
to participate in the evaluation.
Demographic characteristics: on average, students were almost 18 years old at the time of
application. Two-thirds of Urban Alliance applicants were female and 77 percent were non-
Hispanic Black.
Work experience: across all regions, 41 percent of students had previous work experience.
Students who worked before applying to the program had an average of 9.2 months’
experience. Their most common positions were in food service, child care or camp counseling,
and retail.
Educational background: the average GPA of an Urban Alliance intern was 3.0, but this varied by
region. Baltimore had the lowest average GPA at 2.8, and Chicago had the highest at 3.1. Three-
quarters of students did not have an immediate family member who had attended college.
Eighty six percent of applicants were absent ten or fewer days in the past school year.
Neighborhood characteristics: Urban Alliance applicants typically resided in neighborhoods with
high poverty levels. Across all regions, almost half of applicants lived in a neighborhood where
at least a quarter of residents lived below the federal poverty level. Applicants’ neighborhoods
also had higher rates of unemployment than their broader regions and higher concentrations of
people of color.
School characteristics: the schools Urban Alliance targeted for recruitment differed by region.
Urban Alliance recruited more heavily from a smaller number of schools in Northern Virginia,
while, reflecting the nature of schools in the region, the DC region had the highest share of
charter schools. Average reading and math proficiency levels of applicants’ schools were below
the state median in each region.
E X E C U T I V E S U M M A R Y i x
How Is the Program Implemented? Recruitment and application: Urban Alliance staff worked closely with school staff in selected
districts to recruit students in the target population: underserved students doing moderately
well academically who had flexibility in their schedules. Recruitment involved securing
permission from school administrators to operate in the school; collaborating with counselors,
teachers, and other staff to identify eligible students; publicizing the program; working with
students to fill out the application and necessary paperwork; and keeping students engaged
until pre-work began.
Skills training: Urban Alliance staff held mandatory training sessions for participating seniors,
beginning in the fall and running through late July. In the fall, students began with “pre-work”
trainings before starting their internships. Pre-work was designed to prepare young people to
work in an office setting and focused on soft skills, such as professional communication and
teamwork, and hard skills, such as using Microsoft Office. Once internships began in late fall or
early winter, students were required to attend weekly workshops. Workshop topics focused on
life skills and post–high school planning, in addition to lessons on workplace soft skills. The
Urban Alliance program ended with a public speaking challenge, during which students gave
presentations on their internships and post–high school plans to a panel of volunteer judges.
Internship: Urban Alliance staff placed students in paid internships, taking into consideration
the students’ interests, skills, and personal situations (such as home and school locations) as
much as possible. Urban Alliance aimed to place interns in professional environments, most
often in office settings. Some employers interviewed interns to ensure they were a good fit for
their work environment. Interns worked at their internships after school Monday through
Thursday. After graduating, interns worked full days Monday through Thursday in the summer
through the end of the program.
Job partners: Urban Alliance had a predominantly relationship-based model of job partner
recruitment, with staff working to build and maintain relationships with partners each year.
Program coordinators worked to address any job partners’ concerns and ensure mentors felt
supported. Employer retention was high: more than 80 percent of job partners were retained
year-over-year, and more than eight in ten job mentors surveyed indicated they were likely
interested in having an Urban Alliance intern in the future. Eight in ten employers reported that
their organizations hosted interns for an average of three to four years.
x E X E C U T I V E S U M M A R Y
Internship value to young people: interns had opportunities to gain hard skills for their specific
industries and soft skills that could boost their comfort and performance in any office setting.
All young people participating in Urban Alliance internships earned money and gained
experience in an office work setting. During the 2016–17 and 2017–18 program years,
students who were placed at an internship worked an average of 361 hours and earned an
average of $4,122 during the internship.
Internship value to employers: most mentors decided to employ an intern through Urban Alliance
mainly to help young people in the community, but many others also participated in the
program to boost their organization’s image and fill gaps in staffing.
Mentorship: the program model called for young people to be assigned job mentors or
supervisors at their internship site. These job site employees were responsible for arranging
work for the interns and training them to complete assigned tasks. Urban Alliance also
encouraged mentors to share their career perspectives and connect interns to networks within
their organizations. Job mentors provided feedback to Urban Alliance on interns’ work
performance and could reach out to the program if issues with interns arose.
Coaching and case management: program coordinators were Urban Alliance’s frontline staff who
interacted most extensively with young people. They planned and ran training workshops and
supported a caseload of students. Program coordinators tracked youth performance indicators,
which they used to target support, coaching, and any corrective actions as needed, as well as to
award merit-based hourly wage increases. All young people were expected to check in with
their program coordinator at least weekly. Program coordinators met with each young person
one-on-one a few times throughout the program year to provide post–high school planning
support.
Alumni services: Urban Alliance has gradually expanded its capacity to support young people
after they complete the High School Internship Program. The alumni support role shifted from
program coordinators, who previously provided informal support, toward a more formalized
program component operated by a national alumni director and full-time alumni services
directors in each region beginning in the 2016–17 program year. Alumni services staff offered
support to prevent college attrition and connect alumni to employment, as well as professional
development opportunities such as resume editing and interview practice.
Program funding and costs: the High School Internship Program was funded through a mix of fees
from organizations employing interns, philanthropic foundations, and government grants and
contracts. Interns were either fully funded by the job partner, partially funded by the job

E X E C U T I V E S U M M A R Y x i
partner and by philanthropic dollars, or fully funded by philanthropic dollars. Roughly 65
percent of internship sites paid a fee for each intern placed at their organization. Urban Alliance
set expected full fee rates at amounts that it determined each region could absorb.
What Do We Know About Attrition in the Program? Why attrition matters: youth participation affected resource planning and Urban Alliance’s
relationships with schools. Also, young people may benefit less when they complete only part of
the Urban Alliance program.
When students exited the program: among young people who applied to the program, 23 percent
did not show up for pre-work training. Urban Alliance did not consider program applicants who
never showed up to pre-work as having been officially part of the program. (They will still be
included in our impact assessment of the program, which uses a randomized controlled trial—
RCT—approach.) Of those considered part of the program (i.e., having started pre-work), 26
percent did not complete pre-work. Only 4 percent who completed pre-work were not placed
at a job site. The majority of those placed in an internship completed the program (76 percent).
Among all applicants offered access to Urban Alliance, 41 percent completed the program.
Among those who attended pre-work, 54 percent completed the program. Among those who
completed pre-work, 73 percent completed the program.
How attrition varied by youth demographics: young people with a family structure other than a
single-parent (living with their mother or father) or two-parent family were 13 percentage
points less likely to complete the program, conditional on completing pre-work, than young
people with a two-parent family structure. Young people living in neighborhoods with high
poverty levels were less likely to complete the program than those living in neighborhoods with
low poverty levels, controlling for other factors.
Factors contributing to attrition: our process evaluation and interviews revealed many reasons
why young people might have exited the program:
» School schedules conflicted with Urban Alliance programming.
» After-school commitments, especially athletics, were demanding of students’ time.
» Urban Alliance competed with other employers that may offer higher wages or more hours.
» Urban Alliance did not pay young people for pre-work.

x i i E X E C U T I V E S U M M A R Y
» The location of workshops was an obstacle for some students with transportation
challenges.
» Poor job performance and low levels of engagement at work could lead to termination of
young people from their internships (though the bar for termination is high).
» Urban Alliance did not always have the right sites to match students’ interests.
» The internship commitment and environment could be a culture shock for young people
compared with their experiences in high school.
Preventing attrition: although Urban Alliance expected some degree of attrition each year, the
program was especially interested in curbing attrition among young people who progressed
farther along in the program. Staff members suggested several ways to reduce attrition,
including offering course credit for the program, developing open lines of communication with
school partners, and building strong relationships with young people early on.
What Are the Organization’s Plans for Growth and Change?
Expanding to a new region: Urban Alliance opened in DC in 1996; it expanded to Baltimore in
2008, Chicago in 2012, and Northern Virginia in 2013. The program expanded to Detroit
during this study; Urban Alliance began enrolling young people in Detroit for the 2018–19
school year.
Adding youth programming: for many years, Urban Alliance staff considered ways to serve young
people before they reached their senior year of high school, because those students may have
already missed opportunities for college enrollment or living-wage careers. Urban Alliance first
began working with young people before the start of their senior year in Washington, DC, but it
has expanded that work in recent years to include high school sophomores and juniors in some
other regions. Moving forward, Urban Alliance plans to adjust its training curriculum to make it
more age-appropriate for sophomores and juniors and to potentially incorporate a work
experience element for seniors—for example in the areas of construction, land surveying, and
hospitality.
E X E C U T I V E S U M M A R Y x i i i
How Can Urban Alliance Improve Its Internship Program?
Urban Alliance has been proactive in using internal and external data and evaluations to improve its
practices and has made substantial improvements to its High School Internship Program based on these
efforts. This implementation study revealed several areas for further consideration:
Targeting: though Urban Alliance officially targeted middle-of-the-road high school students—
with GPAs between 2.0 and 3.0—for the internship program, the actual population served
varied greatly in academic performance and soft-skills ability. The program can consider how to
more narrowly focus recruitment on the target population, as serving a consistent population is
important for reproducing program impacts at scale.
Curriculum: Urban Alliance has invested substantial resources in updating the training
curriculum to be more accessible and engaging to young people. Still, further refinements may
be needed to help young people concentrate, as many did not believe that all the training
sessions were helpful.
Standardization: the national team tried to introduce standard teaching practices and training
content through revamped curriculum, but content delivery varied somewhat by region. It was
unclear whether these variations reflected local needs. Delivering a standard program model
across regions may help reproduce positive outcomes.
Mentorship: Urban Alliance has made strides in improving its development of job mentors, but it
should continue to prioritize expanding mentor screening, training, and engagement. The
organization should focus on ensuring job mentors are committed to serving in a youth
development role and not simply as a work supervisor.
Program coordinator support: program coordinators have many responsibilities that take time
away from direct work with students, limiting program coordinators’ ability to steer young
people toward success. Extra attention could be provided by conducting more one-on-one
sessions with young people during trainings, especially early in the program.
Post–high school planning: Urban Alliance has broadened its view of what constitutes post–high
school success, in line with the reality that many young people do not desire or are not
prepared to matriculate and graduate from a four-year college immediately after high school.
However, young people not on the immediate college trajectory will likely need additional
support. This may include increasing connections to further training programs or
apprenticeships that would prepare them for permanent employment.

x i v E X E C U T I V E S U M M A R Y
Alumni services: Urban Alliance has invested heavily in alumni services, including developing
more connections between alumni and local employers and expanding a program of alumni
mentorship in a few regions. These efforts showed promise, but they may still need to become
more robust to connect young people with jobs that pay a living wage and have career
pathways.
I N T R O D U C T I O N 1
Introduction Young people require effective support to achieve post–high school success. Such support comes from
many sources—family, friends, mentors, and schools. Some young people can access help from
nonprofits that work alongside these other supports. Urban Alliance, a nonprofit based in Washington,
DC, is a growing multicity model. The organization has offered a High School Internship Program that
provided young people with intensive supports to aid their post–high school transition to education and
employment, including professional internships, mentorship from an adult professional, coaching from
trained program staff, college and career skills training, and ongoing support for program alumni. In
addition to its Washington, DC, location, Urban Alliance operated this program in Baltimore, Chicago,
Detroit, and Northern Virginia.
Although factors vary across these regions, students in each region face substantial barriers to
success in their post–high school transition. These young people may face poor employment prospects
and limited opportunities to improve their employability.
Urban Alliance was founded and began operating in Washington, DC, in 1996, expanding to
Baltimore in 2008, Chicago in 2012, Northern Virginia in 2013, and Detroit in 2018. To evaluate its
High School Internship Program in Washington, DC, and Baltimore, Urban Alliance commissioned the
Urban Institute to conduct a randomized controlled trial (RCT) impact and process evaluation beginning
in 2012, with funding from the Corporation for National and Community Service’s Social Innovation
Fund (Theodos et al. 2014; 2016; 2017). The Social Innovation Fund evaluation found positive impacts
on high school graduation and college attendance for male students and also on college enrollment for
students with middle GPAs (between 2.0 and 3.0). Effects were not as strong or not present for young
women.
In 2016, Urban Alliance commissioned the Urban Institute to conduct a second impact and process
evaluation of its High School Internship Program, expanding the scope to include Chicago and Northern
Virginia. This evaluation was funded through an Investing in Innovation Fund (i3) grant from the US
Department of Education for scaling the High School Internship Program. We examine two cohorts
participating in the program during the 2016–17 and 2017–18 school years. The evaluation does not
include the Detroit region, which launched after this study began. This report presents findings from the
process evaluation based on analyses of program observations; conversations with young people,
program staff, job mentors, and school counselors; surveys of young people, job mentors, and school

2 I N T R O D U C T I O N
counselors; and program data. Although the program model has remained mostly consistent since the
Social Innovation Fund evaluation, this report highlights areas of change.
This report also provides baseline information about young people participating in this study and is
the first in a series of three reports on the longer impact evaluation. Interim and final reports will
describe program impacts on young people related to educational attainment and economic self-
sufficiency. We begin with a review of relevant literature on supporting postsecondary paths for young
people from disadvantaged backgrounds; then we describe the program model, followed by our findings
on program implementation, and conclude with implications for practice.
O V E R V I E W O F P R O G R A M S A N D S U P P O R T S F O R Y O U N G P E O P L E 3
Overview of Programs and Supports for Young People Employment among young people in their late teens and early twenties has been falling over the past
few decades. Although much of this decline has been driven by higher secondary and postsecondary
school attendance (Abraham and Kearney 2018), a significant number of young people remain
disconnected from both employment and school. About 10 percent of men and 13 percent of women
ages 20 to 24 were not employed, seeking employment, or in school in 2018 (Loprest, Spaulding, and
Nightingale 2019). The share of young people both not working and not enrolled in school varies by race
and ethnicity. Reflecting historical and contemporary barriers, rates are higher among Black young
people and Hispanic young people than among white young people.
Although college attendance has seen an upward trend in recent decades, many young people from
underresourced communities do not enroll in or complete postsecondary education. Among recent high
school completers, 69 percent of white, non-Hispanic young people enrolled in college within 12 months
of graduation, compared with 65 percent of Hispanic young people and 61 percent of Black young
people (Ma, Pender, and Welch 2016). College enrollment also varied considerably by income: 83
percent of recent high school completers ages 16 to 24 from families with high incomes were enrolled in
college, versus 65 percent of those completers from families with low incomes (Snyder, de Brey, and
Dillow 2019).
Young people from underresourced communities face barriers to employment and postsecondary
education influenced by broader societal inequities. Discrimination permeates systems—including the
education, workforce, housing, and criminal legal systems, among others—that influence educational
and employment outcomes for young people of color (Pager and Shepherd 2008). Young people from
underresourced neighborhoods may have limited access to people who can help them find employment
(Spaulding 2005). Discriminatory hiring practices have led to inequities whereby Black and Hispanic job
applicants are less likely to be interviewed or get a job offer than equally qualified white job applicants
(Pager, Western, and Bonikowski 2009). Numerous factors also influence differences in educational
outcomes, including lower expectations from teachers, higher prevalence of disciplinary action, and
higher likelihood of assignment to special education tracks (Harry and Klinger 2014; Boser, Wilhelm,
and Hanna 2014; US Department of Education 2014).
4 O V E R V I E W O F P R O G R A M S A N D S U P P O R T S F O R Y O U N G P E O P L E
These disparities in employment and education outcomes can have far-reaching consequences for
young people and their families. A wealth of national statistics highlights the consequences that lower
rates of college entrance and completion have for the lifetime earnings and economic stability of
disadvantaged young people. Indeed, median earnings of those with a bachelor’s degree were $24,600
(67 percent) higher than the earnings of high school graduates in 2015 (Ma, Pender, and Welch 2016).
Disconnection among young people from both school and employment is correlated with numerous
negative outcomes, including criminal activity, substance abuse, depression, and diminished future
labor-market outcomes (Loprest, Spaulding, and Nightingale 2019). These outcomes can be
compounded by structural conditions, inequities, discrimination, and other challenges. Young people
living in neighborhoods with low incomes have higher rates of mental and physical health problems than
young people from middle-income backgrounds (Leventhal and Brooks-Gunn 2003). Risk factors such
as poverty, family instability, and limited community and school resources are associated with lower
educational attainment, higher engagement in delinquent behaviors, and worse health outcomes
(Fernandes-Alcantara 2018).
Various programs and supports aim to improve both college access and completion and
employment opportunities for young people of disadvantaged backgrounds. These programs vary in the
young people they serve, including high school students and graduates, dropouts, and those with
experience in the juvenile justice or child welfare systems. They also vary in their purpose. Many have a
work-based learning focus that complements learning in the classroom with on-the-job training and
adult mentoring; provides skills, connections, and work experience; and contributes to youth
development (Lerman 2016; Linked Learning 2012).1 Some supports are provided directly by high
schools, and others are facilitated by high schools but delivered through private organizations or social
service departments. Other programs exist outside of the high school context entirely.
Evaluations of these programs are mixed, often failing to show positive long-term outcomes,
although many studies have only tracked outcomes in the short term. Additionally, major federal
evaluations of youth employment programs have focused on programs geared toward disconnected
young people rather than young people still in traditional high school settings. The following literature
review contextualizes the Urban Alliance High School Internship Program by describing the current
evidence on the impacts of work experience; supports provided in high school; work-based learning; job
training programs for young people; and outside programs providing case management, mentoring, and
college access and readiness programming.
O V E R V I E W O F P R O G R A M S A N D S U P P O R T S F O R Y O U N G P E O P L E 5
Work Experience
Research on the effects of employment—outside of a structured program—on youth outcomes shows a
mixed relationship with later-life outcomes. Research suggests that employment during the school year
for a modest number of hours a week either has small positive effects or no effects on educational
outcomes, whereas working for more hours may have negative impacts (Monahan, Lee, and Steinberg
2011; Rothstein 2007). One longitudinal study, following young people through high school into early
adulthood, found that employment during high school can contribute to positive psychosocial
development (Mortimer 2003). Most research on employment’s effect on youth outcomes has excluded
employment during the summer. Youth employment has also shown positive correlation with future job
quality (Ross et al. 2018). And prior work experience has also been a significant factor considered by
employers when hiring young people (Harrington et al. 2013).
Similarly, a lack of employment opportunities also contributes to later-life outcomes.
Unemployment at a young age is associated with lower earnings and a greater chance of unemployment
in the future (Mroz and Savage 2006). Young people both not working and not enrolled in school face a
higher risk of lower future earnings, worse health outcomes, involvement with the criminal justice
system, and lower educational attainment (Lewis and Gluskin 2018). Young people of color, as well as
young people from low-income backgrounds, have lower access to early work opportunities and are
more likely to be disconnected from work and school than their white peers with higher incomes (Lewis
and Gluskin 2018; Spievack and Sick 2019). Research from an international context suggests that long-
term unemployment among young people with a lower socioeconomic status has particularly harmful
effects on their professional support network (Bolíbar, Verd, and Barranco 2019).
Work-Based Learning
Various work-based learning programs serve young people—some that have been shown to improve
academic and other outcomes (Treskon 2016). Some programs engage young people while they are in
high school, and others engage those who have already graduated.
Programs for High School and Younger Students
Evaluations of programs that combine an internship with other academic or social supports are mixed.
An evaluation of After School Matters, a nonprofit organization that offers high school students paid
work experiences similar to apprenticeships, found no effect on job skills or academic performance,
6 O V E R V I E W O F P R O G R A M S A N D S U P P O R T S F O R Y O U N G P E O P L E
although there were improvements related to positive youth development (Hirsch et al. 2011). The
Philadelphia-based Summer Career Exploration Program, which provides high school students with
private sector employment, pre-employment training, and mentoring opportunities, similarly found no
effects on high school graduation or college enrollment, although participants were more likely to enroll
in a college preparatory or specialized academic program (McClanahan, Sipe, and Smith 2004). An
analysis of National Longitudinal Survey of Youth 1997 data found that participating in work-placed
learning in high school—defined broadly to include cooperative education, internships, apprenticeships,
or mentorship programs—was associated with higher job quality at age 29 (Ross et al. 2018). Work-
based learning programs in high school can also help expand students’ professional networks
(Rosenbaum et al. 1999).
Beyond their impact on academic outcomes, work-based learning programs have also been shown
to decrease delinquent behaviors. An evaluation of one Boston summer youth employment program,
targeting young people ages 14 to 24, found soft-skill development and reduced violence and drug use
among participants, using entry and follow-up surveys of program participants and a comparison group
(Sum, Trubskyy, and McHugh 2013). One randomized controlled trial evaluation found that a Chicago
summer youth job program led to reductions in violent-crime arrests (Davis and Heller 2017).
These programs also offer participants the opportunity to expand their professional networks, both
with staff running the programs and through work. Employment services targeted to young people
often recognize this population may lack the professional networks to search for employment
opportunities and connect with employers (Kluve et al. 2019). Professional networks reduce the risk of
unemployment among young people (Hällsten, Edling, and Rydgren 2017; O’Regan 1993), and contacts
young people develop through relatives and school are associated with higher future earnings
(Rosenbaum et al. 1999). Employment programs that help young people develop social networks are
helpful in supporting young men of color, in particular in accessing employment (Bird and Bryant 2014).
Programs for Post–High School Young People
Urban Alliance prepares underserved seniors in high school for future success. Because Urban Alliance
provides ongoing support once students have graduated from high school, we review other programs
that support young people after high school. A randomized controlled trial evaluation of New York
City’s Center for Economic Opportunity youth literacy program found that students with a paid summer
internship to complement their literacy, math, and job skills education attended more class hours and
saw higher letter grades in math than students who did not have an internship (NYC Center for

O V E R V I E W O F P R O G R A M S A N D S U P P O R T S F O R Y O U N G P E O P L E 7
Economic Opportunity 2011). A random assignment evaluation of Youth Corps, a federally funded
program that provides both paid jobs for young people ages 18 to 24 and academic support for those
needing GED certification, did not find educational attainment or employment impacts in an 18-month
follow-up survey, although program participants were more likely to report planning to complete at
least some college (Price et al. 2011). Year Up, a training program for economically disadvantaged
young adults ages 18 to 24 with a high school diploma or equivalent, provides technical and professional
skills, college credit, internships, and mentoring opportunities. A recent evaluation of early program
impacts found higher earnings for the treatment group—attributed more to higher average wages and
hours worked than to higher group employment rates—and a higher college enrollment rate in the first
follow-up year, which then dropped below that of the control group in the second year (Fein and
Hamadyk 2018). A randomized controlled trial evaluation of YouthBuild, a construction and vocational
training program that provides academic services, counseling, youth development, and additional
supports, found increased receipt of high school equivalency credentials, college enrollment, and
survey-reported employment (Miller et al. 2018).
Job Training Programs
Programs offering youth job training without direct job experience have had some success in
employment and academic outcomes, although results again are mixed. Job Corps, a federally funded
program that provides vocational training, counseling, academic support, and often residential living,
was found to have positive short-term effects on earnings, employment, education, and crime. However,
those effects largely disappeared for the sample (young people ages 16 to 24 at the time of application)
five to ten years afterwards (Schochet, Burghardt, and McConnell 2006). No lasting impacts on earnings
or employment were found in a replication evaluation of a San Jose training program for high school
dropouts, called the Center for Employment Training, although infidelity to the program model may
have been a contributing factor (Miller et al. 2005). A more promising job training program evaluation is
that of the National Guard Youth ChalleNGe, a program that provides short-term job and life skills
training in a quasimilitary environment with follow-up mentoring. After three years, program
participants had a higher employment rate, higher earnings, and were more likely to obtain college
credits or a high school diploma or GED than the comparison group (Millenky et al. 2011).
Sectoral programs, which provide short-term training in professional occupations such as health
care, IT, and financial services, have seen some success. One randomized controlled trial evaluation that
tested three separate sectoral programs found positive impacts on earnings across all three, including

8 O V E R V I E W O F P R O G R A M S A N D S U P P O R T S F O R Y O U N G P E O P L E
for a subgroup analysis focusing solely on young adults, although impacts varied by program (Maguire et
al. 2010). An evaluation of a similar sectoral program demonstration, attempting to understand whether
such programs could be effectively implemented by organizations without much previous experience,
found smaller but still positive impacts on earnings (Hendra et al. 2016). Another randomized controlled
trial evaluation of a San Antonio sectoral program providing additional support for adults with low
incomes in existing health care occupation college programs also found positive impacts on earnings,
although impacts were not positive for those ages 18 to 24 (Elliott and Roder 2017).
High School Opportunities and Supports
High schools offer numerous opportunities and supports aimed at connecting young people with
postsecondary education and careers, which can prove beneficial.
Career Academies and Magnet Schools
Students participating in career academies—occupationally themed schools within high schools—have
been shown more likely than non–career academy students to exhibit positive school performance,
have higher levels of interpersonal support from peers and teachers, have higher future earnings and
employment, and graduate and attend a postsecondary institution (Crain et al. 1999; Kemple 2008;
Maxwell and Rubin 1997). Studies of career magnet schools, which specialize in a particular career
theme, have revealed lower dropout rates and increased student investment in school (Katz et al. 1995),
although their impact on academic achievement is mixed, as achievement varies by student
characteristics, subject, and whether the magnet school is a middle school or high school (Ballou,
Goldring, and Liu 2006; Cobb, Bifulco, and Bell 2009).
Dual Enrollment and Career and Technical Education (CTE)
Dual-enrollment programs allow high school students to take college or university courses at the same
time as their traditional coursework. CTE programs prepare students for a particular career path, often
offering both academic and career-focused courses and providing work experience opportunities.
These programs similarly show mixed results in academic and postsecondary outcomes. One study
based on high schools from selected Florida counties found that dual enrollment overall did not
significantly affect high school graduation rates, college enrollment, or college completion, although
significant impacts did emerge when considering specific dual-enrollment subject areas separately

O V E R V I E W O F P R O G R A M S A N D S U P P O R T S F O R Y O U N G P E O P L E 9
rather than dual enrollment as a whole (Speroni 2012). A study of CTE programs found that community
college students who had participated in high school CTE programs were either just as or more likely to
achieve relevant academic outcomes when compared with students who had taken general curriculum
courses in high school. Relative to students who had participated in college preparatory programs,
community college students who had participated in CTE programs were less likely to transfer to four-
year colleges but more likely to earn an associate’s degree or similar certificate (Dietrich, Lichtenberger,
and Kamalludeen 2016).
High School Counseling and Other Supports
Urban Alliance offers programming to its young people to help them navigate the transition to post–
high school settings, particularly to college. High schools also provide programming tied to college
access. High school counselors who provide college readiness counseling have been shown to promote
college access, particularly for students who have traditionally been underrepresented at the college
level, although research has also shown that school counselors as a group would benefit from additional
training in college readiness preparation (Gilfillan 2018).
Coaching, Case Management, and Mentoring
Beyond job training programs or similar programming, coaching, case management, and mentoring
programs offer another approach to serving at-risk young people, that has seen some success. One such
mentoring program is Big Brothers Big Sisters. One study of the program found initial academic
improvements, which then disappeared after 15 months (Herrera et al. 2011). Another study found that
length of tenure in the program influenced outcomes, so young people enrolled in the program for more
than 12 months had significant gains in self-worth, scholastic competence, relationships with parents,
and other outcomes (Grossman and Rhodes 2002). Treatment group young people in a specialized Big
Brothers Big Sisters program for children of incarcerated parents had higher self-esteem and stronger
social connections, although they did not exhibit higher academic competence (US Department of
Justice 2011).
The Latin American Youth Center’s Promoter Pathway program serves immigrant young people
with low incomes and young people of color in DC and Maryland. The program provides them with a
“promoter,” who provides mentorship, coaching, and case management, to encourage academic success,
employment success, and healthy behaviors among young people. A randomized controlled trial
evaluation revealed positive impacts in some areas, such as higher rates of school attendance and
1 0 O V E R V I E W O F P R O G R A M S A N D S U P P O R T S F O R Y O U N G P E O P L E
higher housing stability. However, the evaluation found no impacts for high school diploma attainment,
employment outcomes, or perceptions of self-efficacy as measured through perceived control over
what happens in one’s life (Theodos et al. 2016).
College Access and Readiness
Dedicated college access and readiness programs have also seen mixed results. A study of Upward
Bound, a federally funded program providing instruction, tutoring, and counseling, found no overall
effect on high school graduation or college enrollment, although educational outcomes were more
pronounced for students with initially low educational expectations (Myers et al. 2004). A random
assignment evaluation of the Quantum Opportunities Project, which offered case management,
academic support, developmental activities, and community service, showed no positive impacts,
although poor implementation of the program model and low participation were contributing factors
(Schirm et al. 2006). A meta-analysis of 14 college access program evaluations found higher graduation
rates and college enrollment for program participants, although the impact on graduation rates was no
longer statistically significant when only the experimental evaluations were considered (Harvill et al.
2012).
Equivalency-to-college bridge programs exist to help young people connect to postsecondary
education. These programs, often conducted at college campuses, provide additional supports to
students seeking high school equivalency credentials and also include college preparation. An
evaluation of one such program at LaGuardia Community College revealed higher rates of GED
completion as well as college entry among participants when compared with students enrolled in a
traditional GED course (Martin and Broadus 2013). Similar concurrent-enrollment programs exist that
allow students to pursue high school equivalency credentials while also taking college courses,
expediting the acquisition of postsecondary credentials. However, limited research exists that suggests
the effectiveness of these programs in improving outcomes.
Soft skills. Soft skills such as self-regulation, professionalism, goal setting, and oral communication
are linked with employment outcomes like job performance, wages, and attendance (Kautz and Moore
2018). Few studies, however, have centered soft skills as an outcome in rigorous evaluation. One study
that did was of the Opportunity Works intervention, which provides young people at risk of becoming
disconnected with support and resources to complete high school and bridge to their first year of
college or career. The study found no significant difference in the share of participants with goals to
graduate from a two- or four-year college between participants and a matched comparison group
O V E R V I E W O F P R O G R A M S A N D S U P P O R T S F O R Y O U N G P E O P L E 1 1
(Anderson et al. 2019). The gap in evidence about soft skills could exist because of a lack of reliable and
low-burden measures of soft skills for this population.
Urban Alliance
Overall, evidence suggests that programs offering underserved young people jobs, job training, career-
focused education, mentoring, or college readiness activities—or some combination of these—may be
effective in helping them achieve better outcomes. Urban Alliance, a national youth development
nonprofit, aims to help underserved high school seniors through professional internships, job skills
training, mentoring opportunities, and additional supports. Our previous randomized controlled trial
evaluation of Urban Alliance, funded by the Social Innovation Fund, found some impacts for subgroups,
particularly for males, across some areas but not others. Participation in Urban Alliance’s internship
program increased the probability of high school graduation and college attendance and enrollment, as
well as comfort levels with soft skills, for males in the treatment group. The program also had initial
positive and significant impacts on comfort with soft and hard skills for all young people in the
treatment group, although these impacts diminished by the second year, in part because of young
people in the control group “catching up” and later learning the same soft and hard skills. For all the
young people in the treatment group, we did not find statistically significant impacts three years after
program completion on high school achievement, college attendance and persistence at college,
employment, earnings, and savings, nor measures of college readiness, except for comfort levels with
FAFSA.
The current study is a replication and expansion study, continuing to examine the initial two regions
of Washington, DC, and Baltimore, and including the newer regions of Chicago and Northern Virginia.
Replication studies are important given evidence about the challenges with reproducing positive
program effects in other contexts (Makel and Plucker 2014)
1 2 U R B A N A L L I A N C E H I G H S C H O O L I N T E R N S H I P P R O G R A M M O D E L
Urban Alliance High School Internship Program Model Urban Alliance’s organizational goals center around “empowering economically-disadvantaged youth to
aspire, work, and succeed.”2 The High School Internship Program is designed to accomplish this through
workplace skills training, exposure to professional work and mentorship, support from dedicated case
managers, and continued access to resources and support for program alumni. The following section
describes the program logic model and how program components were expected to function under that
model.
Logic Model
Urban Alliance first developed a full logic model for its flagship High School Internship Program in 2007
and has made refinements over time (Winkler, Theodos, and Gross 2009). Figure 1 details the program’s
key activities, along with expected outputs and outcomes from each activity. This model reflects
organizational expectations during the 2016–17 and 2017–18 school years, when the cohorts
examined in this evaluation participated in the program.
Target Population and Recruitment
Urban Alliance targeted the flagship High School Internship Program to high school seniors in selected
public and public charter schools the program identified as having a large share of students at risk of
disconnection. The program targeted “middle-of-the-road” students, with GPAs between 2.0 and 3.0,
but did not restrict eligibility to this group. Participants also needed to have enough course credits to
qualify for an early-release schedule, giving them enough time to take on an internship in the afternoon.
In Chicago, Northern Virginia, and Baltimore, the program had a formal relationship with the local
school system and students could receive high school course credit for participation. In Northern
Virginia, the program also had a relationship with the local community college, and students earned
college credit for taking part in the program. In Baltimore, students in the 2016–17 academic year had
the opportunity to receive credit at the University of Baltimore. In Washington, DC, students did not

U R B A N A L L I A N C E H I G H S C H O O L I N T E R N S H I P P R O G R A M M O D E L 1 3
earn credit. School counselors and other school staff in each region identified students as a good fit and
referred them to the program.
Programs in each region aimed to start recruitment in the spring of students’ junior year and
continue into the fall of their senior year.
FIGURE 1
Urban Alliance High School Internship Program Logic Model
Source: Urban Alliance.
Notes: ASD = alumni services department; FAFSA = Free Application for Federal Student Aid; NSC = National Student
Clearinghouse; PC = program coordinators; ROI = return on investment. Outputs and outcomes for interns are targets among
interns placed at job sites, and those for alumni are targets among interns who complete an internship.
Program Components
The four core components of Urban Alliance internship program model are skills training, direct work
experience, mentorship and coaching, and alumni services.

1 4 U R B A N A L L I A N C E H I G H S C H O O L I N T E R N S H I P P R O G R A M M O D E L
Skills Training
The program model calls for mandatory training sessions for participating seniors, beginning in the fall
and running through late July. This began with “pre-work” trainings before students started their
internships. These were held after school during the fall of students’ senior year. Pre-work was designed
to prepare young people for work in a professional setting and focused on soft skills, such as
communication and teamwork, and hard skills, including using Microsoft Office. Under the model, young
people received preparation before interviewing for internships and attended sessions on post–high
school education and employment opportunities.
Once internships began in late fall or early winter, interns were required to attend workshops each
Friday afternoon. Workshop topics focused on life skills and post–high school planning, though they also
continued to provide lessons on workplace skills. Friday workshops were extended to half-day sessions
after the school year ended. Some workshop time was used to prepare young people to give a
presentation during the Public Speaking Challenge event at the end of the program. Each young person
prepared a slide deck about their internship experiences and post–high school plans and presented it
before a panel of volunteer judges.
Direct Work Experience
According to the program model, Urban Alliance staff placed students in paid internships, taking into
consideration the students’ interests, skills, and personal situations (such as home and school location)
as much as possible. Urban Alliance aimed to place interns in office settings. Some employers
interviewed one or more interns to ensure they were a good fit for their work environment. Interns
worked at their internships after school Monday through Thursday. After graduating, interns worked
full days Monday through Thursday in the summer through the end of the program. Interns filled out
time sheets. Most students were paid by Urban Alliance, while some employers paid students directly.
Mentorship
The program model calls for young people to be assigned job mentors or supervisors at their internship
site. These organization employees were responsible for helping to grow the interns’ professional skills,
by assigning tasks and providing feedback. Urban Alliance also encouraged mentors to share their
career perspectives and connections to resources and networks within their organizations. Job mentors
provided feedback to Urban Alliance on interns’ performance at work and could reach out to the
program at any time if issues arose.

U R B A N A L L I A N C E H I G H S C H O O L I N T E R N S H I P P R O G R A M M O D E L 1 5
Coaching and Case Management
The program model included program coordinators, who were the frontline staff at Urban Alliance
interacting most extensively with young people. Program coordinators planned and ran training
workshops and carried a caseload of students who were assigned to their workshop group and to whom
they provided dedicated support. Program coordinators tracked youth performance indicators, which
they used to target support and enforce program requirements, as well as award merit-based hourly
wage increases to young people. All young people were expected to check in with their program
coordinator at least weekly and let them know if they had to arrive late or miss work or a training
session. Program coordinators met one-on-one with each young person two-to-three times a year to
provide post–high school planning support.
Program coordinators kept in contact with employers about their interns’ performance and worked
through any challenges that arose. Three times during the internship, program coordinators arranged
site visits to the workplaces of all interns on their caseloads to meet with the interns and mentors.
Young people could be terminated from the program after failing to meet goals for improvement.
Alumni Services
Under the program model, Urban Alliance continued to support program alumni. Urban Alliance has
gradually increased its capacity to support young people after they complete the High School Internship
Program and has expanded alumni services. The alumni support role shifted from program coordinators,
who previously provided informal support, toward a more formalized program component operated by
a national alumni services director and full-time alumni services directors in each region beginning in
the 2016–17 program year. Alumni services staff offered support to prevent college attrition and
connect alumni to employment. Each regional office had a space where alumni could access
employment and education information and resources.
1 6 D A T A A N D A P P R O A C H
Data and Approach This report is the first product from our implementation and randomized controlled trial evaluation of
the Urban Alliance High School Internship Program. This evaluation follows a similar design to that
employed in the first Urban Institute evaluation of the High School Internship Program, though it
expands the analysis to four regions, including Northern Virginia and Chicago, whereas the first
evaluation examined only Washington, DC, and Baltimore. Because of sample size limitations, we
combined data from the 2016–17 and 2017–18 program years for analysis.
In each region, more young people were interested in participating in the internship program than
there were internship slots available. To fairly decide who could participate, young people were
randomly assigned the opportunity to participate in the program. Those who applied and were deemed
eligible were randomly assigned to either the treatment or control group. Those assigned to the
treatment group were invited to enroll in the program and begin pre-work.
The randomized controlled trial evaluation will examine high school completion, employment,
earnings, college enrollment, college persistence, and skill outcomes by comparing those assigned to the
treatment and control groups. This implementation report examines only those assigned to the
treatment group, especially those who elected to participate in the program. Specifically, in this report
we examine the following questions:
Were the key components of the Urban Alliance High School Internship Program model
implemented with fidelity?
Did implementation fidelity vary across the four regions?
What were the barriers to and facilitators of implementation?
Did the intensity of service receipt differ according to participant characteristics, such as
gender and GPA?
Did service receipt match program targets?
If service receipt targets were not achieved, what accounted for the shortfall?
To answer these questions, we collected quantitative and qualitative data from various sources,
detailed in appendix A. During the 2016–17 and 2017–18 program years, researchers completed 71 in-
depth interviews with Urban Alliance staff, young people who did not complete the program, school
staff involved in the program, and job mentors. We also facilitated 13 focus groups with participating

D A T A A N D A P P R O A C H 1 7
young people. These conversations covered a range of topics about program planning and
implementation. To obtain a wider perspective than possible for the limited interviews and focus
groups, we also administered surveys to 134 young people, 299 job mentors (249 unique job mentors
across both years), and 94 school counselors on similar topics. The team completed structured
observations of 27 pre-work and workshop training sessions, two mentor orientation sessions, and 12
job sites. Researchers also gathered printed program materials, including mentor and youth training
materials, and obtained official audited financial records.
1 8 U R B A N A L L I A N C E A P P L I C A N T S
Urban Alliance Applicants This section outlines the characteristics of the 1,435 young people who applied to the Urban Alliance
program and consented to be part of the evaluation. Although the young people span two cohorts
(2016–17 and 2017–18 school years), the tables in this section do not present findings by cohort
because there were not notable differences between student characteristics across the two years.
However, the tables present differences by region, as the student profiles differ across this dimension.
Student age was consistent and as expected across all regions. On average, students were almost 18
years old at the time of application, which was generally at the end of their junior year or early in their
senior year (table 1).
Although Urban Alliance does not target recruitment by gender, two-thirds of Urban Alliance
applicants were female. Multiple Urban Alliance staff noted in interviews that recruiting male students
is an ongoing challenge. One staff member in Chicago speculated that this discrepancy may be caused
by the eligibility requirements, as fewer male students were on track to graduate and have a schedule
that would permit early release in some districts. The male high school graduation rate in Chicago (82
percent) was indeed lower than the rate in Northern Virginia (89 percent) and DC (86 percent) but
equivalent to the rate in Baltimore (82 percent). The female high school graduate rate was 93 percent in
Washington, DC, 91 percent in Northern Virginia, 88 percent in Chicago, and 87 percent in Baltimore.
This interviewee also wondered whether males had greater interest in working in hands-on
occupations, as opposed to the office environment in which many Urban Alliance interns work. A
broader research literature finds that males are more likely to take nontraditional career and technical
courses (Fluhr et al. 2017; Hanks, McGrew, and Zessoules 2018; Leu and Arbeit 2020) and work in
those fields (Kell, Roohr, and Fishtein 2020). An Urban Alliance interviewee also speculated whether
the makeup of staff conducting recruitment affected this discrepancy (88 percent of staff in Chicago
were women at the time of the interview). A final note is that this and other program applicant
attributes were largely consistent with applicants participating in the Social Innovation Fund study
(Theodos et al. 2014).
The majority of Urban Alliance applicants reported they were non-Hispanic Black (77 percent).
Chicago and Northern Virginia also had large shares of applicants reporting they were Hispanic (32
percent and 45 percent, respectively). In Northern Virginia, 13 percent of applicants reported they were
Asian. These trends reflect the demographic differences in schools between the regions (table 1).

U R B A N A L L I A N C E A P P L I C A N T S 1 9
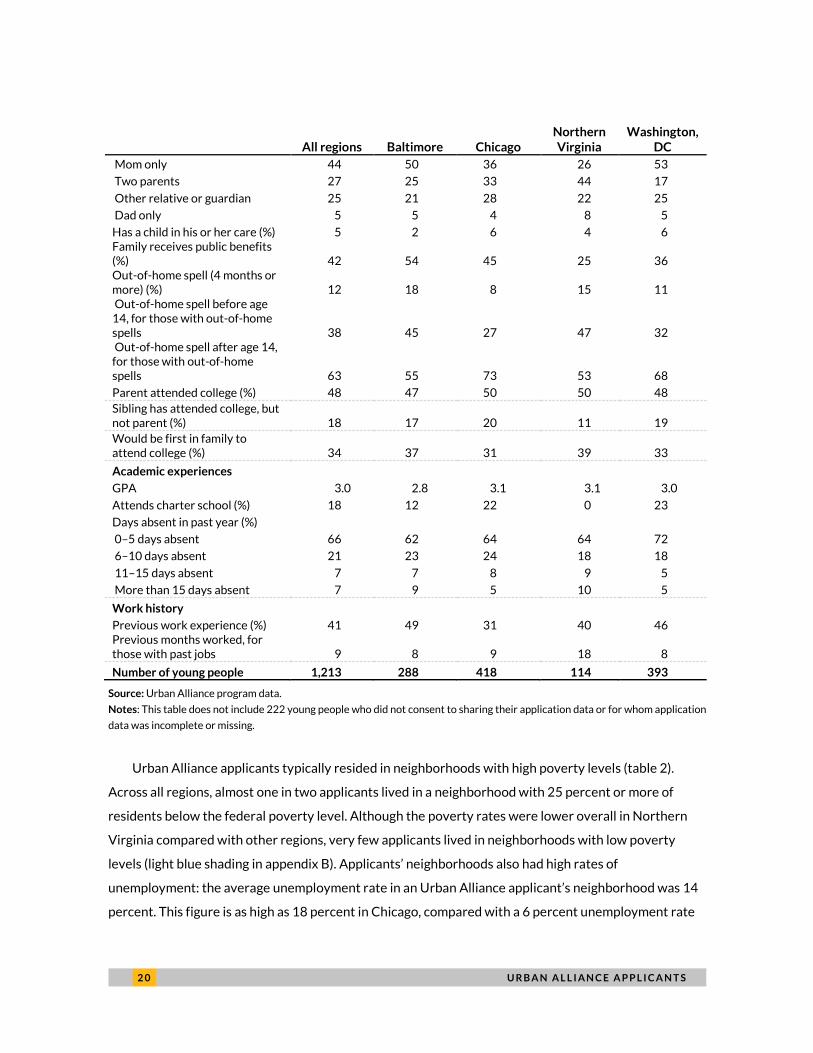
Students largely did not live in two-parent homes (73 percent). Across all regions, 43 percent of
young people lived with only their mother and 25 percent lived with a grandparent or other guardian.
These figures vary slightly across regions, with Northern Virginia applicants less commonly living with
their mother as sole guardian and more commonly living in two-parent households. Around five percent
of students had a child in their care at the time of application. About one in ten applicants had
experienced an out-of-home spell for four or more months. The majority of these spells were during
high school or at or after the age fourteen. Almost one in two families received public benefits.
The average self-reported GPA of an Urban Alliance intern was 3.0, but this varied by region.
Baltimore had the lowest average GPA at 2.8 and Chicago had the highest at 3.1 (table 1). Urban
Alliance staff noted in interviews that this variation by region could be partly explained by higher or
lower overall GPAs in some districts or schools compared with others. In general, these average GPAs
align with the type of student Urban Alliance strives to target. Fourteen percent of students were
absent more than ten days in the past school year. The DC region had the highest share of charter
schools (see table 1).
Across all regions, 41 percent of students had previous work experience. This figure was slightly
higher in Baltimore, where almost one in two applicants had previous work experience. Students with
work experience before applying to the program had worked 9.2 months on average, and the most
common positions were in food service, child care or camp counselor roles, and retail jobs. Many young
people had previously participated in summer youth employment programs.
Roughly a third of Urban Alliance applicants would be first in their family to attend college. Half of
applicants had a parent who had attended college.
TABLE 1
Demographic and Academic Characteristics of Urban Alliance Applicants
All regions Baltimore Chicago Northern Virginia
Washington, DC
Demographic characteristics Age (at start of pre-work) 18 18 18 18 18
Female (%) 68 64 71 63 69
Race or ethnicity (%) Asian non-Hispanic 2 2 2 13 0
Black non-Hispanic 77 92 64 34 93
Latino 19 3 32 45 8
White non-Hispanic 2 3 1 7 0
Other race non-Hispanic 0 0 0 1 0
Family Living arrangement (%)
2 0 U R B A N A L L I A N C E A P P L I C A N T S
All regions Baltimore Chicago Northern Virginia
Washington, DC
Mom only 44 50 36 26 53
Two parents 27 25 33 44 17
Other relative or guardian 25 21 28 22 25
Dad only 5 5 4 8 5
Has a child in his or her care (%) 5 2 6 4 6 Family receives public benefits (%) 42 54 45 25 36 Out-of-home spell (4 months or more) (%) 12 18 8 15 11 Out-of-home spell before age 14, for those with out-of-home spells 38 45 27 47 32 Out-of-home spell after age 14, for those with out-of-home spells 63 55 73 53 68
Parent attended college (%) 48 47 50 50 48 Sibling has attended college, but not parent (%) 18 17 20 11 19 Would be first in family to attend college (%) 34 37 31 39 33
Academic experiences GPA 3.0 2.8 3.1 3.1 3.0
Attends charter school (%) 18 12 22 0 23
Days absent in past year (%) 0–5 days absent 66 62 64 64 72
6–10 days absent 21 23 24 18 18
11–15 days absent 7 7 8 9 5
More than 15 days absent 7 9 5 10 5
Work history Previous work experience (%) 41 49 31 40 46 Previous months worked, for those with past jobs 9 8 9 18 8
Number of young people 1,213 288 418 114 393
Source: Urban Alliance program data.
Notes: This table does not include 222 young people who did not consent to sharing their application data or for whom application
data was incomplete or missing.
Urban Alliance applicants typically resided in neighborhoods with high poverty levels (table 2).
Across all regions, almost one in two applicants lived in a neighborhood with 25 percent or more of
residents below the federal poverty level. Although the poverty rates were lower overall in Northern
Virginia compared with other regions, very few applicants lived in neighborhoods with low poverty
levels (light blue shading in appendix B). Applicants’ neighborhoods also had high rates of
unemployment: the average unemployment rate in an Urban Alliance applicant’s neighborhood was 14
percent. This figure is as high as 18 percent in Chicago, compared with a 6 percent unemployment rate

U R B A N A L L I A N C E A P P L I C A N T S 2 1
in the city of Chicago in the fourth quarter of 2016. Applicants’ neighborhoods also typically had higher
concentrations of residents of color (appendix B).
TABLE 2
Characteristics of Urban Alliance Applicants’ Neighborhood
All regions Baltimore Chicago Northern Virginia
Washington, DC
Neighborhood economic characteristics Share under the poverty level (mean) 25 27 27 14 25
Less than 10% 12 7 9 34 11
10%–25% 41 40 41 55 38
25%–40% 33 38 32 10 39
More than 40% 14 15 18 1 13
Share unemployed (mean) 14 13 18 5 14
Less than 5% 13 7 6 56 12
5%–10% 25 25 19 44 26
10%–20% 38 54 38 0 36
More than 20% 25 14 38 1 26
Neighborhood demographic characteristics
Share of color (mean) 85 86 90 61 88
Less than 25% 1 3 1 2 1
25%–50% 6 6 4 24 3
50%–75% 16 14 8 52 13
More than 75% 77 78 86 23 83
Number of young people 1,209 289 415 115 390
Sources: Urban Alliance program data; American Community Survey 2013–17 five-year estimates.
Notes: This table does not include data for 226 young people who did not consent to sharing application data or whose addresses
were missing or could not be geocoded.
The schools Urban Alliance targeted for recruitment differed by region. For example, they recruited
more heavily from a smaller number of schools in Northern Virginia—five—with an average of 31 Urban
alliance applicants per school (table 3).
School performance, as measured by standardized tests, varied somewhat across the regions.
Average school proficiency levels ranged from a low of 7 percent in math in Washington, DC, and 17
percent in reading in Baltimore to a high of 62 percent and 81 percent, respectively, in Northern
Virginia. Given that school performance assessments varied across states, we also ranked every school’s
average scores in the state and calculated where the average Urban Alliance student’s school was on
that ranking, from 0 to 100. These rankings ranged from a low of the 23rd and 24th percentile in
Baltimore for math and reading to a high of 49 and 51 percent, respectively, in Washington, DC. Overall,
average school proficiency levels in reading and math were below the state median in each region. We
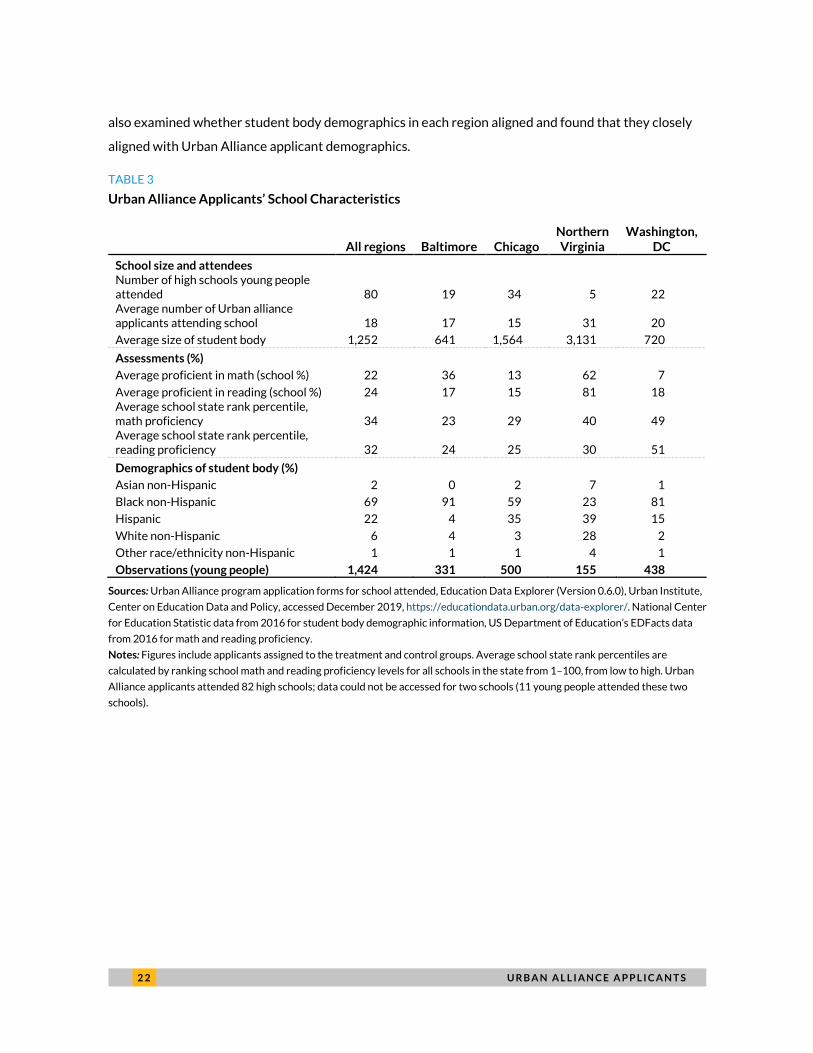
2 2 U R B A N A L L I A N C E A P P L I C A N T S
also examined whether student body demographics in each region aligned and found that they closely
aligned with Urban Alliance applicant demographics.
TABLE 3
Urban Alliance Applicants’ School Characteristics
All regions Baltimore Chicago Northern Virginia
Washington, DC
School size and attendees Number of high schools young people attended 80 19 34 5 22 Average number of Urban alliance applicants attending school 18 17 15 31 20
Average size of student body 1,252 641 1,564 3,131 720
Assessments (%) Average proficient in math (school %) 22 36 13 62 7
Average proficient in reading (school %) 24 17 15 81 18 Average school state rank percentile, math proficiency 34 23 29 40 49 Average school state rank percentile, reading proficiency 32 24 25 30 51
Demographics of student body (%) Asian non-Hispanic 2 0 2 7 1
Black non-Hispanic 69 91 59 23 81
Hispanic 22 4 35 39 15
White non-Hispanic 6 4 3 28 2
Other race/ethnicity non-Hispanic 1 1 1 4 1
Observations (young people) 1,424 331 500 155 438
Sources: Urban Alliance program application forms for school attended, Education Data Explorer (Version 0.6.0), Urban Institute,
Center on Education Data and Policy, accessed December 2019, https://educationdata.urban.org/data-explorer/. National Center
for Education Statistic data from 2016 for student body demographic information, US Department of Education’s EDFacts data
from 2016 for math and reading proficiency.
Notes: Figures include applicants assigned to the treatment and control groups. Average school state rank percentiles are
calculated by ranking school math and reading proficiency levels for all schools in the state from 1–100, from low to high. Urban
Alliance applicants attended 82 high schools; data could not be accessed for two schools (11 young people attended these two
schools).

P R O G R A M I M P L E M E N T A T I O N 2 3
Program Implementation This section presents results from our process study on the implementation of the Urban Alliance’s
internship program, organized by key components identified in the organization’s logic model:
recruitment and application, skills training, internship experience, mentorship, coaching, program
alumni and alumni services, and overall program fidelity.
Recruitment and Application
This subsection systematically examines recruitment and application as observed in each of the four
study sites. This is the first step in the program, which first entails defining the target population,
devising a method to identify that population, and then recruiting that population.
Urban Alliance worked closely with staff at schools within targeted districts to recruit students.
Recruitment consisted of first securing permission from school administrators to operate in the school
and then collaborating with counselors, teachers, and other staff to identify eligible students within the
target population, publicizing the program, working with students to fill out the application and receive
all necessary paperwork, and engaging students until pre-work began. This process mostly took place in
the spring semester of the students’ junior year to facilitate senior-year scheduling around program
commitments, although final recruitment efforts often extended into early fall of students’ senior year.
Program coordinators followed the Urban Alliance model in targeting young people for the
Internship Program. In practice, program coordinators looked specifically for three elements when
recruiting students: a GPA between 2.0 and 3.0, flexibility in their schedule senior year to accommodate
internship hours, and on-track graduation status. However, some students were admitted with GPAs
under the threshold because, in the words of one program coordinator, “GPA doesn’t always tell the
whole story,” as students could be a good fit for a professional workplace but academically struggling.
Conversely, students with GPAs much higher than 3.0 were often admitted: 43 percent of students who
were admitted reported GPAs of 3.0 or higher in their Urban Alliance applications. Urban Alliance staff
from all regions gave similar descriptions of the eligibility criteria.
School counselors’ application of the eligibility criteria did not always align with the target
population that Urban Alliance staff described. In a survey of school counselors, respondents ranked an
interest in college and having enough credits for early release as the most important eligibility criteria.
School counselors did not prioritize the GPA guidelines or the on-track graduation status requirement.
2 4 P R O G R A M I M P L E M E N T A T I O N
This may have affected the pool of students recruited to the program, because Urban Alliance partially
relied on counselors to identify and refer appropriate students. Despite these inconsistencies, program
staff reported they were generally successful at reaching their target population.
By design, the methods used for recruitment varied across regions and also across schools in each
region. Program staff would often follow the advice of counselors at each school, using a host of
recruitment methods that included setting up tables in the lunch room, visiting classes, presenting to
groups of students that counselors assembled, speaking to individual students that counselors referred,
bringing in program alumni to speak, and discussing the program with parents at PTA meetings. To
reduce burden on students and encourage them to submit applications, program coordinators offered
various options for filling out an application, including bringing paper applications to schools and helping
students fill them out in person, holding recruitment sessions in computer labs to fill out the web-based
version, or encouraging students to fill it out on their own time.
The extent to which Urban Alliance staff engaged with school staff and students was central to
recruitment success. Although the majority of counselors surveyed reported having spoken with Urban
Alliance less than once a month, an Urban Alliance program coordinator described trying to have a
“more visible role at the schools” by maintaining ongoing communication and spreading word about the
program among students “so that Urban Alliance is at the forefront of their minds and not just some
random program that comes in once a year.” In regions where the Urban Alliance program had more of
an established reputation, staff reported that recruitment had gotten easier as the visibility of the
program increased.
Even when students were aware of the program and eligible to apply, applications did not always
make it back to Urban Alliance. School counselors explained that, even if early release was possible,
“kids started to fall off [of the application process] when they couldn’t participate in their sport.” Other
young people did not return the application materials, which require a parent signature, or chose to
participate in other internship programs offered either through their school or other external
organizations. Some students expressed uncertainty about the content of the training sessions and
internship or were concerned that Urban Alliance would not pay them for the pre-work.
The context of each region and the depth of history with the Urban Alliance program influenced the
recruitment process. Important factors included the number of years Urban Alliance had been
operating in the area, the relationship between the program and schools, the recruitment methods that
counselors recommended, and the presence of similar programs. For example, the recruitment process
in newer regions like Northern Virginia was focused partly on establishing strong connections in the

P R O G R A M I M P L E M E N T A T I O N 2 5
schools. Recruiting in Chicago must be completed much earlier, as the Chicago Public Schools
emphasized having students’ schedules arranged by the beginning of senior year and because other
similar youth employment programs competed for student participation. However, across all regions,
the recruitment process was intensive and adapted to fit the context of each school and region.
Skills Training: Pre-work and Workshops
This subsection describes the format of pre-work and workshop training sessions; the nature of the
sessions and trainers’ style; the content trainers covered in the sessions; the methods used to convey
training topics; and the public speaking challenge at the end of the program.
Format
Pre-work trainings began before the youth internships and were typically held after school four days a
week, usually lasting one to two hours over a period of three to six weeks. The length of pre-work varied
by site and program year. In the 2016–17 school year, DC and Chicago had longer pre-work schedules:
five weeks of instruction followed by interviews with young people and job matching for another one
and a half weeks. The Baltimore pre-work schedule was four and a half weeks of instruction followed by
meetings with program coordinators. In Northern Virginia, pre-work was three and a half weeks of
instruction followed by one and a half weeks of interviews with young people and job matching. The pre-
work schedules in the 2017–18 school year were more similar across sites than in the 2016–17 school
year. Baltimore had five and a half weeks of instruction, and the other three sites all had four and a half
weeks of instruction. The process of interviewing young people and job matching was longer in Chicago
in the 2017–18 school year than it was for other sites.
Workshop trainings, which started once internships began, occurred on Friday afternoons, lasting
one to two hours during the school year and half a day once the school year ended. Across regions,
Urban Alliance typically held pre-work and workshop training sessions in classrooms at local
universities or high schools. Rooms were organized as either a typical classroom setting, with rows of
chairs facing the front, or as a computer lab for sessions involving computer work. Urban Alliance often
scheduled sessions concurrently across several rooms, typically with one to two trainers per room for
15 to 25 young people. Urban Alliance staff, such as the program director—who oversees program
coordinators in the regions—or a program coordinator, other trained staff, or outside trainers with
expertise in a certain subject area, such as financial literacy, joined the sessions. Training sessions that

2 6 P R O G R A M I M P L E M E N T A T I O N
required additional space, such as events for all young people to listen and engage with panelists or
guest speakers, were held in larger conference rooms. Generally, rooms were comfortable with
sufficient seating and lighting, conducive to a learning environment.
Focus groups with young people revealed several impressions about the format of training sessions.
Some young people commented that the pre-work curriculum was too long, advocating for a reduction
to two or three weeks. Others mentioned that the length of pre-work was inconsistent across young
people, such that some had a full six weeks of pre-work while others got to complete it in as little as two
weeks, for example if they started the program late. Pre-work attendance data confirmed that there
was variance in the number of pre-work days across young people by site and year.
Transportation to pre-work and workshops was difficult for some young people but not for others.
In Chicago, young people could take buses or trains to pre-work and were given prepaid transportation
cards with funding taken out of their internship checks. In DC and Baltimore, young people could travel
to Urban Alliance activities for free using city travel programs. In Northern Virginia, some schools
offered young people free bus passes, and Urban Alliance encouraged those eligible to use them. Across
sites, some young people traveled for 20 to 30 minutes to get to trainings while others traveled for 45
minutes or more. Lastly, we heard in the focus groups that some young people were not fully aware of
the requirements around training before joining and were surprised by the time commitment of pre-
work in particular.
Style
Observations of both pre-work and workshop training sessions revealed that Urban Alliance trainers
struck a balance between using a serious tone when instructing and also communicating informally with
young people and establishing rapport. Trainers were intentional in creating a relaxed learning
environment for young people, such as by discussing favorite musical artists at the beginning of sessions
and playing pop music during group exercises and breaks. Program coordinators modeled professional
attire for young people during Friday workshops by dressing in business casual or business professional
clothing.
Trainers, especially those who had been with Urban Alliance for a few years, demonstrated a strong
command of the content, smoothly transitioning from one topic to the next and engaging with young
people. Newer trainers were less confident in answering questions specific to the Urban Alliance
program but still appeared to have control of general themes in the content. Trainers responded to and
resolved logistical issues as they arose in real time. For example, during one session on financial aid and

P R O G R A M I M P L E M E N T A T I O N 2 7
completing the FAFSA documentation, it became apparent that many students had already completed
the necessary forms; trainers quickly identified those students and split them out into a different
session. In another session, the trainer gauged that an instructional video on Excel was moving too
quickly for students, so they offered to email the video to students so they could move at their own
pace. When such issues came up or when trainers felt that young people needed additional time to grasp
content, trainers were flexible in adjusting assignment deadlines.
Program coordinators set expectations for young people in training sessions. One region would
often start sessions by repeating ground rules of not speaking over each other and putting cell phones
away. Trainers also attempted to encourage participation throughout the sessions, asking young people
to respond to questions or volunteer opinions and using group activities to stimulate interest. However,
observations of training sessions revealed that maintaining youth interest in the training content was
difficult. During some of our observations, young people often appeared low energy, although they were
still largely paying attention and generally more engaged during group exercises. On the other hand,
young people had high levels of engagement during some training sessions, actively participating when
youth input was solicited. When young people would talk among themselves during sessions or appear
disengaged, trainers would often politely ask them to stop or reengage them in the session. Lateness
was an issue for many sessions, although at times trainers appeared already aware that some young
people would be late.
Focus groups with young people revealed their impressions of trainers and the session style. Young
people commented that trainers work hard to provide useful content and keep them engaged. One
young person appreciated trainers trying to understand where they came from as teenagers, and
another also appreciated the way trainers would respond to questions during the sessions.
Content and Applicability
Urban Alliance devoted significant time and effort to developing training content and disseminating
curricula consistently across regions. The chief program officer and Urban Alliance curricular staff
determined a central curriculum for pre-work and workshops, which they separated into modules. They
also created a program calendar scheduling the general order of content. Program directors in each
region used these documents as a framework when creating their region’s pre-work and workshop
calendars. See figure 2 for a sample pre-work schedule.
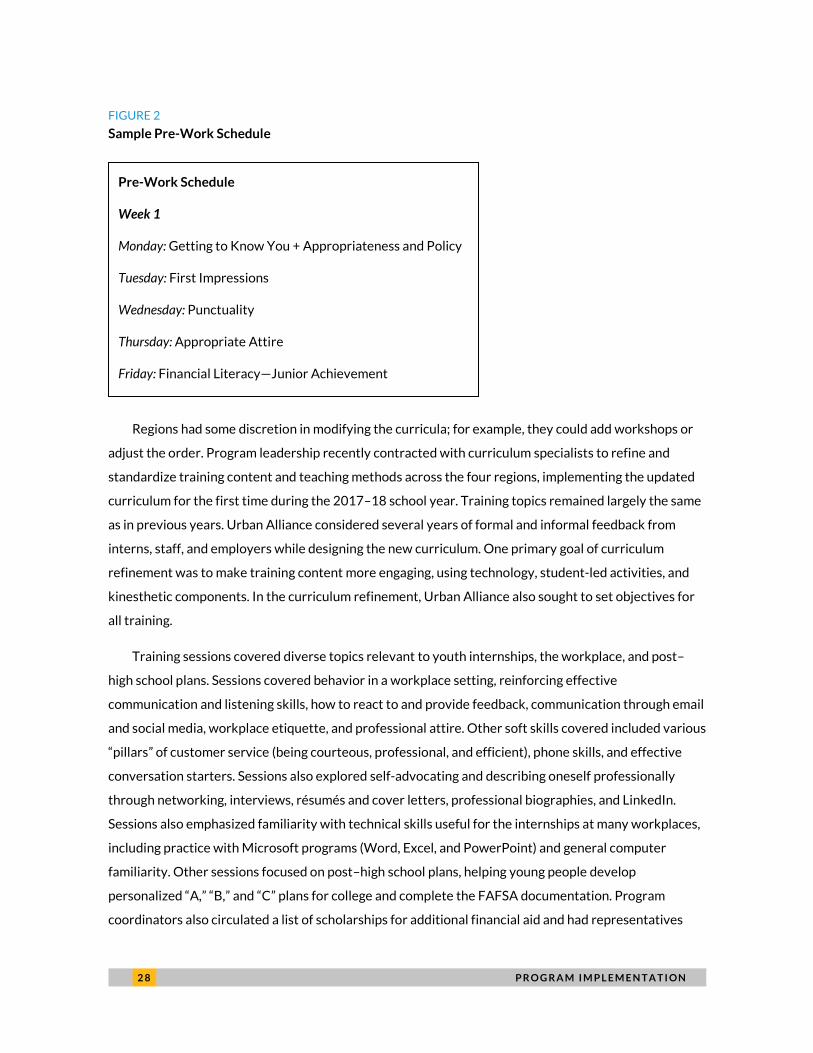
2 8 P R O G R A M I M P L E M E N T A T I O N
FIGURE 2
Sample Pre-Work Schedule
Regions had some discretion in modifying the curricula; for example, they could add workshops or
adjust the order. Program leadership recently contracted with curriculum specialists to refine and
standardize training content and teaching methods across the four regions, implementing the updated
curriculum for the first time during the 2017–18 school year. Training topics remained largely the same
as in previous years. Urban Alliance considered several years of formal and informal feedback from
interns, staff, and employers while designing the new curriculum. One primary goal of curriculum
refinement was to make training content more engaging, using technology, student-led activities, and
kinesthetic components. In the curriculum refinement, Urban Alliance also sought to set objectives for
all training.
Training sessions covered diverse topics relevant to youth internships, the workplace, and post–
high school plans. Sessions covered behavior in a workplace setting, reinforcing effective
communication and listening skills, how to react to and provide feedback, communication through email
and social media, workplace etiquette, and professional attire. Other soft skills covered included various
“pillars” of customer service (being courteous, professional, and efficient), phone skills, and effective
conversation starters. Sessions also explored self-advocating and describing oneself professionally
through networking, interviews, résumés and cover letters, professional biographies, and LinkedIn.
Sessions also emphasized familiarity with technical skills useful for the internships at many workplaces,
including practice with Microsoft programs (Word, Excel, and PowerPoint) and general computer
familiarity. Other sessions focused on post–high school plans, helping young people develop
personalized “A,” “B,” and “C” plans for college and complete the FAFSA documentation. Program
coordinators also circulated a list of scholarships for additional financial aid and had representatives
Pre-Work Schedule
Week 1
Monday: Getting to Know You + Appropriateness and Policy
Tuesday: First Impressions
Wednesday: Punctuality
Thursday: Appropriate Attire
Friday: Financial Literacy—Junior Achievement
P R O G R A M I M P L E M E N T A T I O N 2 9
from various post–high school programs visit and describe resources available to college students.
Lastly, sessions covered general life skills, including financial literacy and budgeting (and also
completing bank account applications), time management, and task management.
All sites covered all or nearly all curriculum topic areas, especially focusing on ethics and etiquette,
professional attire, basic Microsoft Office, interview skills, financial aid and college readiness, interview
preparation, and financial management. Sites also offered region-specific sessions, as well as sessions
featuring a guest speaker covering a topic outside of the core curriculum, such as mental health.
Given how the program year aligns with the college application cycle, staff reported they could not
engage with students as much as they might like in some ways. As an Urban Alliance staff member
reflected, the post–high school content was constrained in that “by the time it gets to workshop time
around October or November, there’s a limited window to apply to certain schools.”
Urban Alliance staff recognized some overlap between their content and traditional high school
curricula. Where there was overlap, Urban Alliance staff saw value in reinforcement, such as asking to
see students’ completed FAFSA documentation.
Young people had mixed responses to the training content. The most common response was that
some content, such as college applications, choosing schools, résumés, and professional attire, repeated
material from high school or other sources. Others thought pre-work could be shortened by dropping
some content related to school and focusing more on content directly applicable to work. Some young
people mentioned having post–high school goals that did not involve college and felt these goals didn’t
have a place within the Urban Alliance programming. Recently, Urban Alliance has begun to add more
programming for students around alternative pathways and postsecondary employment opportunities.
Young people had positive responses as well. Some saw value in the redundancy, reflecting that it
was helpful to review the content and delve a bit deeper. Others reflected that their peers were at
different familiarity levels and had different learning paces. Young people responded positively to
content such as time management, sending follow-up emails after interviews, coming to meetings
prepared, and interview preparation. Others appreciated that Urban Alliance “went deep on the
content,” contrasting it with how in students are taught in high school about what is important without
actionable steps for getting there.
3 0 P R O G R A M I M P L E M E N T A T I O N
I think the soft-skill training, how to communicate, how to make eye contact, how to write an
email, how to dress. I mean, all those conversations need to be had, and they’re not being had
in school. I think that’s where Urban Alliance is filling the gap.
—Mentor, Chicago
The connection of training to the internship experience was usually logical, although trainers did
not always explicitly state that connection in training sessions. Job mentors, while not directly
observing them, generally reviewed the trainings positively, noting that interns were prepared. As one
job mentor said, “What I love about Urban Alliance is they do so much of the professional coaching for
you…I get to do the fun stuff, which is the bonding and the sharing about your life and coaching.” Across
both program years, more than 90 percent of mentors in a job mentor survey indicated that pre-work
trainings and weekly workshops were either very important or somewhat important in improving intern
performance at work.
However, across both cohort years, about half of mentors thought Urban Alliance should provide
additional support or training for interns. Among the most frequently selected additional trainings were
professional etiquette training, training with Microsoft Office and other computer skills, and training
around interpersonal communication skills in an office setting.
Methods
Trainers used various teaching methods to convey session content. Methods mostly involved lecturing
and group discussion, small group activities, and role-playing exercises. Methods used varied with
training content. For example, a session on Microsoft Excel started with an instructional video, followed
by young people doing subsequent handouts on their own as trainers circled to answer questions. Other
content relied on group exercises; for example, in one session the trainer discussed networking and
professional small talk and then had young people pair off and practice professional conversations. In
another session on ethical situations in the workplace, the trainer had young people move to opposite
sides of the room depending on whether they thought a particular situation was ethical or unethical, and
then had them defend their positions. In other sessions, trainers used PowerPoint to convey session
content but had young people ask questions throughout. Some sessions had panelists respond to
questions from program coordinators and other staff, and then from young people.
P R O G R A M I M P L E M E N T A T I O N 3 1
Urban Alliance staff saw training activities as a way to quickly gauge whether young people grasped
the intended content. Trainers were intentional in adding technological components to training sessions
to engage young people both visually and auditorily. Trainers were also intentional with adding
kinesthetic components to workshops, an addition that young people indicated was helpful in
maintaining their interest and participation. Across sites, the strategies trainers used to present content
varied in some ways, but topic areas covered did not vary as much.
Public Speaking Challenge
The internship program ended with a public speaking challenge, during which young people gave
presentations to a panel of volunteer judges describing their internships and post–high school plans.
They were expected to dress professionally for the public speaking challenge and give rehearsed
presentations. Urban Alliance gave interns who met preset goals and expectations a $100 completion
bonus. Interns worked on PowerPoint presentations toward the end of the program and developed
their public speaking skills in pre-work and in workshops.
Several job mentors commented on how the challenge was helpful in encouraging young people to
develop their public speaking skills. One mentor described how her intern enjoyed speaking in front of
people she knew but was uncomfortable speaking in front of people she was unfamiliar with. The
mentor used the public speaking challenge as an opportunity to coach the intern. Some young people
thought the public speaking challenge was less challenging than it should be. One intern expected it to
be more of a competition but instead perceived it as Urban Alliance just giving interns $100 at the end
of the program. Urban Alliance staff, including senior regional leadership, reported struggling to
determine how much to emphasize the public speaking challenge given competing priorities.
Internship Experience
This subsection describes how Urban Alliance matched young people to job sites; what the internship
experience was like for young people; the nature of communication between Urban Alliance staff and
job sites; the efforts Urban Alliance made to attract and retain employer partners; and employer and
intern outlooks on the internship program’s value.

3 2 P R O G R A M I M P L E M E N T A T I O N
Matching Young People to Job Sites
Urban Alliance staff asked young people to list their preferred internship settings and attempted to
place interns at job sites that aligned with their career interests. Program staff considered youth
interests, transportation needs, and how the intern and mentor might work together when matching
young people with employers. One staff member noted an “all hands on deck” effort “to get to know the
students to see what best matches for them for their internship.” Staff tried to get to know both the
employer and mentor to make a good match.
Several factors, however, constrained their ability to do so. Staff had a limited pool of employers
each year, and their first priority was to place all young people in an internship regardless of the
employer type. Further, some young people who joined later in the year had a lower chance of matching
with a preferred internship site because fewer job sites remained. Staff decided not to place a young
person in an environment where they seemed likely to struggle, even if he or she expressed interest in
getting experience with that employer type. Staff matched interns who displayed relatively weak
professional etiquette or other soft skills during pre-work with experienced youth mentors, who they
believed would use their experience to best support the interns and invest more time in ensuring that
the interns grew in their internships.
Employer preferences also played a role in the matching process. Program staff solicited input from
employers through questionnaires about what they were looking for in interns to help with matching.
Also, some mentors interviewed interns and selected one who seemed the best fit for their workplace. A
staff member in a regional leadership position clarified that Urban Alliance only arranges this if partners
feel that interviewing prospective interns is necessary. In these cases, job partners may have selected
interns with desired skill sets over others who expressed interest in in that career field.
Additionally, staff considered commute times between interns’ schools, homes, and prospective
internship sites to try to minimize interns’ travel burden. This factor was most significant in Chicago, the
largest region, and in Baltimore, where public transportation can be slow and unreliable. A staff member
in Baltimore explained that “we have this rule that it should take less than an hour for a student to go
from school to work, and then an hour to go from work to home.”
After Urban Alliance matched interns to job sites, each region held a fall kickoff event for Urban
Alliance staff, interns, and job mentors. Urban Alliance typically invited parents as well, and program
staff presented them with an overview of the program and expectations for interns. Young people had
the chance to meet their mentor, if present, and to network with other mentors and young people. This

P R O G R A M I M P L E M E N T A T I O N 3 3
event typically coincided with a mentor orientation session, introducing mentors to the program and
Urban Alliance’s expectations for young people and mentors.
Young people who completed pre-work training generally began internships in October or
November, although slightly more than a third started later—sometimes as late as February or March.
Reasons for late internship start dates included insufficient job placement slots available to place all
interns immediately following pre-work and the inability of some young people to arrange an early-
release schedule until the second semester of their senior year.
Internship Experience
Urban Alliance placed young people at a diverse set of job partners, including corporate, government,
and nonprofit organizations. Private companies hosted nearly half of all interns (48 percent), followed
by nonprofits (34 percent) and the government (17 percent) (table 4). The most common employer
types were somewhat region specific. Federal and university settings dominated in Northern Virginia.
Baltimore and Chicago placed many interns in hotels and banks, though Chicago also partnered with a
growing number of technology companies. The Washington, DC, program had a mix of federal,
corporate, and nonprofit job partners.
During the implementation study period, most interns worked in an office setting, though these
varied greatly—from a human resources office in a hotel basement to an open-concept office of a
technology company headquarters housed in a skyscraper to a call center in an animal shelter. Although
Urban Alliance trained young people on professional attire to prepare them for formal work settings,
some interns noted that many environments had casual dress codes.
All young people participating in internships through Urban Alliance earned money and gained
experience in an office work setting. During the 2016–17 and 2017–18 program years, interns that
were placed at an internship worked an average of 361 hours, earning $4,122 with a starting hourly
wage of $10.79 on average. Interns that completed the program worked an average of 425 hours,
earning an average of $4,774 over the course of the internship, with a starting hourly wage of $10.81 on
average. Interns could earn performance-based raises of up to $1 an hour twice during the program
year. Beginning in the 2017–18 program year, young people could earn a pre-work bonus for pre-work
performance and attendance. Young people also had the opportunity to earn a $100 bonus for receiving
a high performance score at the end-of-year public speaking challenge. Young people who completed
pre-work but were waiting to begin an internship received $100 per two-week pay period before their
internships began. Young people had the opportunity to open a checking and/or savings account. Urban

3 4 P R O G R A M I M P L E M E N T A T I O N
Alliance typically paid them through direct deposit unless there was a problem processing the direct
deposit.
Interns had opportunities to gain the hard skills needed to work in their specific industry and soft
skills that helped increase comfort and performance in any professional setting. The extent to which
young people bolstered these skills during their internship depended not only on individual aptitude,
but also on the opportunities that mentors and staff provided.
Interns often spent considerable time doing entry-level clerical work, with some branching out to
other tasks more than others (table 4). Young people and mentors both indicated through surveys that
filing and data entry were the tasks that interns completed most frequently. However, many young
people and mentors noted that interns’ tasks were often organization specific, such as tutoring children
at an education nonprofit or developing graphics using design software at a technology company. A few
mentors said in interviews that they gave young people increased responsibilities as they proved
themselves to be competent over the course of the internship. In contrast, several mentors mentioned
that their interns’ limited professional soft or hard skills related to writing or using the Microsoft Office
Suite reduced the tasks that staff could assign them.
TABLE 4
Mentor Reported Organizational and Task Descriptions
N %
Organization type (N = 292) Private company 141 48 Nonprofit organization 101 34 Government agency 50 17
Tasks your intern performed on a typical day (select all that apply) (N = 280) Data entry 201 72 Filing 168 60 Research 162 58 Delivering/preparing mail and packages 113 40 Event planning and preparation 104 37 Greeting customers or clients 91 33 Answering phones 79 28 Writing 87 31 Other 117 42
Source: Job mentor survey.
Some mentors we interviewed described making a concerted effort to expose interns to their area
of professional interest; examples included assigning an intern a side project on a topic of interest and
setting up meetings with employees within the company who may have insights on their planned career
field. For example, one mentor explained that her intern was “really interested in communications, so
P R O G R A M I M P L E M E N T A T I O N 3 5
we made sure to set up a meeting with our communications director, so…that we could really make sure
she gets a chance to talk to someone who’s a little farther in their career about it, and maybe what their
path was to get there.”
Some staff, young people, and mentors we spoke with mentioned that interns did not always have
enough assigned tasks to fill their time. A few staff members and interns said low workload negatively
affected job satisfaction, with one intern saying, “I did really nothing and [sat] down all day.” But others
noted that down time allowed interns the flexibility to complete personal tasks. An intern said, “I have a
lot of free time at work so I can do homework and stuff, so I’m never behind on homework or
schoolwork.” Urban Alliance also encouraged mentors to direct young people toward post–high school
planning activities when they lacked other assigned tasks, including college and financial aid
applications, as well as résumés and LinkedIn profiles. Toward the end of the year, some mentors
mentioned that their interns spent time working on their public speaking challenge presentation. Some
mentors reported helping their interns with these external activities.
Communication with Job Sites
Program coordinators were the primary liaisons between Urban Alliance and staff at job partners.
Program coordinators sent weekly email newsletters to mentors with information about Urban Alliance
programming, school events that may have affected interns’ work schedules, and other information
relevant to mentors. Two to three times yearly, program coordinators visited all job sites of interns on
their caseloads. During these visits, they met with each intern and mentor to check on progress, advise
mentors on how to oversee interns, and resolve any challenges that arose. Most mentors we
interviewed who did not experience major performance issues with their interns reported little contact
with program coordinators beyond these visits and felt that additional communication was not needed.
Mentors reported a range of contact frequency with Urban Alliance, with the median being monthly
(table 5).
Program coordinators’ communication with job sites became critical when interns did not perform
satisfactorily on the job. In interviews, mentors and program coordinators reported communicating
more frequently via email and phone when these challenges arose, up to multiple times a week. Program
coordinators also described visiting job sites to meet with mentors and interns and reach a resolution.
Program coordinators reported that mentors typically reached out to them when issues arose, though
some said at times they initiated contact to discuss problems. One program coordinator said, “I feel like
I’m often putting out fires.” Punctuality and attendance were common performance issues that program

3 6 P R O G R A M I M P L E M E N T A T I O N
coordinators tried to resolve. This often involved determining whether the intern had a barrier to
consistent attendance, such as transportation problems, in which case the program coordinator may
have tried to work with the intern on a schedule adjustment. In some cases, interns did not
communicate sufficiently with their mentor when they had a conflict and had to miss work. In these
cases, program coordinators encouraged young people to be more communicative about their
schedules. Unprofessional attire and inappropriate etiquette were other intern performance issues that
mentors leaned on program coordinators to help them resolve.
In cases when unacceptable job performance persisted, program coordinators developed a work
contract with the intern. This agreement detailed Urban Alliance’s expectations and lasted for a
probationary period of several weeks. If a young person violated the terms of the agreement during this
period, he or she would be terminated from the program. Urban Alliance took many steps to prevent
termination of its students. Across young people from the 2017–18 program year, Urban Alliance or
their jobsite terminated about 13 percent of them at some point after placement at an internship.
In interviews, most mentors who experienced performance issues with their interns felt that
program coordinators played an important role in helping them resolve the problem, or, when
necessary, helping them terminate the young people as smoothly as possible. One noted that, thanks to
help from the intern’s program coordinator, “when we did have an intern that wasn’t successful, that
was a painless process, trying to exit.”
Some mentors suggested ways that communication from program staff could be more helpful,
though most were satisfied with the roles that staff played. Nearly seven in ten mentors surveyed
indicated that their interactions with program staff had been very helpful (table 5). Some mentors said
that they would like to have more communication from Urban Alliance about what interns were doing
during pre-work and workshop trainings to align internship tasks with training content. One mentor
mentioned that Urban Alliance may have shared information about trainings in mentor newsletters but
suggested that mentors may not be reading those emails and there may be a better way to communicate
that information.
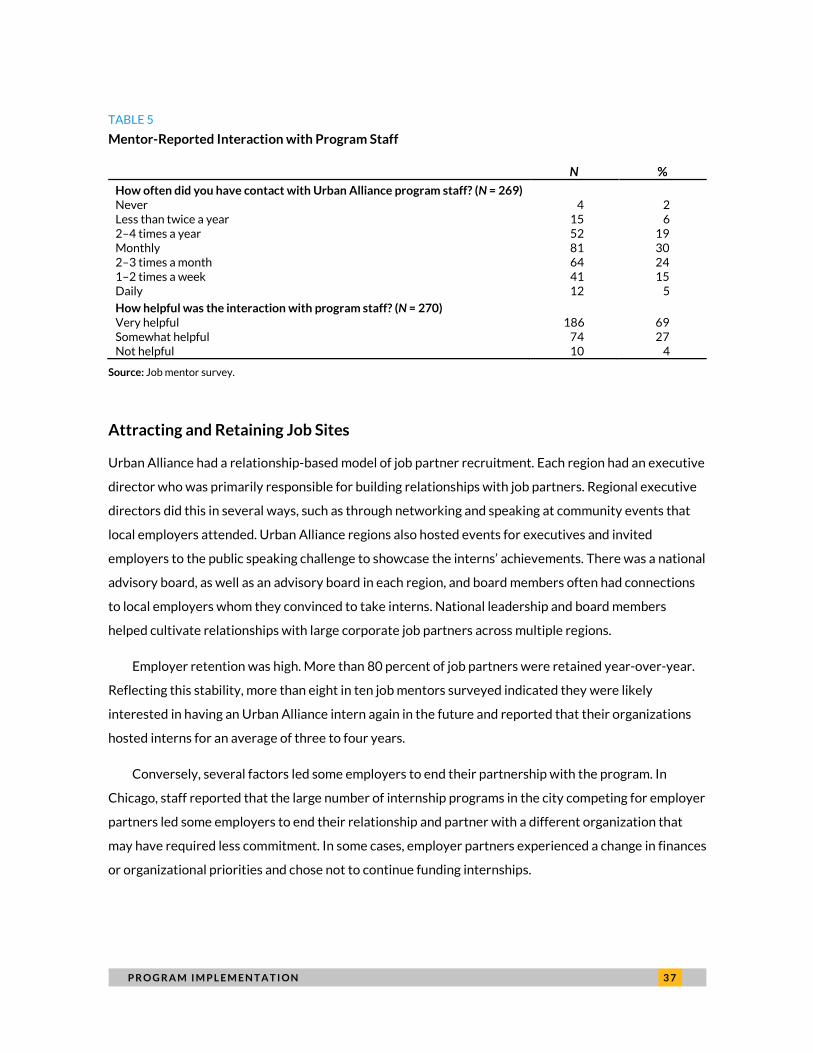
P R O G R A M I M P L E M E N T A T I O N 3 7
TABLE 5
Mentor-Reported Interaction with Program Staff
N %
How often did you have contact with Urban Alliance program staff? (N = 269) Never 4 2 Less than twice a year 15 6 2–4 times a year 52 19 Monthly 81 30 2–3 times a month 64 24 1–2 times a week 41 15 Daily 12 5
How helpful was the interaction with program staff? (N = 270) Very helpful 186 69 Somewhat helpful 74 27 Not helpful 10 4
Source: Job mentor survey.
Attracting and Retaining Job Sites
Urban Alliance had a relationship-based model of job partner recruitment. Each region had an executive
director who was primarily responsible for building relationships with job partners. Regional executive
directors did this in several ways, such as through networking and speaking at community events that
local employers attended. Urban Alliance regions also hosted events for executives and invited
employers to the public speaking challenge to showcase the interns’ achievements. There was a national
advisory board, as well as an advisory board in each region, and board members often had connections
to local employers whom they convinced to take interns. National leadership and board members
helped cultivate relationships with large corporate job partners across multiple regions.
Employer retention was high. More than 80 percent of job partners were retained year-over-year.
Reflecting this stability, more than eight in ten job mentors surveyed indicated they were likely
interested in having an Urban Alliance intern again in the future and reported that their organizations
hosted interns for an average of three to four years.
Conversely, several factors led some employers to end their partnership with the program. In
Chicago, staff reported that the large number of internship programs in the city competing for employer
partners led some employers to end their relationship and partner with a different organization that
may have required less commitment. In some cases, employer partners experienced a change in finances
or organizational priorities and chose not to continue funding internships.

3 8 P R O G R A M I M P L E M E N T A T I O N
Urban Alliance staff worked hard to maintain job partners each year. Program coordinators played
a crucial role in building and maintaining relationships with job sites. Program coordinators worked to
address concerns that job partners had with interns and ensure that mentors felt supported. Across
different levels in the organization, staff articulated that ensuring a mentor has a good experience often
makes it more likely the employer will continue working with the program in the future. If job partners
had a difficult experience with an intern, program staff often tried to make accommodations to
encourage them to take future interns, for instance by arranging for the mentor to interview interns
before accepting them. National and regional leadership communicated frequently with executives at
partner organizations to maintain their commitment. Urban Alliance staff emphasized in interviews that
having executive leadership at job partners invested in the program was critical for retention.
Urban Alliance staff expressed clear ideas about what made a good job partner but also mentioned
that flexibility is needed to serve their targeted number of young people and achieve financial
sustainability. National and regional leadership said that the ideal job partner had leadership who
understood the program and was committed to developing young people. They also felt that job
partners who could serve numerous young people across multiple departments over time were
important for a sustainable program. Program coordinators emphasized the importance of matching
young people with mentors who were willing to take on a nurturing, guiding role that extended beyond
that of a supervisor. However, one national leader said that Urban Alliance “can make anything work”
when it comes to job partners, and others noted the need to accept all job sites who were willing to host
young people and provide donations to support program operations.
Youth Outlook on Internships
Most young people reported feeling that the internship experience was valuable to them, though they
described diverse experiences and shared some common critiques.
Young people had mixed views about how relevant their internship was to their future career.
About half of those surveyed said their internship was somewhat relevant to their future career, with
slightly more than one-third saying it was very relevant and only 13 percent saying it was not relevant at
all (table 6). Most young people said they had not gotten an internship in a field they had indicated
interest in, and some of them expressed disappointment. One young person mentioned that, after
waiting a long time to get placed in an internship, Urban Alliance staff “got my hopes up because they
gave me a position,” but “it was the last option that I wanted to do,” which was a letdown. Some interns
wished that during recruitment the program had been clearer that they would not necessarily get to
P R O G R A M I M P L E M E N T A T I O N 3 9
choose an internship site, though many others said they understood that from the start. Further, in
several cases, interns described enjoying an internship in an unexpected field. One intern explained, “I
ended up working with kids, which is fine, but it wasn’t what I chose...I’m not good with kids. I can grow
and work with kids. I feel like I could grow." Interns who were placed at a job site in their interest area
were generally enthusiastic about the opportunity, including one intern placed at a law firm who said,
“It’s really helpful…I think it’ll help me decide what I’m going to do in college, if I want to follow through
with what I’ve been passionate about or not.”
Most interns we spoke with felt that their internship gave them a useful opportunity to gain more
professionalism. Above other skills, young people we spoke with toward the end of the program year
most often described feeling pleased that their internship helped them become better communicators.
One intern explained, “I struggled a lot with that, especially the first month or something because I
wouldn’t ask any questions. I also, I think this was just my fault, but I just didn’t really say hi to people
and then I realized, oh, that’s rude. And then I learned. And my mentor told me to ask more
questions…That really helped.”
Several interns also said they viewed getting experience in an office setting as valuable. One
mentioned that internships were necessary to get a job because “nobody really wants to hire you
without experience.” Another said, “it’s definitely worth it because it looks good on my resume.” Some
interns said they were grateful for the program because internships are difficult to access in high school,
with one stating, “they place us in a job that we could probably never get into” outside of Urban Alliance.
Some also described having good networking opportunities and meeting professionals who could help
them get a job in the future.
Most interns were also happy with the daily tasks they were asked to perform during their
internship, but some described challenges and frustrations (table 6). Although nearly two-thirds of
surveyed young people indicated they were very satisfied with the mix of tasks they had been assigned,
in focus groups, some described the tasks they had to perform as boring or repetitive. A few mentioned
encountering difficult coworkers who did not explain tasks clearly. Conversely, many others said they
did tasks that were fun, helpful, or both. One intern placed at an organization specializing in booking
public speakers said, “[interning] helped me learn about current events…because we work with different
speakers from all around the world.” Several interns mentioned they got professional experience using
Microsoft Office, which would be useful in future jobs.

4 0 P R O G R A M I M P L E M E N T A T I O N
TABLE 6
Interns’ Satisfaction with Internship Content
N %
Satisfaction with the mix of assigned tasks (N = 134) Very satisfied 87 65 Somewhat satisfied 40 30 Somewhat dissatisfied 7 5 Very dissatisfied 0 0
Internship’s relevance to future career (N = 134)
Very relevant 48 36 Somewhat relevant 69 52 Not relevant at all 17 13
Source: Spring 2017 and 2018 in-program intern surveys.
Employer Outlook on the Internships
Most mentors we received feedback from saw the internship program as potentially valuable to young
people and in many cases felt that they or their organization benefited from taking on interns. That said,
some described challenging experiences with interns they did not expect when entering the program.
Mentors also had different expectations for what value the interns would give to their employer. See
table 7 for more detail on mentor feedback.
Job partners generally viewed their partnership with Urban Alliance as an opportunity to help
young people, though they sometimes saw doing so as directly beneficial to their organization. Nearly
80 percent of mentors surveyed indicated that their organization decided to employ an intern through
Urban Alliance mainly to help young people in the community. An additional 7 percent did so mainly to
fulfill corporate responsibility needs or boost their organization’s image, while 9 percent did so mainly
because their organization was understaffed.
Most mentors we spoke with felt that the internship experience had benefited their interns. Most
described their interns positively and reported seeing improvements in their performance over the
course of the internship. More than three-quarters of mentors indicated that their intern displayed
motivation to learn on the job. Roughly nine in ten reported seeing at least some improvement in their
intern’s skills or in their attitude toward work, confidence, or motivation.
Some mentors we spoke with had substantial complaints about their interns, though only a minority
viewed these challenges as unacceptable or unexpected when working with young people. Some
mentors ultimately felt the need to terminate interns because of poor performance. In most cases,
mentors saw this as a part of an effort to help young people from underresourced communities, some of

P R O G R A M I M P L E M E N T A T I O N 4 1
whom will face challenges performing satisfactorily in an office setting. A smaller share saw this as a
poor reflection on the Urban Alliance screening process and felt that the program should only place
young people in internships who can meet minimum standards of professional conduct. One mentor
who felt that an intern’s lack of communication about scheduling conflicts that affected job attendance
was unacceptable said, “If…I’ve set aside all this work for them to do and it’s time sensitive” and the
intern does not show up to work “it really throws me for a loop.”
Mentors also had differing expectations as to whether the main purpose of the internship was to
benefit the intern or employer. Most indicated that they took on interns mainly to help develop them
professionally and were understanding when they lacked skills that employers expect of employees or
college or graduate interns. For instance, a mentor mentioned that an intern “had barely ever used a
computer before coming to us,” so the mentor’s team had “been working with him to get him
comfortable with that” before giving the intern other tasks. This mentor felt that developing the intern’s
basic skills in this way was an expected part of the process, because “we fully understand that this is
partially a volunteer opportunity.” Others felt that Urban Alliance should do a better job of screening
interns to ensure they are able to complete assignments, including one mentor who said that her intern
had “extremely poor writing and English skills” and that “those skills needed to be much more advanced”
for that office environment, which required writing.
Mentors generally felt that the Urban Alliance trainings provided young people with useful
preparation for their internships, but some offered suggestions for improvement. More than nine in ten
mentors indicated that pre-work and workshop trainings were important for improving interns’ work
performance, though they were split roughly evenly as to whether the program should provide
additional training or support. In interviews and surveys, mentors often mentioned Microsoft Excel and
writing as areas where Urban Alliance should add more training.
A few mentors whose interns had not started their internship until late winter or early spring noted
that the intern would have gotten more out of the experience if they had been placed sooner.

4 2 P R O G R A M I M P L E M E N T A T I O N
TABLE 7
Mentor Outlook on Interns
N %
Main reason the organization decided to employ an Urban Alliance intern (N = 286) Help young people in the community 226 79 Organization was understaffed 27 9 Fulfill corporate social responsibility needs or boost image 21 7 Other 12 4
Intern’s motivation to learn on the job and pursue new learning opportunities (N = 269) Very good 118 44 Good 91 34 Fair 41 15 Poor 15 6 Very poor 4 2
Improvement seen in intern’s skills over the course of the internship (N = 265) Major improvement 115 43 Some improvement 131 49 Limited improvement 19 7
Improvement seen in intern’s attitude toward work, confidence, or motivation (N = 270) Major improvement 125 46 Some improvement 119 44 Limited improvement 26 10
Importance of program activities, for example, pre-work training and weekly workshops, in improving your intern’s performance at work (N = 266) Very important 141 53 Somewhat important 107 40 Not important 18 7
Whether Urban Alliance should add any support or training for interns (N = 269) Yes 130 48 No 139 52
Source: Job mentor survey.
Mentorship
Each employer that hosted an Urban Alliance intern identified one primary mentor for each intern who
was tasked with supervising the intern’s work and serving as a supportive adult figure. Urban Alliance
staff articulated that they viewed a strong mentor as critical for helping young people get the most out
of their time in the program. Feedback from staff, interns, and mentors made it clear that mentors fell
along a spectrum in terms of how much they supported interns. This was attributed to several factors,
including a mentor’s personal motivation, outlook on the role, and preparation they received from
Urban Alliance.
P R O G R A M I M P L E M E N T A T I O N 4 3
It’s crazy. We went on an outing last week, and he was just, like, “That was one of the best
days ever,” and I was, like, “Shut up, dude. You’re going to make me cry.” It was…nice to know
that…it’s clearly making an impact.
—Mentor, Chicago
Mentor Role and Expectations
Urban Alliance staff identified the mentor role as a key component of the model to help young people
succeed after high school. Staff believed that mentors ideally should go beyond assigning interns tasks
and supervising their performance. They stated that mentors should have the patience and conflict
management skills to work through challenges that often arise when employing a young person
unfamiliar with office settings and should take time to develop a trusting relationship and discuss the
intern’s post–high school plans. Committed mentors often shared insight with their interns about how
to start a professional career and looked for opportunities to connect interns with other staff in their
professional network who may have useful information to share. Staff also underscored the importance
of mentors providing interns with meaningful work, which involved making it clear to the intern how his
or her efforts were benefiting a larger team.
Mentors came to the role for different reasons and had different levels of experience working with
young people. The largest share of job mentors we surveyed indicated the main reason their
organization selected them to be a mentor was because they volunteered to help underserved young
people, but almost as many responded that they were either asked or told to do so (table 8).
Conversations with mentors suggested that those who did not volunteer may have been less committed
to the role. Some mentors had years of experience overseeing interns or supervising young people,
while others had no experience before Urban Alliance.

4 4 P R O G R A M I M P L E M E N T A T I O N
TABLE 8
Mentor Reflections on Their Selection
N %
What was the main reason you were selected by your organization to act as a job mentor for an intern? (N = 281) Asked or told 100 36 Volunteered because staff support was needed 24 9 Volunteered to help underserved young people 118 42 Volunteered to help my career development 3 1 Volunteered to improve my mentoring skills 12 4 Other 24 9
Source: Job mentor survey.
Some mentors took an approach to mentoring that closely aligned with what Urban Alliance viewed
as ideal. Others did not. Most mentors we spoke with said that they were focused on going beyond a
supervisory relationship with the interns. When discussing her intern, one mentor said, “We’re really
invested in their personal success and growth. I just talked to [intern] about her college, where she’s
getting accepted to, what her plan is. I think we view our role as a mentor as a very holistic role, and it’s
not just a supervisor.” A small number of mentors described taking a solely supervisory approach, and
Urban Alliance staff at different levels suggested many mentors did not fully buy into providing the
mentorship role the program envisioned.
Recognizing there was room to improve mentors’ understanding of the program’s expectations for
their role, Urban Alliance staff have tried in recent years to focus more on mentor development. Each
region has worked to make the mentor orientation session more robust. Whereas in the past these
sessions focused mostly on introducing mentors to the main elements of the Urban Alliance program
and the logistical aspects of the mentor role—for example, what interns’ schedules will look like and how
to sign off on time sheets—the updated orientations include additional information about youth
development principles and what being an effective mentor looks like. One region invited a guest
speaker from an organization focused on youth mentorship to introduce best practices. The regional
programs have also started to host events for mentors throughout the year, including in-person
trainings, happy hours, and webinars.
Still, staff commented that there was room for additional improvements in the art of mentoring and
in preparing mentors to fulfill the program’s expectations. Several program coordinators and program
directors said they wished that Urban Alliance could screen mentors to ensure they were committed to
the role. They generally recognized that attracting job partners often had to take precedence over
screening for mentor quality but emphasized that ensuring mentor commitment was vital to setting up

P R O G R A M I M P L E M E N T A T I O N 4 5
young people for a meaningful internship experience. One regional leader suggested developing a more
extensive training curriculum for mentors.
Additionally, while mentors who attended the orientation sessions generally found them helpful,
some offered suggestions for how to help mentors better support young people. One suggested
providing additional guidance on how to plan task assignments for interns and said that creating an
online venue for mentors to share ideas with each other would be helpful. Some mentors noted that
they were unable to attend the orientation, either because they were not the intern’s original mentor or
because of a scheduling conflict. A few of these mentors felt that conversations with program
coordinators in place of the orientation did not adequately prepare them for the role.
Mentor-Intern Relationship
Feedback we received from mentors and interns through conversations and surveys suggests that most
interns had positive relationships with their mentors, though the nature of these relationships varied
substantially.
Mentors were typically in regular contact with interns, though what that looked like varied. Most
surveyed interns (nearly 60 percent) reported that they spoke with their mentor at least once a day. A
majority of both mentors and interns reported that they discussed both work tasks and the intern’s
career and education. In interviews and focus groups, mentors and interns described supervision
structures that varied according to the nature of the workplace. Some mentors described meeting with
their interns throughout the day because they needed to provide consistent guidance on tasks, while
others said that they fit in meetings around an irregular schedule. Some held informal meetings at the
intern’s desk, while others had regularly scheduled supervision sessions in the mentor’s office. Some
interns also had relationships with multiple staff members who provided mentorship or assigned tasks.
Interns expressed mixed views on their relationships with their mentors. Most young people
reported in surveys that their mentors were interested in what they did and that they looked forward to
meeting with their mentor. Most young people also said their mentors had time to devote to mentoring
and that their mentors motivated them to do well at work. More than eight in ten young people
predicted that they would keep in touch with their mentor after their internship ended. On the other
hand, most interns wished that their mentors knew them better and less than half indicated that they
would feel very comfortable telling their mentor about a mistake they made at work.
4 6 P R O G R A M I M P L E M E N T A T I O N
These mixed reviews reflected the diverse relationships the mentors and interns described having
with one another during our interviews and focus groups. Some interns reported having close, casual
relationships with their mentors, including one who explained, “My mentor, he was real cool…he has a
great, positive attitude…sometimes I might crack a few jokes here and there because he’s positive.”
Some mentors described similar experiences, including one who said, “I think my role as a mentor is
being friendly but not being friends…it’s not like we’re just a straight business, but we can have fun
here.” Others said that their relationships were more formal. One mentor in this category described
weekly meetings with her interns, where “I really sat down and laid out what their work was going to be,
what the expectations were for working here, and then what projects I needed to be communicated on. I
would have them send recaps at the end of the week to me on where they were.” Some young people
mentioned they had changed mentors during their internship because their original mentor left or
decided to transition out of the role; a few described a more distant relationship with their newer
mentor.
Coaching: Program Coordinators
Coaching and Youth Support
Program coordinators supported each participating young person in their caseload throughout the
program year to aid their successful completion of the program and post–high school transition.
This support took many forms and varied according to each participant’s needs. Young people and
program coordinators reported a two-way relationship, where both parties contacted one another as
issues arose. Most program coordinators reported checking in with young people on their caseloads at
least once a week in addition to their in-person training sessions. If a young person was not struggling,
program coordinators often reached out to ask them about how internships were going or to connect
them with scholarship opportunities. Beyond this, contacts varied widely. Young people reported
reaching out to their program coordinator from as much as every day to as little as once a month. Both
program coordinators and young people usually texted to communicate because young people were
generally most comfortable communicating this way, though some also used email regularly.
Program coordinators all reported being in contact with young people on their caseloads after work
hours, though some set firmer boundaries than others. Most had an informal cutoff time during the
week when they would no longer respond, including one who said, “I usually stop responding to text
messages by around 7:30, 8:00 p.m.,” and another who said, “My cutoff is 9:00 p.m.” Both program

P R O G R A M I M P L E M E N T A T I O N 4 7
coordinators noted that they receive calls and texts after this hour and on weekends but usually only
respond during those times in emergencies. Others had looser boundaries, including one who
confessed, “I really tried to work hard with those boundaries and not responding to text messages over
the weekend or phone calls,” but “I’ve been starting to respond to them over the weekend because then
I have a lot of stuff to do during the week, and I’m, like…this is a quick response.”
Program coordinators had a consensus that some young people needed more support than others,
so the best way to approach the job was to focus most contact on those who needed greater support to
get through the program. One contended, “there are students in our program who are going to be
successful with or without our program,” but “for the students who really need this program,” individual
attention is more beneficial. Another explained, “most students I talk to every week,” but students like
the one whose “parent is rarely at home and he has to oversee his little brother and he has attendance
issues at school. For him, it’s every day I’m talking to him via text because he needed that accountability
and I think he needs someone to notice if he’s there or not there.” These personal challenges often led to
frequent contact between young people and program coordinators. A different program coordinator
recalled, “I had an intern talk to me about her health situation and abuse” and they worked with the
student to get her the help she needed so she could concentrate on school and Urban Alliance program.
Most frequently, young people were in contact with their program coordinators because of
scheduling or other logistical concerns. Students often contacted their program coordinators when they
planned to miss or be late to work or training, with one intern explaining that competing activities at
school were a reason for contact: “Recently my prom and stuff was coming up. I needed to know if I
made my 24 hours in that week I was working, would I still get paid for it instead of doing it over the two
weeks because I knew I wasn’t going to be into work the next week.” Program coordinators checked up
on students who missed work or training without first contacting them to avoid future attendance
issues and stress the importance of attendance. Additionally, a program coordinator noted, “I will often
times text [young people] and remind them of things. If there’s something going on at work that I know
about and I know that is important, I’ll send them a text reminder.”
Several job mentors described how much they appreciated having a program coordinator available
to help address issues that arose with interns. One mentor who took on an intern who Urban Alliance
terminated from the program for unprofessional conduct at work reflected, “It was hard because you
could tell how much Urban Alliance really wants to keep that intern and try their hardest to invest in
them,” but when it became clear that the intern would not be able to meet expectations, the program
coordinator “was definitely behind us, and she came onsite for when we exited [the intern] and had a
follow-up meeting with him after and handled all that. Couldn’t ask for anything more.” A few other
4 8 P R O G R A M I M P L E M E N T A T I O N
mentors mentioned it was nice not to have be a disciplinarian or explain basic rules of professionalism,
knowing that the program coordinator would play that role.
At times, program coordinators were in contact with school staff to work through challenges young
people had balancing their Urban Alliance commitments with academic and other school obligations.
Urban Alliance staff often encouraged young people to fulfill their school commitments first to ensure
they were on track to graduate before engaging in Urban Alliance activities. In a few cases, they decided
after consulting with school staff that a young person was struggling too much in school to continue in
the internship program. A few school staff members reported checking in with program coordinators
throughout the school year on students’ performance, including in-person visits, and finding this helpful,
though others did not report having significant contact.
Post–High School Planning
The dedicated in-person time program coordinators had with young people on their caseloads was
during one-on-one sessions—training sessions reserved for individual check-ins focused on post–high
school planning. Regional teams scheduled two or three sessions throughout the program year,
assigning short blocks of time (typically 30 minutes) for each young person to meet with their program
coordinator. During these sessions, program coordinators asked questions on topics such as where the
intern had been accepted to college and the status of their financial aid applications. Once internships
started, some sessions included check-ins on how internships were going and preparations for program
coordinators’ job site visits. Some sessions lasted longer than others; for example, in instances where
young people had particularly close relationships with their program coordinators or where they
needed more help with post–high school planning.
Staff felt that these sessions were essential for providing tailored post–high school planning and
other support to young people. Several program coordinators described finding most of the personal
information they knew about young people on their caseloads during these sessions. One program
coordinator asserted, “It’s just impossible for me otherwise without a one-on-one to really get to know
my students and really get an idea of where they’re going.” This program coordinator gave the example
of learning in a one-on-one session that a young person was a DACA (Deferred Action for Childhood
Arrivals) recipient and consequently had restricted access to financial aid. Having this information
allowed the program coordinator to seek out useful resources for this student.
Still, a few staff members noted limitations in their ability to steer young people toward post–high
school success. A program coordinator said that Urban Alliance staff are “in a tough predicament with

P R O G R A M I M P L E M E N T A T I O N 4 9
the students” because they do not meet one-on-one with them until well into the fall semester of their
senior year, and this means that, in many cases, “They’ve already applied to college, but they haven’t
heard back. We don’t really have the chance to inform them and guide them through the application
process.” Urban Alliance has tried to address this by adding additional post–high school planning
material to the pre-work curriculum. Moreover, despite limitations, the program has had some success
in steering students’ trajectories, including one student who related, “I was going through some things at
the end of my 12th grade year, and I haven’t really applied to any colleges, but after I talked with [a
program coordinator] about staying on the right track, I applied and got accepted into [a local
community college], and I got a scholarship—won two scholarships.”
Program Coordinator Role
Program coordinators were often early career professionals interested in making a difference for young
people. All new program coordinators needed to have a bachelor’s degree and several entered the role
with a master’s degree. A few program coordinators had degrees in social work, while several had
degrees in education. Although a few started their positions as new college graduates, most had some
prior work experience. The most common previous professional experiences included K–12 education
and roles at other nonprofits serving young people and communities. Program coordinators typically
were attracted to the job because it provided opportunities to work directly with young people to help
them succeed.
Given their diverse backgrounds, program coordinators tended to excel in different aspects of the
role. A program director described the diverse strengths among the local program coordinators,
explaining, “Some people are really great at certain aspects of the job, and some people are great at
other aspects of the job…we have one program coordinator who’s really good at connecting with young
people. Our young people go to her for questions. They reach out. They trust her. Some program
coordinators are really good at that student management piece. Other program coordinators are
amazing at the company relationship piece.” Another program director noted that having trained social
workers and teachers as program coordinators brought valuable resources to the team.
Overall, supervisory staff spoke highly of their program coordinators. One program director stated
that program coordinators’ “dedication to the students and them being successful” is their biggest
strength. An executive director in one region said that the region’s program coordinators “have a very
clear passion for young people and always go above and beyond for them,” in addition to supporting
their colleagues.
5 0 P R O G R A M I M P L E M E N T A T I O N
Most young people also expressed appreciation for their program coordinators. While a few felt
that their program coordinators checked in on them more than necessary or gave them assignments
without enough notice, most described them as supportive and helpful. Young people commonly
described their program coordinators as “nice” and “considerate.” Several said they felt comfortable
discussing personal problems with their program coordinator, and many mentioned constructive advice
or resources they had received from them. For instance, one intern who had applied for a college
scholarship explained, “[my program coordinator] came to me to talk to me about the scholarship
opportunity and help me through the process of it.”
Although staff generally described program coordinators as dedicated and broadly competent,
many felt that they were not always prepared for the wide array of tasks involved. A few staff members
in different roles mentioned that program coordinators were not trained as well as they could be in
specific areas relevant to their role supporting young people, including post–high school planning and
trauma-informed care. Though Urban Alliance provided limited professional development dollars and
some internal training in these areas, several staff members did not think preparation went far enough.
One program coordinator mentioned having to draw on the “different experience and different
expertise” of colleagues from previous jobs “as things come up with the [young people],” but there were
times when the team could have used additional training to prepare them to deal with challenges.
Some supervisory staff members identified time management as an area for improvement among
their program coordinators, but coordinators expressed how difficult it could be to manage their time
because they had to juggle multiple responsibilities. Several described the challenge of wearing many
hats at once, including spending time recruiting young people and maintaining relationships with job
sites on top of their work with current interns. Program coordinators nearly universally felt that their
caseloads were too large to deliver the depth of one-on-one support they wanted to provide, leaving
many feeling overextended as they tried to help everyone. Urban Alliance aims for caseloads of about
30, but at times staffing shortages have pushed that number higher. One program coordinator said,
“[With a smaller caseload,] I think I would be able to arrange for a lot more just one-on-one time” with
the young people and that smaller class sizes at workshops would make it easier to keep them engaged.
Program coordinator workload appeared to be the primary factor negatively affecting job
satisfaction and retention. Several program coordinators across regions mentioned being overworked
and undersupported, and they often connected this to turnover. A program coordinator asserted, “I
think the role is exhausting. I see why there’s a lot of turnover for us as [program coordinators].”
Another maintained, “I don’t believe we’re adequately compensated for what we’re doing,” noting,
“We’ll schedule calls [with youth] on weekends. They’ll call us after hours. We tell them not to. Work
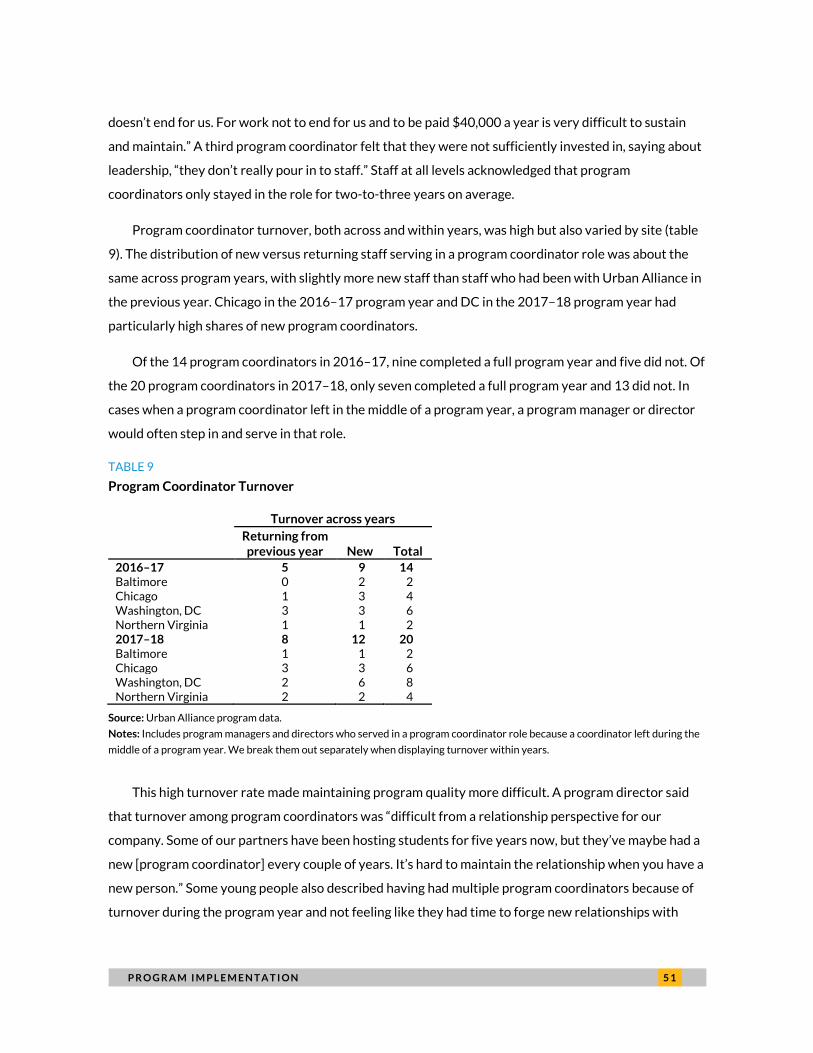
P R O G R A M I M P L E M E N T A T I O N 5 1
doesn’t end for us. For work not to end for us and to be paid $40,000 a year is very difficult to sustain
and maintain.” A third program coordinator felt that they were not sufficiently invested in, saying about
leadership, “they don’t really pour in to staff.” Staff at all levels acknowledged that program
coordinators only stayed in the role for two-to-three years on average.
Program coordinator turnover, both across and within years, was high but also varied by site (table
9). The distribution of new versus returning staff serving in a program coordinator role was about the
same across program years, with slightly more new staff than staff who had been with Urban Alliance in
the previous year. Chicago in the 2016–17 program year and DC in the 2017–18 program year had
particularly high shares of new program coordinators.
Of the 14 program coordinators in 2016–17, nine completed a full program year and five did not. Of
the 20 program coordinators in 2017–18, only seven completed a full program year and 13 did not. In
cases when a program coordinator left in the middle of a program year, a program manager or director
would often step in and serve in that role.
TABLE 9
Program Coordinator Turnover
Turnover across years
Returning from previous year New Total
2016–17 5 9 14 Baltimore 0 2 2 Chicago 1 3 4 Washington, DC 3 3 6 Northern Virginia 1 1 2 2017–18 8 12 20 Baltimore 1 1 2 Chicago 3 3 6 Washington, DC 2 6 8 Northern Virginia 2 2 4
Source: Urban Alliance program data.
Notes: Includes program managers and directors who served in a program coordinator role because a coordinator left during the
middle of a program year. We break them out separately when displaying turnover within years.
This high turnover rate made maintaining program quality more difficult. A program director said
that turnover among program coordinators was “difficult from a relationship perspective for our
company. Some of our partners have been hosting students for five years now, but they’ve maybe had a
new [program coordinator] every couple of years. It’s hard to maintain the relationship when you have a
new person.” Some young people also described having had multiple program coordinators because of
turnover during the program year and not feeling like they had time to forge new relationships with

5 2 P R O G R A M I M P L E M E N T A T I O N
each coordinator. Further, a program coordinator noted that when staff in the position have left, they
took a lot of knowledge about their role and the young people they supported with them that was not
documented. Some amount of turnover is expected of course. For example, the Nonprofit HR 2019
Talent Management Retention Practices Survey found that among 350 organizations surveyed, the
total average turnover for organizations that tracked that data was 21.3 percent (Nonprofit HR 2019).
Turnover among staff serving in the program coordinator capacity appears to be higher than industry
standards.
Post–High School Plans and Alumni Services
Each cohort graduating from the program included young people with plans to follow various post–high
school trajectories. Most involved heading to college. Reflecting Urban Alliance’s priority of ensuring
that each alumnus has a post–high school plan, nearly all young people responding to our survey
indicated they had a plan for what they would do in the fall after high school graduation. Slightly more
than half (53 percent) reported that they planned to enroll in a four-year college, and around one-third
(31 percent) planned to enroll in a two-year college (table 10). Smaller shares indicated that they
planned to complete a technical training program, enter the workforce directly, or join the military. In a
survey of Urban Alliance interns, about half of young people surveyed indicated that participation in the
internship program had affected their post–high school plans.
TABLE 10
Intern Reported Post–High School Plans
N %
Main plans for the fall (N = 130) A four-year college 69 53 A two-year college 40 31 Working (but not more school) 8 6 A technical training program 6 5 Not sure 4 3 Military 2 2
Source: Spring in-program intern survey.
Although most young people reported planning to enter college after high school, several national
and regional staff members acknowledged that college persistence is lower than they would like.
Program leadership discussed reevaluating what constitutes a successful pathway after high school in
light of young people dropping out of college (Theodos et al. 2017). One national staffer explained that,
over the past three-to-four years, Urban Alliance has redefined what success is for their graduates,
P R O G R A M I M P L E M E N T A T I O N 5 3
determining “that it’s not always the traditional track of the four-year, and sometimes that’s not even
the best track for our students, especially nowadays, with the job market and with the expense of
college.” Efforts to expose young people to noncollege options during training sessions, including
vocational training programs and military service, reflect this evolution. Expansions in alumni services
also reflect this changed understanding of what success could look like.
We definitely focus a lot on the one- and two-year-out alumni, and looking at the students
that are not connected to a pathway, and trying to work with them and provide service to get
them onto some sort of pathway that will lead to a more successful future. Something
whether it’s college, whether it’s a program, or whether it’s employment.
—Alumni team member
Urban Alliance has significantly expanded its alumni services over the past several years, further
investing in its mission to put young people on a path toward self-sufficiency. To be considered an
alumnus and have alumni services available, young people were generally required to have completed
all the main program components, including pre-work and workshop trainings, the internship, and the
public speaking challenge. However, in rare instances staff may opt to designate young people as alumni
who have completed most of their internship but must leave early because of conflicts with college
enrollment or other post–high school activities.
Urban Alliance has provided alumni services since 2010, though for much of this time support was
inconsistent and often informal. Alumni who graduated in 2017 and earlier typically kept in contact with
the program mostly through their former program coordinators. Contact usually consisted of informal
conversations about career planning, ad-hoc links to resources, emotional support in challenging times,
networking opportunities, and a resource room where alumni could access job search and educational
materials.
Over the past few years, the organization has substantially expanded its alumni services staff and
formally shifted responsibilities for serving alumni from program coordinators to the alumni services
team. The Washington, DC, region has employed full-time alumni staff off and on since 2010, and
Baltimore has done the same since 2008. Chicago hired a full-time alumni director in 2013 to support its
first cohort of alumni, with Northern Virginia following suit in 2016. For the first time during the 2016–
5 4 P R O G R A M I M P L E M E N T A T I O N
2017 school year, all four regions had a full-time alumni director and Urban Alliance hired a national
director to oversee the regional directors. Alumni directors formally introduced alumni services during
pre-work. Program coordinators identified young people without plans for employment or education
after high school, and alumni directors pulled them out of Friday workshops and provided one-on-one
post–high school planning support. Further, program coordinators referred alumni formerly on their
caseloads to their regional alumni director for support, though program coordinators may keep in touch
with young people informally as well.
Alumni directors focused most of their attention on preventing and resolving disconnection among
recent alumni. They pulled data from the National Student Clearinghouse on college enrollment twice
yearly and called students whose names did not appear as enrolled in the database, with the goal of
supporting entry into either work or an educational program. Alumni directors also sent a monthly
alumni newsletter that highlighted alumni achievements and included links to professional resources
and information about ways to stay engaged with Urban Alliance.
Coinciding with the Urban Alliance’s expanded definition of post-college success, the alumni team
has shaped the services they provide to reflect the fact that being a full-time, four-year college student
is not preferred or possible for many young people who graduate from the program. One Baltimore
program staff member remarked, “We don’t work with too many kids in Baltimore that have, I mean,
honestly, the luxury of being full-time college students. Oftentimes, they are in school in some capacity,
but they are also looking for work to balance it.” In many other cases, students dropped out of school
before attaining a degree and need employment options. Young people who contacted alumni services
were most often looking for work. In response to this need, alumni team members have prioritized
increasing job placement capacity through developing knowledge of and relationships with employers.
Regional alumni directors have also worked to create opportunities for ongoing professional
development and community building among alumni. These include opportunities to volunteer with the
program, such as participating on alumni panels about their successes post–high school and helping with
the public speaking challenge. Urban Alliance has offered paid positions assisting the program to a small
number of alumni as well. Alumni directors have planned an expanded calendar of events to foster
community and create a professional network among alumni, seeking feedback from alumni to shape
event content that is relevant to them. Alumni can stop by their regional Urban Alliance office to obtain
resources and supports around professional opportunities, including help with job search, interview
preparation, study skills, and time management. Alumni of the 2016–17 program year met with Urban
Alliance alumni services for various reasons, primarily involving job search assistance and professional
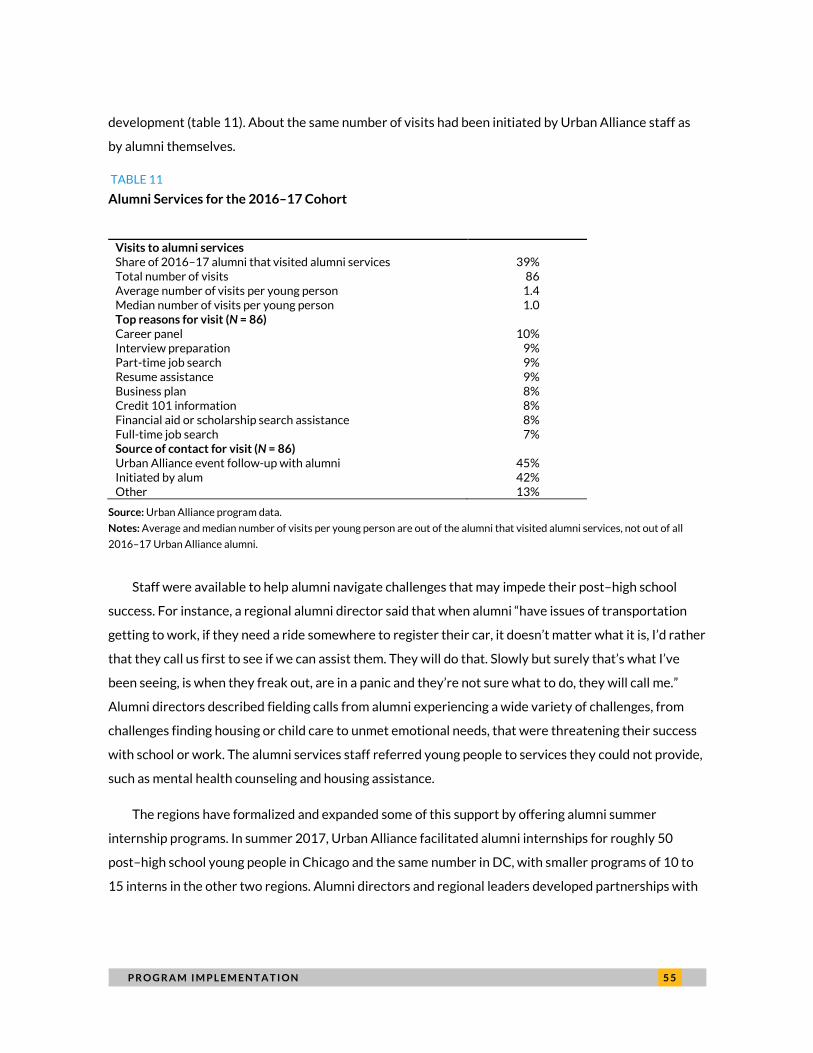
P R O G R A M I M P L E M E N T A T I O N 5 5
development (table 11). About the same number of visits had been initiated by Urban Alliance staff as
by alumni themselves.
TABLE 11
Alumni Services for the 2016–17 Cohort
Visits to alumni services Share of 2016–17 alumni that visited alumni services 39% Total number of visits 86 Average number of visits per young person 1.4 Median number of visits per young person 1.0 Top reasons for visit (N = 86) Career panel 10% Interview preparation 9% Part-time job search 9% Resume assistance 9% Business plan 8% Credit 101 information 8% Financial aid or scholarship search assistance 8% Full-time job search 7% Source of contact for visit (N = 86) Urban Alliance event follow-up with alumni 45% Initiated by alum 42% Other 13%
Source: Urban Alliance program data.
Notes: Average and median number of visits per young person are out of the alumni that visited alumni services, not out of all
2016–17 Urban Alliance alumni.
Staff were available to help alumni navigate challenges that may impede their post–high school
success. For instance, a regional alumni director said that when alumni “have issues of transportation
getting to work, if they need a ride somewhere to register their car, it doesn’t matter what it is, I’d rather
that they call us first to see if we can assist them. They will do that. Slowly but surely that’s what I’ve
been seeing, is when they freak out, are in a panic and they’re not sure what to do, they will call me.”
Alumni directors described fielding calls from alumni experiencing a wide variety of challenges, from
challenges finding housing or child care to unmet emotional needs, that were threatening their success
with school or work. The alumni services staff referred young people to services they could not provide,
such as mental health counseling and housing assistance.
The regions have formalized and expanded some of this support by offering alumni summer
internship programs. In summer 2017, Urban Alliance facilitated alumni internships for roughly 50
post–high school young people in Chicago and the same number in DC, with smaller programs of 10 to
15 interns in the other two regions. Alumni directors and regional leaders developed partnerships with
5 6 P R O G R A M I M P L E M E N T A T I O N
local employers who hosted alumni interns. Alumni directors reached out to potential summer interns
each winter.
The alumni services team has plans to further expand and refine services. A first step is to engage
with more alumni. To do so, Urban Alliance must have up-to-date contact information. Maintaining up-
to-date contact information is challenging because alumni often do not proactively communicate with
Urban Alliance that their information has changed. Staff often search online for updated information. As
of mid-2018, the team was working with Urban Alliance’s data specialists at the national office to
improve the system for tracking this information. The data specialists were also working on developing
a process in the Salesforce data system for program coordinators to flag students for outreach before
they graduate. During the 2017–18 school year, the Northern Virginia region piloted a program to
encourage interns to update their LinkedIn profiles and use the website, with the hope that the alumni
support team would be able to keep in touch with them on that platform after the program’s end. Urban
Alliance is also working on streamlining a collection of post–high school planning data so that they will
be consistent and contain the information the alumni team needs to best serve young people. Finally,
program staff planned to digitize students’ exit plans, which staff intended to use to track alumni
starting with the class of 2017–18.
Alumni directors were working to expand and streamline the alumni post–high school summer
internship programs. They were working to add more internship slots. The DC region was designing a
capstone project, as well as workshops and a required interview. The Baltimore region was developing
relationships with corporations interested in creating employment pipelines for alumni who participate
in summer internships. One program leader in Baltimore explained the team’s approach to engaging
these employers: “How can we be a solution to HR for you? Here’s the young person who’s been vetted.
They’ve gone through our program. How can we get them into your workplace and meet those entry-
level needs?”
The alumni teams began building out alumni advisory boards during the 2017–18 school year, with
the first alumni cohort set to participate after graduating in 2018. Program staff recommended a small
number of interns who had demonstrated leadership potential to apply. Young people who were
accepted participated in meetings (both virtual and in-person) to assist with program operations,
including communications and event planning, and will continue to do so as alumni. The goal of the
alumni advisory boards is to foster leadership and independence among participating alumni and to
strengthen alumni services through more alumni involvement in planning.
P R O G R A M I M P L E M E N T A T I O N 5 7
Regional teams have also had the flexibility to develop innovative and tailored ways to serve their
alumni’s needs. For instance, many graduates of the DC internship program go away to college, meaning
they are likely to interact less with the program in person. To accommodate this, the alumni team places
greater emphasis on online communication. The Baltimore team piloted Graduate Pathfinder Services
(GPS) with 2017 graduates. This program enlisted professionals in the community to serve as mentors
for alumni. These supportive adults checked in on alumni at least monthly, typically via text message or
email, for the first year after high school and offered encouragement and help with resolving challenges.
The former Baltimore alumni services director, who created the program, explained that for some
alumni “things can kind of go awry and I was finding that I wasn't really hearing about those things until,
often, it was too late for me to do a lot.” She asserted that GPS will help free up her time to provide
services as the alumni community grows. Northern Virginia planned to begin implementing GPS for
2019 graduates.
Program Fidelity
We examined the extent to which service receipt for young people who successfully completed the
Urban Alliance High School Internship Program matched program targets. We include a table in
appendix C that defines those program targets, spanning skill training, direct work experience,
mentoring and case management, and alumni services. We found that Urban Alliance met the program
targets with the exception of workshop training attendance and the share of interns reporting high
mentor engagement.
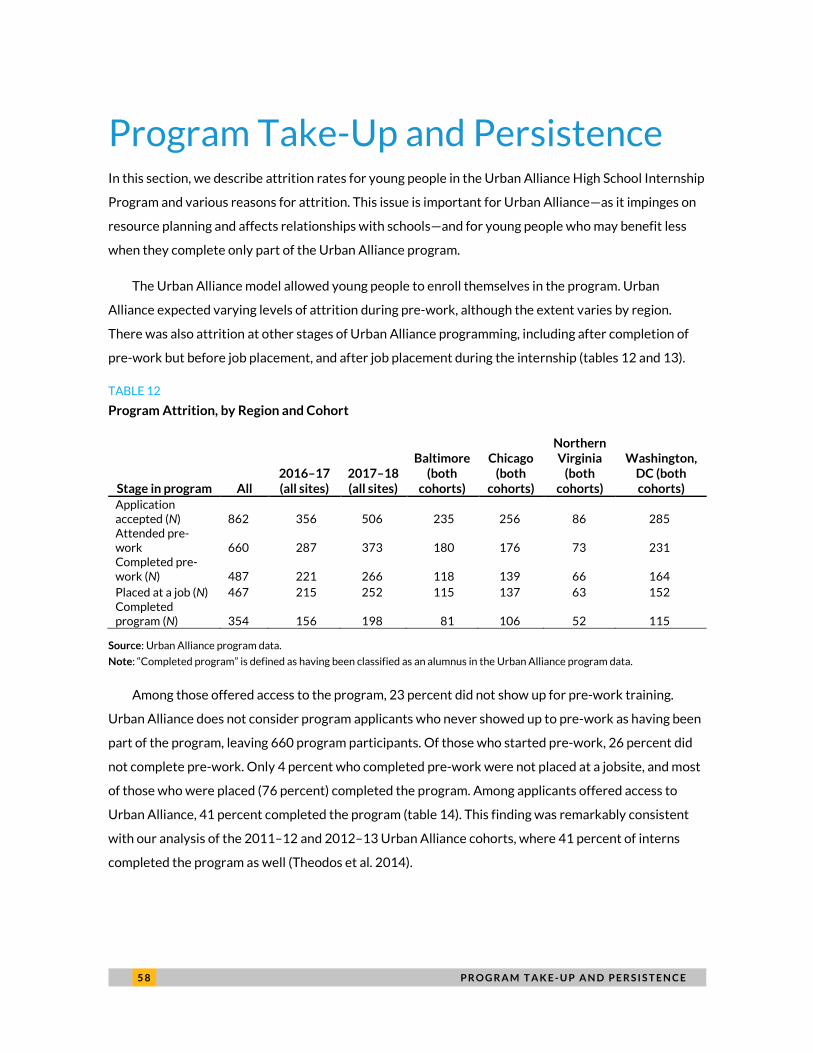
5 8 P R O G R A M T A K E - U P A N D P E R S I S T E N C E
Program Take-Up and Persistence In this section, we describe attrition rates for young people in the Urban Alliance High School Internship
Program and various reasons for attrition. This issue is important for Urban Alliance—as it impinges on
resource planning and affects relationships with schools—and for young people who may benefit less
when they complete only part of the Urban Alliance program.
The Urban Alliance model allowed young people to enroll themselves in the program. Urban
Alliance expected varying levels of attrition during pre-work, although the extent varies by region.
There was also attrition at other stages of Urban Alliance programming, including after completion of
pre-work but before job placement, and after job placement during the internship (tables 12 and 13).
TABLE 12
Program Attrition, by Region and Cohort
Stage in program All 2016–17 (all sites)
2017–18 (all sites)
Baltimore (both
cohorts)
Chicago (both
cohorts)
Northern Virginia
(both cohorts)
Washington, DC (both cohorts)
Application accepted (N) 862 356 506 235 256 86 285 Attended pre-work 660 287 373 180 176 73 231 Completed pre-work (N) 487 221 266 118 139 66 164 Placed at a job (N) 467 215 252 115 137 63 152 Completed program (N) 354 156 198 81 106 52 115
Source: Urban Alliance program data.
Note: “Completed program” is defined as having been classified as an alumnus in the Urban Alliance program data.
Among those offered access to the program, 23 percent did not show up for pre-work training.
Urban Alliance does not consider program applicants who never showed up to pre-work as having been
part of the program, leaving 660 program participants. Of those who started pre-work, 26 percent did
not complete pre-work. Only 4 percent who completed pre-work were not placed at a jobsite, and most
of those who were placed (76 percent) completed the program. Among applicants offered access to
Urban Alliance, 41 percent completed the program (table 14). This finding was remarkably consistent
with our analysis of the 2011–12 and 2012–13 Urban Alliance cohorts, where 41 percent of interns
completed the program as well (Theodos et al. 2014).
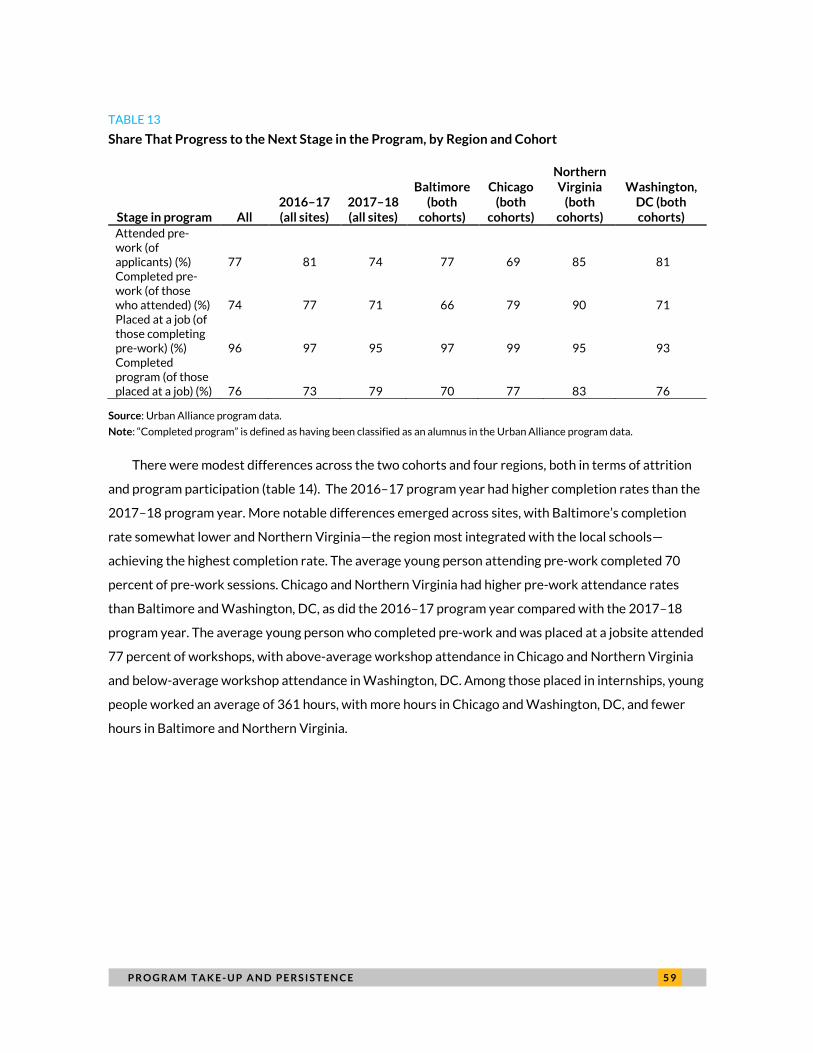
P R O G R A M T A K E - U P A N D P E R S I S T E N C E 5 9
TABLE 13
Share That Progress to the Next Stage in the Program, by Region and Cohort
Stage in program All 2016–17 (all sites)
2017–18 (all sites)
Baltimore (both
cohorts)
Chicago (both
cohorts)
Northern Virginia
(both cohorts)
Washington, DC (both cohorts)
Attended pre-work (of applicants) (%) 77 81 74 77 69 85 81 Completed pre-work (of those who attended) (%) 74 77 71 66 79 90 71 Placed at a job (of those completing pre-work) (%) 96 97 95 97 99 95 93 Completed program (of those placed at a job) (%) 76 73 79 70 77 83 76
Source: Urban Alliance program data.
Note: “Completed program” is defined as having been classified as an alumnus in the Urban Alliance program data.
There were modest differences across the two cohorts and four regions, both in terms of attrition
and program participation (table 14). The 2016–17 program year had higher completion rates than the
2017–18 program year. More notable differences emerged across sites, with Baltimore’s completion
rate somewhat lower and Northern Virginia—the region most integrated with the local schools—
achieving the highest completion rate. The average young person attending pre-work completed 70
percent of pre-work sessions. Chicago and Northern Virginia had higher pre-work attendance rates
than Baltimore and Washington, DC, as did the 2016–17 program year compared with the 2017–18
program year. The average young person who completed pre-work and was placed at a jobsite attended
77 percent of workshops, with above-average workshop attendance in Chicago and Northern Virginia
and below-average workshop attendance in Washington, DC. Among those placed in internships, young
people worked an average of 361 hours, with more hours in Chicago and Washington, DC, and fewer
hours in Baltimore and Northern Virginia.
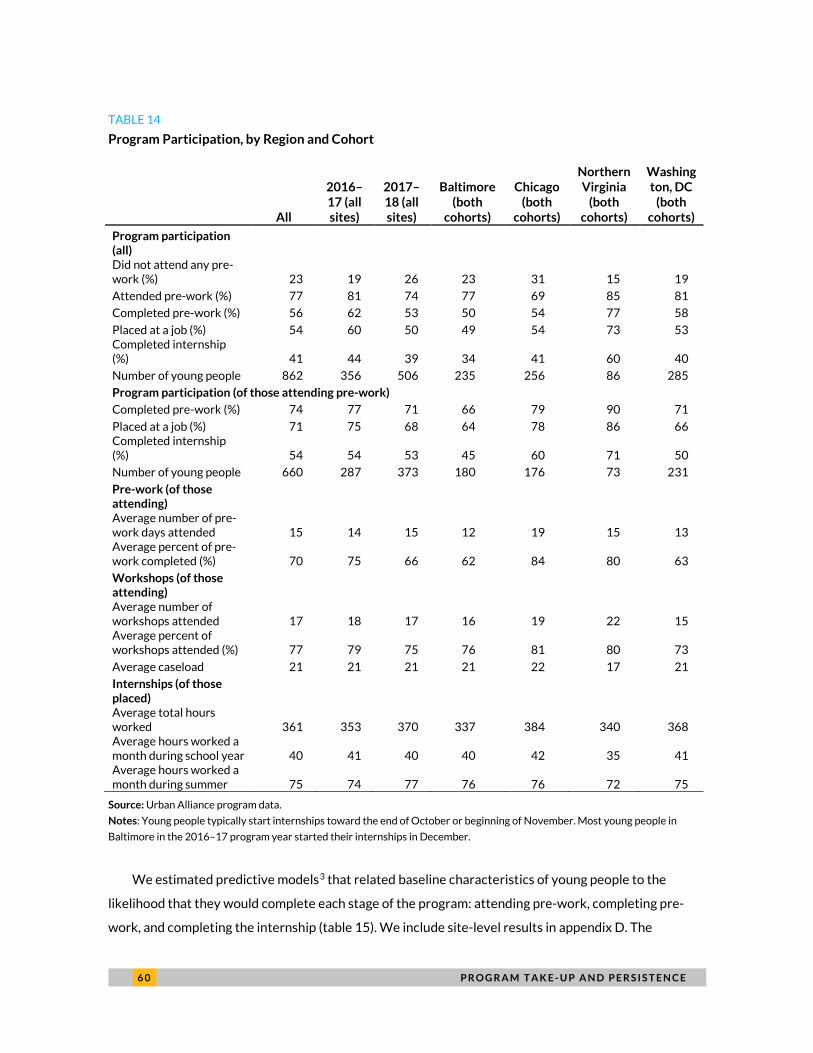
6 0 P R O G R A M T A K E - U P A N D P E R S I S T E N C E
TABLE 14
Program Participation, by Region and Cohort
All
2016–17 (all sites)
2017–18 (all sites)
Baltimore (both
cohorts)
Chicago (both
cohorts)
Northern Virginia
(both cohorts)
Washington, DC
(both cohorts)
Program participation (all)
Did not attend any pre-work (%) 23 19 26 23 31 15 19
Attended pre-work (%) 77 81 74 77 69 85 81
Completed pre-work (%) 56 62 53 50 54 77 58
Placed at a job (%) 54 60 50 49 54 73 53 Completed internship (%) 41 44 39 34 41 60 40
Number of young people 862 356 506 235 256 86 285
Program participation (of those attending pre-work)
Completed pre-work (%) 74 77 71 66 79 90 71
Placed at a job (%) 71 75 68 64 78 86 66 Completed internship (%) 54 54 53 45 60 71 50
Number of young people 660 287 373 180 176 73 231
Pre-work (of those attending) Average number of pre-work days attended 15 14 15 12 19 15 13 Average percent of pre-work completed (%) 70 75 66 62 84 80 63
Workshops (of those attending) Average number of workshops attended 17 18 17 16 19 22 15 Average percent of workshops attended (%) 77 79 75 76 81 80 73
Average caseload 21 21 21 21 22 17 21
Internships (of those placed) Average total hours worked 361 353 370 337 384 340 368 Average hours worked a month during school year 40 41 40 40 42 35 41 Average hours worked a month during summer 75 74 77 76 76 72 75
Source: Urban Alliance program data.
Notes: Young people typically start internships toward the end of October or beginning of November. Most young people in
Baltimore in the 2016–17 program year started their internships in December.
We estimated predictive models3 that related baseline characteristics of young people to the
likelihood that they would complete each stage of the program: attending pre-work, completing pre-
work, and completing the internship (table 15). We include site-level results in appendix D. The

P R O G R A M T A K E - U P A N D P E R S I S T E N C E 6 1
probability of attending pre-work was 12 percentage points higher for students with GPAs of 3.0 to 4.0
than for those with GPAs below 2.0. Program year 2016–17 was associated with a higher rate of
showing up to pre-work and completing pre-work, conditional on attending pre-work, than program
year 2017–18.
Program completion did not vary by gender or by parenting. Young people with a family structure
other than a single-parent or two-parent family were 13 percentage points less likely to complete the
program, conditional on completing pre-work, than young people from a two-parent family structure.
Young people who had previous work experience were 7 percentage points less likely to complete the
program, conditional on completing pre-work, than young people without prior work experience.
We found that an increase in the caseload of a young person’s program coordinator by 10 young
people increased the probability of completing the program, conditional on completing pre-work, by 1
percentage point. The direction of this finding was the opposite of what we had found in our analysis of
the 2011–12 and 2012–13 Urban Alliance cohorts, which found a higher caseload to be negatively
associated with program completion (Theodos et al. 2017). We do not know the exact cause for this
difference. Possible explanations include more young people being assigned to the strongest program
coordinators and young people least likely to complete the program having program coordinators with
smaller caseloads.
The probability of completing an internship was negatively associated with neighborhood poverty
rates. That is, those living in neighborhoods with high poverty levels were less likely to complete the
program than those living in neighborhoods with low poverty levels, controlling for other factors.
Young people from Northern Virginia were 24 percentage points more likely to complete the
program than young people from Baltimore. Young people in Chicago, Northern Virginia, and
Washington, DC, were also more likely to successfully complete pre-work, conditional on attending, but
only Northern Virginia had higher program completion rates.
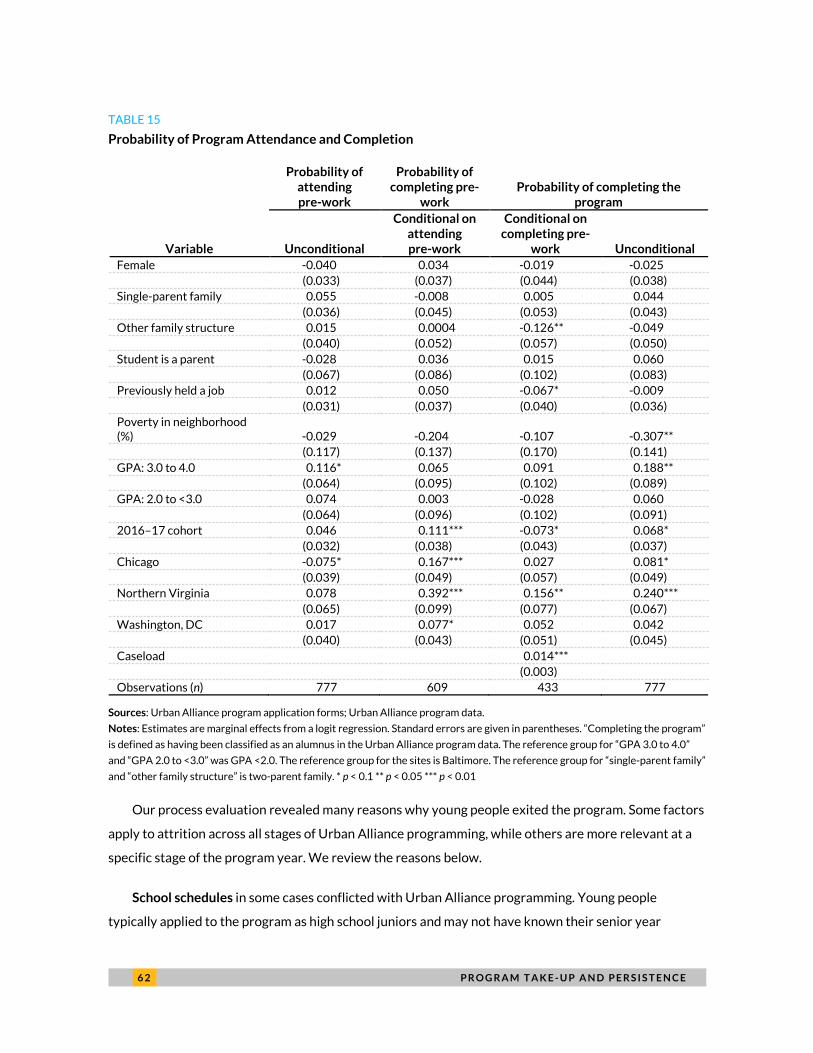
6 2 P R O G R A M T A K E - U P A N D P E R S I S T E N C E
TABLE 15
Probability of Program Attendance and Completion
Probability of attending pre-work
Probability of completing pre-
work Probability of completing the
program
Variable Unconditional
Conditional on attending pre-work
Conditional on completing pre-
work Unconditional Female -0.040 0.034 -0.019 -0.025 (0.033) (0.037) (0.044) (0.038) Single-parent family 0.055 -0.008 0.005 0.044 (0.036) (0.045) (0.053) (0.043) Other family structure 0.015 0.0004 -0.126** -0.049 (0.040) (0.052) (0.057) (0.050) Student is a parent -0.028 0.036 0.015 0.060 (0.067) (0.086) (0.102) (0.083) Previously held a job 0.012 0.050 -0.067* -0.009 (0.031) (0.037) (0.040) (0.036) Poverty in neighborhood (%) -0.029 -0.204 -0.107 -0.307** (0.117) (0.137) (0.170) (0.141) GPA: 3.0 to 4.0 0.116* 0.065 0.091 0.188** (0.064) (0.095) (0.102) (0.089) GPA: 2.0 to <3.0 0.074 0.003 -0.028 0.060 (0.064) (0.096) (0.102) (0.091) 2016–17 cohort 0.046 0.111*** -0.073* 0.068* (0.032) (0.038) (0.043) (0.037) Chicago -0.075* 0.167*** 0.027 0.081* (0.039) (0.049) (0.057) (0.049) Northern Virginia 0.078 0.392*** 0.156** 0.240*** (0.065) (0.099) (0.077) (0.067) Washington, DC 0.017 0.077* 0.052 0.042 (0.040) (0.043) (0.051) (0.045) Caseload 0.014*** (0.003) Observations (n) 777 609 433 777
Sources: Urban Alliance program application forms; Urban Alliance program data.
Notes: Estimates are marginal effects from a logit regression. Standard errors are given in parentheses. “Completing the program”
is defined as having been classified as an alumnus in the Urban Alliance program data. The reference group for “GPA 3.0 to 4.0”
and “GPA 2.0 to <3.0” was GPA <2.0. The reference group for the sites is Baltimore. The reference group for “single-parent family”
and “other family structure” is two-parent family. * p < 0.1 ** p < 0.05 *** p < 0.01
Our process evaluation revealed many reasons why young people exited the program. Some factors
apply to attrition across all stages of Urban Alliance programming, while others are more relevant at a
specific stage of the program year. We review the reasons below.
School schedules in some cases conflicted with Urban Alliance programming. Young people
typically applied to the program as high school juniors and may not have known their senior year
P R O G R A M T A K E - U P A N D P E R S I S T E N C E 6 3
academic schedules and potential conflicts at the time of application. Young people may find out about
changes to their academic schedules at different times throughout their senior year. This could be an
issue during pre-work but also later in the program. Program attrition imposed burdens on schools as
well. One school counselor described how it can be challenging to accommodate student schedules for
the internships: “We’re too big of a school to be changing schedules for kids that get internships. If we
don’t know about the internships at least a week before school starts, their schedule is staying the way
it is.”
Academics also contributed to attrition across various stages of the program. Students sometimes
needed to take additional classes during their senior year to meet graduation requirements. One school
staff member mentioned this was the case for a few Urban Alliance interns at one school and that the
additional classes resulted in fewer hours at their internships, which led to diminished motivation for
completing the program. Additionally, senior year could be a difficult time for students as they make
decisions about what they will do after high school. One noncompleting intern mentioned leaving the
internship because school was getting more stressful: “I just felt like it was either I could work and then
not really care about college or any of that. Or I could just focus on the school.” An Urban Alliance staff
member also acknowledged the importance of academics: “At the end of the day, we’re always gonna
side with the student completing school requirements and graduating.”
After-school commitments also contributed to attrition. Athletics was a particularly demanding
school commitment, especially during the fall semester. As one school staff member said, “Sometimes
for kids it’s a put-off that they can’t be in their sports,” and for students that could win scholarships for
their athletic ability, “athletics will always win over Urban Alliance.”
Another factor was the overall time commitment required to participate in the program. Young
people acknowledged in one focus group that accepted students they knew who ultimately decided not
to participate in the program did so primarily because of the time commitment: “Because a lot of people
they thought it was going to be okay, but then when you realize it actually is a commitment to come
here. We’re teenagers. We have friends. Things happen even during the week…so a lot of people didn’t
want to stick to that commitment.”
An Urban Alliance executive director explained how many young people used the wages they
earned to support their families and that Urban Alliance competes with other local employers that may
offer higher wages or more hours. As one Urban Alliance staff member described, some students left
“because they do the math in their head and somehow they come up with the fact that it’s not enough
money because they’re only working after school.” As the executive director said, “a lot of [young

6 4 P R O G R A M T A K E - U P A N D P E R S I S T E N C E
people] who do leave the program on their own, it’s because they don’t have the luxury of thinking long-
term success at this point.”
The fact that Urban Alliance did not pay young people for pre-work was cited by students and staff
as a contributing factor to attrition during pre-work, especially considering that an internship
placement was not guaranteed. As one Urban Alliance staff member described, “I understand that the
incentive is an opportunity to be in the program and to get paid, but if you think about the way that the
brain works as a [young person], sometimes they need instant gratification, they need instant
incentives.” Pre-work can also be demanding for young people. Indeed, one Urban Alliance staffer
commented that a handful of students left the program after realizing the actual time commitment of
pre-work. Young people who had not completed pre-work mentioned other reasons for leaving the
program, including not meeting requirements for attire and not understanding the program
requirements and length of pre-work, particularly when applying for the program.
There was also attrition among students who successfully completed pre-work, because of the
internship placement process. One school staff member explained how one high-performing student
dropped out of Urban Alliance because she never received an internship placement. The school staff
member also said that for some students, “if they don’t get an immediate placement,” they “lose
motivation and they’ll drop off.”
Workshop location was an obstacle for some students given transportation difficulties. In DC, for
example, the program held workshops in Northwest DC for the 2016–17 program year, which was
difficult for young people living in Southeast DC. Urban Alliance had two workshop locations in the
2017–18 program year to address this. Transportation costs can also be an issue. In Chicago, young
people paid for their own transportation to pre-work, which was a financial burden for some. As a
solution, Urban Alliance staff in Chicago decided to loan young people prepaid transportation cards and
then deduct the amount spent on transportation from future wages for young people who were hired
for an internship.
Forty-one percent of all applicants offered access to the program completed the program. Poor job
performance and low levels of engagement at work can lead to termination of young people, but the bar
for termination is high. A few young people were asked to leave the program during pre-work as well. As
one job mentor from Chicago described, “We took exiting the intern very seriously, and it was a hard
decision for us, but we ultimately decided that it’s a disservice to them to allow poor performance and
poor behavior and not upholding the standards of Urban Alliance and our own company values.”
Another job mentor described how interns not performing well were put on a work employment plan,
P R O G R A M T A K E - U P A N D P E R S I S T E N C E 6 5
and that “worst-case scenario, if someone doesn’t show improvement, eventually we will terminate
someone from a job site.” As one Urban Alliance staffer summarized, “I think if a young person is not
engaged at work, they will not make it through the program and there’s only so much a program
coordinator or program director can do to make a case to an employer.”
A related factor was the adequacy of matching young people to job sites. As one Urban Alliance
staff member described, Urban Alliance didn’t always have the right sites for young people, and “being
placed in a field that you’re not interested in and having to work there 12 hours a week after school and
then the workshop on Friday” is a big ask. Another Urban Alliance staff member commented that “a lot
of what I think we do need to rely on is how seriously is an employer going to take this and what are we
doing to ensure that the mentors and their decisionmakers have a good understanding of what the
purpose of our program is and how can young people be successful in our program.” Other Urban
Alliance staff members also mentioned the importance of having employers who are flexible with
scheduling to accommodate interns’ needs, such as when they need to reduce the number of days at
their internships to focus on academics.
As one Urban Alliance staff member described, the internship commitment and environment can
be a culture shock for young people compared with their high school experiences: “Now they’re placed
into an environment—a lot of our companies are big companies, banks, law firms, fortune 500, where it’s
just the culture of here’s your assignments, do the work, once you’re done then there’s more work…Do
this on a timely basis and not waste time. It’s very different than what many of our students have been
experiencing in school for the last three years in high school.” The time commitment also contributed to
drop-off during the summer. Some Urban Alliance staff described how a handful of students would stop
participating at the end of their senior year after seeing their friends graduate from high school and take
a break during the summer.
Preventing Attrition
Attrition posed challenges for Urban Alliance and its participants. The program had to add one or two
more rounds of pre-work in some regions for late-enrolled young people, who had been admitted to
compensate for drop-off. Attrition affected the participants’ high school academic schedules. School
counselors reported it was much harder for a young person to start a class two months after a semester
had already begun.

6 6 P R O G R A M T A K E - U P A N D P E R S I S T E N C E
Although Urban Alliance expected some degree of attrition each year, the program was especially
interested in curbing attrition among young people who progressed farther along in the program. This
process evaluation revealed several ideas for how to reduce attrition. One Urban Alliance staff member
mentioned how offering course credit for the program was one way to reduce attrition. As the staff
member said, “I think getting a grade—and also, attendance as well, because I know in the other—if
you’re not in a class, then kids treat it as an after-school program, versus a during-the-school program.”
The staff person also thought close partnerships with schools in the district were important for
engaging with young people experiencing difficulties early on. Urban Alliance staff also felt that having
strong relationships with young people was important for reducing attrition. As one Urban Alliance
program coordinator asserted, if young people “don’t think that we care about them doing well in the
program…they’d be more likely to leave.” Another Urban Alliance staff member echoed this sentiment:
“I think that’s the most essential thing in helping our youth to succeed and complete the program, just
being able to have that relationship, them knowing that you’re there for them, and you’re there in their
corner, and that you have their best interests in mind.”

P R O G R A M F U N D I N G A N D C O S T S 6 7
Program Funding and Costs Urban Alliance leadership felt that the organization established a sustainable funding model for the
High School Internship Program. The program was funded through a mix of payments from
organizations employing interns, philanthropic foundations, and government grants and contracts. The
approach was centrally coordinated from the national office. The organization’s chief executive officer
led the effort to cultivate relationships with national funders. Regional executive directors built
relationships with funders at the local level. Executive directors worked with the national development
team to plan around fundraising needs, tracking funding secured each year and anticipated gaps. A
national leader noted that Urban Alliance is “in a unique situation, where we know by the end of the
fiscal year what our expenses are going to be. So at the end of December we know how many students
we’re going to have, how many staff we’re going to have, and what our gap is going to be moving
forward.” This helped leadership be proactive and strategic in closing funding gaps. Urban Alliance
enjoyed the support of several multiyear grants at the regional and national levels that contribute to
ongoing solvency. Moreover, the program benefited from being able to count on roughly 80 percent of
employers returning year-over-year, and many employers contributed a substantial amount of secured
funding in the form of payments to interns.
Interns were either fully funded by the job partner, partially funded by the job partner and by
philanthropic dollars, or fully funded by philanthropic dollars. Urban Alliance raised philanthropic
dollars to fund placements at nonprofits that could not afford the intern payment and has supplemented
these dollars with funding from public sector grants. Historically, the national team has committed to
raising funds to place 25 interns at nonprofits in DC, but they are looking to make this more equitable
across regions. In the other regions, executive directors must secure funding for nonprofit placements
before placing interns at those sites. In some cases, placements were funded by traditional or corporate
philanthropy through gifts to Urban Alliance, while in other cases, placements were funded through the
Urban Alliance budget.
Urban Alliance categorizes internship sites as paid, unpaid-matched, or as unpaid-unmatched.
Roughly 44 percent of interns worked at internship sites that had paid: their internships were paid
either in part or in full by the internship site itself. Almost all (95 percent) interns at paid internship sites
were fully funded by the organizations themselves; the average contribution amount per intern at these
internship sites was $11,995. Slightly more than half of interns (52 percent) worked at internship sites
that Urban Alliance categorizes as unpaid-matched, where the internship site itself did not pay and
Urban Alliance identified funding through a foundation or an individual donor. The remaining 5 percent

6 8 P R O G R A M F U N D I N G A N D C O S T S
of interns were at unpaid-unmatched internship sites, where funding came directly from the Urban
Alliance’s budget. Larger nonprofits, including universities and hospitals, along with for-profit
businesses, were generally expected to contribute a set payment, though this payment varied by region
and was somewhat flexible. Urban Alliance has increasingly been asking smaller nonprofits to pay what
they can to support the program, though only a small number offered a contribution in the years we
observed.
The organization set expected full payment rates at amounts that it determined each region could
absorb. The general cost per intern is $15,000, but this payment amount fluctuated based on the
minimum wage levels. Across both the 2016–17 and 2017–18 school years, full payment amounts were
$10,000 to $12,500 in Baltimore, $12,5000 to $15,000 in Chicago, $10,000 to $12,500 in Northern
Virginia, and $12,500 to $15,000 in DC. A few large employers that have taken on multiple interns for
many years have continued to pay $10,000, though Urban Alliance is working to raise their payments to
a more sustainable amount while preserving these valuable relationships. Urban Alliance leaders
negotiated the payment amount with prospective employers at times, though they were usually unable
to accept payments below $10,000 from employers that fully funded their interns because doing so
made covering costs too difficult. One notable exception to this was if a regional program had more
participating young people than agreed-upon internship slots and an employer offered to take on
interns later in the program year than students would typically start.

O R G A N I Z A T I O N A L G R O W T H A N D C H A N G E 6 9
Organizational Growth and Change Over the past decade, Urban Alliance has steadily expanded its programming, including scaling to serve
new regions. The program, which began in DC in 1996, first expanded to Baltimore in 2008, Chicago in
2012, and Northern Virginia in 2013.
Since this randomized evaluation began, Urban Alliance recently expanded its High School
Internship Program to Montgomery County, Maryland. This expansion came about in the 2017–18
program year, after the local public school system agreed to partner and Urban Alliance obtained
additional grant funding. The Montgomery County program served about 30 young people annually and
had a dedicated program coordinator who recruited and worked with young people in the county,
though the program operated under the leadership of Washington, DC, program staff.
A larger expansion is under way as well. Urban Alliance received funding through an Investing in
Innovation (i3) grant from the US Department of Education to expand its flagship program to a fifth
region. Urban Alliance went through a thorough site selection process to identify a city that would be a
good fit. As one senior national leader noted, “All of our other expansions had come about by requests
from somebody whether it was the mayor’s office or the school districts or a funder. This was the first
time we could be proactive.”
After exploring multiple jurisdictions, national leadership ultimately identified Detroit as the best
new region. The leadership team found an “anchor employer” through connections to an existing job
partner’s senior leadership that was willing to employ at least 30 interns annually in the first two years
to start the new region on strong footing. The City of Detroit was about the size they were looking for—
between the populations of Chicago and Baltimore. The team believed that a city this size could absorb
70 or more interns, which Urban Alliance has determined is the minimum sustainable size at which they
can implement the high school internship model. They also believed that a larger metropolitan area
would be logistically challenging and involve too much competition for employers and young people.
The main challenge Urban Alliance anticipates in operating the Detroit program is the lack of public
transportation in the city. The program plans to lean on the strength of their anchor partner, which is
aware of transportation barriers in Detroit and willing to help young people work around this challenge.
One staff member described the anchor partner as “a once-in-a-lifetime relationship and partnership”
because of the commitment the company has shown. Additionally, the school system in Detroit has
expressed willingness to work with the program and is allowing Urban Alliance to contract buses to
transport participants to trainings.

7 0 O R G A N I Z A T I O N A L G R O W T H A N D C H A N G E
Urban Alliance began enrolling young people in Detroit for the 2018–19 school year. Several
funders covered the start-up costs. Urban Alliance planned to scale the program over the first several
years of operation.
In addition to expanding the flagship program’s reach, Urban Alliance has added various other
youth programming to its portfolio. It previously operated small internship programs for young people
in foster care in Baltimore and Washington, DC. However, the organization stopped working with young
people in foster care after determining this population needed more long-term and wraparound
supports than Urban Alliance could provide to achieve positive employment outcomes.
For many years, staff had considered ways to serve young people before they reach their senior
year of high school, when they may have already missed opportunities to set themselves up for success.
Urban Alliance first began working with young people before the start of their senior year in
Washington, DC, with the support of the World Bank, which has consistently taken on a group of rising
high school juniors and seniors for a six-week summer internship experience.
Urban Alliance received funding to launch a pilot in the 2016–17 school year serving 30 high school
juniors in Fairfax County, Virginia. These students received three hours of basic workforce readiness
skills training weekly and were paid for their time. Urban Alliance has continued to implement the
program in Fairfax County and replicated the model in Chicago beginning in the 2017–18 school year,
serving 60 juniors and 100 sophomores. In partnership with local food access charity Martha’s Table,
the Washington, DC, region implemented a similar program serving 50 juniors and 70 sophomores
beginning in the 2018–19 school year. Trainings were relatively light touch with sophomores and
became more intensive as students progressed through high school. Many younger students
transitioned into the High School Internship Program when they reached their senior year. Staff
believed that these young people benefited from their earlier exposure to workforce skills. Moving
forward, Urban Alliance plans to adjust the training curriculum for sophomores and juniors to make it
more age appropriate and potentially incorporate a work experience element.
Urban Alliance has also operated a workforce training program at Suitland High School in Prince
George’s County, Maryland, first piloted in the 2014–15 school year. Initially, the program served only
seniors, but beginning in the 2017–18 year they began serving sophomores and juniors, adopting a
similar curriculum to the sophomore and junior programs in other regions.
Another program adaptation is in Baltimore, where Urban Alliance has operated two programs
since 2017. Urban Alliance Baltimore’s Career and Technical Education (CTE) High School Internship
Program, in partnership with the Baltimore City Public Schools 21st Century School Buildings Program,
O R G A N I Z A T I O N A L G R O W T H A N D C H A N G E 7 1
connects young people enrolled in vocational training to five-to-six-month internships in the
construction industry, mentorship, and professional soft skills training. In partnership with the
Maryland Society of Surveyors and the Mayor’s Office of Employment Development, Urban Alliance
also manages the Future Surveyors Program, which provides young people enrolled in vocational
courses with summer internships in the land surveying industry, professional soft skills training, and
mentorship. Both programs are ongoing in Baltimore and have not been expanded to other sites.
The Urban Alliance program in Chicago announced a formal partnership with the Obama
Foundation in March 2018 and renamed their Chicago program the Obama Youth Jobs Corps to reflect
this partnership. Urban Alliance and Obama Foundation staff work jointly on fundraising and bringing
new employers on board. This partnership has heightened Urban Alliance’s visibility in Chicago and staff
believe that it will help increase the scale of their programming in the city. As part of its scaling efforts,
the Chicago team was planning to train Chicago school teachers to implement the Urban Alliance
curriculum to expand its reach.
Looking forward, Urban Alliance leaders hope to continue to improve programming and serve more
young people. Several senior staff members noted that expanding to an additional city, while possible, is
unlikely in the near future. Rather, the organization is focusing its resources on deepening relationships
with job partners and mentors, strengthening workforce training curricula, and reaching more young
people with trainings.
7 2 I M P L I C A T I O N S F O R P R A C T I C E
Implications for Practice Helping put young people on the path to success as they transition to adulthood can be challenging. Few
organizations have a proven track record of doing so effectively, but Urban Alliance is one of these
groups. Their model, combining mentorship, work and life skills training, and paid work experience,
demonstrated some success during the initial impact study in delivering the supports young people
need.
Rigorous impact studies are rare in the youth development field and replication impact studies are
rarer still. Understandably, well-meaning nonprofits may be hesitant to expose themselves to the
possibility that an impact evaluation will not find evidence of positive program outcomes. This
possibility remains real with replication studies, which in numerous cases have not found the same
outcomes as the original study (Miller et al. 2005). Urban Alliance should be commended for taking on
this replication study, which gives the organization an opportunity to validate the positive impacts of its
flagship High School Internship Program found in the first study. It also has the opportunity to gain
further insight into regional variation in impacts and how these may relate to fidelity in model
implementation.
Further, Urban Alliance has been proactive in using both internal and external data and evaluation
to improve its practices and has substantial programming improvements to show for these efforts. In
response to recommendations from the first external evaluation, Urban Alliance leadership convened
an Evaluation Advisory Council, which included evaluation and performance management experts, to
examine the study’s implications. This kicked off efforts to improve specific elements of the program
model, including mentor training and the youth training curriculum. The organization has also
undertaken an ongoing effort to examine how program elements combine to influence social-emotional
learning for young people and pinpoint areas for change, including engaging with external working
groups on social-emotional learning, workforce intermediaries, and K–12 education.
Additionally, Urban Alliance has invested in an expanded evaluation team housed at their national
office, which coordinates ongoing data collection on program outcomes. The evaluation team also
solicited ongoing formalized feedback on various aspects of the program from young people, program
staff, and employers. The organization has devoted resources to using this information for continuous
improvement, holding quarterly staff retreats to examine performance and identify priority activities
tied to improvement areas. Changes implemented in response to these efforts have included curriculum
updates and an effort to secure more STEM-focused internships opportunities for young people.
I M P L I C A T I O N S F O R P R A C T I C E 7 3
Despite these considerable successes, the implementation study detailed here revealed several
areas for further consideration. First, although Urban Alliance officially targets middle-of-the-road high
school students—with GPAs between 2.0 and 3.0—for the internship program, the actual population
served varies greatly in academic performance. It may be worth considering how to more narrowly
focus recruitment on the stated target population, because serving a consistent group is important for
aligning the population served to the services that program provides. This may make it more likely that
the young people who would most benefit from the program can access it.
Recruiting within a narrow target population may be difficult because meeting recruiting targets is
often a challenge under current practices. This makes it important for the organization to continue
working to identify the barriers young people face to successful program completion and developing
solutions to alleviate those barriers. Options to consider may include more intensive training on
professionalism for these students, more one-on-one guidance from program coordinators, and
matching highly devoted mentors to students who need extra support. Conversely, higher performing
students may need lighter-touch supports and training.
The training curriculum is another area where the organization has made real improvements but
where continued room for refinement exists. Urban Alliance has invested substantial resources in
updating the curriculum to be more accessible and engaging for young people. Still, young people who
committed to spending significant time in training after school often struggled to concentrate and
seemed restless during trainings. Many young people did not believe all the trainings were helpful.
Urban Alliance should work to make the curriculum even more engaging; this is particularly important
because expanding the training curriculum’s reach to more young people is a key organizational goal in
coming years. Fortunately, Urban Alliance plans to continue refining its curriculum. This should involve
experimentation to identify effective improvements. For example, because some mentors identified
computer skills as a weakness for their interns, Urban Alliance might consider piloting a more intensive
computer proficiency module during the summer before the program year.
Standardizing the curriculum implementation across regions is an additional area for consideration.
Delivering a standard program model across implementing regions may aid in reproducing positive
outcomes (Breitenstein et al. 2010). Through its curriculum revamping, the national team has tried to
introduce standard teaching practices and training content. However, training content delivery
continues to vary by region, and it is unclear to what extent sites truly need different approaches.
Also, the mentorship component of the program could be made even stronger. Evidence suggests
that having supportive adults regularly involved in young people’s lives can make a positive

7 4 I M P L I C A T I O N S F O R P R A C T I C E
impact(Southwick et al. 2007). The dual-support aspect of the Urban Alliance program model, with both
program coordinators and job mentors providing one-on-one oversight and mentoring to young people,
makes it stand out for the depth of attention young people receive. Still, the quality of this support
varies according to the quality of young people’s relationships with job mentors and mentors’
dispositions toward the role. Urban Alliance has made great strides in improving its development of job
mentors, but it should continue to prioritize expanding mentor screening, training, and engagement. In
doing so, the organization should focus on ensuring that job mentors are committed to serving in a
youth development role and not simply as a work supervisor. Doing so will require setting clear and
consistent expectations of job sites, mentors, and young people during the internship. Though doing so
involves considerable communication, the effort should lessen the incidence of mentor dissatisfaction
and lead to mentors better preparing interns for the professional world, and perhaps help retain
mentors and employers. Learning from behaviorally informed experimentation with mentor training
and mentor communication in the 2019–20 program year will be instructive.4
Intensifying the support program coordinators provide would likely also make it more effective.
Program caseload size, combined with competing responsibilities that take time away from
coordinators’ direct work with young people, limits their ability to steer young people toward success;
this is particularly true for young people who are struggling. Ideally, Urban Alliance would reduce
caseload sizes. Alternatively, the program can consider having program coordinators conduct more one-
on-one sessions with young people during trainings, especially early on in the program when fewer have
established post–high school plans. More one-on-one time would likely be valuable enough for young
people to justify reducing training time in the larger group. Additional support and training for program
coordinators may be needed when addressing challenging or unusual needs that young people may
bring.
Finally, Urban Alliance should continue to align its High School Internship Program model more
closely with its goal to prepare young people for self-sufficiency after high school. The organization has
made important moves to widen its view of what constitutes post–high school success, in line with the
reality that many young people the program serves are likely to lack the academic preparation or
financial security to successfully complete a four-year college degree immediately following high school.
In line with this evolution in thinking, the program has introduced exposure to alternative pathways for
young people into the training curriculum.
Yet, the support the program offered may not be sufficient to put young people who entered the
program less well prepared on a path toward success. The internship program functioned as an
introduction to the working world but did not provide guaranteed pathways to further training
I M P L I C A T I O N S F O R P R A C T I C E 7 5
programs or apprenticeships that would prepare young people for permanent employment. Therefore,
young people who are not college bound may continue to need a large degree of support after high
school to stay on track, and those who are college bound may need robust assistance to remain there.
The organization has invested heavily in alumni services, including developing more connections for
alumni to local employers and expanding a program of alumni mentorship in a few regions. These efforts
show promise, but it is unclear to what degree they have connected young people with jobs that have
career pathways or helped them remain in or return to college. The organization should continue to
invest in connecting alumni to living-wage jobs with career pathways, with particular attention to
supporting young people who are not college bound or who matriculate and later drop out.
Since the first impact evaluation, Urban Alliance has continued to make efforts toward continuous
improvement and has expanded its program to additional regions. Upcoming interim and final impact
evaluation reports from this evaluation will provide evidence of how an updated and expanded program
is affecting youth outcomes.

7 6 A P P E N D I X
Appendix A. Data Sources
Interviews
In spring 2017, we interviewed four members of Urban Alliance’s national leadership, one program
manager, one site’s executive director, alumni directors in each of the four regions, and 10 program
coordinators. We were able to interview every staff member directly involved in administering the High
School Internship Program during the 2016–17 school year.
In winter and spring 2018, we conducted additional interviews with a smaller subset of staff across
the four regions and the national leadership. These included three members of the national leadership,
three program directors, one program manager, two employment outreach directors, three alumni
directors, and three program coordinators. For our second round of interviews, we prioritized
discussions with staff involved in aspects of the High School Internship Program that were evolving,
including alumni services, employer outreach, and the training curriculum, as well as staff who worked
directly with the young people.
Interview topics varied based on the respondent’s role but typically included general work
responsibilities, experiences interacting with program participants, program goals, views on different
program components, perceived challenges for the program, and recommendations for future change.
Interviews with junior- and mid-level staff lasted 45 minutes to 1 hour. Interviews with leadership
lasted 1 hour to 90 minutes. We conducted all interviews over the phone, except for one interview with
a member of the national leadership team, which was in person. Staff did not receive compensation.
In addition to the staff interviews, we conducted two interviews with school counselors in spring
2017 and an additional two in winter 2018 to gain the high school’s perspective on the recruitment
process and the value and challenges of the Urban Alliance program. Our questions focused on school
culture around college preparation, mechanics of the recruitment process, reasons for program
completion and attrition, and challenges involved in youth participation. We conducted school
counselor interviews over the phone; interviews lasted roughly 20–30 minutes. School counselors did
not receive compensation. We randomly selected counselors to interview from a list obtained from
Urban Alliance.
In the final two months of the 2016–17 program year, we conducted seven interviews with job
mentors to gain employer perspectives on the Urban Alliance program and its interns. We conducted an
additional eight interviews in spring 2018. Questions focused on job mentors’ motivations for taking on
A P P E N D I X 7 7
an intern, the internship content, their experiences working with Urban Alliance staff, and what value
they saw in the program for the interns. In the first year, we interviewed job mentors in Chicago over
the phone while interviews with job mentors in the other three regions were in person. We conducted
all interviews in the second year in-person during job site visits. These interviews lasted 30 to 45
minutes. Mentors did not receive compensation. We interviewed mentors after randomly selecting
internship sites to visit from among the sites where all interns were ages 18 or older. We leveraged the
preexisting relationships of program coordinators with the mentors of interns on their caseloads to
assist us in arranging visits to the regions.
Finally, we conducted six interviews with young people who started the Urban Alliance program
but did not finish in spring 2017 and an additional three in winter 2017. While program completers
were engaged in focus groups, we interviewed program noncompleters individually because they were
difficult to convene. Questions focused on why the young people applied for the program, their
impressions of the program, why they left the program, and their future plans. We conducted interviews
with these young people over the phone; interviews lasted 10 to 20 minutes. We sent these
interviewees a $25 Amazon gift card via email in appreciation for their time. We selected
noncompleters to interview randomly from among all noncompleters ages 18 or older at that point and
sent them email invitations to participate.
Focus Groups
We conducted five focus groups with young people participating in the Urban Alliance program during
the 2016–17 program year and eight in the 2017–18 program year. In 2016–17, these included one
focus group each in Washington, DC, and Baltimore in the fall (at the end of pre-work training but
before internships started), and one each in Washington, DC, Baltimore, and Northern Virginia at the
end of the program (when participants were on the verge of completing their internships and becoming
program alumni). In 2017–18, we conducted one focus group in each region in the fall and another in the
final three months of the program. Three to ten young people participated in each focus group. We
randomly selected young people to participate from among those older than age 18 at that point.
In the pre-work focus groups, discussions focused on youth motivations for applying for the
program, their views on pre-work, expectations for their internships, and goals following high school
graduation. In the end-of-program focus groups, discussions focused on experiences with their
internships, views on the value of pre-work and workshops, the role of the program coordinators in

7 8 A P P E N D I X
their experiences, and plans for the future. Focus groups lasted 40 to 50 minutes. We gave young
people $25 Target gift cards as a token of our appreciation.
Observations
We observed 13 training sessions for young people in Washington, DC, Baltimore, and Northern
Virginia during the 2016–17 school year and 14 during the 2017–18 school year. These included 6 pre-
work training sessions and 7 Friday workshop training sessions during the first year and 11 pre-work
training sessions and 3 Friday workshop training sessions during the second year. We recorded notes
using an observation guide on multiple aspects of each training session, including the logistical features
of the session, the training content, staff quality, youth engagement, and the applicability of the training
to internships and future college and career preparedness. We selected trainings to attend based on the
training topic’s relevance to the Urban Alliance program’s core goals (i.e., work and college readiness).
Additionally, we observed mentor orientation sessions in two regions in fall 2017 to learn more
about efforts to provide enhanced guidance to mentors.
We conducted observations at four internship sites in Washington, DC, and Northern Virginia in
spring 2017 and 2018, including two in each region in 2018. Before beginning each observation, we
obtained consent from all interns who were present. We took detailed notes at 15-minute intervals
using an observation form over the course of two hours, noting the internship setting, internship
content, quality of youth engagement and mentor involvement, and applicability of Urban Alliance
training to the internship.
Surveys
We invited all school counselors (56) to complete an online Qualtrics survey in spring 2017 and 36
completed it (64 percent response). In spring 2018, we invited 85 and 58 completed the survey (68
percent response). School counselors did not receive compensation. The counselor survey asked about
school culture around college and career preparation, the process of recruiting and enrolling young
people in Urban Alliance program, their perspectives on program attrition and completion, and their
views on the program’s value for their students.
We invited all job mentors (257) to complete the mentor Qualtrics survey in the summer after the
2016–17 school year and 123 completed it (47 percent response). We invited all 230 mentors from the

A P P E N D I X 7 9
2017–18 school year to complete the survey and 175 did so (76 percent response). Job mentors did not
receive compensation. The job mentor survey asked about their personal motivation for becoming a
mentor and why their organization became involved, the experience of their intern(s), their experiences
working with Urban Alliance staff, and suggestions for program improvement. Mentors did not receive
compensation.
During both school years, we administered job experience surveys to interns who were age 18 in
the final two months of the program at each site’s Friday workshops. In summer 2017, a total of 70
young people took the survey out of 281 placed in an internship (25 percent response). In summer
2018, a total of 64 young people completed the survey out of 252 placed in an internship (25 percent
response). The spring in-program intern survey asked about tasks involved in their internship,
interactions with their mentor, and their future plans. We sent young people $5 Amazon gift cards via
email or phone (according to their preference indicated in the survey) as a token of appreciation for
completion.
Program Data
We received program data from Urban Alliance on the two intern cohorts included in this study (2016–
17 and 2017–18 years). These data included Urban Alliance application data, daily attendance for pre-
work and workshops, internship placement information, number of hours worked at internships,
information on post–high school plans (including colleges applied and accepted to), youth payment
information, interaction with alumni services, information on Urban Alliance program costs, and the
length of time Urban Alliance staff had a young person on their caseload.
Secondary Data
We used the American Community Survey, National Center for Education Statistics, and US
Department of Education EDFacts data to understand the characteristics of Urban Alliance applicants’
neighborhoods and high schools. The American Community Survey 2013–17 five-year estimates of
neighborhood demographics and socioeconomic status were combined with participants’ addresses as
entered on the Urban Alliance program application. Neighborhood attributes were missing for 185
young people who did not consent to sharing their application data (but did consent to participating in
the study). We accessed data from the National Center for Educational Statistics and the US
Department of Education EDFacts dataset, both from 2016, through the Urban Institute Urban Data

8 0 A P P E N D I X
Explorer. We matched these data with applicant high school names to analyze characteristics of Urban
Alliance applicants’ high schools. High school data could not be accessed for eleven students who were
attending two schools (Cornerstone in Washington, DC, and Muchin College Prep in Chicago).

A P P E N D I X 8 1
Appendix B. Urban Alliance Applicants’ Neighborhoods
FIGURE B.1 Share of People of Color by Census Tract in Baltimore
Sources: Urban Alliance program data; American Community Survey 2013–17 five-year estimates.
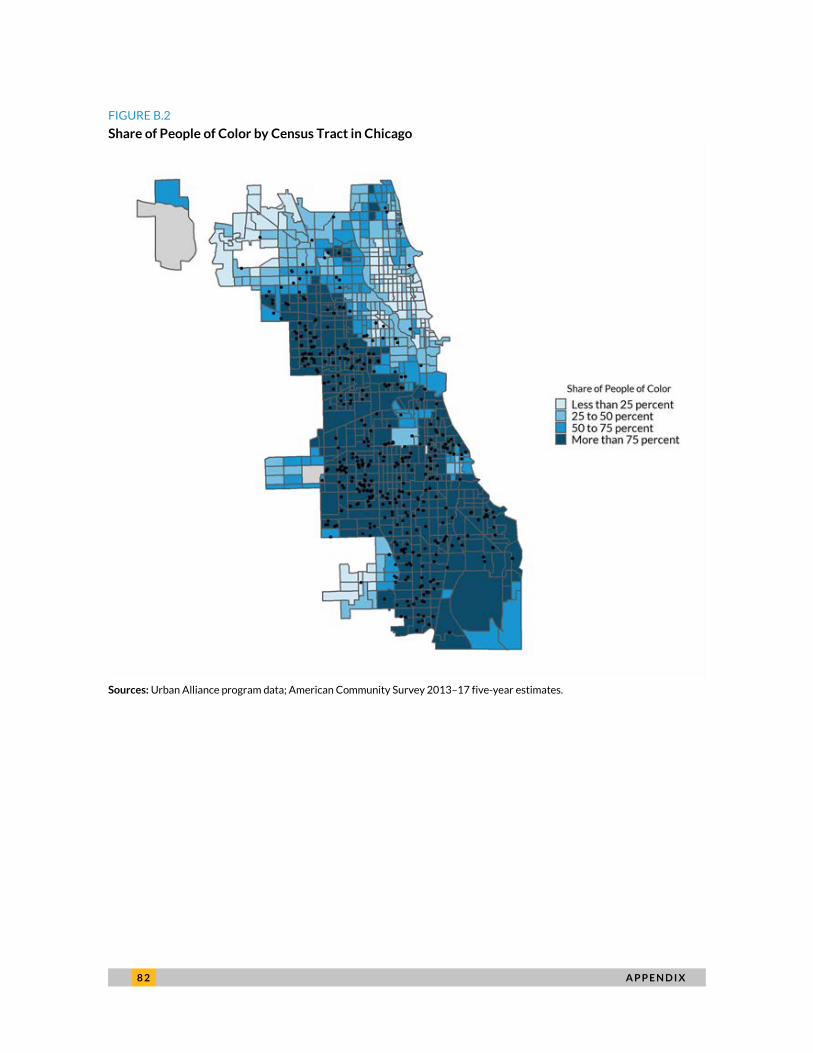
8 2 A P P E N D I X
FIGURE B.2 Share of People of Color by Census Tract in Chicago
Sources: Urban Alliance program data; American Community Survey 2013–17 five-year estimates.

A P P E N D I X 8 3
FIGURE B.3 Share of People of Color by Census Tract in Northern Virginia
Sources: Urban Alliance program data; American Community Survey 2013–17 five-year estimates.

8 4 A P P E N D I X
FIGURE B.4 Share of People of Color by Census Tract in Washington, DC
Sources: Urban Alliance program data; American Community Survey 2013–17 five-year estimates.

A P P E N D I X 8 5
FIGURE B.5 Share of People under the Federal Poverty Level by Census Tract in Baltimore
Sources: Urban Alliance program data; American Community Survey 2013–17 five-year estimates.

8 6 A P P E N D I X
FIGURE B.6 Share of People under the Federal Poverty Level by Census Tract in Chicago
Sources: Urban Alliance program data; American Community Survey 2013–17 five-year estimates.
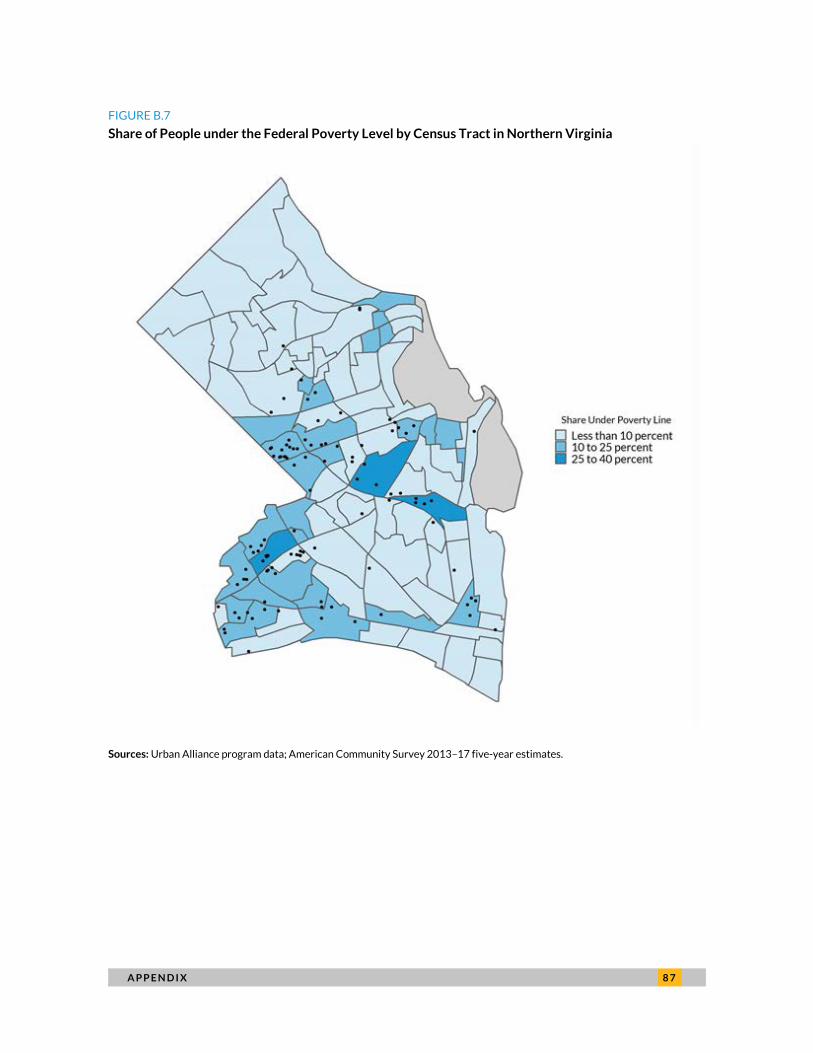
A P P E N D I X 8 7
FIGURE B.7 Share of People under the Federal Poverty Level by Census Tract in Northern Virginia
Sources: Urban Alliance program data; American Community Survey 2013–17 five-year estimates.
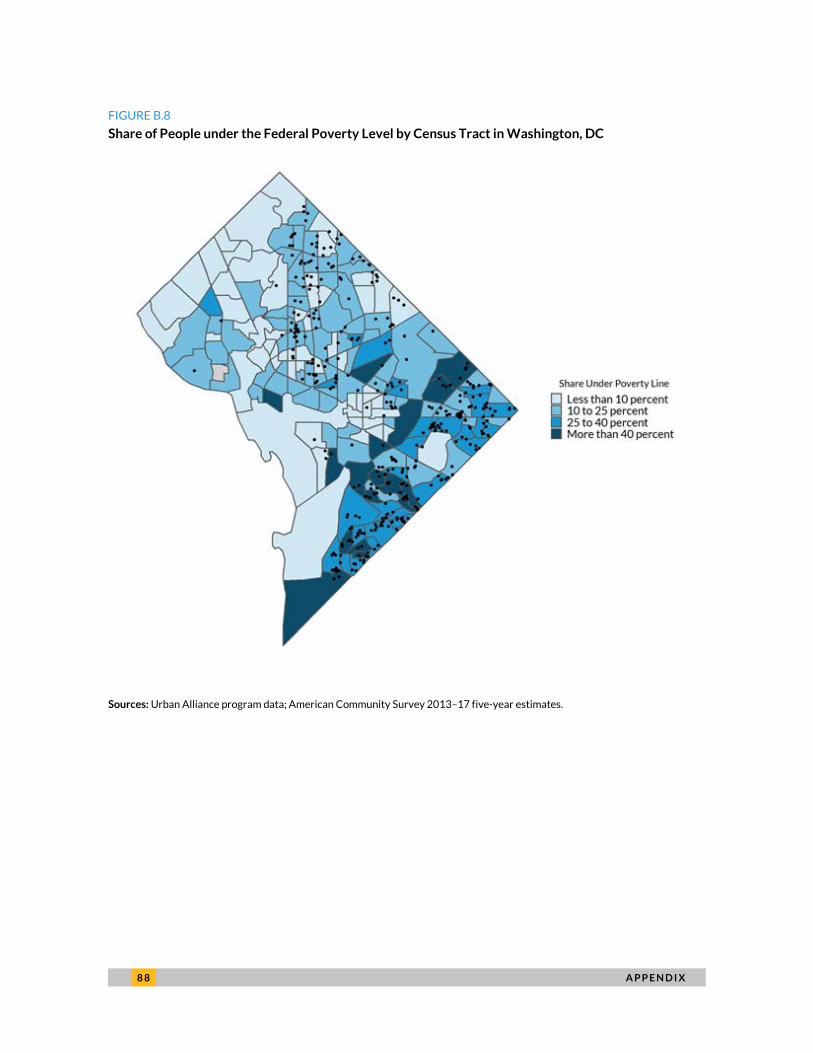
8 8 A P P E N D I X
FIGURE B.8 Share of People under the Federal Poverty Level by Census Tract in Washington, DC
Sources: Urban Alliance program data; American Community Survey 2013–17 five-year estimates.
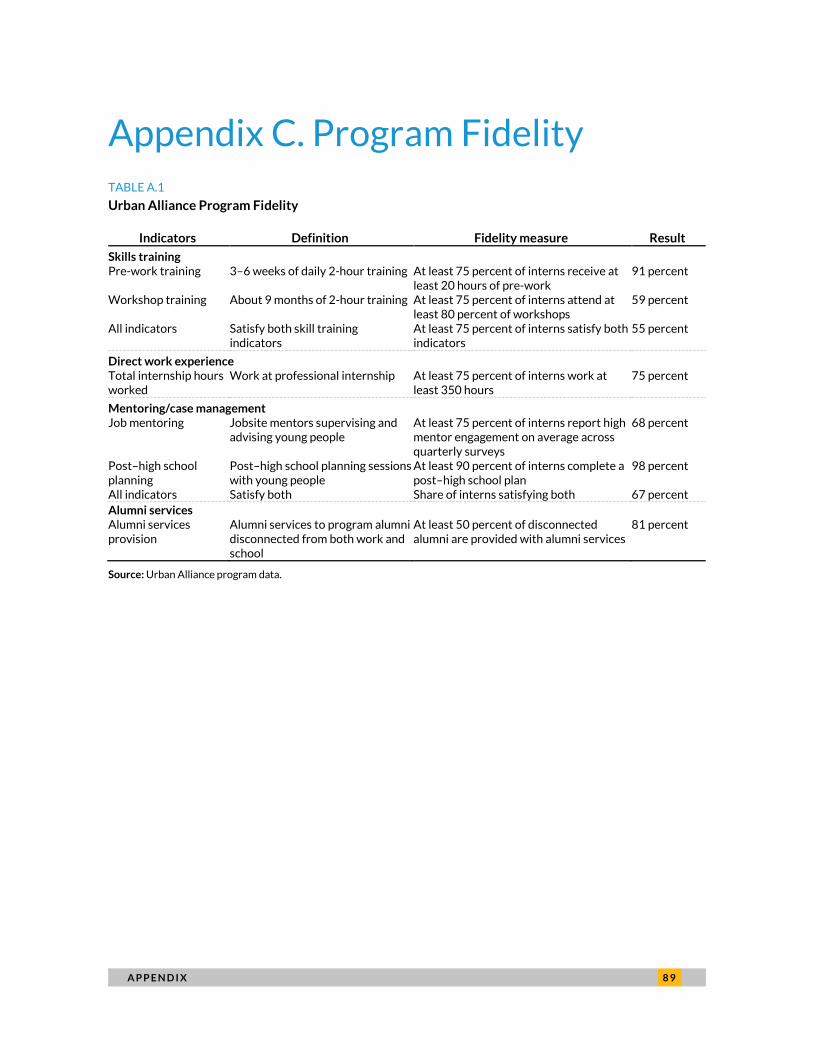
A P P E N D I X 8 9
Appendix C. Program Fidelity
TABLE A.1 Urban Alliance Program Fidelity
Indicators Definition Fidelity measure Result Skills training Pre-work training 3–6 weeks of daily 2-hour training At least 75 percent of interns receive at
least 20 hours of pre-work 91 percent
Workshop training About 9 months of 2-hour training At least 75 percent of interns attend at least 80 percent of workshops
59 percent
All indicators Satisfy both skill training indicators
At least 75 percent of interns satisfy both indicators
55 percent
Direct work experience Total internship hours worked
Work at professional internship At least 75 percent of interns work at least 350 hours
75 percent
Mentoring/case management Job mentoring Jobsite mentors supervising and
advising young people At least 75 percent of interns report high mentor engagement on average across quarterly surveys
68 percent
Post–high school planning
Post–high school planning sessions with young people
At least 90 percent of interns complete a post–high school plan
98 percent
All indicators Satisfy both Share of interns satisfying both 67 percent Alumni services Alumni services provision
Alumni services to program alumni disconnected from both work and school
At least 50 percent of disconnected alumni are provided with alumni services
81 percent
Source: Urban Alliance program data.
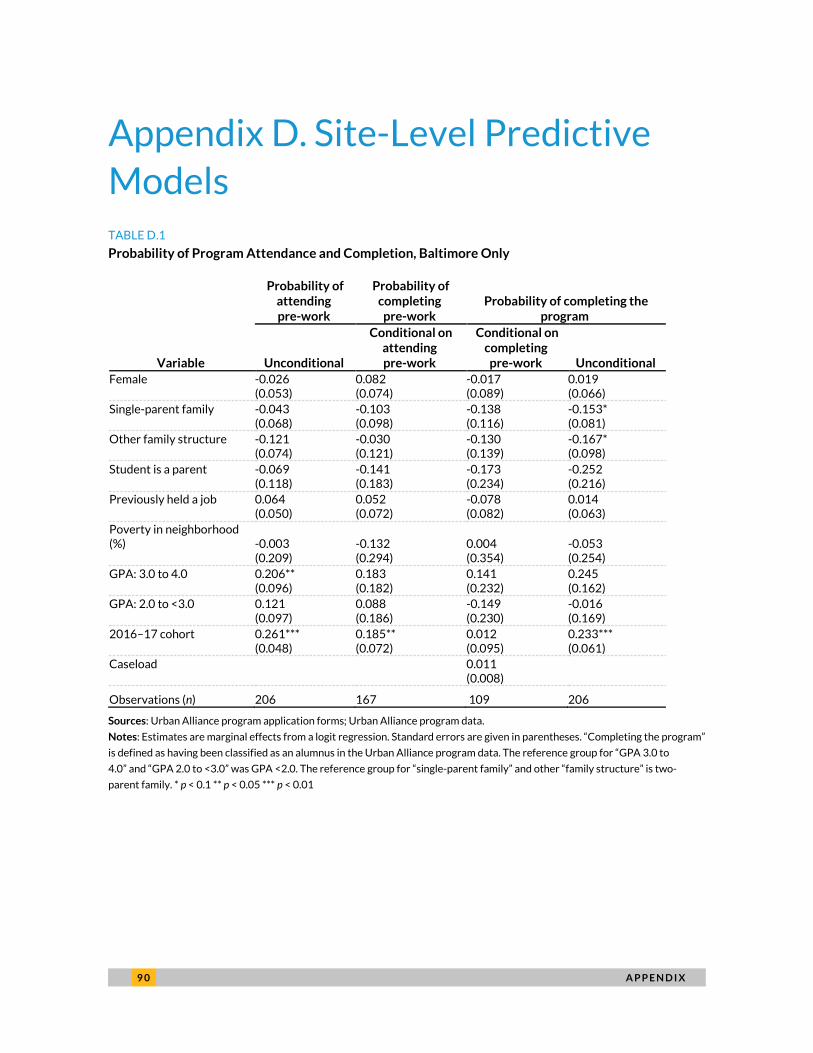
9 0 A P P E N D I X
Appendix D. Site-Level Predictive Models
TABLE D.1 Probability of Program Attendance and Completion, Baltimore Only
Probability of attending pre-work
Probability of completing
pre-work Probability of completing the
program
Variable Unconditional
Conditional on attending pre-work
Conditional on completing
pre-work Unconditional Female -0.026 0.082 -0.017 0.019 (0.053) (0.074) (0.089) (0.066) Single-parent family -0.043 -0.103 -0.138 -0.153* (0.068) (0.098) (0.116) (0.081) Other family structure -0.121 -0.030 -0.130 -0.167* (0.074) (0.121) (0.139) (0.098) Student is a parent -0.069 -0.141 -0.173 -0.252 (0.118) (0.183) (0.234) (0.216) Previously held a job 0.064 0.052 -0.078 0.014 (0.050) (0.072) (0.082) (0.063) Poverty in neighborhood (%) -0.003 -0.132 0.004 -0.053 (0.209) (0.294) (0.354) (0.254) GPA: 3.0 to 4.0 0.206** 0.183 0.141 0.245 (0.096) (0.182) (0.232) (0.162) GPA: 2.0 to <3.0 0.121 0.088 -0.149 -0.016 (0.097) (0.186) (0.230) (0.169) 2016–17 cohort 0.261*** 0.185** 0.012 0.233*** (0.048) (0.072) (0.095) (0.061) Caseload 0.011 (0.008) Observations (n) 206 167 109 206 Sources: Urban Alliance program application forms; Urban Alliance program data. Notes: Estimates are marginal effects from a logit regression. Standard errors are given in parentheses. “Completing the program”
is defined as having been classified as an alumnus in the Urban Alliance program data. The reference group for “GPA 3.0 to
4.0” and “GPA 2.0 to <3.0” was GPA <2.0. The reference group for “single-parent family” and other “family structure” is two-
parent family. * p < 0.1 ** p < 0.05 *** p < 0.01
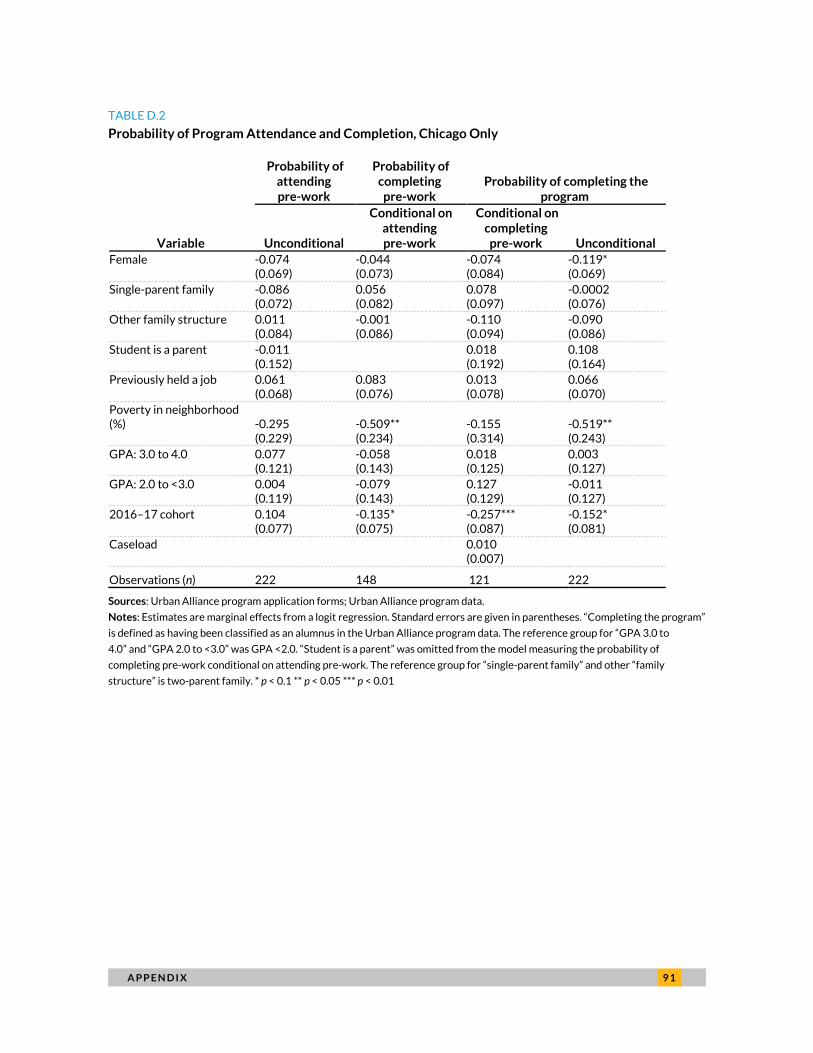
A P P E N D I X 9 1
TABLE D.2 Probability of Program Attendance and Completion, Chicago Only
Probability of attending pre-work
Probability of completing
pre-work Probability of completing the
program
Variable Unconditional
Conditional on attending pre-work
Conditional on completing
pre-work Unconditional Female -0.074 -0.044 -0.074 -0.119* (0.069) (0.073) (0.084) (0.069) Single-parent family -0.086 0.056 0.078 -0.0002 (0.072) (0.082) (0.097) (0.076) Other family structure 0.011 -0.001 -0.110 -0.090 (0.084) (0.086) (0.094) (0.086) Student is a parent -0.011 0.018 0.108 (0.152) (0.192) (0.164) Previously held a job 0.061 0.083 0.013 0.066 (0.068) (0.076) (0.078) (0.070) Poverty in neighborhood (%) -0.295 -0.509** -0.155 -0.519** (0.229) (0.234) (0.314) (0.243) GPA: 3.0 to 4.0 0.077 -0.058 0.018 0.003 (0.121) (0.143) (0.125) (0.127) GPA: 2.0 to <3.0 0.004 -0.079 0.127 -0.011 (0.119) (0.143) (0.129) (0.127) 2016–17 cohort 0.104 -0.135* -0.257*** -0.152* (0.077) (0.075) (0.087) (0.081) Caseload 0.010 (0.007) Observations (n) 222 148 121 222 Sources: Urban Alliance program application forms; Urban Alliance program data. Notes: Estimates are marginal effects from a logit regression. Standard errors are given in parentheses. “Completing the program”
is defined as having been classified as an alumnus in the Urban Alliance program data. The reference group for “GPA 3.0 to
4.0” and “GPA 2.0 to <3.0” was GPA <2.0. “Student is a parent” was omitted from the model measuring the probability of
completing pre-work conditional on attending pre-work. The reference group for “single-parent family” and other “family
structure” is two-parent family. * p < 0.1 ** p < 0.05 *** p < 0.01

9 2 A P P E N D I X
TABLE D.3 Probability of Program Attendance and Completion, Washington, DC Only
Probability of attending pre-work
Probability of completing
pre-work Probability of completing the
program
Variable Unconditional
Conditional on attending pre-work
Conditional on completing
pre-work Unconditional Female -0.068 0.042 0.083 0.038 (0.055) (0.068) (0.077) (0.068) Single-parent family 0.123** 0.009 -0.037 0.128* (0.053) (0.084) (0.117) (0.075) Other family structure 0.078 0.006 -0.196 -0.014 (0.061) (0.094) (0.121) (0.089) Student is a parent -0.074 0.025 0.130 0.137 (0.090) (0.128) (0.185) (0.120) Previously held a job -0.004 0.086 -0.041 0.047 (0.047) (0.064) (0.071) (0.060) Poverty in neighborhood (%) 0.324 -0.101 -0.259 -0.255 (0.200) (0.247) (0.301) (0.247) GPA: 3.0 to 4.0 0.002 0.037 -2.078 0.233 (0.173) (0.250) (242.3) (0.274) GPA: 2.0 to <3.0 0.010 -0.037 -2.124 0.188 (0.176) (0.253) (242.3) (0.277) 2016–17 cohort -0.153*** 0.234*** 0.052 0.157*** (0.045) (0.065) (0.073) (0.057) Caseload 0.010* (0.005) Observations (n) 276 225 146 276 Sources: Urban Alliance program application forms; Urban Alliance program data. Notes: Estimates are marginal effects from a logit regression. Standard errors are given in parentheses. “Completing the program”
is defined as having been classified as an alumnus in the Urban Alliance program data. The reference group for “GPA 3.0 to
4.0” and “GPA 2.0 to <3.0” was GPA <2.0. The reference group for “single-parent family” and “other family structure” is two-
parent family. * p < 0.1 ** p < 0.05 *** p < 0.01
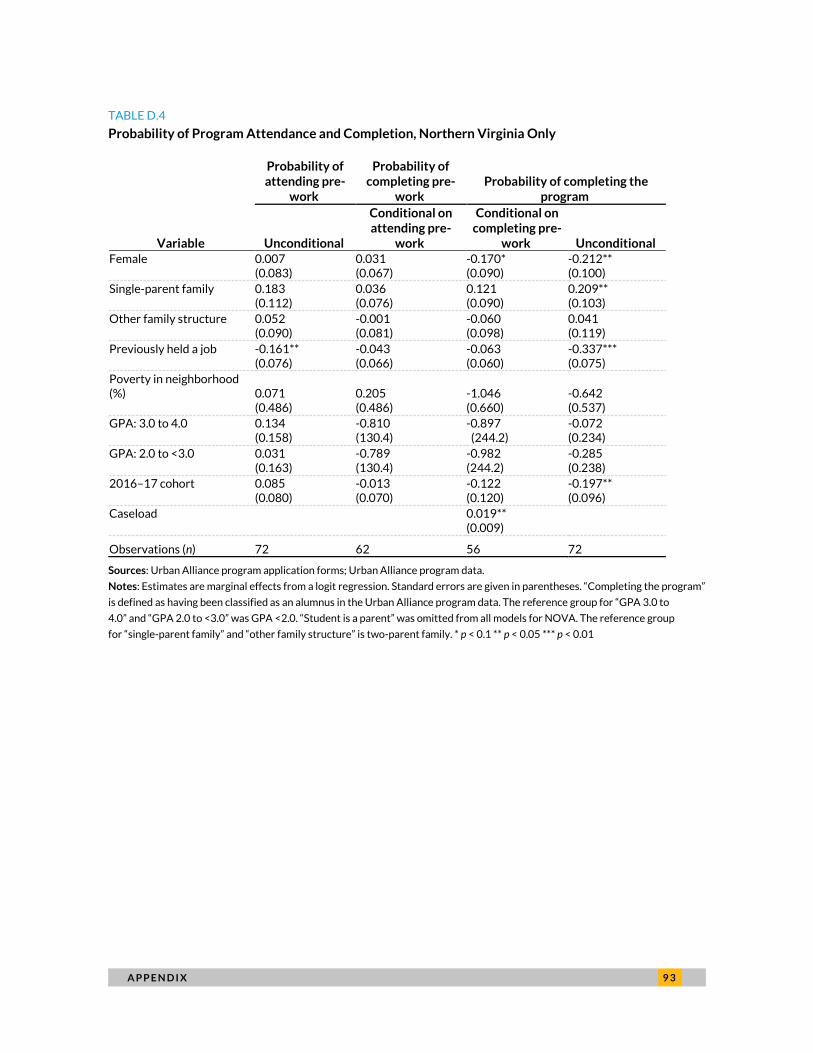
A P P E N D I X 9 3
TABLE D.4 Probability of Program Attendance and Completion, Northern Virginia Only
Probability of attending pre-
work
Probability of completing pre-
work Probability of completing the
program
Variable Unconditional
Conditional on attending pre-
work
Conditional on completing pre-
work Unconditional Female 0.007 0.031 -0.170* -0.212** (0.083) (0.067) (0.090) (0.100) Single-parent family 0.183 0.036 0.121 0.209** (0.112) (0.076) (0.090) (0.103) Other family structure 0.052 -0.001 -0.060 0.041 (0.090) (0.081) (0.098) (0.119) Previously held a job -0.161** -0.043 -0.063 -0.337*** (0.076) (0.066) (0.060) (0.075) Poverty in neighborhood (%) 0.071 0.205 -1.046 -0.642 (0.486) (0.486) (0.660) (0.537) GPA: 3.0 to 4.0 0.134 -0.810 -0.897 -0.072 (0.158) (130.4) (244.2) (0.234) GPA: 2.0 to <3.0 0.031 -0.789 -0.982 -0.285 (0.163) (130.4) (244.2) (0.238) 2016–17 cohort 0.085 -0.013 -0.122 -0.197** (0.080) (0.070) (0.120) (0.096) Caseload 0.019** (0.009) Observations (n) 72 62 56 72 Sources: Urban Alliance program application forms; Urban Alliance program data. Notes: Estimates are marginal effects from a logit regression. Standard errors are given in parentheses. “Completing the program”
is defined as having been classified as an alumnus in the Urban Alliance program data. The reference group for “GPA 3.0 to
4.0” and “GPA 2.0 to <3.0” was GPA <2.0. “Student is a parent” was omitted from all models for NOVA. The reference group
for “single-parent family” and “other family structure” is two-parent family. * p < 0.1 ** p < 0.05 *** p < 0.01
9 4 N O T E S
Notes1 Deborah Kobes, Charlotte Cahill, and Kyle Hartung, “Work-Based Learning Framework,” JFF, May 7, 2018,
https://www.jff.org/resources/work-based-learning-framework/; “Components of Comprehensive Work-Based Learning (WBL) Programs,” Work-Based Learning (WBL) Tool Kit, US Department of Education, accessed June 1, 2020, https://cte.ed.gov/wbltoolkit/.
2 “About Us,” The Urban Alliance Foundation, accessed February 27, 2019, https://theurbanalliance.org/about-us/.
3 We ran the predictive models both using a random-effects model at the high school level and without a random-effects specification. The estimates for the two approaches were similar, and we report on marginal effects for the model without a random-effects specification in this report.
4 With support from the Annie E. Casey Foundation, the Urban Institute is supporting this experimentation by reviewing behavioral intervention literature, suggesting program modifications, helping Urban Alliance design and incorporate these new or revised elements, and documenting the process in a forthcoming learning brief.
R E F E R E N C E S 9 5
References
Abraham, Katharine G., and Melissa S. Kearney. 2018. “Explaining the Decline in the U.S. Employment-to-Population Ratio: A Review of the Evidence.” NBER working paper no. 24333. Cambridge, Massachusetts: National Bureau of Economic Research.
Anderson, Theresa, Breno Braga, Teresa Derrick-Mills, Alan Dodkowitz, H. Elizabeth Peters, Charmaine Runes, and Mary Winkler. 2019. New Insights into the Back on Track Model’s Effects on Opportunity Youth Outcomes: Opportunity Works Final Evaluation Report. Washington, DC: Urban Institute.
Ballou, Dale, Ellen Goldring, and Keke Liu. 2006. Magnet Schools and Student Achievement. New York: Columbia University, Teachers College, National Center for the Study of Privatization in Education.
Bird, Kisha, and Rhonda Bryant. 2014. “Investing in Boys and Young Men of Color: The Promise and the Opportunity. Issue Brief: Focus on Education.” Washington, DC: Center for Law and Social Policy, Inc. (CLASP).
Bolíbar, Mireia, Joan Miquel Verd, and Oriol Barranco. 2019. “The Downward Spiral of Youth Employment: An Approach Considering Social Networks and Family Background.” Work, Employment and Society 33 (3): 401–21.
Boser, Ulrich, Megan Wilhelm, and Robert Hanna. 2014. “Power of the Pygmalion Effect: Teachers’ Expectations Strongly Predict College Competition.” Washington, DC: Center for American Progress.
Breitenstein, Susan M., Deborah D. Gross, Christine A. Garvey, Carri Hill, Louis Fogg, L., and Barbara Resnick. 2010. “Implementation Fidelity in Community-Based Interventions.” Research in Nursing & Health 33 (2), 164–73.
Cobb, Casey D., Robert Bifulco, and Courtney Bell. 2009. Evaluation of Connecticut’s Interdistrict Magnet Schools. Storrs, CT: University of Connecticut, Center for Education Policy Analysis.
Crain, Robert L., Anna Allen, Robert Thaler, Debora Sullivan, Gail L. Zellman, Judith Warren Little, and Denise D. Quigley. 1999. The Effects of Academic Career Magnet Education on High Schools and Their Graduates. Berkeley, CA: University of California, Berkeley, National Center for Research in Vocational Education.
Davis, Jonathan MV, and Sara B. Heller. 2017. “Rethinking the Benefits of Youth Employment Programs: The Heterogeneous Effects of Summer Jobs.” Review of Economics and Statistics:1–47.
Dietrich, Cecile, Eric Lichtenberger, and Rosemaliza Kamalludeen. 2016. “Predicting Community College Outcomes: Does High School CTE Participation Have a Significant Effect?” Journal of Career and Technical Education 31 (1): 9–32.
Elliott, Mark, and Anne Roder. 2017. Escalating Gains: Project QUEST’s Sectoral Strategy Pays Off. New York: Economic Mobility Corporation.
Fein, David, and Jill Hamadyk. 2018. Bridging the Opportunity Divide for Low-Income Youth: Implementation and Early Impacts of the Year Up Program. OPRE Report #2018–65. Washington, DC: US Department of Health and Human Services, Office of Planning, Research and Evaluation.
Fernandes-Alcantara, Adrienne L. 2018. “Vulnerable Youth: Background and Policies.” Washington, DC: Congressional Research Service.
Fluhr, Stephanie A. Namok Choi, Ann Herd, Hongryun Woo, and, Meera Alagaraja. 2017. “Gender, Career and Technical Education (CTE) Nontraditional Coursetaking, and Wage Gap.” High School Journal 100 (3): 166–182.
Gilfillan, Beth H. 2018. “School Counselors and College Readiness Counseling.” Professional School Counseling 21(1).
Grossman, Jean B., and Jean E. Rhodes. 2002. “The Test of Time: Predictors and Effects of Duration in Youth Mentoring Relationships.” American Journal of Community Psychology 30 (2): 199–219.

9 6 R E F E R E N C E S
Hällsten, Martin, Christofer Edling, and Jens Rydgren. 2017. “Social Capital, Friendship Networks, and Youth Unemployment.” Social Science Research 61:234–50.
Hanks, Angela, Annie McGrew, and Daniella Zessoules. 2018. “The Apprenticeship Wage and Participation Gap.” Washington, DC: Center for American Progress.
Harrington, Paul E., Nancy Snyder, Anne Berrigan, and Laura Knoll. 2013. Signaling Success: Boosting Teen Employment Prospects. Boston, MA: Commonwealth Corporation.
Harrison J Kell. Katrina C. Roohr, and Daniel Fishtein. 2020. “Who’s Who in CTE Occupations: Documenting the Demographic Composition of CTE Job Holders” Princeton, NJ: Educational Testing Service.
Harry, Beth, and Janette Klinger. 2014. Why Are There So Many Minority Students in Special Education? Understanding Race and Disability in Schools. New York: Teachers College Press, Columbia University.
Harvill, Eleanor L., Rebecca A. Maynard, Hoa T. H. Nguyen, Claire Robertson-Kraft, and Namrata Tognatta. 2012. “Effects of College Access Programs on College Readiness and Enrollment: A Meta-analysis.” Paper presented at Society for Research on Educational Effectiveness spring 2012 conference, Washington, DC, March 8–10.
Hendra, Richard, David H. Greenberg, Gayle Hamilton, Ari Oppenheim, Alexandra Pennington, Kelsey Schaberg, and Betsy L. Tessler. 2016. Encouraging Evidence on a Sector-Focused Advancement Strategy: Two-Year Impacts from the WorkAdvance Demonstration. New York: MDRC.
Herrera, Carla, Jean Baldwin Grossman, Tina J. Kauh, and Jennifer McMaken. 2011. “Mentoring in Schools: An Impact Study of Big Brothers Big Sisters School-Based Mentoring.” Child Development 82 (1): 346–61.
Hirsch, Barton J., Larry V. Hedges, JulieAnn Stawicki, and Megan A. Mekinda. 2011. After-School Programs for High School Students: An Evaluation of After School Matters. Chicago, IL: Northwestern University.
Katz, Ruth, Lola Jackson, Kathy Reeves, and Charles Benson. 1995. “Urban Career Magnet High Schools.” Education through Occupations in American High Schools 2:114–33.
Kautz, Tim, and Quinn Moore. 2018. Measuring Self-Regulation Skills in Evaluations of Employment Programs for Low-Income Populations. OPRE Report #2018–83. Washington, DC: US Department of Health and Human Services, Office of Planning, Research and Evaluation.
Kemple, James J. 2008. Career Academies: Long Term Impacts on Labor Market Outcomes, Educational Attainment, and Transitions to Adulthood. New York: MDRC.
Kluve, Jochen, Susana Puerto, David Robalino, Jose M. Romero, Friederike Rother, Jonathan Stöterau, Felix Weidenkaff, and Marc Witte. 2019. “Do Youth Employment Programs Improve Labor Market Outcomes? A Quantitative Review.” World Development 114:237–53.
Lerman, Robert I. 2016. “Reinvigorate Apprenticeships in America to Expand Good Jobs and Reduce Inequality.” Challenge 59 (5): 372–89.
Leu, Katherine B., and Caren A. Arbeit. 2020. “Differences in High School CTE Coursetaking by Gender and Race/Ethnicity.” Career and Technical Education Research 45 (1): p33–62.
Leventhal, Tama, and Jeanne Brooks-Gunn. “Children and Youth in Neighborhood Contexts.” Current Directions in Psychological Science 12 (1): 27–31.
Lewis, Kristen, and Rebecca Gluskin. 2018. Two Futures: The Economic Case for Keeping Youth on Track. New York: Measure of America.
Linked Learning. 2012. “Work-Based Learning in Linked Learning: Definitions, Outcomes, and Quality Criteria.” Carpenteria, CA: Linked Learning.
Loprest, Pamela, Shayne Spaulding, and Demetra Smith Nightingale. 2019. “Disconnected Young Adults: Increasing Engagement and Opportunity.” RSF: The Russell Sage Foundation Journal of the Social Sciences 5 (5): 221–43.

R E F E R E N C E S 9 7
Ma, Jennifer, Matea Pender, and Meredith Welch. 2016. “Education Pays 2016: The Benefits of Higher Education for Individuals and Society. Trends in Higher Education Series.” New York: College Board.
Maguire, Sheila, Joshua Freely, Carol Clymer, Maureen Conway, and Deena Schwartz. 2010. Tuning in to Local Labor Markets: Findings from the Sectoral Employment Impact Study. New York: Public/Private Ventures.
Makel, Matthew C., and Jonathan A. Plucker. 2014. “Facts Are More Important Than Novelty: Replication in the Education Sciences.” Educational Researcher 43 (6): 304–16.
Martin, Vanessa, and Joseph Broadus. 2013. “Enhancing GED Instruction to Prepare Students for College and Careers: Early Success in LaGuardia Community College’s Bridge to Health and Business Program.” New York, NY: MDRC.
Maxwell, Nan L., and Victor Rubin. 1997. The Relative Impact of a Career Cademy on Post-Secondary Work and Education Skills in Urban, Public High Schools. HIRE Discussion Paper Number 97-2. Hayward, CA: Human Investment Research and Education Center, California State University, Hayward.
McClanahan, Wendy S., Cynthia L. Sipe, and Thomas J. Smith. 2004. Enriching Summer Work: An Evaluation of the Summer Career Exploration Program. New York: Public/Private Ventures.
Millenky, Megan, Dan Bloom, Sara Muller-Ravett, and Joseph Broadus. 2011. Staying on Course: Three-Year Results of the National Guard Youth ChalleNGe Evaluation. New York: MDRC.
Miller, Cynthia, Johannes M. Bos, Kristin E. Porter, Fannie M. Tseng, and Yasuyo Abe. 2005. The Challenge of Repeating Success in a Changing World: Final Report on the Center for Employment Training Replication Sites. New York: MDRC.
Miller, Cynthia, Danielle Cummings, Megan Millenky, Andrew Wiegand, and David Long. 2018. Laying a Foundation: Four-Year Results from the National YouthBuild Evaluation. New York: MDRC.
Monahan, Kathryn C., Joanna M. Lee, and Laurence Steinberg. 2011. “Revisiting the Impact of Part-Time Work on Adolescent Adjustment: Distinguishing between Selection and Socialization Using Propensity Score Matching.” Child development 82 (1): 96–112.
Mortimer, Jeylan T. 2003. Working and Growing Up in America, Vol. 2. Cambridge, MA: Harvard University Press.
Mroz, Thomas A., and Timothy H. Savage. 2006. “The Long-Term Effects of Youth Unemployment.” Journal of Human Resources 41 (2): 259–93.
Myers, David, Robert Olsen, Neil Seftor, Julie Young, and Christina Tuttle. 2004. “The Impacts of Regular Upward Bound: Results from the Third Follow-Up Data Collection.” Princeton, NJ: Mathematica.
New York City Center for Economic Opportunity. 2011. CEO Young Adult Literacy Program and the Impact of Adding Paid Internships. New York: New York City Center for Economic Opportunity (CEO).
Nonprofit HR. 2019. “2019 Talent Retention Services Survey Results.” Washington, DC: Nonprofit HR.
O’Regan, Katherine M. 1993. “The Effect of Social Networks and Concentrated Poverty on Black and Hispanic Youth Unemployment.” The Annals of Regional Science 27 (4): 327–42.
Pager, Devah, and Hana Shepherd. 2008. “The Sociology of Discrimination: Racial Discrimination in Employment, Housing, Credit, and Consumer Markets.” Annual Review of Sociology 34:181–209.
Pager, Devah, Bruce Western, and Bart Bonikowski. 2009. “Discrimination in a Low-Wage Labor Market: A Field Experiment.” American Sociological Review 74 (5): 777-99.
Price, Cristofer, Julie Williams, Laura Simpson, JoAnn Jastrzab, and Carrie Markovitz. 2011. “National Evaluation of Youth Corps: Findings at Follow-up.” Cambridge, MA: Abt Associates Inc.
Rosenbaum, James E., Stefanie DeLuca, Shazia R. Miller, and Kevin Roy. 1999. “Pathways into Work: Short-and Long-Term Effects of Personal and Institutional Ties.” Sociology of Education 72 (3): 179–96.
9 8 R E F E R E N C E S
Ross, Martha, Kristin A. Moore, Kelly Murphy, Nicole Bateman, Alex DeMand, and Vanessa Sacks. 2018. Pathways to High-Quality Jobs for Young Adults. Washington, DC: Brookings.
Rothstein, Donna S. 2007. “High School Employment and Youths’ Academic Achievement.” Journal of Human Resources 42 (1): 194–213.
Schirm, Allen, Elizabeth Stuart, and Allison McKie. 2006. The Quantum Opportunity Program Demonstration: Final Impacts. Princeton, NJ: Mathematica.
Schochet, Peter Z., John Burghardt, and Sheena McConnell. 2006. National Job Corps Study and Longer-Term Follow-Up Study: Impact and Benefit-Cost Findings Using Survey and Summary Earnings Records Data. Princeton, NJ: Mathematica Policy Research.
Snyder, Thomas D., Cristobal de Brey, and Sally A. Dillow. 2019. Digest of Education Statistics 2017. Washington, DC: National Center for Education Statistics, Institute of Education Sciences.
Southwick, Steven M., Charles A. Morgan III, Meena Vythilingam, and Dennis Charney. 2007. “Mentors Enhance Resilience in At-Risk Children and Adolescents.” Psychoanalytic Inquiry 26 (4), 577–84.
Spaulding, Shayne. 2005. “Getting Connected: Strategies for Expanding the Employment Networks of Low-Income People.” New York: Public/Private Ventures.
Speroni, Cecilia. 2012. “High School Dual Enrollment Programs: Are We Fast-Tracking Students Too Fast?” New York: National Center for Postsecondary Research.
Spievack, Natalie, and Nathan Sick. 2019. The Youth Workforce: A Detailed Picture. Washington, DC: Urban Institute.
Sum, Andrew, Mykhaylo Trubskyy, and Walter McHugh. 2013. The Summer Employment Experiences and the Personal/Social Behaviors of Youth Violence Prevention Employment Program Participants and Those of a Comparison Group. Boston, MA: Center for Labor Market Studies, Northeastern University.
Theodos, Brett, Mike Pergamit, Alexandra Derian, Sara Edelstein, and Allison Stolte. 2016. Solutions for Youth: An Evaluation of the Latin American Youth Center’s Promotor Pathway Program. Washington, DC: Urban Institute.
Theodos, Brett, Mike Pergamit, Sara Edelstein, Taz George, and Lesley Freiman. 2014. Preparing Youth for College and Career: A Process Evaluation of Urban Alliance. Washington, DC: Urban Institute.
Theodos, Brett, Mike Pergamit, Devlin Hanson, Sara Edelstein, Rebecca Daniels, and Tanaya Srini. 2017. Pathways after High School: Evaluation of the Urban Alliance High School Internship Program. Washington, DC: Urban Institute.
Treskon, Louisa. 2016. “What Works for Disconnected Young People.” New York: MDRC.
US Department of Education. 2014. “Civil Rights Data Collection: Data Snapshot (School Discipline).” Washington, DC: US Department of Education, Office of Civil Rights.
US Department of Justice. 2011. “Mentoring Children Affected by Incarceration: An Evaluation of the Amachi Texas Program.” Washington, DC: Office of Juvenile Justice and Delinquency Prevention, Office of Justice Programs, US Department of Justice.
Winkler, Mary, Brett Theodos, and Michel Gross. 2009. Evaluation Matters: Lessons from Youth-Serving Organizations. Washington, DC: Urban Institute.

A B O U T T H E A U T H O R S 9 9
About the Authors
Brett Theodos directs the Community Economic Development Hub at the Urban Institute, where he is a
senior fellow in the Metropolitan Housing and Communities Policy Center.
Michael R. Pergamit is a senior fellow in the Center on Labor, Human Services, and Population.
Amelia Coffey is a research associate in the Center on Labor, Human Services, and Population.
Devlin Hanson is a senior research associate in the Center on Labor, Human Services, and Population.
Matthew Gerken is a research analyst in the Metropolitan Housing and Communities Policy Center.
Katherine Thomas is a research analyst in the Center on Labor, Human Services, and Population.

ST A T E M E N T O F I N D E P E N D E N C E
The Urban Institute strives to meet the highest standards of integrity and quality in its research and analyses and in the evidence-based policy recommendations offered by its researchers and experts. We believe that operating consistent with the values of independence, rigor, and transparency is essential to maintaining those standards. As an organization, the Urban Institute does not take positions on issues, but it does empower and support its experts in sharing their own evidence-based views and policy recommendations that have been shaped by scholarship. Funders do not determine our research findings or the insights and recommendations of our experts. Urban scholars and experts are expected to be objective and follow the evidence wherever it may lead.

500 L’Enfant Plaza SW
Washington, DC 20024
www.urban.org