research report electric vehicle consumer...
TRANSCRIPT
Charul Vyas Associate Analyst Dave Hurst Principal Research Analyst
Electric Vehicle Consumer Survey Consumer Attitudes, Opinions, and Preferences for Electric Vehicles and EV Charging Stations Published 4Q 2013
RESEARCH REPORT

Electric Vehicle Consumer Survey
Section 1 EXECUTIVE SUMMARY
1.1 Overview
Alternative fuel vehicles, particularly battery electric vehicles (BEVs) and plug-in hybrid electric vehicles (PHEVs), are a small but growing portion of the automotive market. First commercially available in 2010, the volume of BEVs and PHEVs has grown significantly during the last several years, with new auto manufacturers bringing models to market and existing manufacturers reducing prices. Navigant Research expects shipments of BEVs and PHEVs in the United States to reach 30,195 and 59,106, respectively, by the end of 2013. By 2020, shipments are expected to reach 130,641 and 210,772, respectively.
In order to better understand consumer attitudes toward BEVs and PHEVs, Navigant Research conducted a web-based survey of 1,084 consumers in the United States. The survey was executed in the fall of 2013 using a nationally representative and demographically balanced sample. The key findings of this survey are summarized in this report.
1.2 Key Findings
» Favorability ratings for alternative fuel vehicles remain high, with all three types of vehicles (hybrid, electric, and natural gas) above the 50% mark for favorability.
» The top five brands consumers would consider for an electric vehicle (EV) include Toyota (46%), Ford (45%), Chevrolet (45%), Honda (42%), and Nissan (30%).
» Consumers are most familiar with the Chevrolet Volt (44%) and the Nissan LEAF (31%). Familiarity with the Tesla Model S, Ford C-Max Energi, and the BMW i3 is below 25% for each.
» While 41% of survey respondents chose the gasoline-only engine as their preferred engine type, the hybrid engine was the most common second choice (20%). In terms of the top three engine preferences, there was a slight difference between gasoline and hybrid engines (64% vs. 63%).
» Two-thirds of consumers surveyed stated that EVs have unique features that stand out from their gasoline counterparts, and 6 out of 10 respondents agreed that EVs are much cheaper to own in the long run than gasoline cars.
» Nearly 50% of consumers said high fuel economy was the most important feature in a vehicle.
» While 41% of consumers were interested in public charging locations, only 16% were willing to pay more than $2 for a 15-minute charge at such locations.
©2013 Navigant Consulting, Inc. Notice: No material in this publication may be reproduced, stored in a retrieval system, or transmitted by any means, in whole or in part, without the express written permission of Navigant Consulting, Inc.
2

Electric Vehicle Consumer Survey
» Consumers had a favorable opinion of all three types of alternative fuel vehicles. Favorability (very favorable or favorable) was highest for hybrid vehicles at 67%, followed by EVs at 61%. Natural gas vehicles (NGVs) also had a high favorability rating at 56%.
Chart 1.1 Favorability Ratings by Alternative Fuel Vehicle Type, United States: 2013
(Source: Navigant Research)
0%
10%
20%
30%
40%
50%
60%
70%
80%
90%
100%
Hybrids EVs NGVs
N/A Strongly UnfavorableSomewhat Unfavorable NeutralFavorable Very Favorable
©2013 Navigant Consulting, Inc. Notice: No material in this publication may be reproduced, stored in a retrieval system, or transmitted by any means, in whole or in part, without the express written permission of Navigant Consulting, Inc.
3

Electric Vehicle Consumer Survey
Section 2 DRIVER PROFILE
2.1 Vehicle Ownership
Navigant Research asked survey respondents about vehicle ownership. As illustrated in Chart 2.1, 81% of survey participants reported they either own or lease a vehicle, a number close to what has been reported in previous years. Another 7% of respondents stated that they do not own a vehicle, but that they drive borrowed or rented cars on a regular basis. The remaining 12% of respondents said they do not drive on a regular basis.
Chart 2.1 Vehicle Ownership, United States: 2013
(Source: Navigant Research)
Own or Lease a Vehicle
81%
Do Not Own a Vehicle, but Borrow
or Rent7%
Do Not Drive on a Regular Basis
12%
n=1,083
©2013 Navigant Consulting, Inc. Notice: No material in this publication may be reproduced, stored in a retrieval system, or transmitted by any means, in whole or in part, without the express written permission of Navigant Consulting, Inc.
4

Electric Vehicle Consumer Survey
Survey respondents were also asked if anyone in their household currently owned or leased any the following types of vehicles: plug-in hybrid electric vehicles (PHEVs), battery electric vehicles (BEVs), natural gas vehicles (NGVs), hybrid vehicles, or none of the above. Multiple responses were allowed, as consumers may own more than one type of car. While 84% of consumers reported owning none of the above, 9% of the survey sample reported that someone in their household owned or leased a hybrid vehicle, followed by 5% that reported owning or leasing an NGV. In addition, 3% reported owning or leasing a BEV and 3% reported owning/leasing a PHEV.
Chart 2.2 Vehicle Ownership by Drivetrain, United States: 2013
(Source: Navigant Research)
0%
1%
2%
3%
4%
5%
6%
7%
8%
9%
10%
PHEV BEV NGV Hybrid
n=1,083
©2013 Navigant Consulting, Inc. Notice: No material in this publication may be reproduced, stored in a retrieval system, or transmitted by any means, in whole or in part, without the express written permission of Navigant Consulting, Inc.
5

Electric Vehicle Consumer Survey
Section 3 INTEREST IN ELECTRIC VEHICLES
3.1 Overall Interest
Navigant Research asked survey respondents to identify their interest in, or likelihood to purchase, a BEV based on three different scenarios. Respondents were first asked:
“Assuming the other features were right, how interested would you be in purchasing a BEV with the following characteristics?
» Electricity cost equivalent of $0.75 per gallon
» Driving range of 100 miles on a single charge
» You could plug in the vehicle to charge at your home each night
» Additional charging stations may be available around town
» A price of $26,000 after any purchase incentives”
Nearly 40% of respondents said they would be extremely interested or very interested in such a vehicle, while a quarter said they would not be very interested or not at all interested in a BEV as described.
Chart 3.1 Interest in a BEV at the $26,000 Price Point, United States: 2013
(Source: Navigant Research)
Extremely Interested15%
Very interested24%
Somewhat Interested,Somewhat
Disinterested36%
Not Very Interested13%
Not At All Interested12%
n=1,084
©2013 Navigant Consulting, Inc. Notice: No material in this publication may be reproduced, stored in a retrieval system, or transmitted by any means, in whole or in part, without the express written permission of Navigant Consulting, Inc.
6

Electric Vehicle Consumer Survey
Respondents were then asked whether a battery leasing option would change their interest:
“Would you be more or less likely to purchase a BEV with a 100-mile range on electric drive at the lower price of $15,000 that requires a lease for the battery that costs $75 per month for 3 years and can be renewed at the end of that 3-year lease?”
Battery leasing in this particular scenario appears attractive, as close to 40% of respondents stated they were much more likely or somewhat more likely to purchase such a vehicle. Compared to the previous question, a higher percentage (31%) said they were somewhat less likely or much less likely to purchase a BEV based on the description given.
Chart 3.2 Likelihood to Purchase a BEV at the $15,000 Price Point with a Battery Lease, United States: 2013
(Source: Navigant Research)
Much More Likely to Purchase
13%
Somewhat More Likely to Purchase
26%
Would Not Change Likelihood to
Purchase30%
Somewhat Less Likely to Purchase
15%
Much Less Likely to Purchase
16%
n=1,084
©2013 Navigant Consulting, Inc. Notice: No material in this publication may be reproduced, stored in a retrieval system, or transmitted by any means, in whole or in part, without the express written permission of Navigant Consulting, Inc.
7
Electric Vehicle Consumer Survey
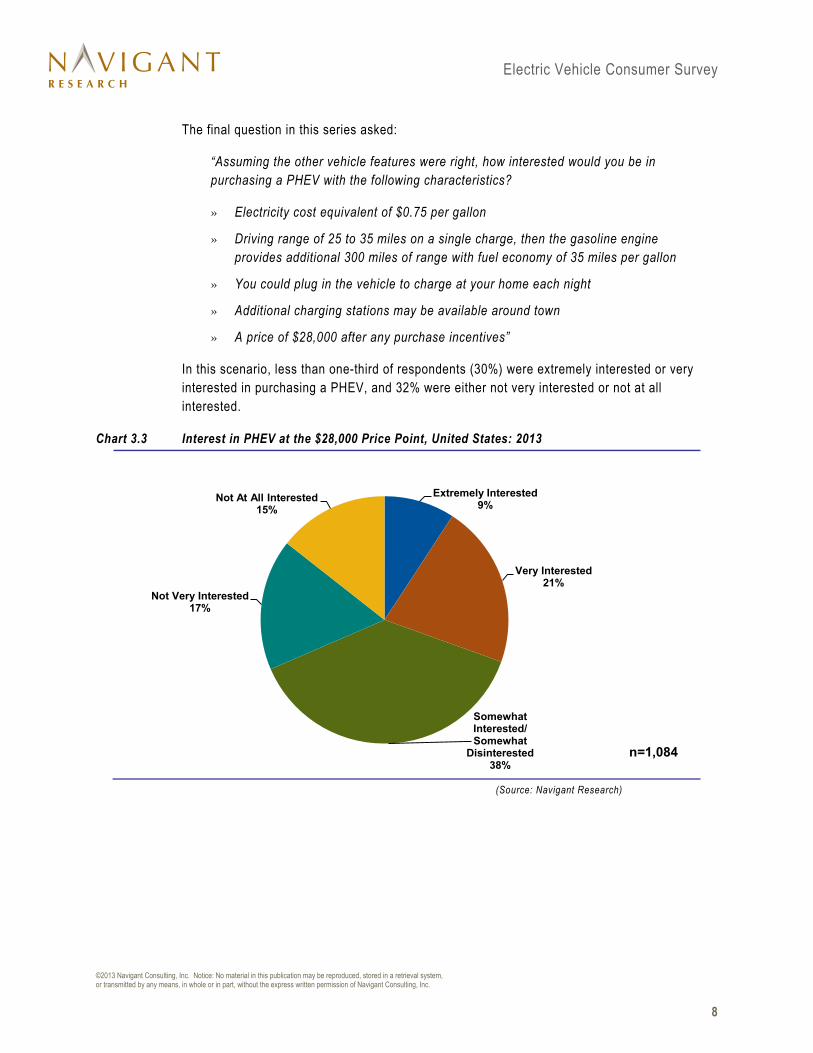
The final question in this series asked:
“Assuming the other vehicle features were right, how interested would you be in purchasing a PHEV with the following characteristics?
» Electricity cost equivalent of $0.75 per gallon
» Driving range of 25 to 35 miles on a single charge, then the gasoline engine provides additional 300 miles of range with fuel economy of 35 miles per gallon
» You could plug in the vehicle to charge at your home each night
» Additional charging stations may be available around town
» A price of $28,000 after any purchase incentives”
In this scenario, less than one-third of respondents (30%) were extremely interested or very interested in purchasing a PHEV, and 32% were either not very interested or not at all interested.
Chart 3.3 Interest in PHEV at the $28,000 Price Point, United States: 2013
(Source: Navigant Research)
Extremely Interested9%
Very Interested21%
Somewhat Interested/Somewhat
Disinterested38%
Not Very Interested17%
Not At All Interested15%
n=1,084
©2013 Navigant Consulting, Inc. Notice: No material in this publication may be reproduced, stored in a retrieval system, or transmitted by any means, in whole or in part, without the express written permission of Navigant Consulting, Inc.
8

Electric Vehicle Consumer Survey
3.2 EV Brand Preference
Respondents were asked which brands they would consider purchasing for an EV. As Chart 3.4 shows, Toyota and Ford were chosen most often at 46% and 45%, respectively, with Chevrolet and Honda taking the third and fourth positions. Other manufacturers that have EV models available ranked lower; Nissan ranked fifth at 30%, BMW was ranked 12th at 19%; and Tesla was ranked 16th at 13%.
Chart 3.4 EV Preference by Brand, United States: 2013
(Source: Navigant Research)
0% 5% 10% 15% 20% 25% 30% 35% 40% 45% 50%
Wheego
BYD
Fiat
Smart
Mitsubishi
Mercedes-Benz
Tesla
Mazda
Lexus
Audi
BMW
Chrysler
Volkswagen
GMC
Kia
Hyundai
Dodge
Nissan
Honda
Chevrolet
Ford
Toyota
n=1,084
©2013 Navigant Consulting, Inc. Notice: No material in this publication may be reproduced, stored in a retrieval system, or transmitted by any means, in whole or in part, without the express written permission of Navigant Consulting, Inc.
9

Electric Vehicle Consumer Survey
Section 4 VEHICLE FAMILIARITY AND OPINIONS
4.1 Model Familiarity and Value
Chart 4.1 addresses consumer familiarity with five plug-in alternative fuel vehicles. Consumers were most likely to state that they were either extremely familiar or somewhat familiar with the Chevrolet Volt (44%) and with the Nissan LEAF (31%). Familiarity with the Tesla Model S, Ford C-Max Energi, and BMW i3 was below 25% for each.
Chart 4.1 Familiarity with Alternative Fuel Vehicle Models, United States: 2013
(Source: Navigant Research)
0%
5%
10%
15%
20%
25%
30%
35%
40%
45%
50%
Chevrolet Volt Nissan LEAF Tesla Model S Ford C-Max Energi BMW i3
Somewhat Familiar
Extremely Familiar
n=1,082
©2013 Navigant Consulting, Inc. Notice: No material in this publication may be reproduced, stored in a retrieval system, or transmitted by any means, in whole or in part, without the express written permission of Navigant Consulting, Inc.
10

Electric Vehicle Consumer Survey
Consumers were also asked to give their opinion on whether the same models were a good value for the price. Again, the Chevrolet Volt came out on top with 30% of respondents stating it was an excellent or good value, followed by the Nissan LEAF (25%). The BMW i3, Tesla Model S, and Ford C-Max Energi were each rated a good or excellent value by approximately 20% of respondents.
Chart 4.2 Value for Price by Alternative Fuel Vehicle Model, United States: 2013
(Source: Navigant Research)
0%
5%
10%
15%
20%
25%
30%
35%
Chevrolet Volt Nissan LEAF BMW i3 Tesla Model S Ford C-Max Energi
Good
Excellent
n=1,081
©2013 Navigant Consulting, Inc. Notice: No material in this publication may be reproduced, stored in a retrieval system, or transmitted by any means, in whole or in part, without the express written permission of Navigant Consulting, Inc.
11

Electric Vehicle Consumer Survey
4.2 Consumer Opinions
Respondents to Navigant Research’s survey had generally positive opinions on EVs. Two-thirds of consumers completely agreed or somewhat agreed that EVs have unique features that make them stand apart from their gasoline counterparts. According to results, 60% completely agreed or somewhat agreed that EVs are less expensive to own in the long run than gasoline-powered cars, and 47% completely agreed or somewhat agreed with the idea that EVs are exciting to own and drive. Only 32% of consumers agreed with the statement that gas prices were not high enough to justify purchasing an EV.
Chart 4.3 Consumer Opinion on EVs, United States: 2013
(Source: Navigant Research)
0%
10%
20%
30%
40%
50%
60%
70%
80%
90%
100%
EVs have uniquefeatures that stand out
from gasolinecounterparts
EVs are much cheaperto own in the long run
than gasoline cars
EVs are exciting todrive and own
Gas prices are not highenough to justify buying
an EV
N/A Completely DisagreeSomewhat Disagree Somewhat AgreeCompletely Agree
n=1,084
©2013 Navigant Consulting, Inc. Notice: No material in this publication may be reproduced, stored in a retrieval system, or transmitted by any means, in whole or in part, without the express written permission of Navigant Consulting, Inc.
12
Electric Vehicle Consumer Survey
Section 5 NEXT VEHICLE PREFERENCE
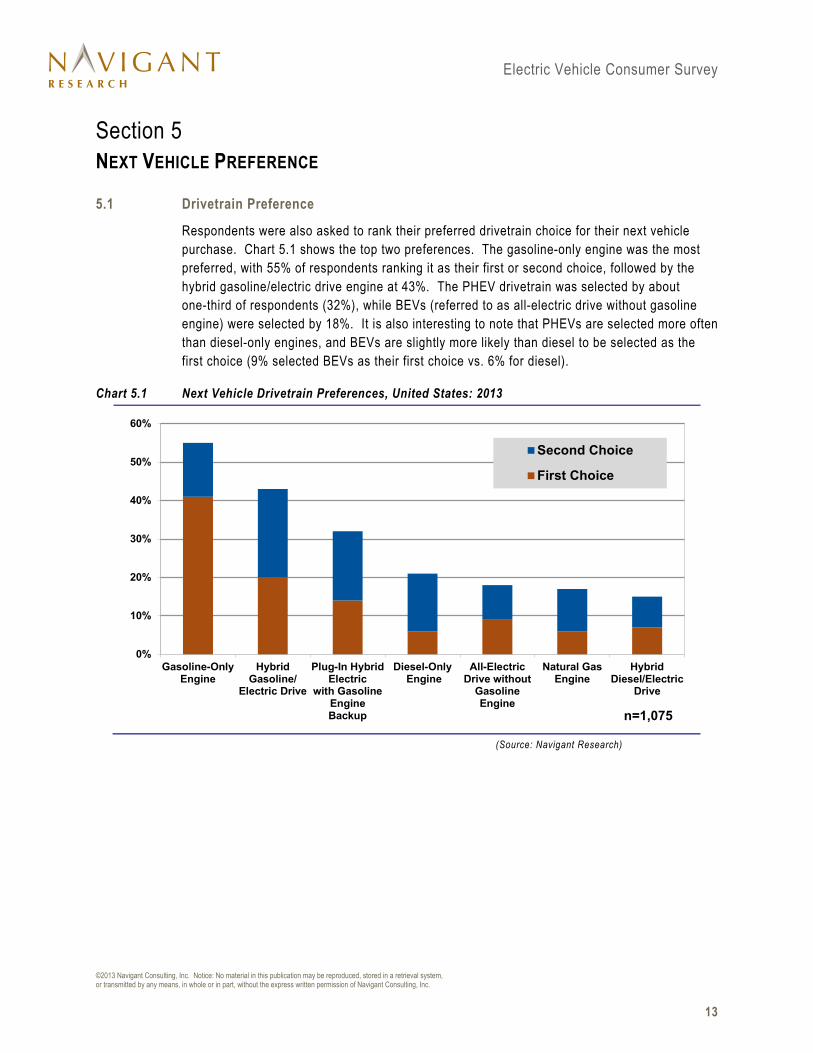
5.1 Drivetrain Preference
Respondents were also asked to rank their preferred drivetrain choice for their next vehicle purchase. Chart 5.1 shows the top two preferences. The gasoline-only engine was the most preferred, with 55% of respondents ranking it as their first or second choice, followed by the hybrid gasoline/electric drive engine at 43%. The PHEV drivetrain was selected by about one-third of respondents (32%), while BEVs (referred to as all-electric drive without gasoline engine) were selected by 18%. It is also interesting to note that PHEVs are selected more often than diesel-only engines, and BEVs are slightly more likely than diesel to be selected as the first choice (9% selected BEVs as their first choice vs. 6% for diesel).
Chart 5.1 Next Vehicle Drivetrain Preferences, United States: 2013
(Source: Navigant Research)
0%
10%
20%
30%
40%
50%
60%
Gasoline-OnlyEngine
HybridGasoline/
Electric Drive
Plug-In HybridElectric
with GasolineEngineBackup
Diesel-Only Engine
All-ElectricDrive without
GasolineEngine
Natural GasEngine
HybridDiesel/Electric
Drive
Second Choice
First Choice
n=1,075
©2013 Navigant Consulting, Inc. Notice: No material in this publication may be reproduced, stored in a retrieval system, or transmitted by any means, in whole or in part, without the express written permission of Navigant Consulting, Inc.
13

Electric Vehicle Consumer Survey
Navigant Research also examined vehicle preference by the respondents’ self-identified technology adoption status. Respondents were asked whether they considered themselves early adopters, early majority, late majority, or laggards. Among respondents that rated all-electric engines or plug-in hybrid electric engines as their first choice, more than 70% classified themselves as either late majority or early majority. This indicates that this technology is now appealing to consumers in the more mainstream automotive market.
Chart 5.2 First or Second Choice Plug-In Electric Vehicle Drivetrain Preference by Adopter Status, United States: 2013
(Source: Navigant Research)
0%
10%
20%
30%
40%
50%
60%
70%
80%
90%
100%
BEV (n=157) PHEV (n=285)
Laggard Late MajorityEarly Majority Early Adopter
©2013 Navigant Consulting, Inc. Notice: No material in this publication may be reproduced, stored in a retrieval system, or transmitted by any means, in whole or in part, without the express written permission of Navigant Consulting, Inc.
14

Electric Vehicle Consumer Survey
5.2 Vehicle Options and Pricing Preferences
Navigant Research asked respondents to rank the vehicle body type they preferred. The highest percent of respondents, 39%, selected a small sedan as their first or second choice, 36% preferred a midsize or large passenger car, and 32% wanted a small SUV.
Chart 5.3 Vehicle Body Type Preference, United States: 2013
(Source: Navigant Research)
0%
5%
10%
15%
20%
25%
30%
35%
40%
45%
Small Sedan Midsize/LargeCar
Small SUV Midsize/LargeSUV
SmallHatchback
Car
Pickup Truck Minivan
Second ChoiceFirst Choice
n=1,081
©2013 Navigant Consulting, Inc. Notice: No material in this publication may be reproduced, stored in a retrieval system, or transmitted by any means, in whole or in part, without the express written permission of Navigant Consulting, Inc.
15
Electric Vehicle Consumer Survey
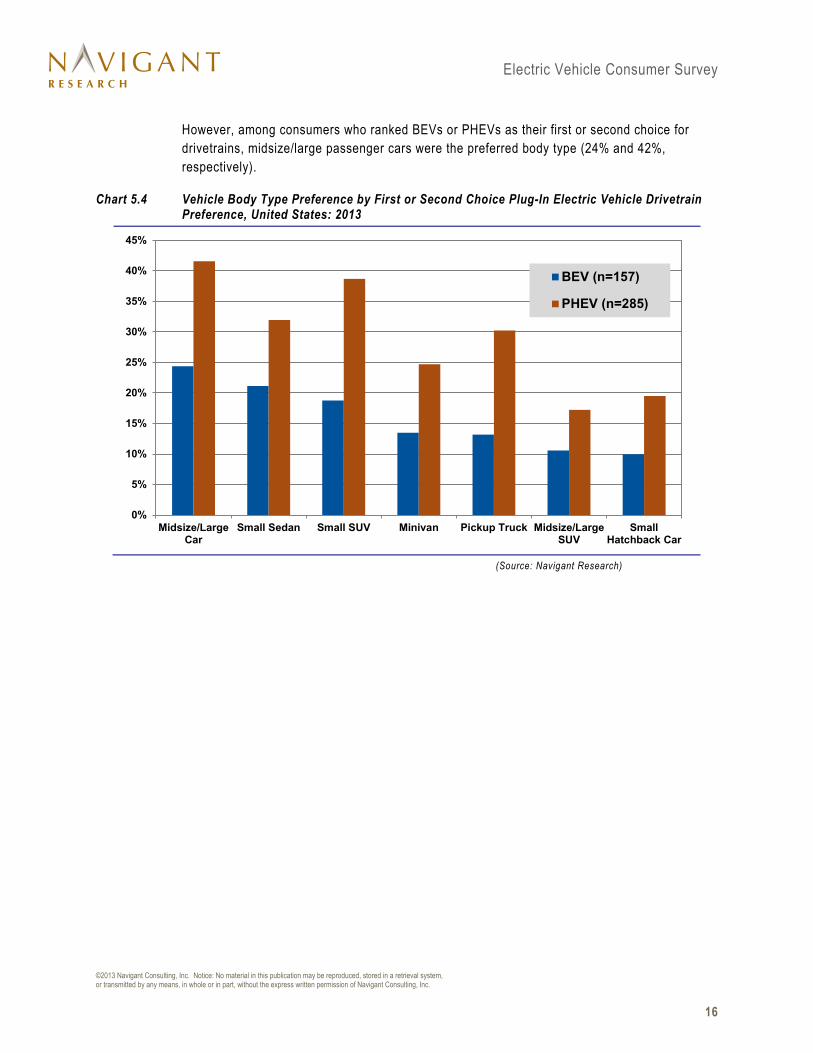
However, among consumers who ranked BEVs or PHEVs as their first or second choice for drivetrains, midsize/large passenger cars were the preferred body type (24% and 42%, respectively).
Chart 5.4 Vehicle Body Type Preference by First or Second Choice Plug-In Electric Vehicle Drivetrain Preference, United States: 2013
(Source: Navigant Research)
0%
5%
10%
15%
20%
25%
30%
35%
40%
45%
Midsize/LargeCar
Small Sedan Small SUV Minivan Pickup Truck Midsize/LargeSUV
SmallHatchback Car
BEV (n=157)
PHEV (n=285)
©2013 Navigant Consulting, Inc. Notice: No material in this publication may be reproduced, stored in a retrieval system, or transmitted by any means, in whole or in part, without the express written permission of Navigant Consulting, Inc.
16

Electric Vehicle Consumer Survey
Consumers were also asked to rate the options that were most important to them when it came to selecting their next car. Topping the list of features was high fuel economy, selected as the first choice by nearly half of all respondents. All-wheel drive and high performance acceleration and handling were ranked similarly, followed by autonomous driving capabilities and zero-emissions driving.
Chart 5.5 Vehicle Options Preference, United States: 2013
(Source: Navigant Research)
0%
10%
20%
30%
40%
50%
60%
70%
High FuelEconomy
HighPerformance
Acceleration andHandling
All-Wheel Drive Autonomous Zero Emissions Ability toProvide Remote
Electricity/Backup
HouseholdElectricity
Second ChoiceFirst Choice
n=1,077
©2013 Navigant Consulting, Inc. Notice: No material in this publication may be reproduced, stored in a retrieval system, or transmitted by any means, in whole or in part, without the express written permission of Navigant Consulting, Inc.
17

Electric Vehicle Consumer Survey
Among those who ranked BEVs or PHEVs as their first or second choice for drivetrain, the zero-emissions driving is more important to those who prefer BEVs, while high performance is more important to those preferring PHEVs. Autonomous capabilities ranked at the bottom for these respondents.
Chart 5.6 Vehicle Options Preference by First or Second Choice Plug-In Electric Vehicle Drivetrain Preference, United States: 2013
(Source: Navigant Research)
0%
10%
20%
30%
40%
50%
60%
70%
80%
High FuelEconomy
Zero Emissions All-Wheel Drive Ability toProvide Remote
Electricity/Backup
HouseholdElectricity
HighPerformance
Acceleration andHandling
AutonomousCapabilities
BEV (n=157)
PHEV (n=285)
©2013 Navigant Consulting, Inc. Notice: No material in this publication may be reproduced, stored in a retrieval system, or transmitted by any means, in whole or in part, without the express written permission of Navigant Consulting, Inc.
18
Electric Vehicle Consumer Survey
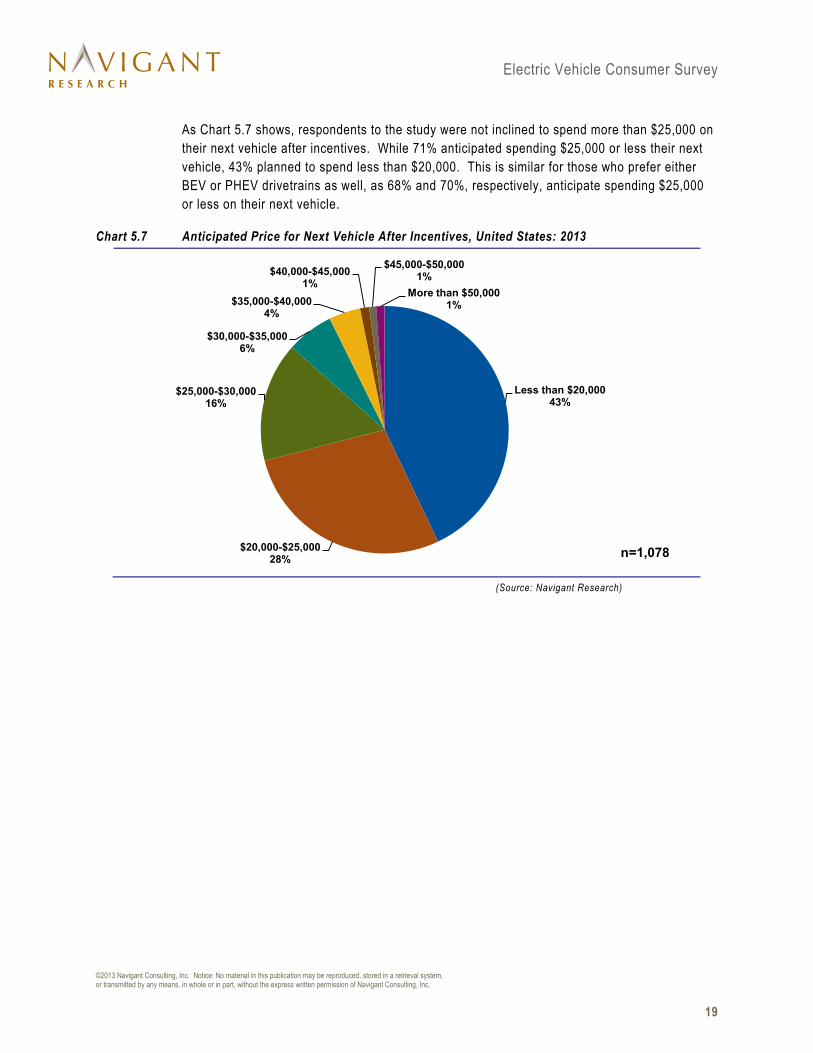
As Chart 5.7 shows, respondents to the study were not inclined to spend more than $25,000 on their next vehicle after incentives. While 71% anticipated spending $25,000 or less their next vehicle, 43% planned to spend less than $20,000. This is similar for those who prefer either BEV or PHEV drivetrains as well, as 68% and 70%, respectively, anticipate spending $25,000 or less on their next vehicle.
Chart 5.7 Anticipated Price for Next Vehicle After Incentives, United States: 2013
(Source: Navigant Research)
Less than $20,00043%
$20,000-$25,00028%
$25,000-$30,00016%
$30,000-$35,0006%
$35,000-$40,0004%
$40,000-$45,0001%
$45,000-$50,0001%
More than $50,0001%
n=1,078
©2013 Navigant Consulting, Inc. Notice: No material in this publication may be reproduced, stored in a retrieval system, or transmitted by any means, in whole or in part, without the express written permission of Navigant Consulting, Inc.
19

Electric Vehicle Consumer Survey
Section 6 ELECTRIC VEHICLE CHARGING INFRASTRUCTURE
6.1 Interest in Public Charging Stations
Navigant Research asked respondents to rate their interest in public charging stations. As Chart 6.1 shows, more than 40% stated they were extremely interested or very interested in using such stations.
Chart 6.1 Interest in Public Charging Stations, United States: 2013
(Source: Navigant Research)
Extremely Interested14%
Very Interested27%
Somewhat Interested/ Somewhat
Disinterested35%
Not Very Interested12%
Not At All Interested12%
n=1,084
©2013 Navigant Consulting, Inc. Notice: No material in this publication may be reproduced, stored in a retrieval system, or transmitted by any means, in whole or in part, without the express written permission of Navigant Consulting, Inc.
20

Electric Vehicle Consumer Survey
Consumers who expressed a high degree of interest in public charging stations were then asked how much they were willing to pay for a 15-minute charge that would provide a driving range of 6 or 7 miles. As Chart 6.2 shows, 29% said less than $1, while 29% were willing to pay between $1 and $2. Only 16% were willing to pay between $2 and $5, 3% were willing to pay more than $5, and 23% would only use such a service if it were free.
Chart 6.2 Price Willing to Pay per Charge, United States: 2013
(Source: Navigant Research)
Would Only Use If Free23%
Less than $129%
$1 to $229%
$2 to $311%
$3 to $55%
More than $53%
n=445
©2013 Navigant Consulting, Inc. Notice: No material in this publication may be reproduced, stored in a retrieval system, or transmitted by any means, in whole or in part, without the express written permission of Navigant Consulting, Inc.
21

Electric Vehicle Consumer Survey
Section 7 SUMMARY AND CONCLUSIONS
7.1 Consumer Interest
As more alternative fuel vehicles come to market, consumer favorability for hybrids, BEVs, PHEVs, and NGVs is strong. Respondents to Navigant Research’s survey held generally positive opinions of EVs, with the majority agreeing that they have unique features that make them stand apart from their gasoline counterparts. However, interest in BEVs and PHEVs remains moderate. Even under several different scenarios, interest in BEVs and PHEVs remains below 50%, indicating that consumers like the idea of EVs, but may not be won over by their features and price points.
7.2 Model Familiarity
With regard to specific models, consumers were most familiar with the Chevrolet Volt and the Nissan LEAF. Less than a quarter of respondents were familiar with the Tesla Model S, Ford C-Max Energi, and BMW i3. Consumers did not rank any BEV high in regard to being a good value for the price.
7.3 Engine, Body Type, and Option Preferences
Despite the growing number of alternative fuel vehicles, consumers rate gasoline-only engine vehicles as their most preferred engine type. However, when the top three preferences for engine type are added up, there is only a slight difference in favorability between the gasoline-only engine (64%) and the hybrid gasoline/electric engine (63%).
When viewed by self-identified technology adopter status, more than 70% of respondents who rated all-electric engines or plug-in hybrid electric engines as their first choice identified themselves as late majority or early majority. This indicates that the market for EVs is expanding beyond the early adopter stage.
Currently, most alternative fuel vehicles are small to midsize passenger cars, the body type consumers rate most desirable. This preference may be tied to fuel efficiency, as it was the top option consumers wanted. Roughly one-third of consumers preferred SUVs. This may be an area for auto manufacturers to explore as they build out their BEV and PHEV portfolios.
While consumers desire fuel efficiency, more than half said they also desire high performance, including acceleration and handling, as well as all-wheel drive capabilities. Environmental benefits of BEVs and PHEVs, such as zero emissions, as well as autonomous capabilities and the ability for the vehicle to provide remote electricity or backup household electricity, were less important.
It is possible that price points could hinder EV adoption, as the majority of consumers say they plan to spend less than $25,000 on their next vehicle. Although prices for some alternative fuel vehicles have declined, the majority remain above this price point.
©2013 Navigant Consulting, Inc. Notice: No material in this publication may be reproduced, stored in a retrieval system, or transmitted by any means, in whole or in part, without the express written permission of Navigant Consulting, Inc.
22
Electric Vehicle Consumer Survey
7.4 Public Charging Stations
While interest in public charging stations is moderate, consumers do not appear to be willing to pay for the convenience. Only 40% of respondents were interested, while more than half stated they would only use a quick charge station if the cost were free or less than $1.
While the driving range of BEVs is still limited to a few hundred miles at best, the deployment of public charging stations will continue. Because consumers do not appear to be willing to pay for the convenience of charging BEVs, manufacturers will need to consider the cost of building these stations as part of the cost of doing business.
©2013 Navigant Consulting, Inc. Notice: No material in this publication may be reproduced, stored in a retrieval system, or transmitted by any means, in whole or in part, without the express written permission of Navigant Consulting, Inc.
23

Electric Vehicle Consumer Survey
Section 8 ACRONYM AND ABBREVIATION LIST
Battery Electric Vehicle ........................................................................................................................... BEV
Electric Vehicle .......................................................................................................................................... EV
Natural Gas Vehicle ................................................................................................................................ NGV
Not Applicable ......................................................................................................................................... N/A
Plug-In Hybrid Electric Vehicle ............................................................................................................... PHEV
Sample Size ................................................................................................................................................ n
United States .......................................................................................................................................... U.S.
©2013 Navigant Consulting, Inc. Notice: No material in this publication may be reproduced, stored in a retrieval system, or transmitted by any means, in whole or in part, without the express written permission of Navigant Consulting, Inc.
24
Electric Vehicle Consumer Survey
Section 9 TABLE OF CONTENTS
Section 1 ........................................................................................................................................................... 2
Executive Summary .......................................................................................................................................... 2
1.1 Overview ............................................................................................................................................ 2
1.2 Key Findings ...................................................................................................................................... 2
Section 2 ........................................................................................................................................................... 4
Driver Profile ..................................................................................................................................................... 4
2.1 Vehicle Ownership .............................................................................................................................. 4
Section 3 ........................................................................................................................................................... 6
Interest in Electric Vehicles .............................................................................................................................. 6
3.1 Overall Interest ................................................................................................................................... 6
3.2 EV Brand Preference .......................................................................................................................... 9
Section 4 .......................................................................................................................................................... 10
Vehicle Familiarity and Opinions ..................................................................................................................... 10
4.1 Model Familiarity and Value ............................................................................................................... 10
4.2 Consumer Opinions ........................................................................................................................... 12
Section 5 .......................................................................................................................................................... 13
Next Vehicle Preference ................................................................................................................................... 13
5.1 Drivetrain Preference ......................................................................................................................... 13
5.2 Vehicle Options and Pricing Preferences ............................................................................................ 15
Section 6 .......................................................................................................................................................... 20
Electric Vehicle Charging Infrastructure .......................................................................................................... 20
6.1 Interest in Public Charging Stations .................................................................................................... 20
©2013 Navigant Consulting, Inc. Notice: No material in this publication may be reproduced, stored in a retrieval system, or transmitted by any means, in whole or in part, without the express written permission of Navigant Consulting, Inc.
25
Electric Vehicle Consumer Survey
Section 7 .......................................................................................................................................................... 22
Summary and Conclusions .............................................................................................................................. 22
7.1 Consumer Interest ............................................................................................................................. 22
7.2 Model Familiarity ............................................................................................................................... 22
7.3 Engine, Body Type, and Option Preferences ....................................................................................... 22
7.4 Public Charging Stations .................................................................................................................... 23
Section 8 .......................................................................................................................................................... 24
Acronym and Abbreviation List ....................................................................................................................... 24
Section 9 .......................................................................................................................................................... 25
Table of Contents ............................................................................................................................................. 25
Section 10 ........................................................................................................................................................ 27
Table of Charts and Figures ............................................................................................................................. 27
Section 11 ........................................................................................................................................................ 28
Scope of Study ................................................................................................................................................. 28
Sources and Methodology ............................................................................................................................... 28
Notes ................................................................................................................................................................ 28
©2013 Navigant Consulting, Inc. Notice: No material in this publication may be reproduced, stored in a retrieval system, or transmitted by any means, in whole or in part, without the express written permission of Navigant Consulting, Inc.
26

Electric Vehicle Consumer Survey
Section 10 TABLE OF CHARTS AND FIGURES
Chart 1.1 Favorability Ratings by Alternative Fuel Vehicle Type, United States: 2013 ..................................... 3
Chart 2.1 Vehicle Ownership, United States: 2013 ........................................................................................ 4
Chart 2.2 Vehicle Ownership by Drivetrain, United States: 2013 .................................................................... 5
Chart 3.1 Interest in a BEV at the $26,000 Price Point, United States: 2013 ................................................... 6
Chart 3.2 Likelihood to Purchase a BEV at the $15,000 Price Point with a Battery Lease, United States:
2013 ............................................................................................................................................ 7
Chart 3.3 Interest in PHEV at the $28,000 Price Point, United States: 2013 .................................................... 8
Chart 3.4 EV Preference by Brand, United States: 2013 ................................................................................ 9
Chart 4.1 Familiarity with Alternative Fuel Vehicle Models, United States: 2013 ............................................. 10
Chart 4.2 Value for Price by Alternative Fuel Vehicle Model, United States: 2013 .......................................... 11
Chart 4.3 Consumer Opinion on EVs, United States: 2013 ............................................................................ 12
Chart 5.1 Next Vehicle Drivetrain Preferences, United States: 2013 .............................................................. 13
Chart 5.2 First or Second Choice Plug-In Electric Vehicle Drivetrain Preference by Adopter Status, United
States: 2013 ................................................................................................................................ 14
Chart 5.3 Vehicle Body Type Preference, United States: 2013 ...................................................................... 15
Chart 5.4 Vehicle Body Type Preference by First or Second Choice Plug-In Electric Vehicle Drivetrain
Preference, United States: 2013 ................................................................................................... 16
Chart 5.5 Vehicle Options Preference, United States: 2013 .......................................................................... 17
Chart 5.6 Vehicle Options Preference by First or Second Choice Plug-In Electric Vehicle Drivetrain
Preference, United States: 2013 ................................................................................................... 18
Chart 5.7 Anticipated Price for Next Vehicle After Incentives, United States: 2013 ......................................... 19
Chart 6.1 Interest in Public Charging Stations, United States: 2013 .............................................................. 20
Chart 6.2 Price Willing to Pay per Charge, United States: 2013 .................................................................... 21
©2013 Navigant Consulting, Inc. Notice: No material in this publication may be reproduced, stored in a retrieval system, or transmitted by any means, in whole or in part, without the express written permission of Navigant Consulting, Inc.
27

Electric Vehicle Consumer Survey
Section 11 SCOPE OF STUDY
Navigant Research has prepared this report to provide participants involved in the automotive market with a study of consumer demand for alternative fuel vehicles, with an emphasis on electric vehicles. One of the major objectives of this report is to impartially assess levels of consumer interest in EVs, familiarity with EV models, and overall vehicle considerations. Navigant Research also examined consumer receptiveness to several BEV and PHEV options and public charging stations.
Great care was taken in constructing a survey questionnaire that would yield the most accurate and unbiased results possible. However, note that consumers often have difficulty providing survey responses that will accurately predict their purchase behavior for products that have not yet been introduced into the market.
SOURCES AND METHODOLOGY
Navigant Research conducted a web-based survey of 1,084 U.S. consumers in the fall of 2013 using a structured online questionnaire. The survey invitation was sent to a nationally representative and demographically balanced sample of consumers who are members of a large online panel. Respondents were offered a chance to win prizes in exchange for their participation. The margin of error for these survey results is +/- 3% with a 95% confidence interval.
Navigant Research is a market research group whose goal is to present an objective, unbiased view of market opportunities within its coverage areas. Navigant Research is not beholden to any special interests and is thus able to offer clear, actionable advice to help clients succeed in the industry, unfettered by technology hype, political agendas, or emotional factors that are inherent in cleantech markets.
NOTES
CAGR refers to compound average annual growth rate, using the formula:
CAGR = (End Year Value ÷ Start Year Value)(1/steps) – 1.
CAGRs presented in the tables are for the entire timeframe in the title. Where data for fewer years are given, the CAGR is for the range presented. Where relevant, CAGRs for shorter timeframes may be given as well.
Figures are based on the best estimates available at the time of calculation. Annual revenues, shipments, and sales are based on end-of-year figures unless otherwise noted. All values are expressed in year 2012 U.S. dollars unless otherwise noted. Percentages may not add up to 100 due to rounding.
©2013 Navigant Consulting, Inc. Notice: No material in this publication may be reproduced, stored in a retrieval system, or transmitted by any means, in whole or in part, without the express written permission of Navigant Consulting, Inc.
28

Electric Vehicle Consumer Survey
Published 4Q 2013
©2013 Navigant Consulting, Inc. 1320 Pearl Street, Suite 300 Boulder, CO 80302 USA Tel: +1.303.997.7609 http://www.navigantresearch.com
This publication is provided by Navigant Research, a part of Navigant Consulting, Inc. (“Navigant”), and has been provided for informational purposes only. This publication is intended for the sole and exclusive use of the original purchaser under terms and conditions agreed to by the parties. This publication may not otherwise be reproduced, recorded, photocopied, distributed, displayed, modified, extracted, accessed, or used without the express written permission of Navigant. Navigant makes no claim to any government data and other data obtained from public sources found in this publication (whether or not the owners of such data are noted in this publication), and makes no express or implied warranty, guaranty, or representation concerning the information contained in this publication, its merchantability, or its fitness for a particular purpose or function. Any reference to any specific commercial product, process, or service by trade name, trademark, manufacturer, or otherwise, does not necessarily constitute or imply an endorsement, recommendation, or favoring by Navigant. Navigant does not assume, and hereby disclaims, any liability that may result from any reliance on or use of any information contained in this publication, or for any loss or damage caused by errors or omissions in this publication. If you do not have permission from Navigant covering this publication, please refrain from accessing or using this publication. Please contact Navigant at [email protected] to obtain permission to use this publication.
©2013 Navigant Consulting, Inc. Notice: No material in this publication may be reproduced, stored in a retrieval system, or transmitted by any means, in whole or in part, without the express written permission of Navigant Consulting, Inc.
©2013 Navigant Consulting, Inc. Notice: No material in this publication may be reproduced, stored in a retrieval system, or transmitted by any means, in whole or in part, without the express written permission of Navigant Consulting, Inc.
29