research report 085 - hse.gov.uk · for the health and safety executive 2003 research report 085....
TRANSCRIPT
HSE Health & Safety
Executive
Reactor pressure relief of fluids containing suspended solids
Prepared by HEL Ltd for the Health and Safety Executive 2003
RESEARCH REPORT 085
HSE Health & Safety
Executive
Reactor pressure relief of fluids containing suspended solids
Dr Derick McIntosh, Dr Simon Waldram HEL Ltd
50 Moxon Street Barnet
Hertfordshire EN5 5TS
This report describes a project carried out to investigate the effects of the addition of inert suspended solids (fine glass particles) to both reacting (water and acetic anhydride) and non reacting (pure water or water/glycerol) systems. Depressurisation profiles from experiments with solids were compared to analogous profiles from experiments without solids. The experimentation was carried out using both 1 and 10 litre reactors connected to a catch tank via vent line and orifice nozzle. A pneumatically actuated ball valve, sited downstream of the nozzle, was used to act as the relief device, without restricting the flow. Computer control and data logging meant that an identical experimental procedure could be followed once the reactor was charged. Nozzles were used in the range 2 to 10.5 mm. Various size ranges of glass beads were used. They ranged from 4-45 µm to 250-425 µm for solid glass (with a density of 2500 kg m-3). Hollow glass beads with a density of 600 kg m-3 and in the size range 0-65 µm were also used. This resulted in particle to nozzle diameter ratios between 0.002 and 0.169. Wherever possible factorial design was used to reduce the number of experiments required.
This report and the work it describes were funded by the Health and Safety Executive, in conjunction with Great Lakes and Syngenta. Its contents, including any opinions and/or conclusions expressed, are those of the authors alone and do not necessarily reflect HSE policy
HSE BOOKS

© Crown copyright 2003
First published 2003
ISBN 0 7176 2699 7
All rights reserved. No part of this publication may bereproduced, stored in a retrieval system, or transmitted inany form or by any means (electronic, mechanical,photocopying, recording or otherwise) without the priorwritten permission of the copyright owner.
Applications for reproduction should be made in writing to: Licensing Division, Her Majesty's Stationery Office, St Clements House, 2-16 Colegate, Norwich NR3 1BQ or by e-mail to [email protected]
ii

EXECUTIVE SUMMARY
The design of pressure relief systems for two-phase liquid/gas or liquid/vapour flow is well established and researched. There is little guidance, however, on the sizing of relief systems when the discharge contains solids and the discharge is three-phase. Solids may be present as a reactant, a product, or a catalyst.
This report describes a project carried out to investigate the effects of the addition of inert suspended solids (fine glass particles) to both reacting (water and acetic anhydride) and non reacting (pure water or water/glycerol) systems. Depressurisation profiles from experiments with solids were compared to analogous profiles from experiments without solids. The experimentation was carried out using both 1 and 10 litre reactors connected to a catch tank via vent line and orifice nozzle. A pneumatically actuated ball valve, sited downstream of the nozzle, was used to act as the relief device, without restricting the flow. Computer control and data logging meant that an identical experimental procedure could be followed once the reactor was charged. Nozzles were used in the range 2 to 10.5 mm. Various size ranges of glass beads were used. They ranged from 4-45 µm to 250-425 µm for solid glass (with a density of 2500 kg m-3). Hollow glass beads with a density of 600 kg m-3 and in the size range 0-65 µm were also used. This resulted in particle to nozzle diameter ratios between 0.002 and 0.169. Wherever possible factorial design was used to reduce the number of experiments required.
Replicate tests showed that generally the temperature and pressure profiles were very repeatable. The two or three phase carryover from the reactor to the catch tank and, therefore the volume retained in the reactor did however vary significantly during numerous replicate tests. The variation was smaller on the 10 litre scale than on the 1 litre scale, and has been attributed to the random nature of bubble nucleation and to wall effects, the presence of which is accentuated on the smaller scale.
The data obtained from the pure water tests showed that the pressure and temperature profiles during venting were generally not influenced by the presence of solids (up to 30% v/v). There was some limited evidence that the presence of solids may enhance bubble nucleation and result in more bubbly or homogeneous flow rather than churn turbulent flow. A consequence of this would be that more liquid would be discharged from the reactor vessel in the early stages of venting.
An interesting conclusion was that the liquid was vented preferentially to the solids. This was observed with solids that were both more and less dense than the liquid, and even with surfactant in the liquid. With reacting solids, the implication is that the calorimetry studies required to obtain the information for vent sizing will be very difficult to define. The reaction rate per unit volume may increase if the solids become more concentrated.
Direct comparison of tests with and without solids is not straightforward. Comparisons have been made for a fixed fill level in the reactor vessel and for a fixed liquid volume with additional solids. The different volumes and glass content will hold different amounts of thermal energy at a fixed temperature, and hence will affect the vapour generation during cooling.
In reacting systems, the addition of glass increased the phi factor of the system and therefore reduced the reaction runaway rate. During rapid runaway, the glass temperature can lag behind that of the liquid. The effect of this is increased with larger glass diameter. Similarly, the heat transfer to the reactor body itself can mean that the reactor temperature lags behind
iii

that of the reacting liquid. The effective phi factor of the system may therefore change during runaway.
A general conclusion from these preliminary studies is that for the range of conditions studied, the inert solids had little influence on the rates of depressurisation observed. Under these limited ranges of conditions the vent sizing methodology as defined by DIERS can therefore be used with the same confidence for three-phase as for two-phase discharges. However, the effect of differential venting of solids may need to be considered
iv

ACKNOWLEDGEMENTS
This work was co-sponsored by the Health and Safety Executive, Great Lakes Fine Chemicals and Syngenta. The inputs from Mrs Janet Etchells (Health and Safety Executive), Mr Graham Arthur (Syngenta), Dr Caroline Ladlow (Ciba Speciality Chemicals), Dr Allan Timms (Great Lakes Fine Chemical Company) and Ms Jill Wilday (Health and Safety Laboratory) are gratefully acknowledged.
v

vi

CONTENTS
EXECUTIVE SUMMARY ...................................................................................................... I
ACKNOWLEDGEMENTS .................................................................................................. III
1 INTRODUCTION ........................................................................................................... 1
2 METHODOLOGY AND OBJECTIVES ...................................................................... 3
3 LITERATURE SURVEY................................................................................................ 5
4 EXPERIMENTAL DESIGN .......................................................................................... 7
5 EXPERIMENTAL PROCEDURES .............................................................................. 9
5.1 EXPERIMENTAL METHOD ...................................................................................... 9
5.2 EQUIPMENT ................................................................................................................ 9
5.3 CHOICES OF FACTOR VALUES ............................................................................ 12
5.4 EXPERIMENTAL DESIGNS .................................................................................... 14
5.5 REACTING SYSTEM ................................................................................................ 15
6 RESULTS ....................................................................................................................... 23
6.1 INITIAL TESTS.......................................................................................................... 23
6.2 INITIAL GLASS/WATER TESTS............................................................................. 26
6.3 FURTHER TESTS ON LARGE 10 LITRE SCALE .................................................. 39
6.4 REACTING STUDIES ON THE 10 LITRE SCALE ................................................. 43
7 FURTHER DISCUSSION ............................................................................................ 55
7.1 REPRODUCIBILTY OF RESULTS .......................................................................... 55
7.2 STIRRING EFFICIENCY .......................................................................................... 55
7.3 TEMPERATURE VARIATION WITHIN THE VESSELS....................................... 56
7.4 APPROACH TO THERMAL EQUILIBRIUM.......................................................... 56
7.5 BALANCE READINGS ............................................................................................. 58
7.6 BASIS FOR SCALE UP ............................................................................................. 58
8 CONCLUSIONS ............................................................................................................ 59
8.1 RESULTS FROM DEPRESSURISATION OF SUPERHEATED LIQUIDS ........... 59
8.2 RESULTS FOR DEPRESSURISATION OF A REACTING SYSTEM DURINGEXOTHERMIC RUNAWAY .............................................................................................. 60
9 RECOMMENDATIONS FOR FUTURE WORK...................................................... 61
9.1 STUDIES ON THE EFFECTS OF SOLIDS ON NUCLEATION AND BOILINGDURING VENTING ............................................................................................................ 61
9.2 STUDIES AT DIFFERENT FLOW REGIMES ......................................................... 61
9.3 STUDY OF SLIP VELOCITY DURING VENTING ................................................ 61
9.4 SOLID DEPOSITION IN DOWNSTREAM PIPEWORK......................................... 61
vii

9.5 STUDY OF REACTION RATES DUE TO INCREASING CONCENTRATION OFSOLIDS ................................................................................................................................ 61
9.6 COMPARISON METHODS FOR RESULTS FROM REACTING SYSTEMS ....... 62
9.7 THE INFLUENCE ON VENTING OF INERT AND REACTING SOLIDS ............ 62
9.8 DETAILED MODELLING ........................................................................................ 62
9.9 LARGER SCALE STUDIES ...................................................................................... 62
10 NOMENCLATURE....................................................................................................... 63
11 REFERENCES...............................................................................................................65
APPENDIX A ......................................................................................................................... 67
A.1 MULTIPHASE VENTING ........................................................................................... 67
A.2 FLOW REGIMES.......................................................................................................... 68
A.3 BUBBLE BEHAVIOUR ............................................................................................... 68
A.4 PRESSURE DROP IN PIPELINES .............................................................................. 69
A.6 PRESSURE DROP IN SLURRY LINES ...................................................................... 71
A.7 EFFECT OF SUSPENDED SOLIDS ON PHYSICAL PROPERTIES ........................ 72
A.8 CALORIMETRY FOR HETEROGENEOUS REACTIONS ....................................... 72
A.9 OTHER RELATED RESEARCH WORK .................................................................... 73
APPENDIX B.......................................................................................................................... 77
B.1. CONSISTENCY DATA FOR DEPRESSURISATION OF SUPERHEATED WATER ON THE 1 LITRE SCALE ................................................................................................... 77
B.2. CONSISTENCY DATA FOR DEPRESSURISATION OF SUPERHEATED WATER ON THE 10 LITRE SCALE ................................................................................................. 78
APPENDIX C ......................................................................................................................... 81
C.1. TEST CONDITIONS FOR HALF FACTORIAL EXPERIMENTAL DESIGN ......... 81
APPENDIX D ......................................................................................................................... 83
D.1 ANALYSIS OF FACTORIAL EXPERIMENTS (NON REACTING) ON 1 LITRESCALE.................................................................................................................................. 83
D.2 ANALYSIS OF FACTORIAL EXPERIMENTS (NON REACTING) ON 10 LITRESCALE.................................................................................................................................. 86
viii
1 INTRODUCTION
Pressure relief devices and their associated pipe work are commonly used to maintain system integrity in situations that could otherwise lead to over-pressurisation, and possible mechanical failure and/or rupture of part of the system. A useful overview of this subject is provided, for instance, in Lees1, volume 1, section 12.12, p 12/46. Some common causes of overpressure might be:
· supply of a liquid or gas stream at a pressure above the Maximum Allowable Working Pressure (MAWP) of the system.
· over-heating, e.g. from steam heating coils in a reactor, or by direct heating in a fire. · thermal expansion of a liquid and consequent hydraulic compression. · evolution of a non-condensable gas.
The design of pressure relief systems can be a complex task: one complicating factor is when exothermic chemical reactions are occurring. A number of process failures may lead to an increase in temperature and a possible thermal runaway reaction. This will only expire when the reactants have been consumed and all thermal activity ceases. Because of the increase in temperature the reaction rate will accelerate, the vapour pressure of the reactor contents is likely to rise, and non-condensable gases such as nitrogen or carbon dioxide may be produced. Runaway reactions of this type have been at the heart of many major industrial incidents: see for instance case histories of the accidents at Seveso and Bhopal in Appendices 3 and 5 respectively in volume 3 of Lees1. Other runaway reaction incidents are described in Partington et al2, “Release of chemicals from International Biosynthetics Ltd”, HSE Books3
and “Report of investigation into a major accident at Hickson Pharmachem Ltd.” HSA report4.
Twenty five years ago there was a developing recognition of the need to have sound procedures for the design of reactor pressure relief systems. As a result, in 1976 a consortium of 29 companies formed the Design Institute for Emergency Relief Systems (DIERS) under the auspices of the American Institute of Chemical Engineers. Sixteen years later their project manual was published5. This defined methodologies for reactor pressure relief line sizing calculations that have been, or are now being, adopted as “best practice” in many countries. The DIERS project still continues in the United States and a DIERS users group meet regularly in Europe. In the UK the HSE have produced their own Workbook6 based on the main hand calculation methods that were developed as part of the DIERS project. For the purposes of this project we will assume that DIERS calculation methods are appropriate for sizing pressure relief lines in which two phase flow is present. The key question is whether they may also be used in circumstances where there are three phase flows.
General aspects of controlling the hazards associated with exothermic chemical reactions are discussed in Barton and Rogers7 and Steinbach8. A “Thematic network” on hazard assessment of highly reactive systems was also funded from 1998 to 2002 as part of the European Community “Industrial and materials technologies programme.” The end products from this group’s activities are available free of charge via their website at http://www.harsnet.de. These include HarsBook - technical chapters about aspects of exothermic reaction hazards, experimental measurements and safe storage, as well as HarsMeth - a methodology for assessing exothermic reaction hazards and the risks associated with them. Educational material on these same topics is also available from the website via the HarsEdu section.
When the contents of a reactor are depressurised it is common for the discharge, for at least part of its duration, to be composed of two-phases. In other words the reactor behaves a little like a shaken bottle of champagne which is suddenly allowed to depressurise as the cork is ejected. Pressure relief line sizing calculations must take account of whether such two-phase
1
flow will occur. Although such situations are covered by the DIERS methodology and procedures, there are still some aspects of reactor pressure relief for which more good guidance is required. These include dealing with highly viscous systems, laminar flow and systems in which the fluids have complex rheology. Another major problem area concerns reactors that contain suspensions of solids and liquids. This is not unusual: for instance the solid phase might be a heterogeneous catalyst, (e.g. a platinum group metal on a porous carbon support particle, for a hydrogenation reaction,) a partially dissolved reactant or a solid product that is crystallizing as the reaction proceeds. There is little guidance about how to allow for the presence of such solids when sizing a pressure relief system. The purpose of this project is to take the first initial steps to help meet this need.
2

2 METHODOLOGY AND OBJECTIVES
The methodology of the project was to carry out a large number of depressurisation experiments in 1 litre and 10 litre vessels. Experiments were conducted over a wide range of conditions. Analogous experiments were made in the absence of, and with the presence of, solid particles. The objective was then to define those conditions (or combination of conditions) for which the presence of the solids in the vessel had no discernable effect on the pressure relief from the vessel. In these cases the DIERS two-phase equations for sizing a frictionless nozzle on the reactor may be used with confidence even though 3 phase flow may be present during part of the depressurisation. Intuitively it seems reasonable to expect that at low concentrations of very small particles, the DIERS methodology will be appropriate.
It is important to stress that this project does not address the following aspects of reactor depressurisation:
· experiments on a scale larger than 10 litres. · deposition of solids in a vent line or other item of process plant downstream of the
reactor. · detailed evaluation of the increased concentration of the solids in the reactor due to
flashing off of the liquid phase during depressurisation. This could accelerate the reaction, e.g. because of the consequent increase in catalyst concentration within the reactor.
The effects of the following variables were studied: · liquid phase.
o Water. o Water/glycerol mixtures. o Reacting mixtures of acetic anhydride and water.
· vessel fill level. · pressure relief nozzle diameter. · particle concentration. · particle size. · particle density. · stirring intensity. · presence of surfactant.
3

4
3 LITERATURE SURVEY
A literature survey has revealed that there are very few references that describe pressure relief of three-phase mixtures of liquids, solids and gases or vapours. The survey covers a number of aspects of multiphase flow, including:
· flow regimes · bubble behaviour · pressure drop in pipelines · pressure drop in slurry lines · effect of suspended solids on physical properties · calorimetry for heterogeneous reactions · other related research work
Some of these topics are not addressed directly in this study and therefore the whole literature survey is given in Appendix A.
One particularly important study is by Beyer and Steinbach9 and is based on Beyer’s PhD research at the Technical University of Berlin. The work involved comparing the depressurisation of superheated water with that of superheated water containing glass solids. The test apparatus consisted of a 1.1 litre adiabatic Dewar system connected to a 120 litre catch tank via a fast opening ball valve. Testing has been performed using water/glass particle mixtures and depressurising from 4 barg. Comparison of data from pure water and water/glass mixtures has shown that the presence of the glass particles promotes multiphase flow. The particle diameter and the solids fraction both have major influences. Smaller particles more readily induce multiphase flow. Whether this is due to the effective increased viscosity, or the presence of more bubble nucleation points promoting more homogeneous flow has not yet been investigated. In spite of the promotion of multiphase flow, very little solid was carried over during venting. There are some problems in comparing like with like – the addition of glass particles at a constant fill level reduces the volume of water and the level swell will undoubtedly be affected. Increasing the viscosity of the liquid phase without changing the latent heat, heat capacity, density or vapour pressure may be impossible.
A second study that is relevant is that by Chan et al10, where a high pressure (38 and 70 bar) pilot scale study of three-phase venting was performed. A 112 litre pressure vessel rated to 100 bar and 300°C was connected to an 1100 litre catch tank. The venting profiles have been compared to those predicted by SAFIRE. The results of the comparisons show that in the case of the water/steam system, the actual pressure drop was quicker than the SAFIRE prediction. This has been attributed to non-homogenity in the reactor. With the addition of terephthalic acid, the actual and predicted pressure profiles were in much better agreement. A logical conclusion is that the presence of the solid does have some effect on the flow from the reactor. The effect of the solid on the venting mass flux was not investigated.
A full list of references is given in section 11.
5

6

4 EXPERIMENTAL DESIGN
As can be seen from section 2 there are a large number of variables to be studied in this project. There are still more that could have been included (for instance the relief set pressure). In these circumstances it is important to plan experiments, execute the experimental work and process and analyse the results in a structured and efficient manner. To achieve this, statistical experimental design techniques have been used: see Davies11 for an introduction to this topic.
The classical experimental approach would be to hold all variables, bar one, at constant values and then to measure the effect of that variable on some chosen output or objective function (such as batch reaction time, product yield or the time to blow down to a certain pressure.) This would then be repeated with each variable in turn. In the language of experimental design the variables are called “factors” and the observed output(s) are called “response(s).” A more efficient way of gathering information about which factors have a significant effect on the response is from a two level factorial design. In this case, normal (or centrepoint) conditions are defined, as is a range for each factor: the lower extreme of this range is the “low” or “-1” value of the factor and the upper extreme the “high” or “+1” value. Experiments are then defined in which the only permitted values of the factors are the –1 and +1 values. In a full two level factorial design all possible combinations of these factors are studied. This means that 2n experiments are carried out where n is the number of factors to be altered. Thus to determine the effects on the response of 3 factors, 8 experiments are needed: study of 4 factors will require 16 experiments. In addition there will be a centrepoint experiment, i.e. one in which all factors have a 0 value: this represents the “normal” conditions. The centrepoint experiment is often repeated several times to reveal the scatter of results from replicate experiments. The effects of each factor, and each combination of factors, can then be compared to this background scatter to judge whether a statistically significant alteration in the response is observed from any particular experiment.
When the effects of many factors are to be examined then very large experimental programmes are required. In these cases fractional factorial designs (e.g. half or quarter) can be used to reduce the required number of experiments (e.g. by factors of 2 or 4). However, a compromise must be made: such designs lose the ability to discriminate clearly between the effects on the response of combinations of factors.
As an example, a full level factorial design involving 6 factors would require 26, or 64, experiments. Statistical analysis of the results enables the effect on the response variable to be estimated not only for every factor, but also for all possible combinations of factors. A half factorial design would only involve 32 experiments, and hence half of the experimental effort. The effect on the response variables of individual factors, and of pairs of factors, can still be clearly identified from the more limited experimental results. The effect of 3 level interactions are combined in pairs, however, so care must be taken with data interpretation. Because strong 3 level, and higher, interactions are quite rare in practice, in many real applications there is no significant loss of information when moving from full to fractional factorial design.
Planning such experiments, and interpreting the results from them, can be tedious and complex but the use of standard software packages avoids many of these difficulties. In this project the “Design expert” software was used, see http://www.statease.com
7

8

5 EXPERIMENTAL PROCEDURES
5.1 EXPERIMENTAL METHOD
The initial studies were on mixtures of water and glass. The pressure was developed by superheating the liquid and the multi-phase flow was generated by simple depressurisation. A “reactor” connected to a vented catch tank was used, in order to separate and contain the vented liquid/solid and vapour. Some vapour losses were present.
5.2 EQUIPMENT
5.2.1 One litre scale
A schematic diagram of the 1 litre apparatus is shown in figure 1. The test rig consisted of a reactor vessel, a vent line and a catch tank. The reactor was a 1 litre, jacketed, baffled, stainless steel Büchi vessel, rated to 60 bar. Thermocouples, a pressure transducer, a bleed valve, a magnetic drive coupling, an overpressure relief valve and the vent line were incorporated into the reactor top plate. A Rushton type turbine and a baffle system were used for the agitation of the mixtures, and a second impeller was added following the initial factorial design experiments.
The reactor was connected to the catch tank via a 12.7 mm (½”) vent line that incorporated a pneumatically operated ball valve. When open this gave full bore unobstructed flow. The vent line was connected to the reactor via a fitting that was designed to hold a variety of different sized nozzles. The nozzles were basically small discs (14mm diameter and 3 mm thick) with a central hole that was drilled and reamed to a fixed diameter. The automatic ball valve was sited just downstream of the nozzle and was fitted with a microswitch that allowed the position of the valve to be noted. This was used to estimate the length of time the valve took to fully open and to keep a check on the consistency and reproducibility of the valve actuation and opening.
An oil heater/chiller circulator was used to provide heat to the reactor via the oil jacket.
The catch tank was a plastic vessel that had a hole in its lid and in the side. The vent line entered the side of the vessel and protruded through the vessel wall. In later tests, a deflector plate was attached to the end of the vent line to prevent movement of the catch tank due to high inertia forces of the vent flow on the opposing wall of the vessel. The catch tank was placed on a balance to allow continuous measurement of the mass carried over during venting, as a function of time.
Control and data logging was achieved using HEL WinISO software. This allows data acquisition at a maximum logging rate of 10 points per second. The exception was the balance reading, which, due to the balance design itself, could only be updated every 0.5 seconds. Other than during the venting stage of the experiment, the data was only logged every 20 seconds.
9

Emergency
PT
l
Oil heater
/
l
Vent
Catch Tank Baff ed Reactor chiller
Pneumatically operated ball va ve
Nozzle holder
relief valve
Manual relief valve
Balance
Figure 1 Schematic diagram of 1 litre test apparatus
5.2.2 Experimental Procedure
The same general procedure was used for all the tests on the 1 litre vessel:
· Charge the materials and seal the reactor. · Set the oil to heat and hold at 175°C. · Keep the automatic ball valve open until the boiling point of the liquid is reached. · Close the vent valve. · Allow the reactor contents to reach the relief pressure/temperature. · Turn off the oil heater and wait 6 seconds. · Open the relief valve and vent the reactor until the temperature drops to 101°C or the
pressure reaches 1.05 bara. · Close the relief valve and allow the reactor to cool.
This procedure was adopted to ensure that the liquid (usually water) was fully degassed prior to heating (although it was boiled vigorously before charging) and that any non-condensable gas in the reactor was removed. The 6 second delay was incorporated to allow the data logging rate to be changed to the maximum rate without any delays caused by the software controls. Once initiated, the experimental procedure was fully automated and computer controlled. This resulted in highly reproducible experimental sequences.
The degassing step was not carried out on the 10 litre scale (see section 6.1, which shows that there was no effect). Rather than heating the system to boiling point with the valve open, a vacuum was pulled in the head space prior to the test. This removed almost all of the pad gas in the reactor.
10

5.2.3 10 litre scale
A 10 litre vessel was designed and built for this project (see figure 2). It consisted of two flat end plates and a cylindrical wall section. A series of 8 tie rods clamped the cylindrical section between the end plates. The top plate incorporated similar fittings and connections to those on the 1 litre vessel, i.e. temperature and pressure measurement, relief line, pressure relief valve, bleed valve and stirrer coupling. Two impellers were installed on the stirrer shaft, and four baffles were attached via the underside of the lid. An additional charging port was installed to allow easier charging of the solids. The bottom plate incorporated an outlet valve and 4 electrical rod heaters. The heaters were rated at 0.75 kW each and were controlled from the electronics and computer.
The catch tank and balance from the 1 litre scale experiments were retained and used for much of the experimentation. The exceptions were for the reacting experiments and the tests using surfactant. For the reacting tests it was important to prevent discharge of the vapours. The catch tank was replaced with a sealed vessel that was in turn connected to a sparged quench vessel. In order to aid condensation of the vapours, approximately 8 kg of water were placed in the catch tank prior to the test. This worked well and there was very little mass loss from the system overall. The line between the catch tank and the quench tank was fitted with a solenoid bleed valve that was opened following venting to prevent the cooling vapours in the catch tank creating a vacuum and sucking back liquid from the quench tank.
Catch tank separators are unsuitable for treating stable foams, hence for the tests with surfactant the vent line from the reactor was extended so that the discharge was sparged into the liquid in the catch tank. The second quench tank was retained as a precaution.
Figure 2 Schematic diagram of 10 litre vessel
11

5.3 CHOICES OF FACTOR VALUES
5.3.1 Particle size
The solid particle sizes were dictated largely by the diameter ranges of glass beads that were readily available. The ranges are given in table 1, and this also shows the particle to nozzle diameter ratio for the systems used, based on the median value for the diameter range used. The hollow glass particles have a wider diameter range (0-65 µm) than the smallest solid glass (4-45 µm) but the median particle diameter is similar.
Table 1 Median particle to nozzle diameter ratios and the glass particle diameter ranges
Nozzle Particle to nozzle diameter ratio for the glass particle diameter range (based diameter on median particle diameter)
(mm) 4-45µm 70-110µm 150-250µm 250-425µm 0-65µm (hollow glass)
2 0.012 0.045 0.100 0.169 0.016 5 0.005 0.018 0.040 0.068 0.007 7 0.004 0.013 0.029 0.048 0.005 9 0.003 0.010 0.022 0.038 0.004
10.5 0.002 0.009 0.019 0.032 0.003
5.3.2 Particle concentration
Various particle concentrations, typically up to 30% by volume, were used in the experimentation. The presence of fine solids changes the apparent viscosity of the mixture. Several methods for estimation of the viscosity are given in Appendix A.7. Table 2 shows the calculated increase in the viscosity, due to the presence of solids, using the various correlations. Although they are obviously all different, the figures are similar. With 8% by volume solids, the average increase in viscosity is a factor of 1.22. At 16% by volume solids, the average is a factor of 1.57.
Table 2 Ratio of two-phase to single phase viscosity, showing effect of addition of solids
Fraction Barnea Barnea of Einstein Thomas Mooney and and Mori and Fan and
Ototake Tsuchiya solids (equation (equation (equation Mizrahi Mizrahi (equation (equation Average (% by 23) 24) 25) (equation (equation 28)volume) 26) 27) 29)
8 1.20 1.27 1.26 16 1.40 1.70 1.69 30 1.75 3.05 3.91
1.16 1.28 1.28 1.07 1.22 1.37 1.71 1.69 1.45 1.57 2.04 3.20 3.13 5.94 3.29
See section A.6, Appendix A for equations
12

5.3.3 Nozzle size
Nozzle diameters from 0.5 to 10.5 mm were possible using the apparatus. On the 1 litre scale, 2 and 5 mm nozzles were used. Non-reacting systems on the 10 litre scale used 5, 7 and 9 mm nozzles, and the reacting systems and foaming systems used a 10.5 mm nozzle.
5.3.4 Stirring rate
In the factorial experiments, the maximum stirring rates were chosen to give good mixing of the solids. This was judged visually in a geometrically similar glass reactor. At the low stirring level, the stirrer gave poor mixing and partial settling of the solid glass. Some stirring was necessary to maintain a thermal equilibrium within the reactor during heating. Attempts were made to scale up the stirrer speed from the 1 litre to the 10 litre scale, maintaining a constant tip speed. This was not possible at the low stirring level as the motor could not turn smoothly at a sufficiently slow speed. The stirring speeds used on the 1 litre scale ranged from 30 to 1600 rpm. On the 10 litre scale the analogous limiting values were 50 and 550 rpm.
5.3.5 Fill level
On the 1 litre scale, high and low fill levels corresponding to 900 and 500 ml respectively (0.1 and 0.5 void fraction) were used, with the centrepoint case of 700 ml (0.3 void fraction).
On the larger 10 litre scale, the high and low values for the non-reacting water system corresponded to 9000 and 7000ml respectively (0.1 and 0.3 void fraction) with a centrepoint case of 8000ml (0.2 void fraction).
5.3.6 Particle density
The density of the solid glass was 2500 kg m-3 and the hollow glass had a density of 600 kg m-3. These give liquid:solid density ratios with water of 0.4 and 1.67 respectively.
5.3.7 Glycerol concentration
Tests involving glycerol were only carried out on the 10 litre scale. A glycerol concentration of 25% w/w was used. The addition of the glycerol changed the density of the liquid from 1000 to 1060 kg m-3. With a mixture containing 25% glycerol, the viscosity is approximately double that of water.
5.3.8 Surfactant
The tests using foaming systems were performed using a 7 litres charge of liquid, or solid/liquid, and an additional 7 ml of detergent, containing a mixture of surfactants. This is similar to blowdown tests described in the DIERS project manual5 where 1000 ppm by volume of detergent was used.
13

5.4 EXPERIMENTAL DESIGNS
Some aspects of the experiments and experimental designs evolved and were changed during the progress of the research.
5.4.1 One litre experiments
In the small scale experiments, two separate factorial designs were carried out with nozzle diameters of 2 mm and 5 mm. This was due to the difficulties of varying both solid concentration and nozzle diameter whilst simultaneously assessing the effect of the solids on depressurisation profiles. In each of these studies, the factors that were considered were solid concentration (volume fraction), solid diameter (particle to nozzle diameter ratio), stir speed (Reynolds number) and fill level (void fraction). The high, low and centrepoint values of each factor for each nozzle diameter are given in tables 3 and 4.
With the 2 mm nozzle, the data and depressurisation profiles from the glass/water tests were compared with analogous results from tests run with the same fill level of pure water. The pure water tests were run with a fixed stir speed of 200 rpm. A similar approach was then used for experiments involving the 5 mm nozzle though in this case the full range of stir speeds (from 30 to 1000 rpm) was used.
The “high” value of stir speed was changed between the two series of tests, but it should be noted that the tests using the 2mm nozzle were carried out using a single impeller on the stirrer shaft and the tests with the 5 mm nozzle had two impellers. The stirring was much improved by the addition of the second impeller.
Table 3. High and low factor values for 2 mm nozzle experiments
Factor Low Centre point High
Volume (ml) 500 700 900
Stir speed (rpm) 30 200 1600
Solid concentration (% v/v) 5 17.5 30
Solid diameter (µm) 4-45 70-110 250-425
Median particle to nozzle diameter ratio 0.011 0.045 0.169
Table 4. High and low factor values for 5 mm nozzle experiments
Factor Low Centre point High
Volume (ml) 500 700 900
Stir speed (rpm) 30 200 1000
Solid concentration (% v/v) 5 17.5 30
Solid diameter (µm) 4-45 70-110 250-425
Median particle to nozzle diameter ratio 0.005 0.018 0.068
14

5.4.2 Ten litre experiments
For the larger scale experiments a slightly different approach was taken. Tests using different sized nozzles and different fill levels were directly compared. Six factors were considered in a single factorial design. The factors were:
· Fill level · Stirring rate · Solid concentration · Solid diameter · Glycerol concentration · Nozzle diameter
It would be expected that reactor fill level and nozzle diameter would have an immediately identifiable and obvious effect on the venting characteristics. However, the interest is in the effects of the presence of the solid, the solid diameter, and any interaction of the solids with, for example, stir rate. These effects should be able to be identified by analysis of the data from the experiments specified by the experimental design.
A half fraction factorial design with three replicate centrepoint cases was carried out, and three individual tests were repeated (giving 38 tests in total). Replicate tests are used to give a direct measure of the experimental error that is present between tests. Table 21 in Appendix C shows the individual test conditions.
5.5 REACTING SYSTEM
5.5.1 Choice of system
Several properties were desirable when choosing the reacting system. The reaction needed to be proceeding at a relatively high rate during venting so as to promote multiphase flow and to test venting under demanding conditions. Additionally, the large scale vessel has a high thermal inertia (f factor) and therefore a high fraction of the heat of reaction would be absorbed by the vessel itself during slow periods of an exotherm.
The exothermic reaction of propionic anhydride and isopropanol (in a 1:1 mole ratio) was initially considered, and small scale adiabatic tests were run using similar phi factors (f, as defined in the Nomenclature, section 10) to those that would be expected on the 10 litre scale. The maximum pressure attained in these tests was ~2.3 bara, and venting on the large scale would have had to be at a very low pressure. Venting would also have been at a point late in the reaction where depletion of the reactants was significant and the reaction was almost complete. It should be noted that in these adiabatic tests the reactants were initially heated to 70°C before adiabatic conditions were imposed. The resultant pressure increase was higher than if the reactants had been allowed to react from their “onset” temperature.
The exothermic reaction of methanol and acetic anhydride (in a 2:1 mole ratio) was also considered but displayed the same disadvantages, i.e. at phi factors corresponding to that for the 10 litre scale experiment, only relatively low pressures were developed by the end of the reaction. Although widely studied, it is also of little commercial interest.
The reaction of water and acetic anhydride to make acetic acid was eventually chosen for several reasons - the reaction mechanism is much simpler, the flammability hazard is reduced by using water rather than methanol, and preheating of the materials prior to charging was therefore considered safer. The stoichiometry of this reaction is 1:1, but examination of
15

vapour pressure data by modelling showed that a slight excess of water would generate a higher pressure, and hence the reaction was run with a 3:2 water:acetic anhydride mole ratio. Perhaps more importantly, this vigorous exothermic reaction has been involved in a several publicly reported incidents (Barton and Rogers7, Leigh and Krzeminski12 and the IChemE accident database13) in either storage vessels or reactors. Leigh and Krzeminski12 quote an incident where water had entered a storage tank containing acetic anhydride and 15% acetic acid at ambient temperature. The resultant overpressure and vessel rupture killed one person and injured 20 more.
5.5.2 Thermokinetics and adiabatic calorimetry on the reaction between acetic anhydride and water
Figures 3 and 4 show the data from a low phi factor test (phi = 1.06) performed using the PHI-TEC II apparatus. The acetic anhydride was added to the test cell and heated to 25°C. The water was than sucked in under vacuum and the test cell quickly reheated to 25°C. Thereafter the reaction was allowed to progress under adiabatic conditions.
Figure 3 shows that a pressure of 12 bara and a temperature of 197°C were attained at the end of the reaction. This maximum pressure is well within the 20 bar rating of the 10 litre reactor vessel. Figure 4 shows that a maximum self-heat rate of 195°C min-1 was observed.
0
50
100
150
200
0
4
8
12
16
)
water added
TemperaturePressure
Tem
pera
ture
(°C
Pres
sure
(bar
a)
0 20 40 60 Time (minutes)
Figure 3 Temperature and pressure versus time from PHI-TEC test (phi = 1.06)
Water and acetic anhydride (mole ratio 1.5)
16

0.1
1.0
10.0
100.0
1000.0 (
maximum dT/dt = 195 °C/min
dT/d
t°C
/min
)
0 50 100 150 200 Temperature (°C)
Figure 4 Self heat rate against temperature, from PHI-TEC test (phi = 1.06)
Water and acetic anhydride (mole ratio 1.5)
A similar test was performed with a higher phi factor, 2.45, which would correspond to a fill level of 5000ml of reactants in the large, 10 litre, reactor. In this test, the acetic anhydride was heated to 63°C before the water was added. Additionally, the test cell heater was kept on (at a power that gave a heat rate of ~3°C min-1) until the reactants reached 90°C. It was felt that these conditions could be replicated on the larger scale. Figures 5 and 6 show the temperature and pressure profiles and the self-heat rate observed during the test. A maximum pressure of 2.2 bara and a maximum heat rate of 14.4°C min-1 were attained
0
50
100
150
0.0
1.0
2.0
3.0
)
Water added
TemperaturePressure
Tem
pera
ture
(°C
Pres
sure
(bar
a)
0 10 20 30 40 Time (minutes)
Figure 5 Temperature and pressure versus time from PHI-TEC test (phi = 2.45)
Water and acetic anhydride (mole ratio 1.5) with electrical heating to 90°C at ~3 °C min-1
17

15
10
5
0
maximum dT/dt = 14.4 °C/min
dT/d
t (°C
/min
)
0 50 100 150 Temperature (°C)
Figure 6 Self heat rate against temperature, from PHI-TEC test (phi = 2.45)
Water and acetic anhydride (mole ratio 1.5) with electrical heating to 90°C at ~3 °C min-1
A further low phi factor test (phi = 1.05) was performed, this time following the proposed procedure for the large scale testing. The acetic anhydride was heated to 50°C before the water was charged by sucking it in under a vacuum. The reactants were then heated to 80°C at approximately 10°C min-1 (as was expected in the 10 litre reactor with the heaters on at full power). Figure 7 shows that a maximum pressure of 18.7 bara was observed. Figure 8 shows that a much higher self-heat rate of 4093°C min-1 was observed.
The very strong effect of the phi factor can be seen in the differences in these tests. It should be noted that the low phi-factor test was started at a lower temperature, and the heating was turned off at a lower temperature, 80°C rather than 90°C. If exactly the same procedures had been followed then a higher maximum temperature and self-heat rate would have been attained in the low phi-factor test.
18

0
50
100
150
200
250
0
4
8
12
16
20
)
electrical heating turned off
water added
TemperaturePressure
Tem
pera
ture
(°C
Pres
sure
(bar
a)
0 5 10 15
Time (minutes)
Figure 7Temperature and pressure versus time from PHI-TEC test (phi = 1.05)
Water and acetic anhydride (mole ratio 1.5) with electrical heating to 80°C as used with the 10 litre vessel
0
1000
2000
3000
4000
5000
dT/d
t (°C
/min
)
maximum dT/dt = 4093°C/min
0 50 100 150 200 250
Temperature (°C)
Figure 8Self heat rate against temperature, from PHI-TEC test (phi=1.05)
Water and acetic anhydride (mole ratio 1.5) with electrical heating to 80°C as used with the 10 litre vessel
19

5.5.3 Addition of glass
An additional problem with the tests on reacting systems was how to compare the results from the two-phase and three-phase systems. When the glass is added to a specified mass of reactants, the thermal inertia (phi factor) increases, and the results from the tests are then not directly comparable. In an attempt to compensate for this, an equal mass of large glass beads (3 mm diameter) was added to the liquid as thermal ballast in the tests that were to be run without any small glass particles present. The larger glass beads have a greater settling velocity and as a result would not be carried over from the reactor during venting.
5.5.4 Large scale tests
Once it was clear that the 10 litre reactor could withstand the maximum pressure that had been obtained in a low phi factor test, with an procedure analogous to that proposed for the 10 litre scale, two initial tests were performed on the larger scale. The purpose was to establish whether or not the reaction was still sufficiently vigorous to cause venting even at the highest phi factor to be used (i.e. the lowest reactant fill level with the maximum amount of glass). When calculating this phi factor, the mass of the reactor was taken as equal to that of the vessel end plates and body. In reality, because the reactor was quite massive, there will be significant temperature gradients through the reactor components particularly during a fast thermal runaway.
These closed system tests were set up with automatic termination and immediate venting if the reactor pressure exceeded 13 bara (this condition was never met in any of the tests). In the first test, both liquids were charged to the reactor and the mixture heated quickly to 25°C. The reaction was then allowed to proceed to completion. Figure 9 shows the temperature and pressure history of the test. A maximum pressure of 2.1 bara and a maximum temperature of 129°C were observed. Figure 10 shows the self-heat rate plotted against temperature. A maximum rate of 8°C min-1 was observed at 97°C.
This test did not give the desired vigorous reaction, and the test was repeated with more heat input. The acetic anhydride was heated to 50°C before addition of the water, and after resealing the reactor, the electric heaters were switched on at 100% until the reactants reached 80°C. The reaction was then allowed to proceed naturally. In this test a maximum pressure of ~10 bara was generated and a maximum self-heat rate of 524°C min-1 was observed (see figures 11 and 12). The relief condition for all blowdown tests was chosen as 3 bara, which was just as the reaction started to accelerate very rapidly, and yet there was still a significant fraction of the reaction still to occur.
20

150 3
Tem
pera
ture
(°C
)
Pres
sure
(bar
a)
heat to 25°C
Reactor TemperatureReactor Pressure
100 2
50 1
0 0 0 20 40 60 80 100
Time (minutes)
Figure 9 Temperature and pressure profiles from closed test in 10 litre vessel
Water and acetic anhydride (mole ratio 1.5), start temperature 25°C, phi factor = 2.45
10
maximum dT/dt = 8 °C/min 8
6
4
2
0
dT/d
t (°C
min
10 30 50 70 90 110 130 Temperature (°C)
Figure 10 Self-heat rate against temperature from closed test in 10 litre vessel
Water and acetic anhydride (mole ratio 1.5), start temperature 25°C, phi factor = 2.45
21

220 11
electrical heating turned off
add water
heat to 50°C
Reactor temperatureReactor Pressure
180 9
140 7
100 5
Tem
pera
ture
(°C
)
Pres
sure
(bar
a)
60 3
20 1 0 5 10 15 20
Time (minutes)
Figure 11 Temperature and pressure profiles from closed test in 10 litre vessel
Water and acetic anhydride (mole ratio 1.5) addition of water at 50°C and electric heating to 80°C, phi factor = 2.45
600
maximum dT/dt = 524°C/min 500
400
300
200
100
0
dT/d
t (°C
/min
)
0 50 100 150 200 250 Temperature (°C)
Figure 12 Self heat rate against temperature from closed test in 10 litre vessel
Water and acetic anhydride (mole ratio 1.5) addition of water at 50°C and electric heating to 80°C, phi factor = 2.45
22

6 RESULTS
6.1 INITIAL TESTS
In early tests, on the 1 litre scale, there were some unexplained differences in the measured carryover from the reactor during pressure relief. Figure 13 shows a histogram of the mass remaining in the reactor for 35 repeat tests under identical conditions. These involved a 700 g water charge, a 5 mm nozzle and stirring at 200 rpm. The test procedure was to first boil the water before charging to the vessel. The water was then re-heated to boiling point while the vessel was open to atmosphere (to displace air in the vessel headspace) before sealing the reactor and heating to the venting temperature and pressure.
150
200
250
300
350
400
450
1 2 3 4 5 6 7 8 9 10 11 12 13 14 15 16 17 18 19 20 21 22 23 24 25 26 27 28 29 30 31 32 33 34 35
Run number and order of experiments
Figure 13 Mass remaining in reactor following venting for 35 replicate tests
1 litre scale, 700 ml charge, 5 mm nozzle, 200 rpm stirring
One possible suggestion for the differences was the efficiency of the degassing process and differences in the amount of dissolved gas that would be liberated during heating. In order to investigate the effects of degassing, two replicate tests were performed using water that had not been degassed at all, i.e. was charged cold into the reactor, which was sealed immediately and heated to the relief temperature. Additionally, a further test was performed where carbon dioxide was dissolved in the water to represent an extreme case. The water was charged and the reactor pressurised to ~10 bara with carbon dioxide. After a period of stirring, and once the pressure had stabilised, the gas pressure was released and the reactor immediately sealed and heated to the relief temperature and pressure (152°C or ~5.06 bara).
Figures 14 and 15 show the respective pressure and temperature profiles for this series of tests performed consecutively, and table 5 gives the data obtained from each test. It can be seen that there was virtually no difference in the results between the degassed and non-degassed water. There was a shorter blowdown period in the case of the gassed water, but this was only
23

slight. Where there was a difference was in the measured temperature of the vapour phase, just below the reactor top plate. Figure 16 shows the temperature profiles measured in the vapour space, near the top plate, during venting. The two tests involving degassed water gave almost identical profiles in the early stages. The non-degassed water resulted in a slightly lower vapour phase temperature, and the water gassed with CO2 gave a much lower temperature, which increased as the two-phase mixture swelled in level. The explanation here is that the partial pressure of the CO2 (and to a much lesser extent the air pad pressure) suppresses water vaporisation and as a result there is less vapour to heat the reactor top plate. When venting occurs, the CO2 phase is displaced and the thermocouple comes in contact with the two-phase mixture. Once this happens, the temperature profile follows those of the other experiments.
Note that venting in all 5 experiments was initiated when the liquid temperature reached 152°C. For pure water this corresponds to a relief set pressure of 5.06 bara. The small variation in initial pressure (seen in figure 14) is a consequence of the partial pressure of air, or carbon dioxide, at the start of venting.
1
2
3
4
5
6 Degassed water (BSW067)Non-degassed water (BSW068)Non-degassed water (BSW069)CO2 gassed water (BSW070)Degassed water (BSW071)
Pres
sure
(bar
a)
0 10 20 30 Time (s)
Figure 14 Pressure profiles for degassed, non- degassed and CO2 gassed water systems
1 litre reactor, 700 ml charge, 5 mm nozzle, 200 rpm stirring
24

Tem
pera
ture
(°C
)
160
150
140
130
120
110
100
Degassed water (BSW067)Non-degassed water (BSW068)Non-degassed water (BSW069)CO2 gassed water (BSW070)Degassed water (BSW071)
0 10 20 30 Time (s)
Figure 15 Liquid temperature profiles for degassed, non- degassed and CO2 gassed water
systems 1 litre reactor, 700 ml charge, 5 mm nozzle, 200 rpm stirring
100
110
120
130
140
150
160
)
Degassed water (BSW067)Non-degassed water (BSW068)Non-degassed water (BSW069)CO2 gassed water (BSW070)Degassed water (BSW071)
Tem
pera
ture
(°C
0 10 20 30 Time (s)
Figure 16 Initial gas-phase temperature profiles for degassed, non- degassed and CO2 gassed
water systems 1 litre reactor, 700 ml charge, 5 mm nozzle, 200 rpm stirring
It was concluded from this that it is very unlikely that the levels of dissolved gas likely to be present in the water would significantly affect the blowdown profiles or the carryover.
25

Table 5. Data showing the effect of degassing the water
Mass Blowdown Test Ref. Date remaining in time to 101°C Notes
reactor (g) (sec) BSW067 15-Oct-01 349.5 24.6 Degassed BSW068 15-Oct-01 353.0 24.6 Not degassed BSW069 15-Oct-01 363.9 24.7 Not degassed
BSW070 16-Oct-01 346.6 23.1 Gassed with CO2
BSW071 16-Oct-01 354.9 25.3 Not degassed
6.2 INITIAL GLASS/WATER TESTS
Several tests were performed to compare the venting profiles of pure water and water plus glass systems. A nozzle diameter of 5 mm, and a fill level of 700 ml of water (plus a volume of glass) were used. Tests using a similar volume of water to that of the water/glass mixture were also performed.
6.2.1 Tests using 70-110 µm glass particles
Tests using progressively larger volume fractions of glass were performed with glass particles in the diameter range 70-110 µm and a 200 rpm stirring rate. The data obtained are given in table 6 and figures 17 and 18 give the pressure and temperature profiles during venting respectively. The test using 784 ml of water had the same volume as 700 ml water plus 12% v/v glass.
Table 6 shows that in terms of blowdown time and two-phase volume remaining in the reactor, all the tests gave similar results. The test run using 784 ml of water did take slightly longer to reach the terminating condition of 101°C, but figure 17 shows that the main difference was at very low pressure, where single phase vapour flow would have been occurring. It can be seen that there was little glass carryover in the tests, but the volume remaining in the reactor following venting was similar in each case. This indicates that liquid was vented preferentially to solid and that the composition of the two-phase mixture being vented contained a smaller volume percentage of solids than that in the reactor.
Figures 17 and 18 show that the tests all followed very similar depressurisation profiles. The profiles for all the tests using solids fall between those for the pure water tests. The 784 ml pure water test had the same overall volume as that with 12% v/v solids. It could be expected that the addition of glass to a fixed volume of water would cause a slowdown in depressurisation due to the fact that there is a larger volume to be vented. The results here indicate that this is the case, but that the effect of adding the glass is essentially identical to that of adding a similar volume of liquid.
26

Table 6. Data obtained using 70-110 micron diameter glass beads
Mass of Volume in Water Glass % glass Volume glass in reactor Blowdown
Test Ref Charge Charge by Charge reactor following time to (g) (g) volume (ml) following venting 101°C (s)
venting (g) (ml) GSW013 700 35 2 714 31 389.3 28.4 GSW014 700 70 4 728 66 403.0 29.3 GSW015 700 105 6 742 101 403.0 28.5 GSW016 700 140 8 756 134 410.8 28.6 GSW017 700 210 12 784 195 400.3 29.2 BSW084 700 - - 700 - 387.8 27.4 BSW088 784 - - 784 - 399.4 33.0
Pres
sure
(bar
a)
6
5
4
3
2
1 0 5 10 15 20 25 30 35
Time (s)
Solid percentages are volume based
700g + 2% - GSW013 700g + 4% - GSW014700g + 6% - GSW015700g + 8% - GSW016700g + 12% - GSW017700g Pure water - BSW084784g Pure water - BSW088
Figure 17 Pressure profiles for depressurisation of water containing 70-110 µm diameter solids
1 litre scale, 5 mm nozzle, 200 rpm stirring
27

160
Tem
pera
ture
(°C
) 150
140
130
120
110
100 0 5 10 15 20 25 30 35
Time (s)
Solid percentages are volume based
700g + 2% - GSW013 700g + 4% - GSW014700g + 6% - GSW015700g + 8% - GSW016700g + 12% - GSW017700g Pure water - BSW084784g Pure water - BSW088
Figure 18 Temperature profiles for depressurisation of water containing 70-110 µm diameter
solids 1 litre scale, 5 mm nozzle, 200 rpm stirring
6.2.2 Tests using 4-45 µm glass particles
A similar series of tests was performed using the finer 4-45 µm glass beads. The data for these experiments are given in table 7 and figures 19 and 20.
Table 7 again shows that there was little difference in the blowdown times between tests. A couple of tests gave slightly longer times, but figures 19 and 20 show that the difference was at the end of the venting period, where single phase flow would be occurring.
Significantly more glass was carried over in these tests, although the fraction of glass remaining in the reactor at the end of the depressurisation was greater than that initially charged. This again suggests that the water was vented preferentially over the solid. The figures for the volume remaining in the reactor show that an increasing glass concentration reduced the volume, i.e. increased the volume carried over. The difference however, was small, and within the scope of error.
Figures 19 and 20 show the respective pressure and temperature profiles during depressurisation. The profiles are all very similar, with the higher fill levels depressurising slightly more slowly. It is interesting to note that the tests with identical fill levels of water and glass/water give very similar profiles, and that the individual lines virtually overlay each other. It is therefore clear that under these conditions the water/glass mixture depressurises at the same rate as the same volume of pure water.
28

Table 7 Data obtained using 4-45 micron diameter glass beads
Mass of Volume in Water Glass % glass Volume glass in reactor Blowdown
Test Ref Charge Charge by Charge reactor following time to (g) (g) volume (ml) following venting 101°C (s)
venting (g) (ml) GSW018 700 70 4 728 49.5 399.8 33.2 GSW019 700 140 8 756 94 387.4 28.2 GSW020 700 210 12 784 144 385.1 29.7 GSW021 700 280 16 812 184.8 369.5 29.7 BSW089 700 - - 700 - 402.2 29.8 BSW093 756 - - 756 - 414.2 29.0 BSW088 784 - - 784 - 399.4 33.0 BSW090 812 - - 812 - 418.2 29.7
1
2
3
4
5
6
Solid percentages are volume based
700g + 4% - GSW018700g + 8% - GSW019700g + 12% - GSW019700g + 16% - GSW019784 g Pure water - BSW088700 g Pure water - BSW089812 g Pure water - BSW090756 g Pure water - BSW093
Pres
sure
(bar
a)
0 5 10 15 20 25 30 35 Time (s)
Figure 19 Pressure profiles for depressurisation of water containing glass solids of diameter
4-45 µm 1 litre scale, 5 mm nozzle, 200 rpm stirring
29

100
110
120
130
140
150
160
)
Solid percentages are volume based
700g + 4% - GSW018700g + 8% - GSW019700g + 12% - GSW019700g + 16% - GSW019784 g Pure water - BSW088700 g Pure water - BSW089812 g Pure water - BSW090756 g Pure water - BSW093
Tem
pera
ture
(°C
0 5 10 15 20 25 30 35 Time (s)
Figure 20 Temperature profiles for depressurisation of water containing glass solids of diameter
4-45 µm 1 litre scale, 5 mm nozzle, 200 rpm stirring
6.2.3 Tests using 250-425 µm glass particles
Table 8 and figures 21 and 22 show data from tests using the much coarser 250-425 µm diameter glass particles. These tests were run with a higher stir speed, 1200 rpm, to improve agitation and homogeneity within the reactor.
Table 8 again shows that the blowdown times were similar for each test. The volume remaining in the reactor following the blowdown for the water + 16% v/v glass was higher in this instance. This is probably due to the lower glass carryover in this test compared to the test with lower initial concentrations. Otherwise, the volume figures are similar for the water and the water plus glass tests.
Figures 21 and 22 again show that the depressurisation profiles of the tests at fixed fill levels are very similar. If anything, the addition of solids may actually enhance the venting rate and lead to slightly faster reductions in temperature and pressure.
30

Table 8 Data obtained using 250-425 micron diameter glass beads
Test Ref Water Charge
(g)
Glass Charge
(g)
% glass by
volume
Volume Charge
(ml)
Mass of glass in reactor
following venting
(g)
Volume in reactor following venting
(ml)
Blowdown time to
101°C (s)
GSW023 700 70 4 728 40.7 396.5 26.9 GSW024 700 140 8 756 75.5 399.7 27.5 GSW025 700 210 12 784 130.2 407.2 27.7 GSW026 700 280 16 812 244 417.2 27.8 BSW095 700 - - 700 - 391.7 28.3 BSW097 728 - - 728 - 394.1 30.0 BSW096 756 - - 756 - 394.9 29.9 BSW098 784 - - 784 - 393.4 30.1 BSW099 812 - - 812 - 381.1 29.6
1
2
3
4
5
6
Solid percentages are volume based
700g + 4% - GSW023700g + 8% - GSW024700g + 12% - GSW025700g + 16% - GSW026700g Pure water - BSW095756g Pure water - BSW096728g Pure water - BSW097784g Pure water - BSW098812g Pure water - BSW099
Pres
sure
(bar
a)
0 5 10 15 20 25 30 35 Time (s)
Figure 21 Pressure profiles for depressurisation of water containing glass solids of diameter 250
425 µm 1 litre scale, 5 mm nozzle, 1200 rpm stirring
31

32
0 5 10 15 20 25 30 35100
110
120
130
140
150
160
Tem
pera
ture
(°C
)
Time (s)
Solid percentages are volume based
700g + 4% - GSW023700g + 8% - GSW024700g + 12% - GSW025700g + 16% - GSW026700g Pure water - BSW095756g Pure water - BSW096728g Pure water - BSW097784g Pure water - BSW098812g Pure water - BSW099
Figure 22 Temperature profiles for depressurisation of water containing glass solids of diameter
250-425 µm 1 litre scale, 5 mm nozzle, 1200 rpm stirring
6.2.4 Tests using 0-65 µm low density hollow glass particles Table 9 and figures 23 and 24 show data from tests performed using the low density hollow glass spheres. These have a density of 600 kg m-3 and a size range of 0-65 µm. This is not too dissimilar to the 4-45 µm range of the solid particles, and so some comparisons with the results for this size range can be made. Table 9 shows that the blowdown times were generally very consistent, but there were two tests that gave slightly different times (the 4% v/v solids test and the 784 ml pure water test). The data for the volume remaining in the reactor indicate that that the presence of the glass may have increased the carry over during blowdown. The differences were, however, within the experimental differences experienced over time for replicate tests using 700 ml of pure water (see figure 13). Figures 23 and 24 show the respective pressure and temperature profiles during depressurisation. Again the depressurisation followed very similar profiles in each test. The tests run with the solids present essentially followed identical profiles for depressurisation of the same volume of water. The pure water tests perhaps showed slightly slower depressurisation in the early stages, but the spread is no greater than that expected from the earlier repeatability tests.

Table 9 Data obtained using 0-45 micron diameter hollow glass beads
Mass of Volume in Water Glass % glass Volume glass in reactor Blowdown
Test Ref Charge Charge by Charge reactor following time to (g) (g) volume (ml) following venting 101°C (s)
venting (g) (ml) GSW029 700 16.8 4 728 10.1 401.9 26.8 GSW027 700 33.6 8 756 19.1 393.4 29.7 GSW030 700 50.4 12 784 27.5 395.2 29.6 GSW028 700 67.2 16 812 40.6 383.4 29.4 BSW100 700 - - 700 - 408.5 29.6 BSW093 756 - - 756 - 414.2 29.0 BSW088 784 - - 784 - 399.4 33.0 BSW090 812 - - 812 - 418.2 29.7 BSW091 700 - - 700 - 406.1 28.1
1
2
3
4
5
6
Solid percentages are volume based
700 g + 8% glass - GSW027700 g + 16% glass - GSW027700 g + 4% glass - GSW029700 g + 12% glass - GSW030784g Pure water - BSW088812 g Pure water - BSW090700 g Pure water - BSW091756 g Pure water - BSW093
Pres
sure
(bar
a)
0 5 10 15 20 25 30 35 Time (s)
Figure 23 Pressure profiles for depressurisation of water containing glass solids of diameter
0-65 µm of low density hollow glass 1 litre scale, 5 mm nozzle, 200 rpm stirring
33

100
110
120
130
140
150
160
)
Solid percentages are volume based
700 g + 8% glass - GSW027700 g + 16% glass - GSW027700 g + 4% glass - GSW029700 g + 12% glass - GSW030784g Pure water - BSW088812 g Pure water - BSW090700 g Pure water - BSW091756 g Pure water - BSW093
Tem
pera
ture
(°C
0 5 10 15 20 25 30 35 Time (s)
Figure 24Temperature profiles for depressurisation of water containing glass solids of diameter
0-65 µm of low density hollow glass 1 litre scale, 5 mm nozzle, 200 rpm stirring
6.2.5 Comparison in terms of solid density
Table 10 gives data comparing similar tests using the two different density solids and pure water, for an 812 ml fill level. The other fill levels showed similar results.
Table 10 shows that the tests had essentially the same blowdown time. The test using the solid glass (4-45 µm diameter) resulted in a smaller volume remaining in the reactor after venting than for the test with the hollow solids: the test with pure water had the largest retained volume in the reactor after venting. This may indicate that the addition of the solids aids carryover. However, the differences are within the spread of data that was obtained from replicate tests using pure water (see figure 13)
Figures 25 and 26 show the pressure and temperature profiles during depressurisation for the three tests. It can be seen that the pure water and the solid glass curves almost overlay each other in each of these figures. The test with the hollow glass gave a slightly faster depressurisation rate. Similar observations were made with the other fill levels, although the 812 ml fill level shows the greatest difference.
Table 10 Data comparing effects due to glass density
Glass Water Glass Test ref Date beads Charge Charge
Mass of Volume in glass in reactor Blowdown reactor following time to
(g) (g) following venting 101°C (s) venting (g) (ml)
BSW090 06-Nov None 812 - - 418 29.7 GSW021 05-Nov Solid 700 280 191 363 29.7 GSW028 15-Nov Hollow 700 67.2 43 381 29.4
34

1
2
3
4
5
6 812 ml pure water812 ml solid glass + water812 ml hollow glass + water
Pres
sure
(bar
a)
0 5 10 15 20 25 30 35 Time (sec)
Figure 25 Pressure profiles showing effects of glass density and pure water
1 litre scale, 16% by volume of glass (4-45 µm solid glass and 0-65 µm hollow glass) 5 mm nozzle, 200 rpm stirring
160
Tem
pera
ture
(°C
)
150
140
130
120
110
100
812 ml pure water812 ml solid glass + water812 ml hollow glass + water
0 5 10 15 20 25 30 35 Time (sec)
Figure 26 Temperature profiles showing effects of glass density and pure water
1 litre scale, 16% by volume of glass (4-45 µm solid glass and 0-65 µm hollow glass) 5 mm nozzle, 200 rpm stirring
35

6.2.6 Note on vapour generation/solid carry over
Comparison of the tests using solid and hollow glass showed that the use of hollow glass resulted in a slightly quicker depressurisation. The differences in the depressurisation profiles are small and within the magnitude of differences found on repeat cases with pure water (see Appendix B). One factor that may affect the results is the heat capacity of the glass particles: the lower mass per unit volume of the hollow glass would give out less thermal energy in cooling between fixed temperatures and therefore generate a smaller amount of vapour. Table 11 gives the estimated mass of vapour generated for the three 812 ml fill level scenarios. This is the highest glass fraction used, and therefore gives the largest difference between the tests. It can be seen that there is a difference in estimated vapour generation between the two glass densities, with the more dense particles producing more vapour as they cool. However, there is a greater difference if the 112 ml is pure water. As the pure water and solid particles gave very similar traces, it is unlikely that the faster depressurisation with the hollow particles can be attributed entirely to the smaller amount of vapour generated in the test. Note that 700 g of water alone is estimated to give 72.8 g of vapour generation when cooling to 100°C from the relief set conditions.
Table 11 Estimated vapour generation due to heat in the solids
Test ref Glass beads
Water Charge
(g)
Glass Charge
(g)
Estimated vapour generation (g)
BSW090 None 812 - 84.5 GSW021 Solid 700 280 78.4 GSW028 Hollow 700 67.2 74.1
It is interesting to note the concentration of the solids in the reactor following venting. Table 12 shows the data, together with the concentration that would be expected with the estimated vapour generation removed. I.e. the solids will become more concentrated due to the removal of liquid due to vaporisation.
If the mixture is genuinely well mixed and there is no slip between the solids and liquid, the final concentration should be the same as the figure following vaporisation. Table 12 shows that in every case, the final concentration of solids is greater than would be expected. With the heavier solids this could possibly be explained by imperfect mixing and a solids concentration gradient through the height of the vessel, as the solids may settle out. With the hollow solids, the particles float if inadequately mixed, and the most concentrated mixture would be vented first.
There are two possible explanations for the concentration of the solids within the reactor, either the liquid is vented preferentially over the solids during venting (i.e. the liquid “overtakes” the solids), or the concentration of the solids is due to the evaporation and single vapour phase venting following cessation of two-phase flow. The latter will occur in all cases, but the magnitude of the vaporisation would be expected to be similar in each case. This is clearly not the case here.
36
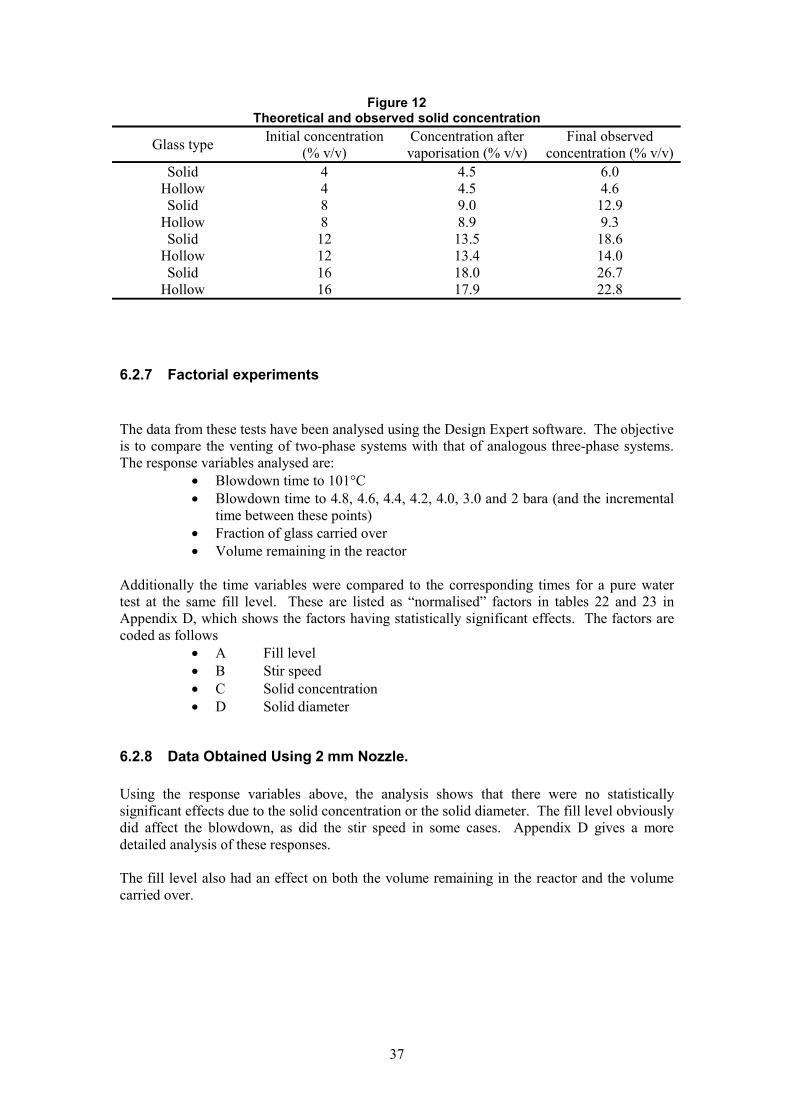
Figure 12 Theoretical and observed solid concentration
Glass type Initial concentration (% v/v)
Concentration after vaporisation (% v/v)
Final observed concentration (% v/v)
Solid 4 4.5 6.0 Hollow 4 4.5 4.6 Solid 8 9.0 12.9
Hollow 8 8.9 9.3 Solid 12 13.5 18.6
Hollow 12 13.4 14.0 Solid 16 18.0 26.7
Hollow 16 17.9 22.8
6.2.7 Factorial experiments
The data from these tests have been analysed using the Design Expert software. The objective is to compare the venting of two-phase systems with that of analogous three-phase systems. The response variables analysed are:
· Blowdown time to 101°C · Blowdown time to 4.8, 4.6, 4.4, 4.2, 4.0, 3.0 and 2 bara (and the incremental
time between these points)· Fraction of glass carried over · Volume remaining in the reactor
Additionally the time variables were compared to the corresponding times for a pure water test at the same fill level. These are listed as “normalised” factors in tables 22 and 23 in Appendix D, which shows the factors having statistically significant effects. The factors are coded as follows
· A Fill level· B Stir speed · C Solid concentration · D Solid diameter
6.2.8 Data Obtained Using 2 mm Nozzle.
Using the response variables above, the analysis shows that there were no statistically significant effects due to the solid concentration or the solid diameter. The fill level obviously did affect the blowdown, as did the stir speed in some cases. Appendix D gives a more detailed analysis of these responses.
The fill level also had an effect on both the volume remaining in the reactor and the volume carried over.
37

6.2.9 Data Obtained Using 5 mm Nozzle
The tests with the 5 mm nozzle used two impellers to give better stirring, and as a result the factorial stir rate values were reduced (see section 5.4.1). Additionally, the data was “normalised” with respect to tests run at the same fill level and stir speed, but using pure water.
For experiments with the 5 mm nozzle, the fill level was essentially the only factor that had a statistically significant effect on the absolute and incremental blowdown times. The solid concentration did have an effect on the depressurisation between 3 and 2 bara, where the incremental time was reduced by an increased solids concentration. It is suspected that a larger mass of solids remained in the reactor and therefore there would be less liquid to vent at this stage of the blowdown.
With the “normalised” data there were no factors having statistically significant effects on the incremental depressurisation times.
The fill level had an effect on the volume carried over, with the higher fill levels resulting in greater carryover. This result is as expected. The solid concentration had an effect on the volume remaining in the reactor following venting, and a larger concentration resulted in a smaller volume.
6.2.10 Factorial Experiments On The Large 10 Litre Scale
On the large scale, a slightly different approach was taken. Nozzle diameter and glycerol concentration were included in the experimental design and the low solid concentration was taken as no solids (i.e pure liquid). The purpose of the glycerol addition was to change the viscosity and density of the liquid phase. The pure water and solid/water tests are therefore directly compared and there is no need for comparison of “normalised” data. Some of the factors, e.g. fill level and nozzle diameter, will of course affect the depressurisation, however, the interest of this project is in the addition of solids. Therefore the prime interest was to identify those experiments in which solid diameter, or solid concentration, combined with the other factors so as to affect the response variable of the depressurisation.
Appendix D gives a detailed analysis of the response variables. The response variables chosen for the analysis of this data are the times taken for incremental depressurisation, in steps of 0.1 bar down to a pressure of 4 bara, then in 0.2 bar steps to 3 bar, and thereafter in 0.5 bar steps. The data shows that the nozzle diameter has an effect on the times throughout the depressurisation, and the fill level has an effect down to 2.5 bara. This would be expected. Additionally, almost throughout there was the effect of an interaction between the fill level and the nozzle diameter. The stirrer speed was identified as having an effect in the early stages, down to 4.7 bara.
The solid concentration had an effect on the incremental depressurisation times between 4.5 bara and 3.0 bara. This time reduced with increasing solids concentration. This may be simply because at a fixed reactor fill level the amount of vapour produced as the reactor contents cool to atmospheric conditions becomes smaller at high solids concentration, see section 6.2.6.
It is interesting to note that there was no effect on any of the response variables due to the solid diameter or the glycerol fraction. This suggests that the viscosity and density difference between the water and water/glycerol mixtures had no effect on depressurisation for the range of variables studied.
38
6.3 FURTHER TESTS ON LARGE 10 LITRE SCALE
6.3.1 Effects Of Particle Density
In order to examine the effects of the particle density, a series of tests were planned to complement those already performed. The low density glass has a similar diameter range to the 4-45 µm solid glass. In order to examine any effect of solid density, many of the tests already run in previous series could be incorporated into a new experimental design, so that only 4 new tests had to be performed, all of these were with the low density glass particles. A five factor, half factorial design was analysed, with the factors being:
· Solid concentration · Solid density · Fill level · Stir speed · Nozzle diameter.
The analysis shows similar findings to the previous factorial design (see section 6.2.10). Neither the solid concentration or density had a statistically significant effect on the response variables. Fill level and nozzle diameter had the main effect on the response factors studied. At pressures down to 4.5 bara, the fill level had the main effect on the time taken for the incremental pressure drop, and nozzle diameter also had an effect. Between 4.4 and 3.2 bara, the situation was reversed and nozzle diameter had the dominant effect, with fill level also having an influence. At lower pressures, only the nozzle diameter had an effect. This is similar to the previous findings, although the stir speed was not identified as a factor having an effect here.
6.3.2 Effects of surfactant
Surfactant is difficult to remove completely from a system even with thorough cleaning. For this reason the experiments using surfactant were the last experiments to be made. This procedure ensured that there could be no possibility of surfactant contamination in any other experiment. The presence of surfactant may be expected to promote essentially homogeneous flow.
In order to evaluate the effects of solids in foaming systems, selected tests were run with the addition of a detergent. A 10.5 mm nozzle and a stir speed of 200 rpm were used for the testing. For comparison, tests were run using 7000 ml of pure water and 7000 ml of a mixture of water with 16% v/v of glass. Hollow glass and two size ranges of solid glass particles were used, as indicated in the keys to figures 27 and 28. A volume of 7 ml (1000 ppm by volume) of detergent was added to each test. Note that this means that the surfactant concentration will be slightly lower in the pure water tests (numbers 67 and 72) than for the tests involving water/glass mixtures. Figures 27 and 28 give the pressure and temperature profiles during venting for the water and water/glass studies. Table 13 gives the mass balance data for the tests.
Two entries in table 13 (test numbers 67 and 72) show data from repeat tests without solids. Figures 27 and 28 show that the profiles for these tests are slightly different. There is no immediately obvious reason for this and it may be due to the random nature of the venting/bubble formation process. There was also a large difference in the carry over between these two experiments as shown in table 13. The mass remaining in the reactor varied
39
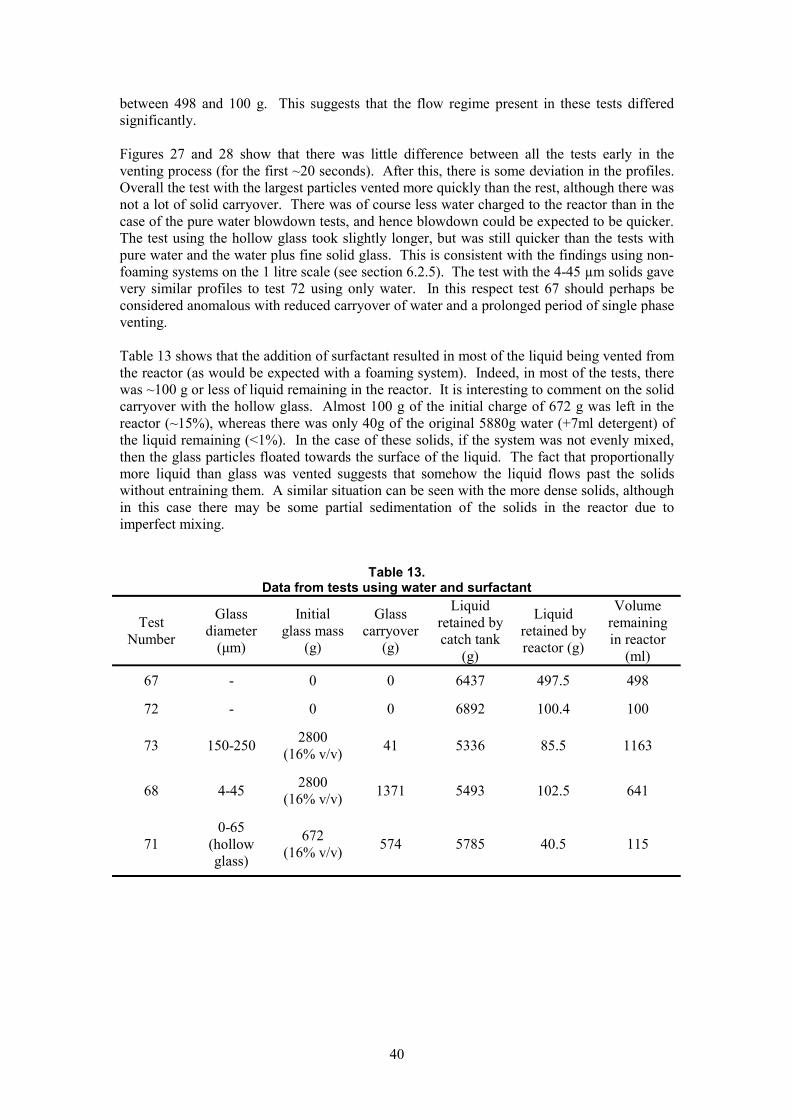
between 498 and 100 g. This suggests that the flow regime present in these tests differed significantly.
Figures 27 and 28 show that there was little difference between all the tests early in the venting process (for the first ~20 seconds). After this, there is some deviation in the profiles. Overall the test with the largest particles vented more quickly than the rest, although there was not a lot of solid carryover. There was of course less water charged to the reactor than in the case of the pure water blowdown tests, and hence blowdown could be expected to be quicker. The test using the hollow glass took slightly longer, but was still quicker than the tests with pure water and the water plus fine solid glass. This is consistent with the findings using nonfoaming systems on the 1 litre scale (see section 6.2.5). The test with the 4-45 µm solids gave very similar profiles to test 72 using only water. In this respect test 67 should perhaps be considered anomalous with reduced carryover of water and a prolonged period of single phase venting.
Table 13 shows that the addition of surfactant resulted in most of the liquid being vented from the reactor (as would be expected with a foaming system). Indeed, in most of the tests, there was ~100 g or less of liquid remaining in the reactor. It is interesting to comment on the solid carryover with the hollow glass. Almost 100 g of the initial charge of 672 g was left in the reactor (~15%), whereas there was only 40g of the original 5880g water (+7ml detergent) of the liquid remaining (<1%). In the case of these solids, if the system was not evenly mixed, then the glass particles floated towards the surface of the liquid. The fact that proportionally more liquid than glass was vented suggests that somehow the liquid flows past the solids without entraining them. A similar situation can be seen with the more dense solids, although in this case there may be some partial sedimentation of the solids in the reactor due to imperfect mixing.
Table 13. Data from tests using water and surfactant
Volume Glass Initial Glass Liquid Liquid remaining Test diameter glass mass carryover retained by retained by Number in reactor (µm) (g) (g) catch tank reactor (g) (ml) (g)
67 - 0 0 6437 497.5 498
72 - 0 0 6892 100.4 100
280073 150-250 5336 85.5 1163(16% v/v) 41
280068 4-45 5493 102.5 641(16% v/v) 1371
0-65 67271 574 5785 40.5 115(hollow (16% v/v)glass)
40

41
0 30 60 901
2
3
4
5
6
Pres
sure
(bar
a)
Time (s)
Water - no solidsWater + 4-45µm glassWater + hollow glassWater - no solidsWater + 150-250 µm glass
0 30 60 90100
110
120
130
140
150
160
Tem
pera
ture
(°C
)
Time (s)
Water - no solidsWater + 4-45µm glassWater + hollow glassWater - no solidsWater + 150-250 µm glass
Figure 27 Pressure profiles for depressurisation of 7000 ml water or water+16% v/v glass
containing 7 ml detergent. 10 litre scale, 10.5 mm nozzle, 200 rpm stirring
Figure 28 Temperature profiles for depressurisation of 7000 ml water or water+16% v/v glass
containing 7 ml detergent. 10 litre scale, 10.5 mm nozzle, 200 rpm stirring
6.3.3 Effects of surfactant on Glycerol/Water mixture The effect of detergent on the glycerol water solution was also investigated. Tests were run using a 7000 ml fill level (plus 7 ml detergent) of a 25 % w/w glycerol solution in water. One
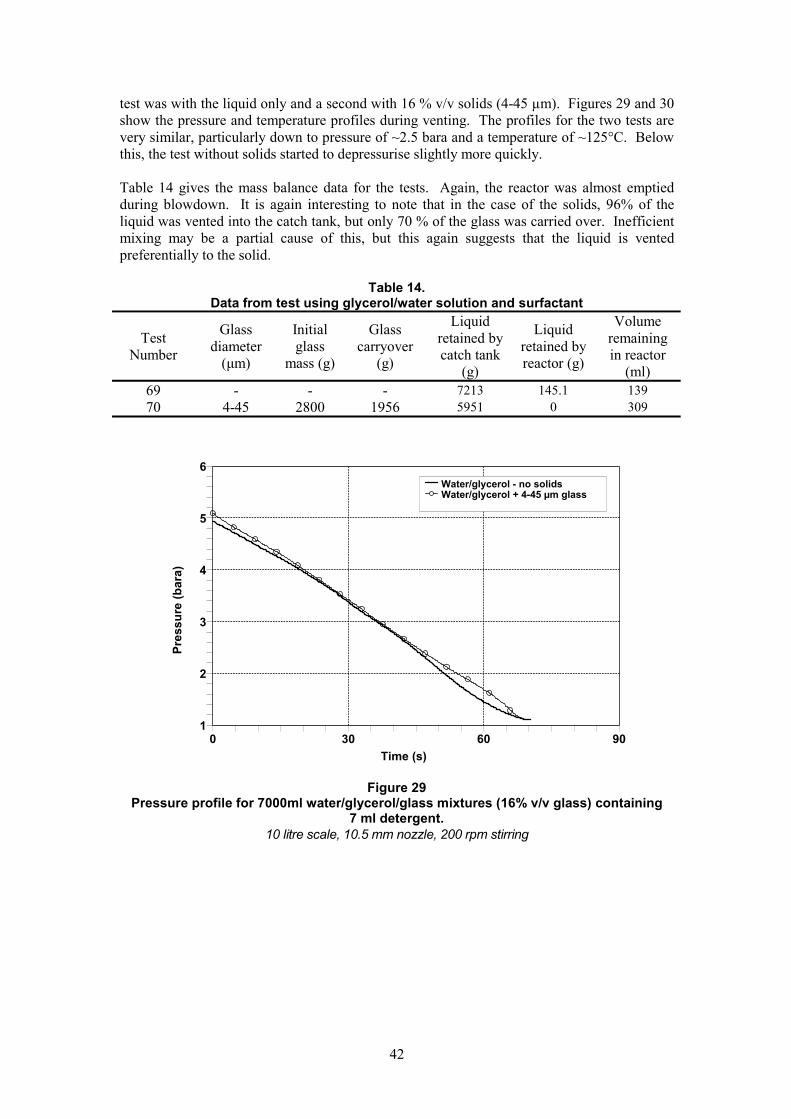
test was with the liquid only and a second with 16 % v/v solids (4-45 µm). Figures 29 and 30 show the pressure and temperature profiles during venting. The profiles for the two tests are very similar, particularly down to pressure of ~2.5 bara and a temperature of ~125°C. Below this, the test without solids started to depressurise slightly more quickly.
Table 14 gives the mass balance data for the tests. Again, the reactor was almost emptied during blowdown. It is again interesting to note that in the case of the solids, 96% of the liquid was vented into the catch tank, but only 70 % of the glass was carried over. Inefficient mixing may be a partial cause of this, but this again suggests that the liquid is vented preferentially to the solid.
Table 14. Data from test using glycerol/water solution and surfactant
Volume Glass Initial Glass Test Liquid Liquid remaining diameter glass carryover retained by retained by Number in reactor (µm) mass (g) (g) catch tank reactor (g) (ml)
69 - - -70 4-45 2800 1956
(g) 7213 145.1 139 5951 0 309
1
2
3
4
5
6 Water/glycerol - no solidsWater/glycerol + 4-45 µm glass
Pres
sure
(bar
a)
0 30 60 90 Time (s)
Figure 29 Pressure profile for 7000ml water/glycerol/glass mixtures (16% v/v glass) containing
7 ml detergent. 10 litre scale, 10.5 mm nozzle, 200 rpm stirring
42

Tem
pera
ture
(°C
)
160
150
140
130
120
110
100
Water/glycerol - no solidsWater/glycerol + 4-45 µm glass
0 30 60 90 Time (s)
Figure 30Temperature profile for 7000ml water/glycerol/glass mixtures (16% v/v glass)
containing 7 ml detergent.10 litre scale, 10.5 mm nozzle, 200 rpm stirring
6.4 REACTING STUDIES ON THE 10 LITRE SCALE
6.4.1 Relief line sizing calculations
Small scale, low phi factor, tests in PHI-TEC had previously been run using a similar procedure to that to be adopted on the large scale. These showed that the maximum pressure that could be attained (18.8 bara) was within the rating of the 10 litre vessel (20 bar) and therefore it was deemed acceptable to run the reaction on the larger scale, where there would undoubtedly be a higher thermal inertia or phi factor. The data from a large scale unvented test, run at a similar phi factor to that expected when the glass beads would be present, was used to calculate the minimum vent area. For vent size purposes, the following were assumed: Relief set pressure 3 bara
Maximum allowable pressure* 5 bara Reactor volume 0.01 m3
Initial void fraction 0.35 Heat capacity of mixture 2600 J kg-1 K-1
* Relief set pressure plus overpressure
The following data were obtained from the large scale unvented test Temperature at 3 bara 136.8°C Rate of temperature rise at 3 bara 229°C min-1
Rate of temperature rise at 5 bara 454°C min-1
dP/dT 0.07 bar K-1
Using the DIERS methodology, this gave a mass flux of 2505 kg m2 s-1 and an ideal vent area 2of 3.341´10-4 m . This corresponded to an ideal vent diameter of 20.6 mm, which was
approximately double the 10.5 mm available. Significant overpressure above 5 bara would
43

therefore be expected. This was in fact desirable for comparison of the flows between twophase and three-phase systems. The magnitude of the overpressure could be used as a response variable and compared in each case.
6.4.2 Experimental Design
This series of tests was initially planned as a factorial design, with factors of fill level, glass diameter and glass concentration. The high, low and centrepoint values are given in table 15.
Table 15 Variables and values used in factorial design for the reacting system Variable High Centrepoint Low
Reactant volume (ml) Solid concentration (% v/v)
Solid diameter (mm) *
6500 15
150-2501
5750 7.5
70-110
5000 0*
4-45 15% of 3 mm glass ballast was added in these cases
Note that reactant volume and solid concentration are independent factors. Combinations of these at high, centrepoint and low values will determine the actual reactor fill level.
The tests run at 0 % glass concentration were in fact run with 15 % v/v of 3 mm diameter glass beads present. A 10.5 mm diameter constriction was installed on the reactor. The diameter if these beads was so large as to ensure that they settled out in the bottom of the reactor and were not entrained in the vented flow. However, they would also have a thermal inertia similar to the 15% v/v of finer glass beads with the result that the reacting mixtures had a matched thermal inertia, and hence phi factor.
Additionally, two tests were run using the hollow glass beads (density 0.6 kg m-3) for comparison with the tests with the 4-45 mm particles.
6.4.3 Results
Table 16 gives the conditions for each test.
1 This value was chosen as the slightly larger particles (250-425 mm diameter) resulted in no solid carry over.
44

Table 16 Data from 10 litre blowdown tests with the reacting system.
Solid Designator Test number Reactant volume
(ml) concentration (% v/v)
Glass diameter (mm)
A 58 5000 16 3000 B 63 5000 16 3000 C 59 5000 16 4-45 D 60 5000 16 150-250 E 62 5750 8 70-110 F 64 5750 8 70-110 G 53 6500 16 3000 H 57 6500 16 4-45 I 61 6500 16 150-250 J 56 6500 16 250-4252
K 65 6500 16 0-65 (hollow glass)
L 66 5000 16 0-65 (hollow glass)
Note: the tests with 3000 mm glass should be treated as 0 % solids (i.e. 2-phase venting with no solid carryover)
The test numbers in table 16 have been sorted in terms of reactant volume and have been given a letter designator for clarity.
Figures 31 and 32 give the respective pressure and temperature profiles during venting for the comparative tests using 5000 ml of reactants (+15% v/v solids). It can be seen that the tests A and B, which had two-phase flow gave very much higher overpressures than the tests with three-phase flow: tests C and D resulted in virtually no overpressure. This was not expected, as previously the presence of solids had had very little effect on blowdown profiles for nonreacting systems. Figure 33 shows the self heat rate profiles for the tests starting from the temperature at which the electrical heating was turned off (80°C). It is clear that tests A and B (with 3 mm glass beads) reached much higher heat rates before venting commenced at 3 bara. As the test recipes are exactly the same, there must be an effect due to the diameter of the solids. It is likely that the large glass beads absorb less of the heat from the reaction, due to their smaller external surface area. This will become increasingly apparent at high runaway reaction rates. The fact that glass is a relatively poor conductor of heat will also have an effect, with the smaller glass particles heating up more quickly and more uniformly than the large particles. The latter will have large temperature gradients between their centres and surfaces. Conventional unsteady state heat transfer models, as given in Welty et al14 show that temperature lag between the liquid and the solid particles will be dependent on the diameter, the solid diffusivity and the heat rate. A similar effect is likely when f factors are considered: at very high self-heat rates the observed f factor may be much closer to unity than expected from simple calculation, simply due to the fact that the heat transfer to the reactor vessel itself cannot occur at a sufficiently high rate for the reactants and vessel to be at an essentially identical temperature at any time. This makes it very clear that, during fast thermal runaways, the phi factor may approach unity irrespective of the thermal mass of solids that may be present or of the reactor mass. In this case, large diameter inert solids accelerate the reaction very considerably compared with the same mass of smaller glass particles.
2 This test gave no solid carryover and is included for comparison only
45

1
2
3
4
5
6 Test A - 3 mm dia glassTest C - 4-45 µm glassTest D - 150-250 µm glassTest B - 3 mm dia glassTest L - hollow glass
Pres
sure
(bar
a)
0 30 60 90 Time (s)
Figure 31Pressure profile for venting of reacting system tests at low fill level
10 litre scale, 5750 ml charge (5000 ml reactants + 15% by volume glass), water and acetic anhydride (mole ratio 1.5) 9 mm nozzle, 200 rpm stirring.
Table 17 Data obtained from acetic anhydride/water tests with 5000 ml of reactants
Test Glass
diameter (µm)
Glass carryover to catch tank (g)
Glass carryover to catch
tank (ml)
Liquid retained in catch tank (g)
Liquid retained
in reactor
(g)
Maximum pressure (bara)
Maximum temperature
(°C)
A 3000 0 0 2425 2880 5.24 169
B 3000 0 0 2523 2045 5.07 168
C 4-45 44.69 17.9 1048 4050 3.05 145
D 150-250 20.36 8.1 2449 2736 3.08 145
0-65 L (hollow 69.78 116.3 1707 3508 3.09 144
glass)
46

100
110
120
130
140
150
160
170
)
Test A - 3 mm dia glassTest C - 4-45 µm glassTest D - 150-250 µm glassTest B - 3 mm dia glassTest L - hollow glass
Tem
pera
ture
(°C
0 30 60 90 Time (s)
Figure 32 Temperature profile for venting of reacting system tests at low fill level
10 litre scale, 5750 ml charge (5000 ml reactants + 15% by volume glass), water and acetic anhydride (mole ratio 1.5) 9 mm nozzle, 200 rpm stirring
300
250
200
150
100
50
0
Test B - 3 mm dia glassTest D - 150-250 µm glassTest C - 4-45 µm glassTest A - 3 mm dia glassTest L - hollow glass
dT/d
t (K
/min
)
80 100 120 140 160 180 Temperature (°C)
Figure 33 Heat-rate profiles of reacting system tests at low fill level
10 litre scale, 5750 ml charge (5000 ml reactants + 15% by volume glass), water and acetic anhydride (mole ratio 1.5) 9 mm nozzle, 200 rpm stirring
In light of the differences between the various tests, it is very difficult to compare the results and the effect of solids on the flow from the reactor.
Table 17 gives the mass balance information and maximum temperature and pressure data for the tests with 5000ml of liquid. Again the effects of the glass diameter can be seen. The
47

finest particles, which also result in the lowest heat rate due to reaction, result in a greater mass retained in the reactor. The lower heat rate and hence lower rate of vapour generation would give a lower superficial velocity and would be expected to result in less carryover.
Similar observations can be seen in figures 34 to 36 for the tests with the higher fill level. The data is also summarised in table 18. It is interesting to note from figures 32 and 35 that there is slight variation in the temperatures at the start of venting even though the pressure was identical each time. This could be attributable to experimental errors. However, the lower fill level does appear to result in slightly higher relief temperatures. One possible explanation is that the density of acetic anhydride and acetic acid mixture falls with increasing temperature and the compression of the head space gas may be a significant factor. At higher fill levels the compression effect would be greater and venting would occur slightly earlier in the runaway.
1
2
3
4
5
6 Test G - 3 mm dia glassTest J - 250-425 µm glassTest H - 4-45 µm glassTest I - 150-250 µm glassTest K - hollow glass
Pres
sure
(bar
a)
0 30 60 90 Time (s)
Figure 34 Pressure profile for venting of reacting system tests at high fill level
10 litre scale, 7475 ml charge (6500 ml reactants + 15% by volume glass), water and acetic anhydride (mole ratio 1.5) 9 mm nozzle, 200 rpm stirring.
48

100
110
120
130
140
150
160
170
)
Test G - 3 mm dia glassTest J - 250-425 µm glassTest H - 4-45 µm glassTest I - 150-250 µm glassTest K - hollow glass
Tem
pera
ture
(°C
0 30 60 90 Time (s)
Figure 35 Temperature profile for venting of reacting system tests at high fill level
10 litre scale, 7475 ml charge (6500 ml reactants + 15% by volume glass), water and acetic anhydride (mole ratio 1.5) 9 mm nozzle, 200 rpm stirring
Table 18. Data obtained from acetic anhydride/water tests with 6500 ml of reactants
Test Glass
diameter (µm)
Glass carryover to catch tank (g)
Glass carryover to catch
tank (ml)
Liquid retained in catch tank (g)
Liquid retained
in reactor
(g)
Maximum pressure (bara)
Maximum temperature
(°C)
G 3000 0 0 3479 2693 4.39 162
H 4-45 299.0 119.6 2989 3619 3.10 147
I 150-250 24.58 9.8 4190 2443 3.92 157
J 250-425 0 0 3471 2898 4.67 165
0-65 K (hollow 219.56 365.9 3811 3048 3.47 151
glass)
49

0
50
100
150
200
dT/d
t (K
/min
)
Test I - 150-250 µm glassTest H - 4-45 µm glassTest J - 250-425 µm glassTest G - 3 mm dia glassTest K - hollow glass
80 100 120 140 160 180 Temperature (°C)
Figure 36 Heat-rate profiles of reacting system tests at high fill level
10 litre scale, 7475 ml charge (6500 ml reactants + 15% by volume glass), water and acetic anhydride (mole ratio 1.5) 9 mm nozzle, 200 rpm stirring
6.4.4 Centrepoint Cases
The data for the repeat centrepoint tests are shown in figures 37 to 39 and in table 19. These tests show excellent repeatability in terms of blowdown profiles and self heat rates: the lines on the graphs virtually overlap each other. There is slight variation in the mass carryover from the reactor, see table 19.
Another measure of the repeatability can be seen from tests A and B, which were also identical tests. Figures 31 to 33 show that these tests also show very good repeatability.
Table 19. Data obtained from centrepoint cases.
Test Glass
diameter (µm)
Glass carryover to catch tank (g)
Glass carryover to catch
tank (ml)
Liquid retained in catch tank (g)
Liquid retained
in reactor
(g)
Maximum pressure (bara)
Maximum temperature
(°C)
E 70-110 19.92 8.0 3116 2767 4.05 159 F 70-110 19.82 7.9 3063 2939 4.05 159
50
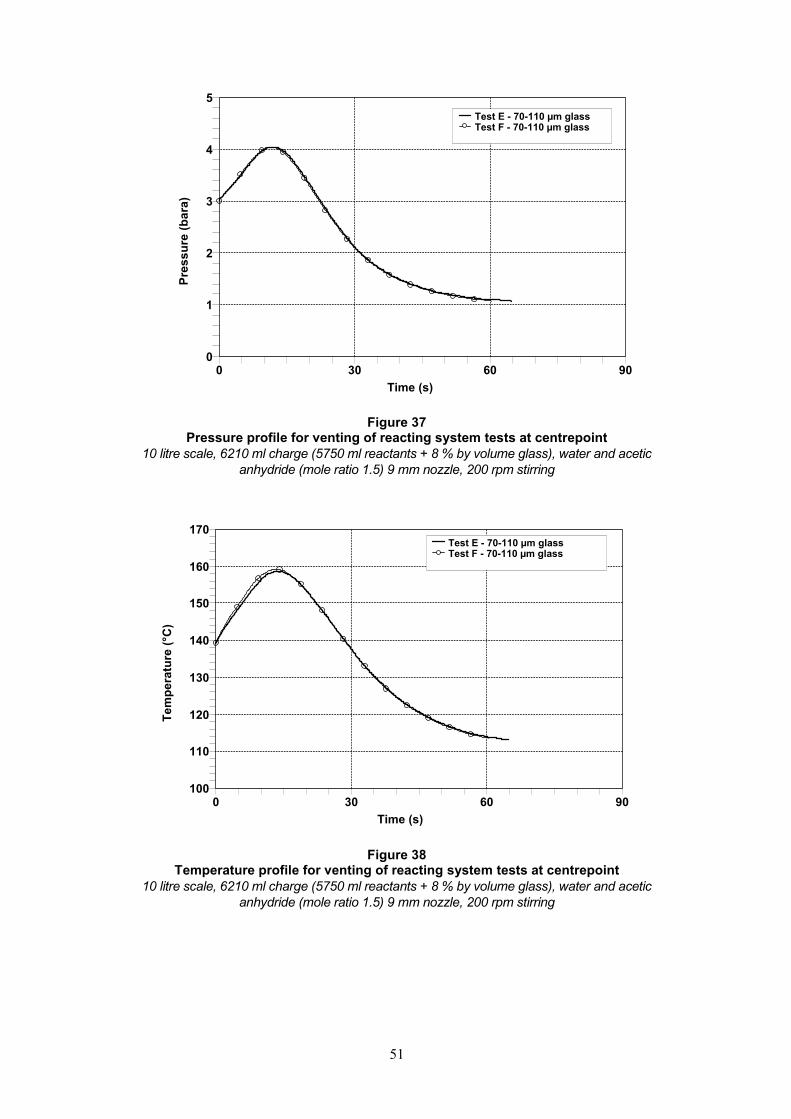
0
1
2
3
4
5 Test E - 70-110 µm glassTest F - 70-110 µm glass
Pres
sure
(bar
a)
0 30 60 90
Time (s)
Figure 37Pressure profile for venting of reacting system tests at centrepoint
10 litre scale, 6210 ml charge (5750 ml reactants + 8 % by volume glass), water and acetic anhydride (mole ratio 1.5) 9 mm nozzle, 200 rpm stirring
100
110
120
130
140
150
160
170
)
Test E - 70-110 µm glassTest F - 70-110 µm glass
Tem
pera
ture
(°C
0 30 60 90
Time (s)
Figure 38Temperature profile for venting of reacting system tests at centrepoint
10 litre scale, 6210 ml charge (5750 ml reactants + 8 % by volume glass), water and acetic anhydride (mole ratio 1.5) 9 mm nozzle, 200 rpm stirring
51

160
140
120
100
80
60
40
20
0
Test E - 70-110 µm glassTest F - 70-110 µm glass
dT/d
t (K
/min
)
80 100 120 140 160 180 Temperature (°C)
Figure 39 Heat rate profiles for reacting system tests at centrepoint
10 litre scale, 6210 ml charge (5750 ml reactants + 8 % by volume glass), water and acetic anhydride (mole ratio 1.5) 9 mm nozzle, 200 rpm stirring
6.4.5 Note On Mixing
Table 20 shows the mass balance data for the glass particles in each test. In the case of an ideally mixed system, with no slip between the solid and liquid phases, it could be expected that the glass concentration in the reactor and the vented fluid would be the same. Table 20 gives the fraction of the initial liquid and glass masses that were drained from the reactor. In every case, there is an increased concentration of solids in the reactor following venting. It is likely that there was some accumulation of solids towards the bottom of the reactor with the solid glass, particularly with the larger solids. The nature of the reactor vessel makes it impossible to make a visual inspection and qualitative judgement of the stirring efficiency. However, it was believed to be good, particularly at the centrepoint and high stirring rates.
It is very interesting to note the data from the tests using the hollow solids. From previous observations on the one litre scale, these particles are very easily mixed with the liquid, and float when not agitated. Therefore, with poor mixing, any increase in solid concentration would be towards the top of the reactor. It would be expected that as this will vent first, and that a greater fraction of the glass would be vented than that in the reactor as a whole. If the mixing was always perfect, then an equal fraction of solid and liquid would remain in the reactor and the catch tank. The data in table 20 shows that this is not the case, and a greater fraction of the liquid was vented. It is clear therefore that the liquid is vented preferentially even though the solids are lighter than the liquid.
52

Table 20
Test
Selected mass balance data from acetic anhydride/water tests.
Glass diameter (mm)
Initial glass
charge (g)
Glass carryover to catch tank (g)
Glass remaining in reactor
(g)
Fraction of initial
glass remaining in reactor
Fraction of initial
liquid charge
remaining in reactor
A 3000 1875 0 1868 1.00 0.54 B 3000 1875 0 1870 1.00 0.38 C 4-45 1875 45 1782 0.95 0.76 D 150-250 1875 20 1806 0.96 0.51 E 70-110 1078.1 20 1042 0.97 0.45 F 70-110 1078.1 20 992 0.92 0.48 G 3000 2437.5 0 2421 0.99 0.39 H 4-45 2437.5 299 2078 0.85 0.52 I 150-250 2437.5 25 2354 0.97 0.35 J 250-425 2437.5 0 2362 0.97 0.43
K 0-65 (hollow glass) 585 220 346 0.59 0.44
L 0-65 (hollow glass) 450 70 383 0.85 0.66
53

54

7 FURTHER DISCUSSION
7.1 REPRODUCIBILTY OF RESULTS Most of the experiments described in this report involve heating fluids, in a closed sealed system, to a temperature above their atmospheric pressure boiling temperature. The liquids were stirred at all times and sometimes contained inert solids. Pressure relief via a nozzle then took place at a defined pressure or temperature. In this situation vapour will start to leave the vessel. Because of the consequent reduction in pressure the liquid will boil: vapour bubbles will form in the liquid and will start to rise and to coalesce. Further bubble break up and recoalescence may follow. The bubbles will tend to drag liquid with them and the liquid level will swell because of the volume of vapour that is present within it in the form of bubbles. If the liquid swell causes the surface of the vigorously boiling liquid to reach the inlet of the pressure relief line at the top of the vessel then obviously there will be a two-phase discharge. If solids are entrained with this vapour–liquid mixture then it will be three-phase.
The nucleation of vapour bubbles and the manner in which they rise, coalesce and break up in a stirred vessel is a process that cannot as yet be described mechanistically. Correlations with empirical parameters that can be evaluated from experimental data can be used to describe some facets of this process, see Appendix A. If the vessel in which this is occurring is very large then there will be many vapour bubbles and some averaging of the essentially random effects that may occur at one specific location. Also the wall effects will be minimized. In smaller vessels this will be less true: intuitively one might therefore expect a larger variation between the results of replicate experiments when these are made on the small scale. Indeed, when liquid is boiled on the very small scale, as in an ignition tube for instance, there can be huge changes in the way this happens. At one extreme a large slug of vapour may form and totally eject the tube contents: at another the contents may boil in a fairly quiescent manner.
Despite careful experimentation and a very reproducible procedure, there were some significant differences between replicate tests. These were more noticeable in the smaller scale tests and are attributed to the factors discussed above.
7.2 STIRRING EFFICIENCY
The efficiency of the mixing was examined qualitatively using a glass reactor of the same dimensions as the 1 litre stainless steel vessel. With the larger glass solids, a high stirring rate, greater than 1000 rpm was needed to prevent a “clear” layer forming near the surface of the liquid. Using smaller diameter solids, the mixing was much improved and a lower stir rate provided good mixing. The mixing efficiency was noticeably affected by the temperature of the water. At high temperatures, and therefore reduced liquid viscosity, a higher speed was necessary to give good mixing. The one litre stainless steel vessel has glass view ports that only allow very limited estimation of the mixing efficiency.
The low stir speeds employed in the factorial experimentation would give relatively poor mixing. There would be a significant increase in solids concentration at the bottom of the liquid over the concentration near the surface. Again the size of the solids would be a factor in the mixing efficiency. The higher concentration near the bottom of the liquid would undoubtedly affect the extent of solid carryover from the reactor vessel during venting.
55

7.3 TEMPERATURE VARIATION WITHIN THE VESSELS
A thermocouple was placed in a port fitting in the top plate of the 1 litre reactor. The tip of the thermocouple was just at the level of the top plate inside the vessel. This was initially intended to measure the vapour phase temperature. As the liquid cooled during venting, there was a point where this thermocouple would give increasing temperature readings. This was due to heat transfer from the top plate to the thermocouple. The top plate would be cooled by the liquid when there was contact, but when this ceased, the temperature fell more slowly than that of the liquid/vapour in the reactor. Changing the material of the fitting from stainless steel to PEEK (a much better insulator) made a difference, reducing conduction, but there was still a significant rise in temperature. This was not critical to this project, but it does show an unexpected effect of the thermal mass of the system.
When using high solids loading and relatively low stir speeds, there was a significant temperature gradient through the height of the vessel. At low stir rates, there was some sedimentation of solids, and the mixing was poor. The heat transfer rate to the solids near the thermocouple would therefore be slower than to the liquid, which was better mixed. In extreme cases, a temperature of ~152°C in the solids rich region of the reactor could be observed, whilst that in the higher layer of relatively clear water could be as much as 157°C. Once this problem was identified in the early tests, a second thermocouple, positioned high in the stirred liquid was used to define the venting condition of 152°C. This is equivalent to a vapour pressure for pure water of ~5.06 bara.
7.4 APPROACH TO THERMAL EQUILIBRIUM
The pressure temperature relationship during both the heat up and venting stages has been examined. Figure 40 shows data from a typical test, using a 5 mm nozzle and a fill level of 805 ml. Three thermocouples were used, each at different heights in the reactor. Saturated vapour pressure data for water is also given. The data shows that during the relatively slow heat up the liquid and vapour were essentially at equilibrium conditions. During venting, there were some differences between the 3 temperature readings shown. The two uppermost thermocouples were of ~1/16” diameter and these gave readings very close to the saturated data. The lowest thermocouple had a thicker sheathing, of ~1/8” so as to ensure that it did not flex and become entangled with the stirrer. This gave a reading approximately 3°C above the saturated value.
The time constants of the thermocouples and electronics were estimated by using a step change in temperature (plunging from boiling to cold water) and logging the readings at the fastest rate possible (10 points per second). If a first order response is assumed, the lower thermocouple had a time constant of ~1.4 seconds. Typical cooling rates during depressurisation were up to 2 K s-1, and with a time constant of ~1.4 seconds, the measured temperature would lag behind the actual temperature by ~2.8°C at this rate of change. This ties in quite well with the observed data. It can therefore be assumed that the liquid and vapour are essentially at equilibrium in terms of pressure and temperature during venting.
Figure 41 shows a similar graph for the larger scale experiments in the 10 litre vessel. Similar trends were observed. There is a slight discrepancy on the heat up curve, and this is due to the efficiency of the vacuum pulled prior to the experiment and a small difference in the amount of air present in the reactor. On depressurisation, the air is purged from the system, and the two curves overlay each other. It can again be assumed that vapour/liquid equilibrium is essentially maintained during venting.
56

57
0 1 2 3 4 5 6100
110
120
130
140
150
160
Tem
pera
ture
(°C
)
Pressure (bara)
Heating
Depressurisation
150 mm below lid36 mm below lid82 mm below lidsaturated data
1 2 3 4 5 6100
110
120
130
140
150
160
Tem
pera
ture
(°C
)
Pressure (bara)
Heating
Depressurisation
Saturated data550 rpm, 9 mm nozzle50 rpm, 5 mm nozzle
Figure 40 Comparison of measured temperature at different positions in reactor with saturated
data 1 litre scale, 5 mm nozzle, 805 ml water
Figure 41 Comparison of measured temperature with saturated data
10 litre scale, 7000 ml water
7.5 BALANCE READINGS
In the test apparatus employed during this study, the catch tank rested on a balance, and the reading was continuously logged by the software. It was initially envisaged that the balance readings could be compared, and that an indication of the transition from multi-phase flow to single, vapour only flow would be available. There were, however, discrepancies between tests, and although the shapes of the profiles were similar, the mass carried over was not. This was likely due to the random nature of the bubble generation and coalescence as discussed in section 7.1.
7.6 BASIS FOR SCALE UP
Although the testing on the 1 litre and 10 litre vessels cannot truly be compared, some attempts were made to scale up in a consistent manner. The stirring rates on the large scale were initially chosen to match those on the 1 litre scale on the basis of constant tip impeller speed.
The tip speed is equal to N ´ p ´ d, (rotation rate times the impeller circumference). To obtain equal tip speeds, the stirring rate on the large scale vessel is therefore
dN10 =
d1 ´ N1
10
The ratio of the small to large impeller diameters was 44:80. The stirring rates for the 1 litre vessel, using the 5 mm nozzle and two impellers, were 1000, 200 and 30 rpm. These correspond to 550, 110 and 16.5 rpm on the 10 litre scale. Due to the limitations of the control system, the minimum rate at which the large scale motor could turn smoothly was ~50 rpm, and this had to be taken as the “low” stirring rate. Additionally, for the centrepoint cases, it was decided that 110 rpm was very close to the 50 rpm minimum, and a slightly higher rate was used, namely 140 rpm. This would give a similar tip speed as a rate of 254 rpm on the smaller scale.
58

8 CONCLUSIONS
All of these conclusions are based on experiments covering the following variable ranges: · Nozzle diameters of 2 to 10.5 mm · Median particle diameters of 24.5 to 337.5 µm · Median particle diameter to nozzle diameter ratios of 0.002 to 0.169 · Liquid to solid density ratios of 0.4 to 1.67 · Particle concentrations between 0 and 30% by volume · Initial vessel void fractions between 0.1 and 0.5 · Stirring Reynolds3 numbers between 2903 and 3.3 ´ 105
· Liquid viscosities between 1.77 ´ 10-4 and 3.54´ 10-4 Pa s at the venting condition of 152°C
· Relief set pressures of 5 bara for non reacting systems and 3 bara for reacting systems · Inert solids
8.1 RESULTS FROM DEPRESSURISATION OF SUPERHEATED LIQUIDS
a. Profiles of pressure and temperature against time for depressurising superheated liquids are generally very reproducible (figure 15).
b. Liquid carryover (i.e. liquid flow regime) associated with venting superheated liquids is poorly reproducible on the small (one litre) scale (figures 13, 47 and 48). This is attributed to: · Significant wall effects in small vessels. · The random nature of vapour bubble nucleation, coalescence and break-up during
venting. c. On the larger (10 litre) scale, depressurisation profiles for both temperature and
pressure were highly reproducible (figures 49 and 50). Liquid and solid carryover in replicate experiments was more reproducible than on the one litre scale.
d. Pressure and temperature against time profiles during venting were in general not influenced to a statistically significant extent by the presence of solids (see sections 6.2.7 to 6.2.10).
e. There is limited evidence that under some circumstances the presence of solids can increase depressurisation rates, particularly at intermediate times (Table 24).
f. The inference from e, above, is that the presence of solids may promote even more vapour bubble nucleation and promote bubbly or homogeneous rather than churn turbulent flow.
g. Tests with surfactant confirm the promotion of a flow regime that is close to homogeneous with enhanced solid carryover (Table 13).
h. During venting, liquid is discharged preferentially to the solids. This was observed for both naturally floating and naturally sedimenting particles, i.e. both less and more dense than the fluid in which they are suspended.
i. Comparison of data has been made for: · A fixed vessel fill level. · A fixed liquid volume. However, direct comparison of tests with and without solids is not straightforward. This is because a glass liquid mixture of a defined volume, and temperature, has a different energy content (and hence degree of superheat) to the same volume of water under analogous conditions. The mass of vapour generated on depressurisation is therefore different and this may affect the flow regime present.
3 Based on water viscosity at 152 °C, corrected for solid and/or glycerol fractions.
59

8.2 RESULTS FOR DEPRESSURISATION OF A REACTING SYSTEM DURING EXOTHERMIC RUNAWAY
The reacting system studied was the hydrolysis of acetic anhydride with a water to acetic anhydride mole fraction of 1.5. The relief set pressure was 3 bara, and the stirring rate was 200 rpm.
a. Adding inert particles to a reacting system increases the phi factor and hence reduces the reaction runaway rates. This effect is highly non-linear with particle mass.
b. Depressurisation of reacting systems containing inert solids are highly reproducible on the 10 litre scale (figures 37-39).
c. The temperature of inert particles suspended in a liquid whose temperature is changing rapidly may lag behind the fluid temperature. Conventional unsteady state heat transfer models show that this will be most evident for: · Large particles. · Rapid temperature changes. · Particles with low thermal diffusivity (k/Cpr),
where k is the particle thermal conductivity, Cp is its specific heat and r is its density.
This means that the effective phi factor can change during the course of a fast runaway
d. For the reason outlined in c, large inert particles can appear to accelerate a runaway reaction relative to the same mass of smaller particles and this can lead to larger overpressures during venting (figures 31 and 34).
e. Heat transfer limitations to the body of a large or massive reactor vessel during a fast runaway may mean that the average temperature in the reactor body is much lower than in the reacting fluid. In an analogous way to item c this can lead to a shifting value of the phi factor as a reaction proceeds. The reaction may become much faster than that anticipated from small scale studies at an analogous phi factor (figures 6 and 12).
f. Direct comparison of the results from reacting systems with, and without solids is very difficult because of the change in the phi factor (and hence reaction rate) and the ability of inert solids to accelerate a runaway reaction, see items a, c and d.
g. Production of vapour and preferential flow of the liquid (relative to the solid) in the vent discharge will enhance the solid concentration in the reactor. This will then alter the phi factor and hence the runaway rate. If the solids are participating in the reaction this may also enhance the reaction rate per unit volume.
h. As a consequence of the above, adiabatic calorimetry studies required for rigorous calculation of the size of vent lines required for 3 phase discharge will be extremely complex to define.
As a general conclusion these preliminary studies show that, for the ranges of variables studied, small diameter inert solids have little influence on the rates of depressurisation achieved. This means that for solids in a reacting system DIERS vent sizing calculations based on data corresponding to a phi factor of unity can be used with the same confidence as for two-phase discharges.
60

9 RECOMMENDATIONS FOR FUTURE WORK
This project has identified several areas of further study that may be required in order to provide a better understanding of the venting of liquids containing suspended solids and to establish more confidence when applying existing DIERS vent sizing methods.
9.1 STUDIES ON THE EFFECTS OF SOLIDS ON NUCLEATION AND BOILING DURING VENTING
The presence of solids probably assists the ease of nucleation of gas/vapour bubbles during depressurisation. For this reason alone the solids should be expected to influence blowdown characteristics. It may be that the solids increase the likelihood of a homogeneous flow regime over churn-turbulent flow, with consequences for the required vent size.
9.2 STUDIES AT DIFFERENT FLOW REGIMES
The flow regime influences liquid carry over in two-phase venting, and will likely have an effect on the solid carryover from the reactor. Further studies using different flow regimes may allow evaluation of these effects.
9.3 STUDY OF SLIP VELOCITY DURING VENTING
This project has involved experiments with solids that were both more dense and less dense than the liquid in which they were suspended. In all cases, the vented fluid was less concentrated in solids than that retained in the reactor. The reason for this liquid-solid slip velocity being present with both dense and light solids needs to be studied.
9.4 SOLID DEPOSITION IN DOWNSTREAM PIPEWORK
No consideration has been given in this project to the deposition of solids in downstream pipework and vessels, but this may be a significant factor and lead to fouling or partial line blockage and high pressure drops.
9.5 STUDY OF REACTION RATES DUE TO INCREASING CONCENTRATION OF SOLIDS
During venting, the solid concentration within the reactor is likely to increase due to both evaporation of the liquid and to slip flow of the liquid past the solids. This is likely to affect the reaction rate, and may in turn affect the required vent size. A possible scenario is that a vent is adequately designed for a truly well mixed homogeneous system, but as venting progresses the reaction rate becomes such that overpressurisation could result. Some consideration should be given to the manner in which calorimetry should be carried out in this case.
61
9.6 COMPARISON METHODS FOR RESULTS FROM REACTING SYSTEMS
In this project, attempts were made to compare tests with reacting systems both with and without inert solids. The effect of the solids on the thermal inertia was significant, meaning that tests with equal liquid reactant mass were in fact at different phi factors and hence proceeded at different rates. This means that the tests could not be compared directly. Additional problems, with reacting solids, may be that reaction rates will be influenced by mass transfer, and hence stirring rates and that reaction rates will vary as solid concentration changes. Further analysis of such features is required.
9.7 THE INFLUENCE ON VENTING OF INERT AND REACTING SOLIDS
It is thought likely that entrainment of solids with liquids during venting is a phenomena that is primarily dependent on the fluid dynamics associated with the depressurisation. For this reason inert particles have been used throughout the current study. It is important to ascertain whether solids that are participating in the reaction (e.g. as reactants, a heterogeneous catalyst or products) behave in an analogous manner as inert particles that are present in a reacting medium.
9.8 DETAILED MODELLING
Detailed modelling of the venting process, using commercially available software packages, would allow comparison with both small and large scale experimental data, and allow direct comparison with two-phase systems.
9.9 LARGER SCALE STUDIES
An obvious area for further work is large scale testing. Once the effects of both inert and reacting solids have been well documented and understood in small-scale studies there will be a need to verify that analogous behaviour is also present in large scale applications.
62

10 NOMENCLATURE
v
A constant in equation 27 C solids concentration by volume CD drag coefficient for a spherical particle Cp specific heat at constant pressure Cpm specific heat of the mixture at constant pressure Cvm specific heat of the mixture at constant volume D pipe diameter D impeller diameter de bubble diameter dp solid particle diameter dP/dz pressure drop per unit length4
f friction factor fl friction factor in absence of solids (i.e. liquid only) Fr Froude number ft Friction factor for two-phase flow in equation 18 g gravitational constant Gc choked mass flux k constant in equation 25 k constant in equation 7, dependent on flow regime m mass N stirring rate P pressure Re Reynolds number S ratio of solid:liquid densities U velocity U¥ bubble rise velocity USL slurry velocity v specific volume of mixture v' constant specific volume = (1-x)vs in equation 3 V¥ terminal settling velocity of sphere
s specific volume of the solid and liquid in mixture V volumetric fraction –weighted mean liquid velocity We Weber number x gas mass fraction
r
l
a volume fraction, or void fraction G mixture specific heat ratio (Cpm/Cvm) el liquid fraction h choking pressure ratio
l friction coefficient in equations 8 and 9 µ viscosity q volume fraction of solids
g gas phase density rl liquid density s surface tension
%
J kg-1 K-1
J kg-1 K-1
J kg-1 K-1
m m m m
Pa m-1
-2m s-1kg m-2 s
kg rpm
Pa
-1m s-1m s-1m s
m3 kg-1
m3 kg-1
-1m sm3 kg-1
-1m s
Pa s
kg m-3
kg m-3
N m-1
4 This is given in some equations as –dP/dz. The different definitions have been retained in the report to be true to the original work.
63

(mCp )cellf phi factor, = 1+ (mCp )sample
Φ two-phase multiplier
Subscripts 1 1 litre scale 10 10 litre scale g gas gls gas, liquid and solid (3 phase) l liquid m mixture mix mixture s solid sl slurry
64

11 REFERENCES
1. Lees F. P., Loss prevention in the process industries, 2nd Edition, 1996, Butterworth Heinemann, ISBN 0 7506 1547 8.
2. Partington S, Waldram S. P.: Runaway reaction during production of an azo dye intermediate, Trans. IChemE, 80, Part B, Jan 2002, p33 –39
3. Release of Chemicals from International Biosynthetics Ltd, HSE Books, ISBN 0-11-882154-7
4. Report of investigation into a major accident at Hickson Pharmachem Ltd., Loughbeg, Ringaskiddy, Co. Cork,” HSA report, Dublin Stationery Office, 1994, ISBN 0 7076 0448 6.
5. Fisher, H.G., Forrest, H.S., Grossel, S.S., Huff, J.E., Muller, A.R, Noronha, J.A., Shaw, D.A. and Tilley, B.J: “Emergency relief system design using DIERS technology, The Design Institute for Emergency Relief Systems (DIERS) project manual,” 1992, AIChE, NY. ISBN 0-8169-05668-1.
6. Etchells, J and Wilday, J: “Workbook for chemical reactor relief system sizing,” 1998, HSE Books. ISBN 0-7176-1389-5
7. Barton, J and Rogers, R.L.: “Chemical reaction hazards,” second edition, 1997, I.Chem.E. ISBN 0-85295-341-0
8. Steinbach, J: “ Safety assessment for chemical processes,” 1999, Wiley-VCH, Germany, ISBN 3-527-28852-X
9. Beyer, R and Steinbach, J: “Source term characterization for three-phase venting scenarios.” Paper presented at the 10th International Symposium on Loss Prevention and Safety Promotion in The Process Industries, Stockholm, June 19th –21st, 2000.
10. Chan, J.R., Lee, C., Cheng, C., Chou, W.K., and Ho, T.C.: “Pilot-scale study of multiphase venting from a vessel at elevated pressure and temperature.” Trans of the IChemE, Vol 78, Part B, pp 434-444, November 2000.
11. Davies L., Efficiency in research, development and production: the statistical design and analysis of chemical experiments, 1993, Royal Society of Chemistry, ISBN 0 85186 137 7
12. Leigh, W.R.D., and Krzeminski, Z.S.: “The uncatalysed reaction of acetic anhydride with water,” Chemistry and Industry, pp778-779, April 28, 1962
13. I.Chem.E, Industrial accidents database, 2002, available from http//www.icheme.org.uk.
14. Welty, J.R., Wicks, C.E. and Wilson, R.E.: “Fundamentals of momentum, heat, and mass transfer.” John Wiley and Sons, New York 1976. ISBN 0-471-93354-6
15. Nichols, F.P.: “Equivalent systems for multiphase relief fluid flow.” Personal communication, 2000.
16. Starkie, A.J.: “The application of large scale testing to the design of an emergency relief system,” paper presented at Major Hazards Onshore and Offshore II , UMIST, Manchester, 24-26 October 1995. I.Chem.E symposium series no. 139.
65

17. Fan, L.S.: “Gas-liquid-solid fluidisation engineering,” 1989, Butterworths, Ma. ISBN 0-409-95179X.
18. Hewitt, G.F., “Measurement of two-phase flow parameters.” Academic Press, 1978.
19. Toda, M., Harada, E., Saruta, M. and Kunno, H.: “Transport of solids by gas-liquid upward flow in vertical pipes,” Trans Chem Eng, Vol 8, no. 4, pp380-386, 1982.
20. Griffith, P. and Wallis, G.B.: “Two-phase slug flow,” Trans American Society of Mechanical Engineers, vol 83C,pp307-320, 1961.
21. Fan, L.S. and Tsuchiya, K.: “Bubble wake dynamics in liquids and liquid-solid suspensions,” 1990, Butterworth-Heinmann, Ma. ISBN 0-409-90286-1.
22. Jang, C.S.: “Hydrodynamics of liquid-solid fluidization,” M.S. Thesis, Ohio State University, 1989
23. Gorowara, R.L. and Fan, L.S.: “Effect of surfactant on three-phase fluidised bed hydrodynamics,” Industrial and Engineering Chemistry Research, vol 82, pp 882-891, 1990.
24. Clift, R., Grace, J.R. and Weber, M.E.: “Bubbles, drops and particles,” Academic Press, New York, 1978.
25. Sakaguchi, T., Minagawa, H., Tomiyama, A., and Shakutsui, H.: “Pressure drop in gas-liquid-solid three-phase slug flow in vertical pipes,” Experimental thermal and fluid science, vol 7, pp 49-60, 1993.
26. Kim, S.D. and Choi, J.H.: Canadian Journal of Chemical Engineering, Vol 62, pp 85, 1984.
27. Soliman, R.H. and Collier, P.B.: “Pressure drop in slurry lines,” Hydrocarbon processing, pp 60-63, November 1990.
28. Surbey, D.W., Kelkar, B.G. and Brill, J.P.: “Study of multiphase critical flow through wellhead chokes,” SPE Production Engineering, pp 142-146, May 1989
29. Lannom, D.A. and Hatzignatiou D.G.: “Multiphase-flow choke correlation limits analysed,” Oil and Gas Journal, pp37-41, 8 April 1996.
30. Herm-Stapelberg, H. and Mewes, D.: “Pressure-drop calculation in three-phase slug flow of water, oil, and air,” International Chemical Engineering, Vol 34, No. 3, pp295-314, July 1994.
31. Açikgöz, M., França, F. and Lahey Jr, R.T.: “An experimental study of three-phase flow regimes,” International Journal of Multiphase Flow, vol 18, no. 3, pp327-336, 1992.
32. Poletto, M and Joseph, D.D.: “Effective density and viscosity of a suspension,” Journal of Rheology, Vol 39, no. 2, pp323-343, March/April 1995.
33. Perry, R.H. and Chilton, C.H.: “Chemical Engineers’ Handbook, 5th Edition,” 1973, McGraw-Hill.
34. Korfmann, S. and Friedel, L: “Applicability of laboratory heterogeneous liquid-liquid phase reaction kinetic data for relief vent sizing,” Journal of Loss Prevention in the Process Industries, Vol 14, pp77-82, 2001.
66

APPENDIX A
A.1 MULTIPHASE VENTING
Several References (The DIERS Project Manual5, Barton and Rogers7 and Steinbach8 give no mention of the potential presence of solids or multiphase systems, rather stating that relief flow is likely to be single phase or liquid/gas two-phase.
The HSE Workbook for Chemical Reactor Relief System Sizing6 gives a brief discussion of the effects of solids and a methodology for dealing with the reduction of relief line capacity due to the presence of solids. This reference recommends that the existing two-phase methods can be used if the liquid/solid system is well-mixed during venting. If not, and the solid contributes to the runaway, the concentration of the solids may increase during venting, and the heat rate per unit mass may increase. If the system is reasonably well-mixed, the existing methods can be used with some modifications.
• The mass of the liquid should be replaced by the overall mass (liquid and solid). • The heat release rate should be expressed in terms of the overall mass rather than
the liquid mass. • An average density of the liquid/solid phase should be used. • If the solid particles are sufficiently small that they are in thermal equilibrium
with the liquid, a mean heat capacity of the mixture can be used. Otherwise it should be assumed that the solid has a zero heat capacity. The heat capacity can be found from:
CP mixture
(mCp )liquid + (mCp )solid
m = (1)
liquid + msolid
where Cp is the specific heat at constant pressure and m is the mass • The latent heat and vapour/gas density are unaffected by the presence of solids
Additionally, the capacity of the relief system may be reduced by the presence of solids. • The effect of solids in the relief line will affect the mixture density, and therefore
static head in an inclined line. An average liquid/solid density should be used where changes in head are involved.
• The effect on viscosity may be important if the system becomes very viscous and laminar flow occurs. Flashing systems may need particular care, as the flashing of vapour will increase the solid concentration in the liquid.
• In flashing flows, the heat retained by the solids will increase the amount of flashing and may lead to choking at lower flows than for systems without solids. A safe assumption is to assume a mean heat capacity of the solid and liquid, even where thermal equilibrium is not expected.
Nichols15 gives equations of state for multiphase systems, being applicable to solid-liquid-gas or liquid-liquid-gas systems. He states
GP(av ) = constant (2) Where P = pressure
G = mixture specific heat ratio = Cpm/Cvm v = specific volume of mixture a = gas volume fraction. Cpm = specific heat of the mixture at constant pressure Cvm = specific heat of the mixture at constant volume
The choked mass flux can be obtained from:
67

P + G 1
G 2 G = o
h G (3)c cv - v' o
Where Gc = choked mass flux ηc = choking pressure ratio, =Pc/Po v' = constant specific volume = (1-x) vs x = gas mass fraction vs= specific volume of the solid and liquid in the mixture and the subscript o indicates upstream (reactor) conditions.
Starkie16 has presented work where the “gassy” DIERS methodology was applied to the venting of the decomposition of a gas generating powder from a drier. Local hot spots are likely in driers, and a scaled (1/64th) model was constructed for testing the venting performance. The findings were that the DIERS equations were over conservative in this situation.
A.2 FLOW REGIMES
Fan17 gives schematic diagrams of the flow patterns that exist with three-phase vertical upflow (taken from Hewitt18). These are given in figure 42. It has been found that the transition from bubble to bubble-slug flow occurred at lower gas velocities in three-phase systems than in two-phase systems due to the increased bubble coalescence caused by the presence of solid particles. A study by Toda et al19 using an air-water-glass system found that the transition from bubble to slug flow with up to 10 % solid (by volume) can be satisfactorily predicted by the two-phase liquid-gas chart of Griffith and Wallis20 (see figure 43), using the slurry velocity in place of the liquid velocity. It was also found that the solid concentration was uniform across the cross sectional area of the pipe in the case of three-phase flow, whereas in solid-liquid flow, the solids concentration was greater near the pipe wall than in the centre.
A.3 BUBBLE BEHAVIOUR
Fan and Tsuchiya21 state that that a liquid-solid mixture with small, light particles is often regarded as a pseudo-homogeneous mixture. Rising bubbles behave differently depending on whether the system is homogeneous or heterogeneous. The behaviour of the bubble in a three-phase system depends primarily on the ratio of the solid particle to bubble diameter. A correlation for the bubble rise velocity for bubbles in liquid-solid suspensions is given by Jang22. From experimental data, the bubble rise velocity is given as
1/ n/ 2 -
é ù-ngd ö2æ s
-(K de )bs n +U ê
êëú úû
e (4)÷÷+ççè
=b d 2r øl e
Where 120ì
íî 190
The parameter n is correlated graphically from Jang22. The variables must have the following units:
Ub, bubble rise velocity, (m s-1) de bubble diameter and dp solid diameter, (m) σ surface tension, (N m-1) ρl liquid density, (kg m-3)
68
üýþ
4 ]{( [( ]´211}´ ´10 08.1 4
- 10 35. 2 4 el )d -1 6´[ 10 23.1 K 604 )e 235 430 (d ´10 11.3 p
(5)
)tanp + -= e - e - - -bs l l p

g gravitational constant, (ms-2). εl is the liquid fraction in the bed
The above correlation was obtained from glass/water tests under the following conditions • bubble diameter 2-20 mm • particle diameter 0.163, 0.450, 0.774, 1.0 and 2.0 mm • solid density 2.5-2.79 g cm3
• liquid fraction 0.48, 0.53 and 0.58
The bubble rise can be compared with that given for bubble rise in a pure liquid (Gorowara and Fan23, from Clift et al24)
1/2é2.14σ ù
U 0.505gde (6)+= êë
úûρ lde
¥
Where U∞ = single bubble rise velocity.
And that used in two-phase reactor flow (Fisher et al5) 1/4
U = k{σg(ρ l -ρ g )}
(7)¥ ρ l
1/2
Where the value of k is dependent on the flow regime (1.18 for homogeneous flow, 1.53 for churn-turbulent flow)
A.4 PRESSURE DROP IN PIPELINES
Sakaguchi et al25 have written on the pressure drop of slug flows in vertical pipes. In this, the flow is divided into six regions as in figure 44. Six individual regions of flow with separate characteristics have been isolated. These are:
1 – the region just in front of the large gas slug, where the phase distribution is affected by the large bubble and the liquid contains only solid particles. 2 – the region where the liquid contains only solid and the influence of the large gas bubble is negligible. 3 – the region that has both small gas bubbles and solid particles in the liquid 4 – the region just behind the large gas bubble. The central core of this region contains small gas bubbles and solid particles. The outer liquid layer contains solid particles. 5 – the main body of the large gas bubble 6 – the region near the front of the slug where the thickness of the liquid film changes gradually and the velocities and phase distributions change.
Under certain conditions gas bubbles are contained in regions 1 and 2 and the flow is characterised as in b in figure 44.
Region 3 is the area of interest in this project, and the pressure drop for bubbly three-phase flow in this region (reported in a separate paper) is given as
( )2ρ α VdP ö llæ l l Φ2 (8)÷ø=ç
èdz 2D Where χl is a friction coefficient and Φ2 is the two-phase multiplier. The operator á ñ refers to area averaged values and V is the volumetric fraction-weighted mean velocity of the liquid. `
69

-α(1 4.95 ) öαæ- ÷÷
gΦ2 = ç çè
s 1 350 (9)+Fr Re ll1 α - g ø
And 64
= for laminar flow (Rel<2300) (10)ll
l
Rel
l = 0.3164Rel -0.25 for turbulent flow, (Rel>2300) (11)
The liquid Reynolds and Froude numbers can be found from ( )ll αρ D V
=l µ l
Re (12)
And
V )2 l( α lFrl (13)=
gD
Fan17 states that the pressure drop due to wall friction in a three-phase upflow system can be defined in terms of the total pressure drop corrected for the static head (ex Toda et al19).
æ dP ö æ dP ö ç- ÷ = ç- ÷ - (ε g ρ + ρ ε l + ρ ε )g (14)è dz ø GLS è dz ø g l s s
Where ε refers to the volume fraction of the phase. Toda et al19 state that when the slurry or liquid superficial velocity is low (<~0.2 ms-1) the values of (-dP/dz) tend to be negative. This indicates a pressure increase due to friction along the pipe, and is an indication that the model is not applicable at these conditions.
Toda et al19 found a simple modification to the Lockhart-Martinelli relationship gave a good correlation for the pressure drop due to friction in a three-phase flow. The original Lockhart-Martinelli relationship gave the two-phase (gas-liquid) pressure drop due to friction in terms of the gas phase pressure drop and the liquid phase pressure drop. The correlation modified by Toda et al replaces the liquid parameters with those of the solid-liquid slurry. The Lockhart-Martinelli parameters Φ g, Φ sl and χ become
g
gls g zP
zP )/( )/(
D
D =F
D -
D -(15)
( D - P / D z) gls = (16)Fsl ( D - P / D z) sl
And F g ( D - P / D z)
(17)sl c = =
F sl ( D - P / D z) g
Fan17 further gives an empirical correlation of Kim and Choi26 for the friction factor for calculation of the total pressure drop.
PD öæ D 42.0 ÷ø
-çè U ö
÷÷D æ
ççè
= 55.21 z 33.0 55.0 g
sl
f Re We (18)-= sl slt 2U 2 Ursl sl øWhere ft = friction factor
70

(-∆P/∆z) = pressure drop due to friction D = pipe diameter Usl = slurry velocity
Ug= gas velocity Re = Reynolds number We = Weber number
2 r D U sl slWesl = (19)
s
This correlation was developed from experimental results in a coal-oil slurry system, and covers the ranges 0.1£Ug/Ul<1571, 1£Resl<5160 and 0.01£Wesl£220.
A.6 PRESSURE DROP IN SLURRY LINES
Soliman and Collier27 give a paper on the pressure drop in two-phase solid/liquid pipelines. Four flow regimes are given (see figure 45). In emergency venting, homogeneous type flow (i.e. no sedimentation) through the vent is most likely. It can be seen that the pressure drop increases due to the presence of the solids.
In the homogeneous regime, the friction factor f can be calculated from 0.35312 -
é U ù0.5024 428.1 0.1516f = f + C 8444.0 f C (20)êë
úû
l l D Dg(S 1)-Where fl = friction factor in the absence of solids (liquid only)
C = concentration of solids, volume % U = velocity of flow (m s-1) D = inside diameter of pipe (m) S = ratio of solid:liquid densities, ρs/ρl g = gravitational constant (m s-2) CD= drag coefficient for spherical particle.
4gdp (ρ -ρ l )s = (21)CD 3ρ lV
2 ¥
Where dp = spherical particle diameter (mm) V∞ = terminal settling velocity of sphere (m s-1)
An interesting note from this work is that the role of particle shape perhaps ranks equally with that of particle size distribution.
From sections of the oil and gas industry there are several papers on choked multiphase flow (Surbey et al28, and Lannom and Hatzignatiou29), but these relate mainly to gas/liquid flows. A paper by Herm-Stapelberg and Mewes30 gives calculations and experimentation relating to pressure drops in three-phase slug flow for oil/water/gas mixtures. It gives two limiting cases for three-phase flow as the two immiscible liquids, and the gas and liquid. Frictional pressure drop calculations are given for each case. Açikgöz et al31 have studied three-phase water-oil-gas systems and found new flow regimes not found in two-phase flow.
71

A.7 EFFECT OF SUSPENDED SOLIDS ON PHYSICAL PROPERTIES
Fine suspended solids change the physical characteristics of a liquid. The apparent density and viscosity of a liquid change when solids are added. The density can be simply calculated from the liquid and solid densities and the solid fraction in the mixture.
rmix = (1- r q + qr (22)) l s
Where q is the volume fraction of the solids.
There are various correlations for estimating the viscosity of the mixture. Commonly cited equations are (Poletto and Joseph32):
The Einstein relationship m m = l (1+ 5 q ) (23)m 2
The Thomas equation 2
m = m (1+ 5.2 q + 05 .10 q + e00273.0 6.16 q ) (24)m l
The Mooney equation ö5æ
-ç çè
q k 1 2
÷÷q (25)ø
m = m lem
The Barnea and Mizrahi equation ö5æ q ÷÷
ç çè1 3 -q (26)ø
m = m lem
And ml (27)m = 2m
öqæ çè 1 ÷
ø -
A
Where A has a value of 0.680 for smooth spheres in a liquid. The parameter k is a constant with values given as 1.35 £ k £ 1.91 by Poletto and Joseph and 1 £ k £ 1.5 from Perry33.
Perry33 gives another relationship by Mori and Ototake, 56.1 q ö æ (28)÷
ø m m = lm ç
è 52.0 -qIt should be noted that equations 24 and 25 reduce to the Einstein correlation when f is very small.
Fan and Tsuchiya21 give a relationship from fluidised beds, relevant when the solids fraction is greater than 0.2.
15. 36 q 5 .2 (29)m = m lem
A.8 CALORIMETRY FOR HETEROGENEOUS REACTIONS
Several references indicate that there may be difficulties in obtaining correct calorimetric data for heterogeneous systems. The HSE Workbook6 states that the reaction may be diffusion rather than kinetically controlled. The agitation of the sample will therefore have an effect on the reaction rate. Several tests may be necessary to identify the worst case exotherm, or conditions that may be present on plant.
72

Korfmann and Friedel34 have considered application of calorimetry to vent sizing of two immiscible liquids. As an indication of the effect of agitation, figures are given for the maximum self-heat rates obtained at different stirring speeds, for the emulsion polymerisation of vinyl acetate. At 100, 200 and 400 rpm, the respective maximum rates obtained were 1, 40 and 150°C min-1. A mechanism including rates due to both the chemical reaction and the mixing (interfacial area) is given.
A.9 OTHER RELATED RESEARCH WORK
Beyer and Steinbach9 have presented experimental data from a project involving three-phase flow using unstirred systems. The apparatus consists of a 1.1 litre adiabatic Dewar system connected via a pneumatically activated ball valve to a 120 litre catch tank. Testing has been performed using water/glass particle mixtures and depressurising from 4 barg.
Comparison of data from pure water and water/glass mixtures has shown that the presence of the glass particles promotes multiphase flow. The particle diameter and the solids fraction both have major influences. Smaller particles more readily induce multiphase flow. Whether this is due to the increased viscosity or the presence of more bubble nucleation points promoting more homogeneous flow has not yet been investigated. In spite of the promotion of multiphase flow, very little solid was carried over during venting.
Comparison of the pressure profiles (see figure 46) shows that with mixtures containing solids, the pressure initially drops more slowly, but eventually falls to ambient more quickly than for the pure water system. This is consistent with an increased mass of water being vented (e.g. possibly by homogeneous or bubbly flow rather than churn-turbulent flow) in the early stages, allowing an earlier transition back to single vapour phase flow once disengagement occurs.
There are some problems in comparing like with like – the addition of glass particles reduces the volume of water and the level swell will undoubtedly be affected. Increasing the viscosity of the water without changing the latent heat, heat capacity, density or vapour pressure may be impossible.
Chan et al10 give data obtained on a high pressure pilot scale study of three-phase venting. A 112 litre pressure vessel rated, to 100 bar and 300°C was connected to an 1100 litre catch tank. Blowdowns have been performed using water/steam, and water/steam and terephthalic acid. The acid is a water soluble solid at high temperature. Previous experience of venting on plant scale operation was that the relief valve had become clogged with solid, and re-seating was difficult. Three-phase flow was therefore occurring. The initial studies were an investigation into this problem, and depressurisations have been carried out at ~40 bara and ~70 bara using both pure water and a water-acid mixture. The venting profiles have been compared to those predicted by SAFIRE. SAFIRE treats inert solids as non-volatile liquids.
The results of the comparisons show that in the case of the water/steam system, the actual pressure drop was quicker than the SAFIRE prediction. This has been attributed to nonhomogenity in the reactor. With the addition of the terephthalic acid, the actual and predicted pressure profiles were in much better agreement. A logical conclusion of this is that the presence of the solid does have some effect on the flow from the reactor. The effect of the solid on the venting mass flux has not been investigated.
73
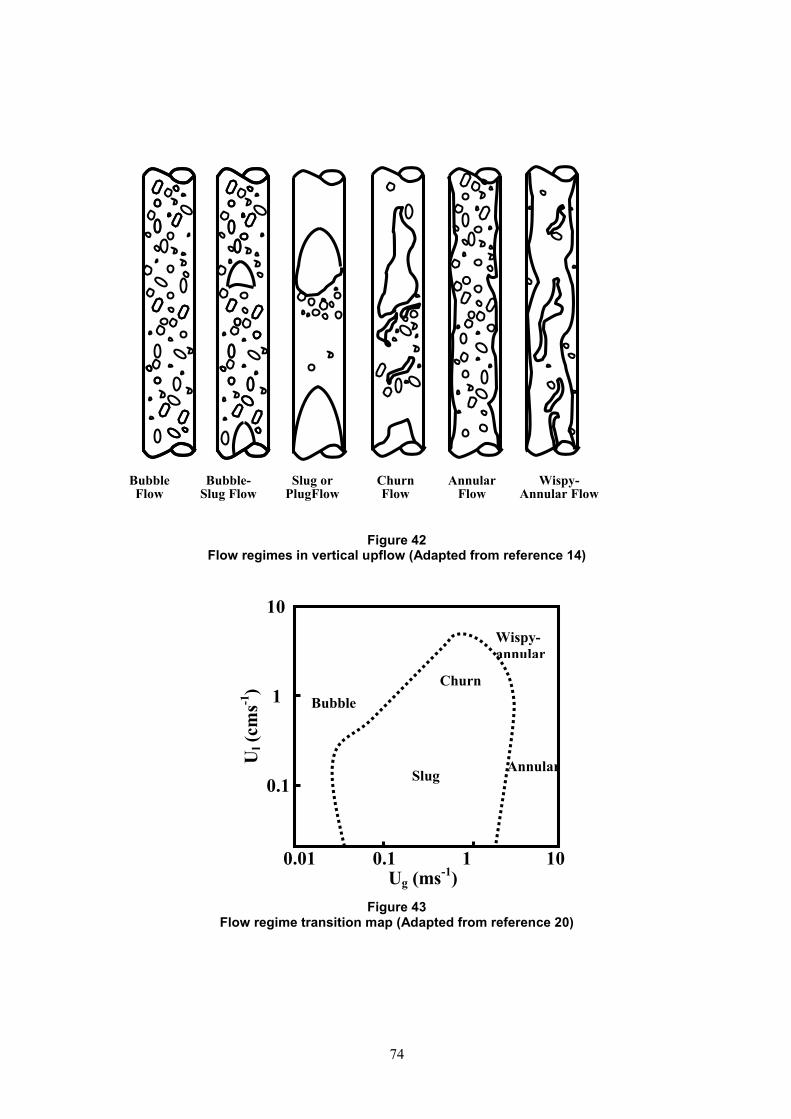
Bubble Bubble- Slug or Churn Annular Wispy-Flow Slug Flow PlugFlow Flow Flow Annular Flow
Figure 42Flow regimes in vertical upflow (Adapted from reference 14)
10
1
0.1
Churn Bubble
Wispy-annular
Annular Slug
0.01 0.1 1 10 Ug (ms-1)
Figure 43Flow regime transition map (Adapted from reference 20)
Ul (
cms-1
)
74

Figure 44 Three-phase slug flow model
(Reprinted from reference 25, Copyright 1993, with permission from Elsevier Science)
Figure 45 Pressure drop and types of slurry flow
(Reprinted from reference 27, with permission)
75

4.5
4
3.5
3
2.5
2
1.5
1
0.5
0
-0.5
Time (s)
Figure 46. Comparison of venting of pure water and water + glass systems.
(Beyer and Steinbach9, reprinted with permission)
0 10 20 30 40 50 60 70 80 90
pure H2O
With Solids
76

APPENDIX B
B.1. CONSISTENCY DATA FOR DEPRESSURISATION OF SUPERHEATED WATER ON THE 1 LITRE SCALE
The consistency of data is discussed in section 7.1. The graphs below, figures 47 and 48, show the pressure and temperature profiles during depressurisation for 12 selected identical replicate tests, each run on the small scale, 1 litre reactor, using a 5 mm nozzle and a 200 rpm stir rate. All the profiles are very similar up to a time of ~10 seconds. After this there is some variation with runs 2 and 4 and 1 and 3 agreeing well with each other but showing an unexplained deviation from the other tests. Associated with this variation in pressure against time profile was a significant difference in the liquid carryover to the catch tank. Partly for this reason, more studies than initially planned were made using the 10 litre reactor. The results from this were more reproducible.
1
2
3
4
5
6 Run 2 Run 3 Run 1 Run 4 Run 5 Run 6 Run 16 Run 17 Run 20 Run 31 Run 32 Run 33
Pres
sure
(bar
a)
0 5 10 15 20 25 30 35 Time (s)
Figure 47 Pressure profiles for identical pure water tests
1 litre reactor, 700 ml charge, 5 mm nozzle, 200 rpm stirring
77

78
0 5 10 15 20 25 30 35100
110
120
130
140
150
160
Tem
pera
ture
(°C
)
Time (s)
Run 2Run 3Run 1Run 4Run 5Run 6Run 16Run 17Run 20Run 31Run 32Run 33
0 60 120 1801
2
3
4
5
6
Pres
sure
(bar
a)
Time (s)
LSW05LSW42LSW01LSW02LSW03
Figure 48 Temperature profiles for identical pure water tests
1 litre reactor, 700 ml charge, 5 mm nozzle, 200 rpm stirring B.2. CONSISTENCY DATA FOR DEPRESSURISATION OF SUPERHEATED WATER ON THE 10 LITRE SCALE Figures 49 and 50 show the respective pressure and temperature profiles for five replicate tests involving the depressurisation of 7000ml of water from the 10 litre reactor vessel. It can clearly be seen that the tests show much more repeatable depressurisation profiles.
Figure 49 Pressure profiles for identical pure water tests
10 litre reactor, 7000 ml charge, 5 mm nozzle, 200 rpm stirring

Tem
pera
ture
(°C
)
160
150
140
130
120
110
100
LSW05 LSW42 LSW01 LSW02 LSW03
0 60 120 180 Time (s)
Figure 50Temperature profiles for identical pure water tests
10 litre reactor, 7000 ml charge, 5 mm nozzle, 200 rpm stirring
79

80

APPENDIX C
C.1. TEST CONDITIONS FOR HALF FACTORIAL EXPERIMENTAL DESIGN
Table 21 shows test conditions for the half factorial design on the 10 litre scale
Table 21 Individual test conditions for half factorial experimental design on 10 litre scale
Standard Solid Solid Nozzle Void Stir speed Glycerol test fraction diameter
number (% w/w) (µm)1 0 4-45 2 16 4-45 3 0 250-425 4 16 250-425 5 0 4-45 6 16 4-45 7 0 250-425 8 16 250-425 9 0 4-45 10 16 4-45 11 0 250-425 12 16 250-425 13 0 4-45 14 16 4-45 15 0 250-425 16 16 250-425 17 0 4-45 18 16 4-45 19 0 250-425 20 16 250-425 21 0 4-45 22 16 4-45 23 0 250-425 24 16 250-425 25 0 4-45 26 16 4-45 27 0 250-425 28 16 250-425 29 0 4-45 30 16 4-45 31 0 250-425 32 16 250-425 33 8 70-110 34 8 70-110 35 8 70-110 36 0 4-45 37 0 4-45 38 16 250-425
fraction diameter fraction (rpm) (% w/w) (mm) 0.3 50 0 5 0.3 50 0 9 0.3 50 0 9 0.3 50 0 5 0.1 50 0 9 0.1 50 0 5 0.1 50 0 5 0.1 50 0 9 0.3 550 0 9 0.3 550 0 5 0.3 550 0 5 0.3 550 0 9 0.1 550 0 5 0.1 550 0 9 0.1 550 0 9 0.1 550 0 5 0.3 50 25 9 0.3 50 25 5 0.3 50 25 5 0.3 50 25 9 0.1 50 25 5 0.1 50 25 9 0.1 50 25 9 0.1 50 25 5 0.3 550 25 5 0.3 550 25 9 0.3 550 25 9 0.3 550 25 5 0.1 550 25 9 0.1 550 25 5 0.1 550 25 5 0.1 550 25 9 0.2 140 12.5 7 0.2 140 12.5 7 0.2 140 12.5 7 0.3 550 0 9 0.1 50 0 9 0.1 550 0 5
81

82

APPENDIX D
D.1 ANALYSIS OF FACTORIAL EXPERIMENTS (NON REACTING) ON 1 LITRE SCALE
D.1.1 Factorial experiments using 2 mm nozzle
The overall and incremental times taken for the pressure to fall to 4.8, 4.6, 4.4, 4.2, 4.0, 3.0, and 2.0 bara and the overall time to reach a temperature of 101°C, in each test have been analysed using the Design Expert software. Early in the depressurisation, down to 4.2 bara, fill level and stir speed both had statistically significant effects on the time taken to reach the specific pressure. The fill level was the only factor that had a statistically significant effect on blowdown times beyond this. Throughout depressurisation, the time increased with increasing fill level. This would obviously be expected. Additionally, in the early stages (to 4.2 bara) the time increased with increasing stir speed. This may be due in part to vortex formation though the vessel was baffled to minimise this.
Because of the obvious differences due to changing the fill level, the above responses were normalised with respect to pure water tests at the same fill level. This should allow direct comparison of tests at 500 and 900 ml fill levels. At pressures down to 4.0 bara, the stir speed and the fill level both had statistically significant effects on the “normalised” blowdown times. Down to 4.6 bara, the stir speed had the greater effect, and below this the fill level had the greater effect. The “normalised” blowdown times were all increased by both increasing stir speed and fill level.
There were no statistically significant effects on the “normalised” blowdown times to 3.0 and 2.0 bara, however, the fill level had an effect on the “normalised” overall blowdown time to 101°C. Increasing the fill level increased the “normalised” blowdown time.
Interactions between factors are indicated by the combination of letters, e.g. AB is the interaction of A and B (fill level and stir speed)
83
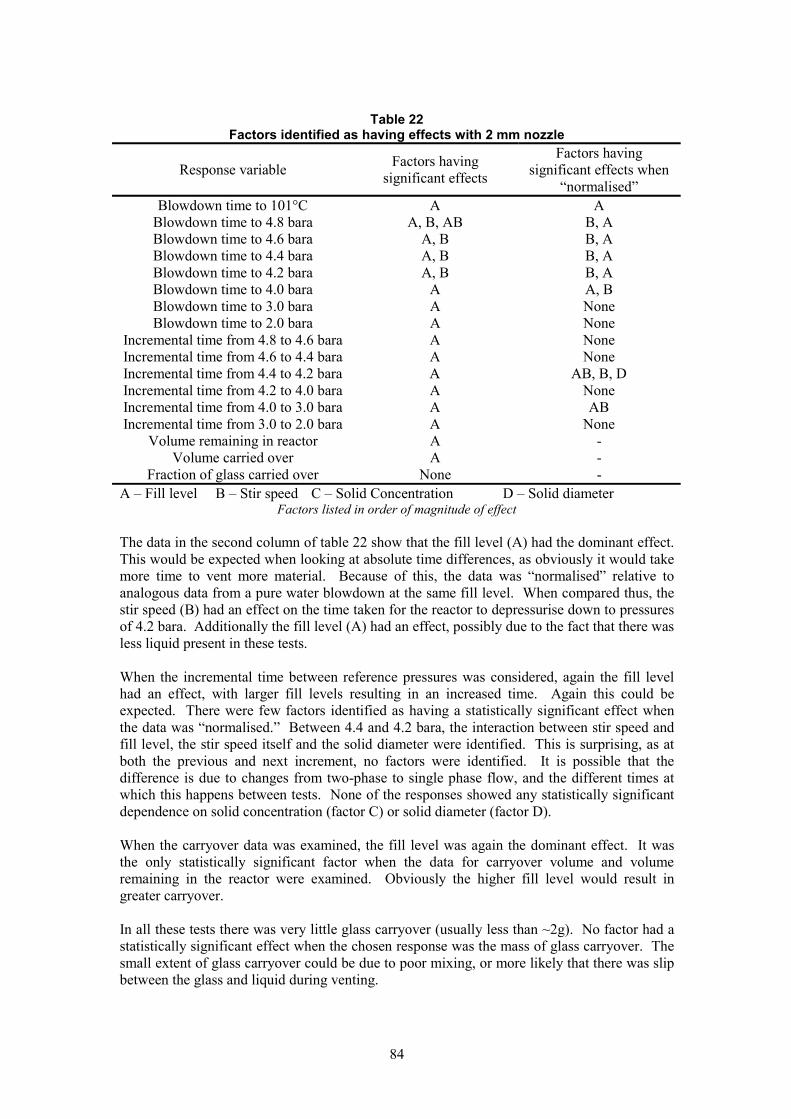
Table 22 Factors identified as having effects with 2 mm nozzle
Factors having Factors having Response variable significant effects significant effects when
“normalised” Blowdown time to 101°C A A
Blowdown time to 4.8 bara A, B, AB B, A Blowdown time to 4.6 bara A, B B, A Blowdown time to 4.4 bara A, B B, A Blowdown time to 4.2 bara A, B B, A Blowdown time to 4.0 bara A A, B Blowdown time to 3.0 bara A None Blowdown time to 2.0 bara A None
Incremental time from 4.8 to 4.6 bara A None Incremental time from 4.6 to 4.4 bara A None Incremental time from 4.4 to 4.2 bara A AB, B, D Incremental time from 4.2 to 4.0 bara A None Incremental time from 4.0 to 3.0 bara A AB Incremental time from 3.0 to 2.0 bara A None
Volume remaining in reactor A -Volume carried over A -
Fraction of glass carried over None -A – Fill level B – Stir speed C – Solid Concentration D – Solid diameter
Factors listed in order of magnitude of effect
The data in the second column of table 22 show that the fill level (A) had the dominant effect. This would be expected when looking at absolute time differences, as obviously it would take more time to vent more material. Because of this, the data was “normalised” relative to analogous data from a pure water blowdown at the same fill level. When compared thus, the stir speed (B) had an effect on the time taken for the reactor to depressurise down to pressures of 4.2 bara. Additionally the fill level (A) had an effect, possibly due to the fact that there was less liquid present in these tests.
When the incremental time between reference pressures was considered, again the fill level had an effect, with larger fill levels resulting in an increased time. Again this could be expected. There were few factors identified as having a statistically significant effect when the data was “normalised.” Between 4.4 and 4.2 bara, the interaction between stir speed and fill level, the stir speed itself and the solid diameter were identified. This is surprising, as at both the previous and next increment, no factors were identified. It is possible that the difference is due to changes from two-phase to single phase flow, and the different times at which this happens between tests. None of the responses showed any statistically significant dependence on solid concentration (factor C) or solid diameter (factor D).
When the carryover data was examined, the fill level was again the dominant effect. It was the only statistically significant factor when the data for carryover volume and volume remaining in the reactor were examined. Obviously the higher fill level would result in greater carryover.
In all these tests there was very little glass carryover (usually less than ~2g). No factor had a statistically significant effect when the chosen response was the mass of glass carryover. The small extent of glass carryover could be due to poor mixing, or more likely that there was slip between the glass and liquid during venting.
84

D.1.2 Factorial experiments using 5 mm nozzle
A similar series of tests as with the 2 mm nozzle was carried out using the larger 5 mm nozzle. Several modifications were made before the testing commenced. A second impeller was installed higher on the stirrer shaft and the mixing efficiency was examined visually using a glass reactor that was essentially geometrically similar and of the same volume. As the mixing was better, the stir speed for the factorial points was reduced. Additionally, more twophase blowdown tests were carried out for the “normalised” data. At each stir speed, as well as each fill level, four tests were carried out.
Table 23 gives the effect data obtained using the Design Expert software. It also shows that the fill level had the dominant effect on the depressurisation profile. For the time to the series of pressures indicated, fill level was the only factor identified as having a statistically significant effect. As would be expected, the higher fill levels took a longer time to depressurise.
The “normalised” data indicates that no factor had a statistically significant effect at pressures down to 4.8 bara, or indeed on the overall blowdown time. For the “normalised” time taken to reach 4.6, 4.4, 4.2 and 3 bara, the fill level, the interaction of solid concentration and solid diameter and the solid diameter were identified as having an effect. Strangely, at the intermediate, 4 bar, only the fill level had an effect. This suggests that there may be some change around this pressure, possibly the change from two/three phase to single phase flow. The effects of the factors are the same in each case: the time increases with increasing fill level and reduces with increasing solid diameter. At low solid concentration, the diameter had little effect, but at higher concentrations the smaller diameter gave a longer time and the larger diameter gave a shorter time. At 2 bara, the statistically significant factors were identified as the fill level and the interaction of solid diameter and concentration.
When the incremental times are examined, again the fill level had a statistically significant effect. With the exceptions of the incremental times from 4 to 3 bara and 3 to 2 bara, fill level was the only significant factor. There were no factors identified as having a significant effect on the time taken to depressurise from 4 to 3 bara. Between 3 and 2 bara, the fill level, the solid concentration and the interaction between stir speed and concentration were identified as having effects. The incremental time increased with the fill level and decreased with increasing solids concentration. The latter may be due to the composition within the reactor vessel: with a higher concentration of glass, there is a smaller volume available for the saturated water/vapour mixture, and therefore less will be vented. The data for the interaction of concentration with stir speed shows that there is little difference in the effect on incremental depressurisation time of the high stir rate, but that the effect is much greater at the low stir speed. At the low stir speed, the time is significantly greater at the low concentration than at the high concentration. At the high stir speed the concentration has much less effect, and the time is only slightly longer at the lower concentration.
The “normalised” data are of more relevance and show that there were no factors identified as having statistically significant effects on the incremental blowdown times, except between 3 and 2 bara, where the fill level and solid concentration had effects. Again, the time increased with increasing fill level and decreased with increasing solid concentration. As before this may be due to the increased solid volume decreasing the volume available for the liquid and vapour.
The solid concentration had the only significant effect on the volume remaining in the reactor. The higher concentration resulted in a smaller volume being left in the reactor following venting. The carryover from the reactor vessel was obviously affected by the fill level, and a larger volume was carried over at a higher fill level. In this series of tests, there was no factor
85

identified as having a statistically significant effect on the fraction of solids carried over from the reactor.
Table 23 Factors identified as having effects with 5 mm nozzle
Factors having significant Factors having significant Response variable effects effects when
“normalised” Blowdown time to 101°C
Blowdown time to 4.8 bara Blowdown time to 4.6 bara Blowdown time to 4.4 bara Blowdown time to 4.2 bara Blowdown time to 4.0 bara Blowdown time to 3.0 bara Blowdown time to 2.0 bara
Incremental time from 4.8 to 4.6 bara
Incremental time from 4.6 to 4.4 bara
Incremental time from 4.4 to 4.2 bara
Incremental time from 4.2 to 4.0 bara
Incremental time from 4.0 to 3.0 bara
Incremental time from 3.0 to 2.0 bara
Volume remaining in reactor Volume carried over
A A A A A A A A
A
A
A
A
None
A, C, BC
C A
None
None None
A, CD, D A, CD, D A, CD, D
A A, CD, D
A, CD
None
None
None
None
None
A, C
Fraction of glass carried over A – Fill level B – Stir speed C – Solid Concentration D – Solid diameter
Factors listed in order of magnitude of effect
D.2 ANALYSIS OF FACTORIAL EXPERIMENTS (NON REACTING) ON 10 LITRE SCALE
D.2.1 Factorial Experiments
On the large scale, a slightly different approach was taken. Nozzle diameter and glycerol concentration were included in the experimental design and the low solid concentration was taken as no solids. In this way, some factors will have an effect on the depressurisation, however, the interest is in the presence of the solids, and whether there is any statistically significant effect of solids in combination with the other variables. The response variables have been changed in that the incremental times have been taken over a smaller pressure range than in the small scale factorial tests. Table 24 gives the factors having statistically significant effects on the different response variables. The individual effects are discussed in the following sections. It is interesting to note that there was no effect on any of the response variables due to the solid diameter (factor B) or the glycerol fraction (factor E). This suggests that the viscosity and density difference between the water and water/glycerol mixtures had no effect whatsoever on any of the response variables for the range of conditions studied.
86

Table 24 Factors having effects on selected response variables
Response variable Blowdown time from 4.9-4.8 bara Blowdown time from 4.8-4.7 bara Blowdown time from 4.7-4.6 bara Blowdown time from 4.6-4.5 bara Blowdown time from 4.5-4.4 bara Blowdown time from 4.4-4.3 bara Blowdown time from 4.3-4.2 bara Blowdown time from 4.2-4.1 bara Blowdown time from 4.1-4.0 bara Blowdown time from 4.0-3.8 bara Blowdown time from 3.8-3.6 bara Blowdown time from 3.6-3.4 bara Blowdown time from 3.4-3.2 bara Blowdown time from 3.2-3.0 bara Blowdown time from 3.0-2.5 bara Blowdown time from 2.5-2.0 bara Blowdown time from 2.0-1.5 bara
Factors having significant effects C, D, CD, F C, F, D, CF C, F, CF C, F, CF F, C, CF, A F, C, CF, A F, C, CF, A F, C, CF, A F, C, CF, A F, C, CF, A F, C, CF, A F, C, CF, A F, C, A, CF F, C, CF, A F, C F F
Volume in reactor F, D, C Volume carryover None A – Solid concentration B – Solid diameter C – Fill level D – Stir speed E – glycerol concentration F – Nozzle diameter
Factors listed in order of magnitude of effect
D.2.2 Effects of particle concentration (A)
The solid concentration has a statistically significant effect on the incremental time to depressurise between the ranges of 4.5-4.4 bara and 3.2-3.0 bara. In each case, the effect is the same, that the low concentration of solids (i.e. no solids) results in a slightly longer blowdown time. The higher concentration of solids therefore promotes slightly quicker venting. It should be remembered that these tests were carried out with fixed total volumes so that adding a volume of solid to the liquid means that there is a corresponding decrease in liquid volume. Figures 51 and 52 give the effects plots for the two increments: and the very small magnitude of the effects on the blowdown times can be clearly seen.
87

Effect Graph
DESIGN-EXPERT Plot 3.0
Actual blowdown time 4.5-4.4 bara 2.6
2.2
1.8
1.4
1.0
0.5
A- A+
Solid fraction
Figure 51 Design Expert effect plot of time to depressurise 4.5 to 4.4 bara.
Effect Graph
DESIGN-EXPERT Plot 7.0
Actual blowdown time 3.2-3.0 bara 6.1
5.2
4.3
3.4
2.5
1.6
A- A+
Solid fraction
Figure 52 Design Expert effect plot of time to depressurise 3.2 to 3.0 bara.
88

D.2.3 Effects of particle size (B)
The particle diameter was not identified as having any statistically significant effects on any of the response variables studied.
D.2.4 Effects of fill level (C)
The fill level had an effect on the depressurisation down to a pressure of ~2.5 bara. A higher fill level increased the time taken for the incremental pressure drops. In the early stages, down to ~4.5 bara, the fill level was the dominant effect on the incremental times.
The fill level was also involved in interactions with the stirring rate and the nozzle diameter. The interaction with stirring rate only occurred in the step from 4.9-4.8 bara. The effect is indicated in figure 53. At the lower stir rate (D-), there is only a slight increase in incremental time when the fill level is increased (from C- to C+), but at the higher rate (D+), the increase in time is much greater when the fill level is increased.
Interaction Graph
DESIGN-EXPERT Plot 5.1
Actual blowdown time from4.9-4.8 4.3
3.5
2.7
1.9
1.1
0.3 D-
D-D+
D+
C- C+
Interaction of C:fill level and D:stir rate
Figure 53 Design Expert interaction plot of fill level and stir rate on time to depressurise from 4.9
to 4.8 bara.
The interaction of fill level with nozzle diameter occurred for all the increment times between 4.8 and 3 bara. The effect is similar at each increment, and figure 54 gives a typical interaction graph. The effect of the increasing fill level (C) was to increase the time for the incremental depressurisation for all nozzle sizes. This is more pronounced with small nozzle sizes.
89

Interaction Graph
DESIGN-EXPERT Plot 3.0
Actual blowdown time 4.5-4.4 bara 2.6
1.8
2.2
1.4
1.0
0.6
F-
F-
F+
F+
C- C+
Interaction of C:fill level and F:Nozzle dia
Figure 52 Design Expert interaction plot of fill level and nozzle diameter on time to depressurise
from 4.5 to 4.4 bara.
The fill level had an effect on the volume remaining in the reactor following blowdown, and the higher fill level resulted in a larger volume in the reactor.
D.2.5 Effects of stirring rate (D)
Table 24 shows that the stirring rate had a statistically significant effect on the depressurisation early in the blowdown (to ~4.7 bara). The higher stirring rate increased the time taken for the depressurisation. This may be due to the higher stir speed breaking up the bubbles and creating a more homogeneous mixture in the reactor vessel or could be a consequence of vortex formation.
The stir speed also had a statistically significant effect on the volume remaining in the reactor. The increased stir rate reduced the volume remaining in the reactor.
D.2.6 Effects of glycerol addition (E)
The addition of glycerol was not identified as having a statistically significant effect on any of the response variables studied.
D.2.7 Effects of nozzle size (F)
The nozzle diameter would be expected to have a significant effect on the depressurisation behaviour, and this can be seen from table 24. It is interesting to note that nozzle diameter was not the most dominant effect until a pressure of 4.5 bara was reached. Of course a larger
90

nozzle resulted in a quicker depressurisation, and a shorter incremental time between fixed pressures. Towards the end of the blowdown, when a single phase could be expected, nozzle diameter was the only factor identified as having a statistically significant effect.
The nozzle diameter also had an effect on the volume remaining in the reactor. The larger diameter resulted in a lower volume, and therefore more carryover from the reactor. This would be expected due to the much higher superficial velocity of the vapour.
91

Printed and published by the Health and Safety ExecutiveC30 1/98
Printed and published by the Health and Safety Executive C1.25 08/03

ISBN 0-7176-2699-7
RR 085
9 78071 7 626991£25.00