research report 075 - hse.gov.uk · prepared by burgoyne consultants ltd for the health and safety...
TRANSCRIPT
HSE Health & Safety
Executive
Measurement of limiting oxygen concentration in sewage sludge drying plants
Prepared by Burgoyne Consultants Ltd for the Health and Safety Executive 2003
RESEARCH REPORT 075

HSE Health & Safety
Executive
Measurement of limiting oxygen concentration in sewage sludge drying plants
P Chapman HNC (chemistry),A Dickens MA Eng, MSc, MIChemE,
N Gibson PhD, DIC, BSc, FinstP andR Littlejohn HND (Chemistry)
Burgoyne Consultants Limited Chantry Drive
Ilkley West Yorkshire
LS29 9HU
Inert gas is used to prevent dust explosions in sewage drying plants.
This study is concerned with establishing a suitable method for the determination of Limiting Oxygen Concentration (LOC), determining the effect of elevated temperature on LOC and the efficiency of nitrogen, steam and carbon dioxide in reducing oxygen to prevent dust explosions. The possibility of controlling combustion in bulk material by the use of inert gas is also investigated. It is concluded that, with nitrogen, a reduced oxygen level of about 6% (v/v) will control both the dust cloud explosion and smouldering powder risks.
This report and the work it describes were funded by the HSE. Its contents, including any opinions and/or conclusions expressed, are those of the authors alone and do not necessarily reflect HSE policy.
HSE BOOKS
© Crown copyright 2003
First published 2003
ISBN 0 7176 2620 2
All rights reserved. No part of this publication may bereproduced, stored in a retrieval system, or transmitted inany form or by any means (electronic, mechanical,photocopying, recording or otherwise) without the priorwritten permission of the copyright owner.
Applications for reproduction should be made in writing to: Licensing Division, Her Majesty's Stationery Office, St Clements House, 2-16 Colegate, Norwich NR3 1BQ or by e-mail to [email protected]
ii

CONTENTS PAGE NO.
1. INTRODUCTION 11.1 Origin of Samples used in Study 11.2 Sample Storage Conditions 11.3 Preparation of Test Samples / Particle Size / Moisture Content 1
2. STAGE 1: ESTABLISHMENT OF TEST METHOD FORDETERMINATION OF LIMITING OXYGEN CONCENTRATION 4
2.1 Comparison of LOC Values Obtained Using 1m3 and20 Litre Test Apparatus 4
2.2 Influence of Ignition Source Energy on LOC of Sewage SludgeDetermined in 20 Litre Sphere 7
2.3 Conclusion / Recommendation for Test Method 8
3. STAGE 2: EFFECT OF ELEVATED TEMPERATURES ONLIMITING OXYGEN CONCENTRATION 10
3.1 Experimental Method 103.2 Data 113.3 Discussion of Results 123.4 Barrow Sample 123.5 Workington Sample 133.6 Conclusions 14
4. STAGE 3: COMPARISON OF LIMITING OXYGEN CONTENTWITH NITROGEN, STEAM AND CARBON DIOXIDE 16
4.1 Experimental Method 164.2 Samples 174.3 Results 174.4 Comparison of LOC Values Obtained with Nitrogen, Steam
and Carbon Dioxide 174.5 Conclusion 19
5. STAGE 4: LIMITING OXYGEN CONTENT TO PREVENTSMOULDERING COMBUSTION 20
5.1 Sample Tested 205.2 Powder Layer Ignition Temperature Test 215.3 Aerated Cell Test 225.4 Dewar Tests 24
6. OVERALL CONCLUSIONS 26
REFERENCES 27
iii

FIGURES 1 - 5
APPENDIX 1 - DATA SHEETS FOR LOC TESTS ON WHAT FLOUR AND CORN STARCH
APPENDIX 2 - DATA SHEETS FOR LOC TESTS ON SEWAGE SLUDGE IN 20L SPHERE
APPENDIX 3 - DATA SHEETS FOR EFFECT OF TEMPERATURE ON LOC
APPENDIX 4 - DATA FOR LOC WITH STEAM
APPENDIX 5 - DATA FOR LOC WITH CARBON DIOXIDE
APPENDIX 6 - POWDER LAYER IGNITION TEMPERATURE DATA
APPENDIX 7 - AERATED CELL IGNITION TEMPERATURE DATA
APPENDIX 8 - DEWAR TEST IGNITION TEMPERATURE DATA
iv

EXECUTIVE SUMMARY
Incidents in sewage sludge drying plants have been attributed to explosions resulting from the ignition of sewage sludge powder dispersed in the atmosphere and / or fires caused by the ignition and combustion of powder layers in the plants.
These hazards can be controlled by the use of inert gas to reduce the oxygen in the plant to below the level at which flame can propagate through dust clouds and combustion in powder layers be sustained.
To enable inert gas requirements to be more precisely defined, work has been carried out to establish a method for determining the Limited Oxygen Concentration (LOC) for dust clouds of sewage sludge, to determine the effect of elevated temperature on LOC, and the efficiency of nitrogen, steam and carbon dioxide in reducing oxygen to prevent dust explosions. In addition consideration has been given to the possibility of controlling combustion in layer and bulk material by the use of inert gas.
A method for determining LOC of sewage sludge has been developed based on the Kuhner 20 litre sphere and using a 2kJ chemical ignition source.
Tests on sewage samples fromNorth West Barrowand Workington waste water treatment plants have shown that, although their LOC / Temperature relationships differ, the LOC up to the maximum temperature present in the dryers can be calculated to within 1% in LOC from measurements made at ambient temperatures.
The LOC / temperature relationships for the Barrow and Workington samples tested differed significantly. In particular non-linearity occurred with the Workington sample when the temperature exceeded 125 º C. This indicates the importance of testing representative samples for a given site and not relying on generic data. It may also be necessary to consider seasonal variations for a site, given the nature of the feed stock to sewage treatment works.
When nitrogen is used to inert a dryer, it has been found that a reduction in oxygen level to about 6% (v/v) should control both dust cloud ignition and powder layer combustion.
The test methods and data produced in this study can from the basis for guidance to industry on the determination of LOC and prescription of safe operating conditions.
v

vi

1. INTRODUCTION
Incidents in sewage sludge drying plants have been attributed to explosions resulting from the ignition of sewage sludge powder dispensed in the atmosphere and / or fires caused by the ignition and combustion of powder layers in the plants. These hazards can be controlled by the use of inert gas to reduce the oxygen in the plant to below the level at which flame can propagate through dust clouds and combustion in powder layers be sustained.
To enable inert gas requirements to be more precisely defined, the Health and Safety Executive commissioned research by Burgoyne Consultants Ltd. into the measurement of Limiting Oxygen Concentration (LOC) of sewage sludge.
The research project is divided into four stages:
Stage 1 the establishment of a suitable test method for the determination of LOC.
Stage 2 the effect of elevated temperatures on LOC.
Stage 3 comparison of LOC with nitrogen, steam and carbon dioxide.
Stage 4 determination of the LOC required to prevent smouldering combustion.
This report details the experimental work, and discusses the relevance of the data to the prescription of inert gas conditions to control both the dust explosion and smouldering combustion hazards.
1.1 Origin of Samples used in Study
Samples of sewage sludge pellets were obtained from North West Water Barrow waste water treatment works and from North West Water Workington waste water treatment works.
1.2 Sample Storage Conditions
The samples in pellet form were stored in bulk, in a continually nitrogen purged metal drum. After milling the resulting powder was stored in nitrogen flushed containers at approximately 4ºC.
1.3 Preparation of Test Samples / Particle Size / Moisture Content
Particle size distribution has a marked effect on the sensitivity to ignition and combustion properties of dust clouds and powder layers.
A European standard (1) on the measurement of LOC is being prepared by CENT/TC305/WG1. The draft standard requires the dust tested to be representative of that in the process or to have passed a 63 µm sieve. Sweiss
1

and Sinclair (5) have determined the effect of particle size on LOC in Hartmann Bomb for diphenyol propane (Bisphenol A), benzoic acid, rice (white), citric acid (all dried at 75ºC) and naphthalene (undried). The ignition source was a train of electric sparks and the inert gas was nitrogen. They concluded that below 100 µm the LOC becomes almost constant but that a level of fine dust as low as 5% in coarse dusts is sufficient to reduce the LOC values severely.
The pellets were milled through a 500 µm sleeve and a sieve analysis was carried out. See Tables 1 and 2.
Table 1 Sieve analysis of milled Barrow sewage sludge
Sieve Size (µm) Weight on Sieve (g) % by Weight
>2000 0.4 0.1
>1000 0.4 0.1
>500 2.6 0.7
>250 44.7 11.2
>125 90.9 22.8
>90 40.2 10.1
>63 58.0 14.5
>38 107.3 26.9
Receiver 54.1 13.6
Median particle size 63 - 90µm
Table 2 Sieve analysis of milled Workington sewage sludge
Sieve Size (µm) Weight on Sieve (g) % by Weight
>2000 0.4 0.1
>1000 0.1 0.0
>500 0.8 0.3
>250 23.7 7.8
>125 74.4 24.6
>90 39.7 13.1
>63 32.2 10.6
>38 68.9 22.7
Receiver 62.7 20.7
Median particle size 63 - 90µm
2

On the basis of this data, samples for test were milled and passed through a 250µm sieve to produce a median particle size of 63-90µm.
The moisture content of the sewage sludge was determined by milling and passing it through a 250µm sieve and weighing the material before and after drying to a constant weight. See Table 3 and 4.
Table 3 Moisture content of milled Barrow sewage sludge
Sample A Sample B
Weight of Sample (g) 5.165 5.585
Dry weight of sample (1) 4.831 5.221
Dry weigh of sample (2) 4.831 5.221
Average Moisture = 6.5% w/w
Table 4 Moisture content of milled Workington sewage sludge
Sample A Sample B
Weight of Sample (g) 4.246 5.807
Dry weight of sample (1) 3.996 5.464
Dry weigh of sample (2) 3.996 5.464
Average Moisture = 5.9% w/w
The Barrow sample had a moisture content of 6.5% (w/w) and the Workington 5.9% (w/w).
The LOC values were determined using samples with the above moisture contents. Samples were not dried prior to testing.
3
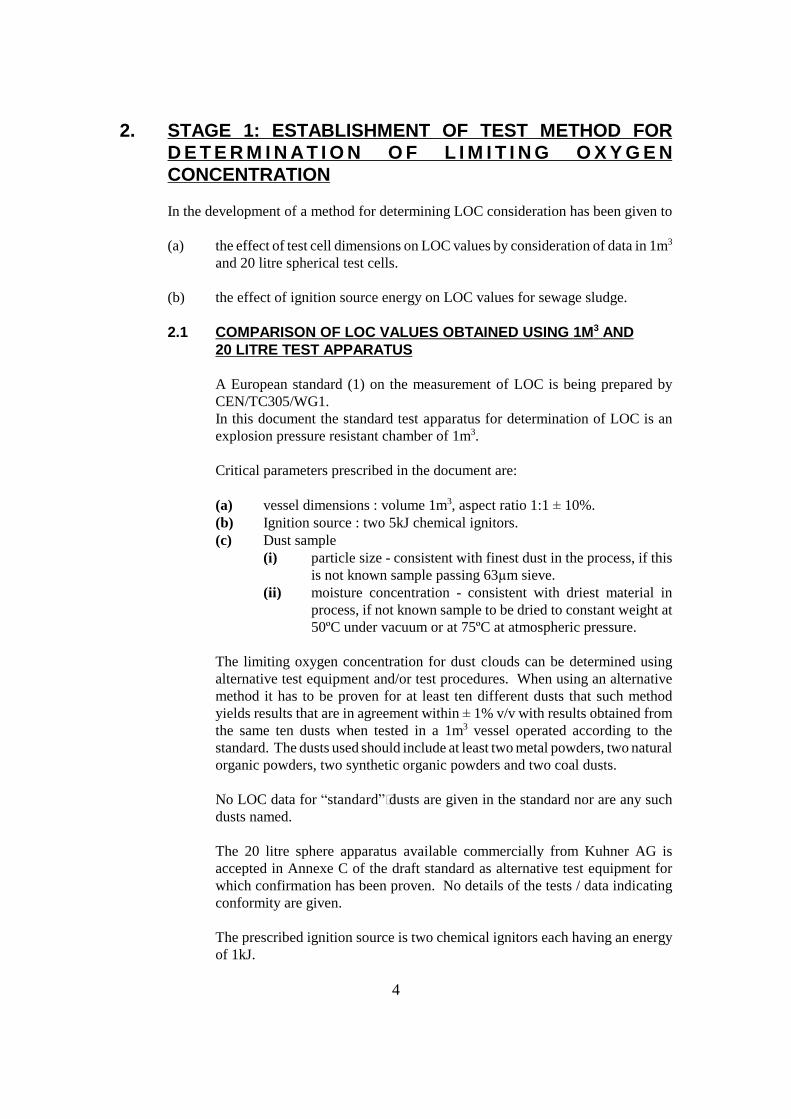
2. STAGE 1: ESTABLISHMENT OF TEST METHOD FOR D E T E R M I N A T I O N O F L I M I T I N G O X Y G E N CONCENTRATION
In the development of a method for determining LOC consideration has been given to
(a) the effect of test cell dimensions on LOC values by consideration of data in 1m3
and 20 litre spherical test cells.
(b) the effect of ignition source energy on LOC values for sewage sludge.
2.1 COMPARISON OF LOC VALUES OBTAINED USING 1M3 AND 20 LITRE TEST APPARATUS
A European standard (1) on the measurement of LOC is being prepared by CEN/TC305/WG1. In this document the standard test apparatus for determination of LOC is an explosion pressure resistant chamber of 1m3.
Critical parameters prescribed in the document are:
(a) vessel dimensions : volume 1m3, aspect ratio 1:1 ± 10%. (b) Ignition source : two 5kJ chemical ignitors. (c) Dust sample
(i) particle size - consistent with finest dust in the process, if this is not known sample passing 63µm sieve.
(ii) moisture concentration - consistent with driest material in process, if not known sample to be dried to constant weight at 50ºC under vacuum or at 75ºC at atmospheric pressure.
The limiting oxygen concentration for dust clouds can be determined using alternative test equipment and/or test procedures. When using an alternative method it has to be proven for at least ten different dusts that such method yields results that are in agreement within ± 1% v/v with results obtained from the same ten dusts when tested in a 1m3 vessel operated according to the standard. The dusts used should include at least two metal powders, two natural organic powders, two synthetic organic powders and two coal dusts.
No LOC data for “standard” dusts are given in the standard nor are any such dusts named.
The 20 litre sphere apparatus available commercially from Kuhner AG is accepted in Annexe C of the draft standard as alternative test equipment for which confirmation has been proven. No details of the tests / data indicating conformity are given.
The prescribed ignition source is two chemical ignitors each having an energy of 1kJ.
4
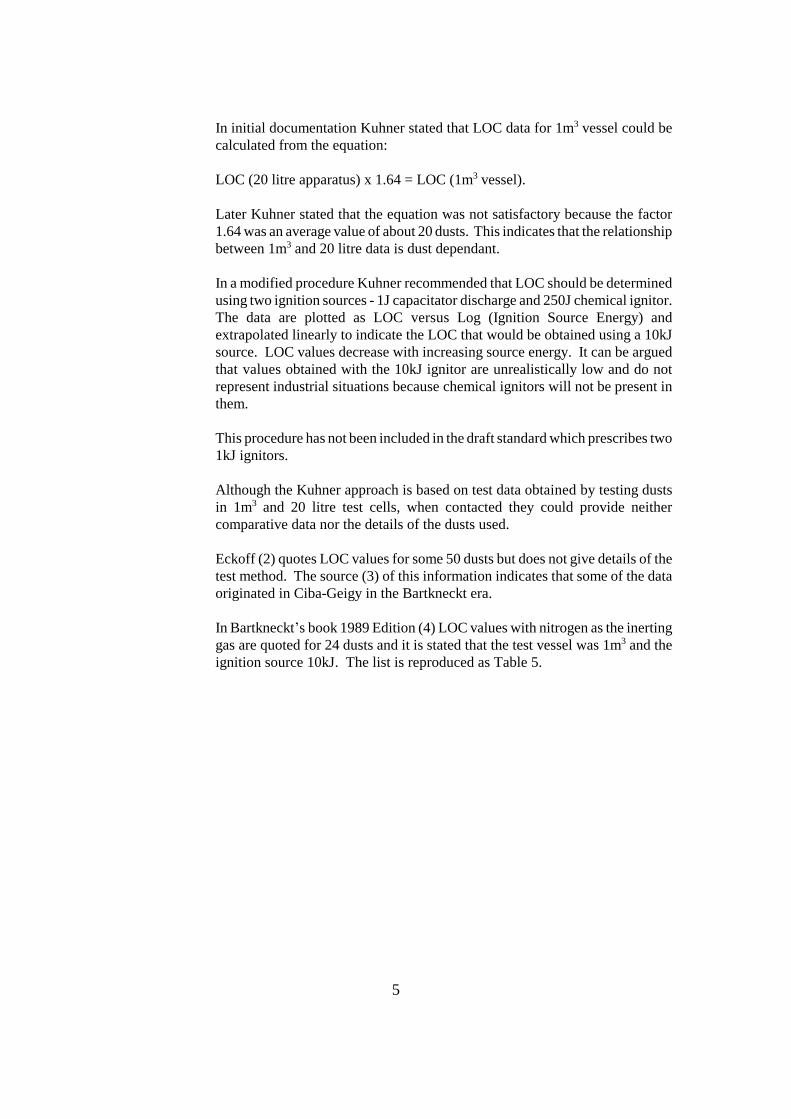
In initial documentation Kuhner stated that LOC data for 1m3 vessel could be calculated from the equation:
LOC (20 litre apparatus) x 1.64 = LOC (1m3 vessel).
Later Kuhner stated that the equation was not satisfactory because the factor 1.64 was an average value of about 20 dusts. This indicates that the relationship between 1m3 and 20 litre data is dust dependant.
In a modified procedure Kuhner recommended that LOC should be determined using two ignition sources - 1J capacitator discharge and 250J chemical ignitor. The data are plotted as LOC versus Log (Ignition Source Energy) and extrapolated linearly to indicate the LOC that would be obtained using a 10kJ source. LOC values decrease with increasing source energy. It can be argued that values obtained with the 10kJ ignitor are unrealistically low and do not represent industrial situations because chemical ignitors will not be present in them.
This procedure has not been included in the draft standard which prescribes two 1kJ ignitors.
Although the Kuhner approach is based on test data obtained by testing dusts in 1m3 and 20 litre test cells, when contacted they could provide neither comparative data nor the details of the dusts used.
Eckoff (2) quotes LOC values for some 50 dusts but does not give details of the test method. The source (3) of this information indicates that some of the data originated in Ciba-Geigy in the Bartkneckt era.
In Bartkneckt’s book 1989 Edition (4) LOC values with nitrogen as the inerting gas are quoted for 24 dusts and it is stated that the test vessel was 1m3 and the ignition source 10kJ. The list is reproduced as Table 5.
5
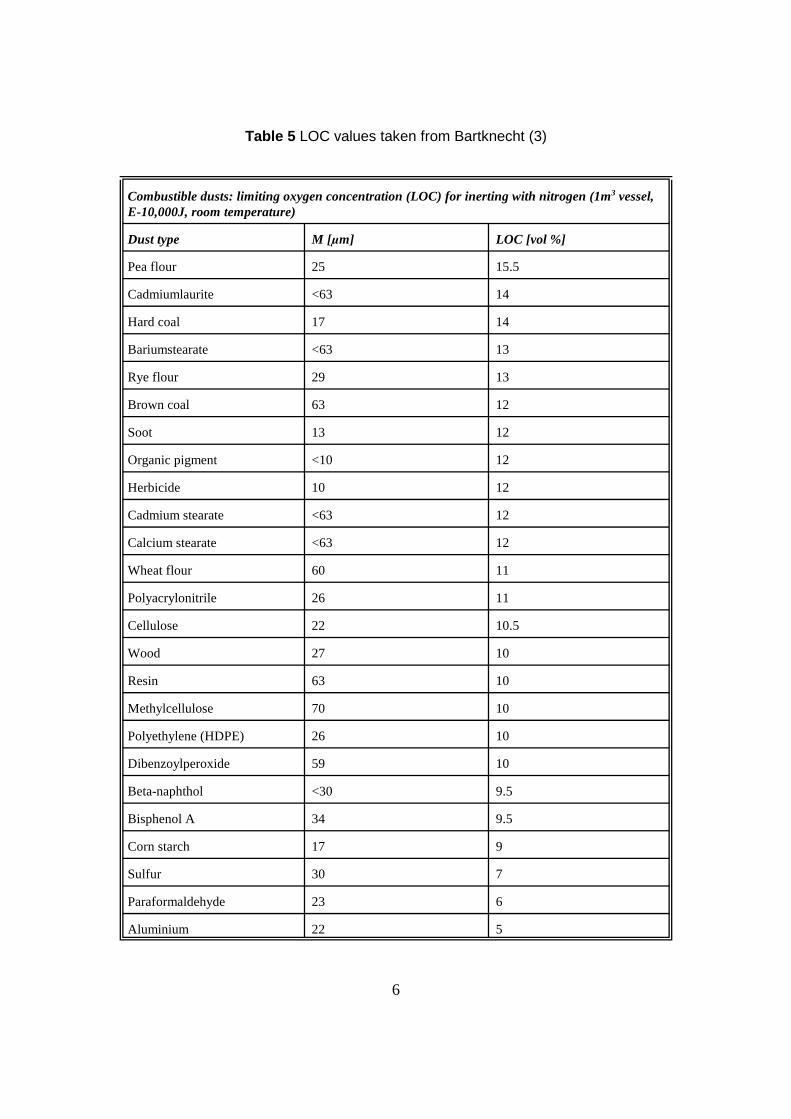
Table 5 LOC values taken from Bartknecht (3)
Combustible dusts: limiting oxygen concentration (LOC) for inerting with nitrogen (1m3 vessel, E-10,000J, room temperature)
Dust type M [µm] LOC [vol %]
Pea flour 25 15.5
Cadmiumlaurite <63 14
Hard coal 17 14
Bariumstearate <63 13
Rye flour 29 13
Brown coal 63 12
Soot 13 12
Organic pigment <10 12
Herbicide 10 12
Cadmium stearate <63 12
Calcium stearate <63 12
Wheat flour 60 11
Polyacrylonitrile 26 11
Cellulose 22 10.5
Wood 27 10
Resin 63 10
Methylcellulose 70 10
Polyethylene (HDPE) 26 10
Dibenzoylperoxide 59 10
Beta-naphthol <30 9.5
Bisphenol A 34 9.5
Corn starch 17 9
Sulfur 30 7
Paraformaldehyde 23 6
Aluminium 22 5
6
Samples of wheat flour and corn starch have been tested in the 20 litre sphere to obtain a comparison with the published 1m3 data.
2.1.1 Samples Wheat flour (a) Particle Size : (b) Moisture Content :
Corn starch (a) Particle Size : (b) Moisture Content :
2.1.2 Ignition Sources
less than 63µm 9.2% w/w
less than 38µm 8.7% w/w
The LOC of each dust was determined using chemical ignitors of energy 200J, 1kJ, 2kJ & 10kJ.
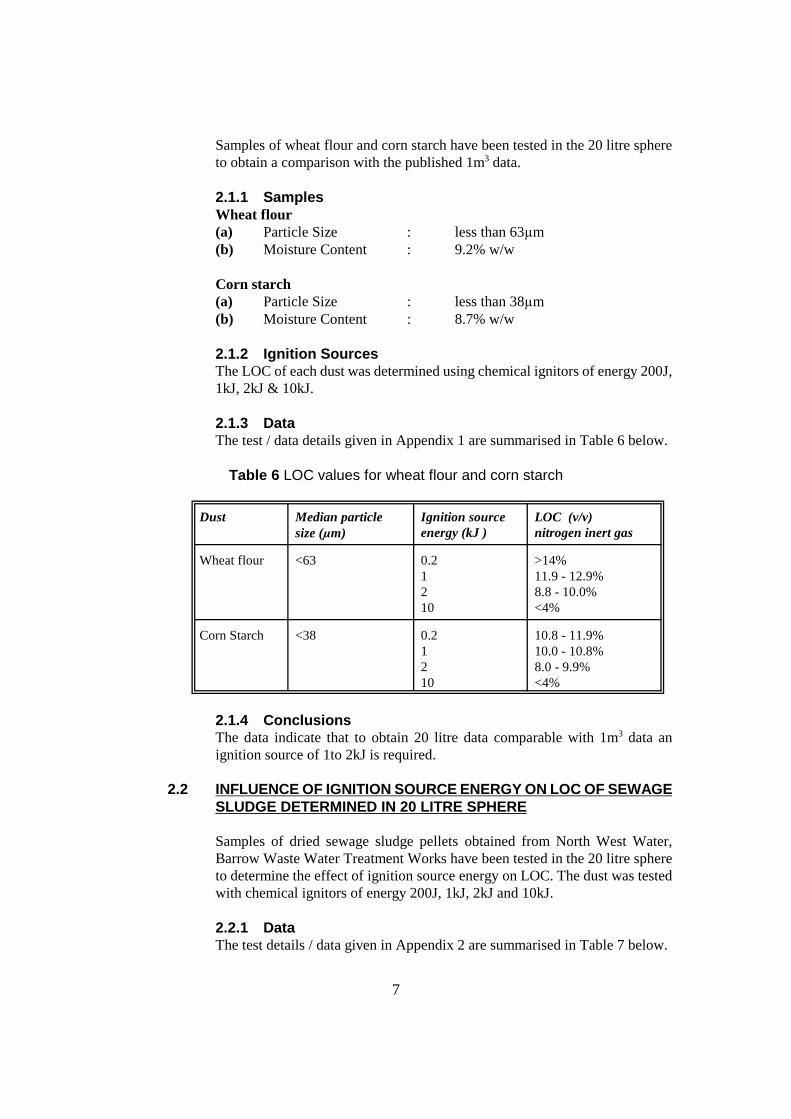
2.1.3 Data The test / data details given in Appendix 1 are summarised in Table 6 below.
Table 6 LOC values for wheat flour and corn starch
Dust Median particle Ignition source LOC (v/v) size (µm) energy (kJ ) nitrogen inert gas
Wheat flour <63 0.2 1 2 10
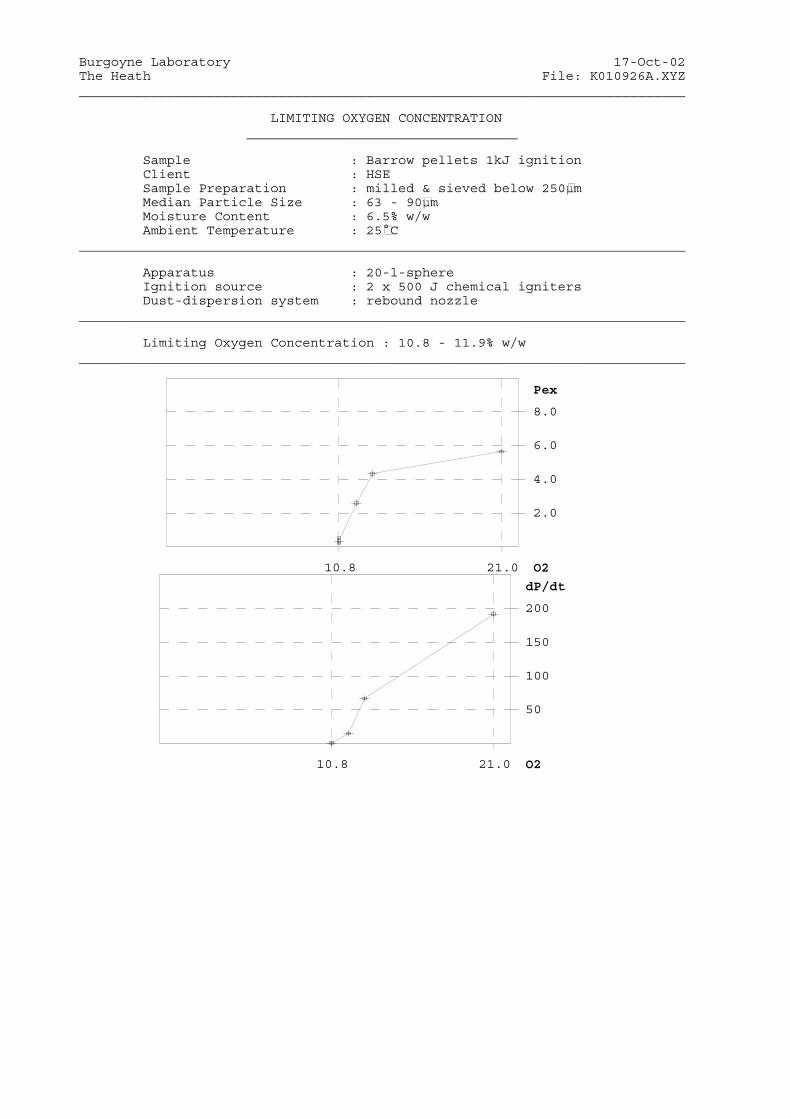
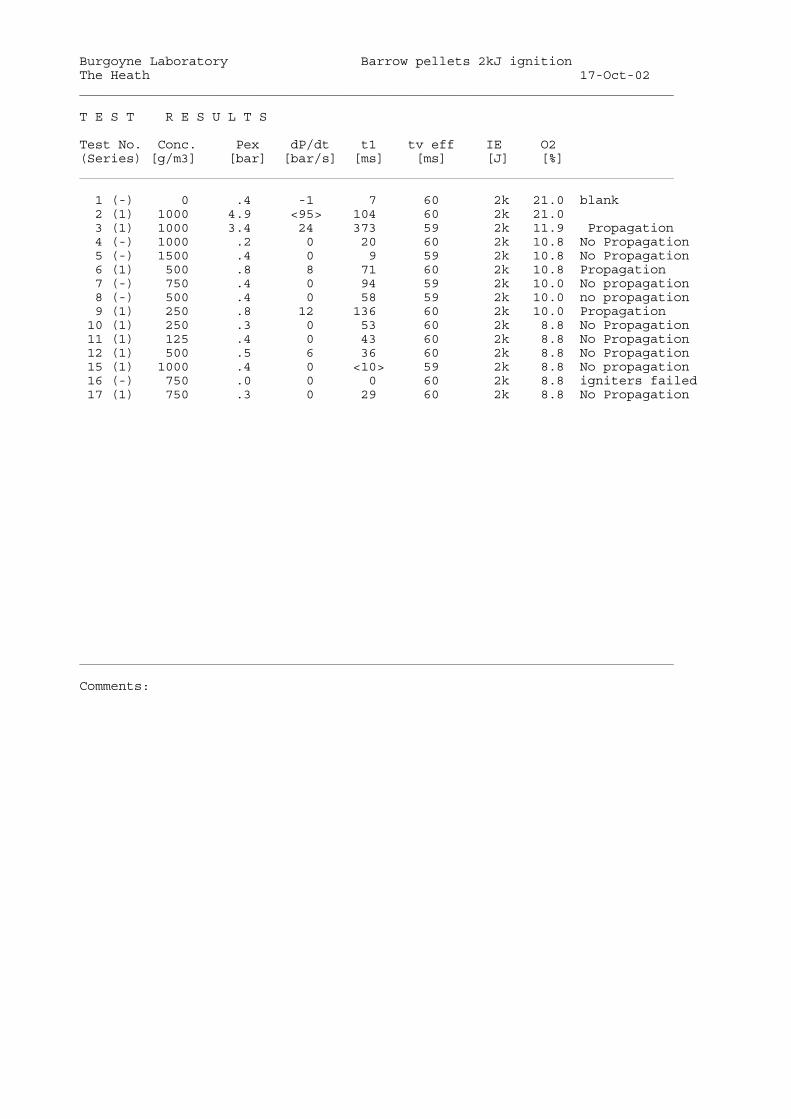
>14% 11.9 - 12.9% 8.8 - 10.0% <4%
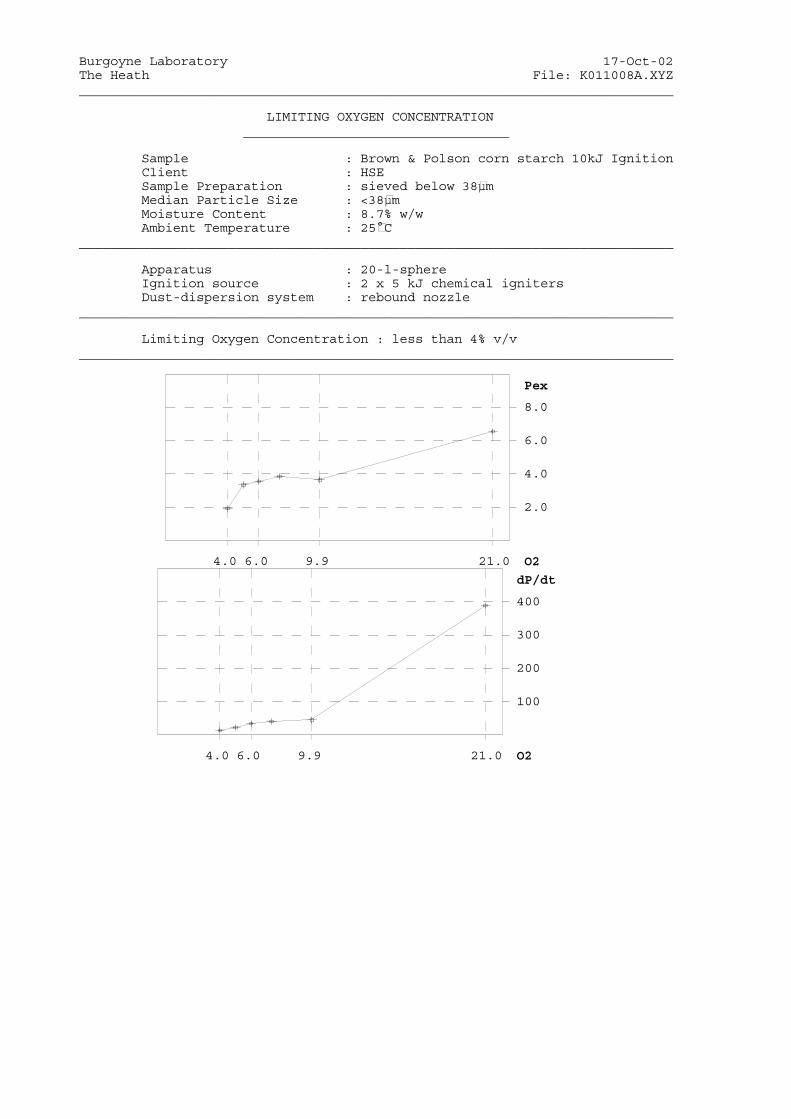
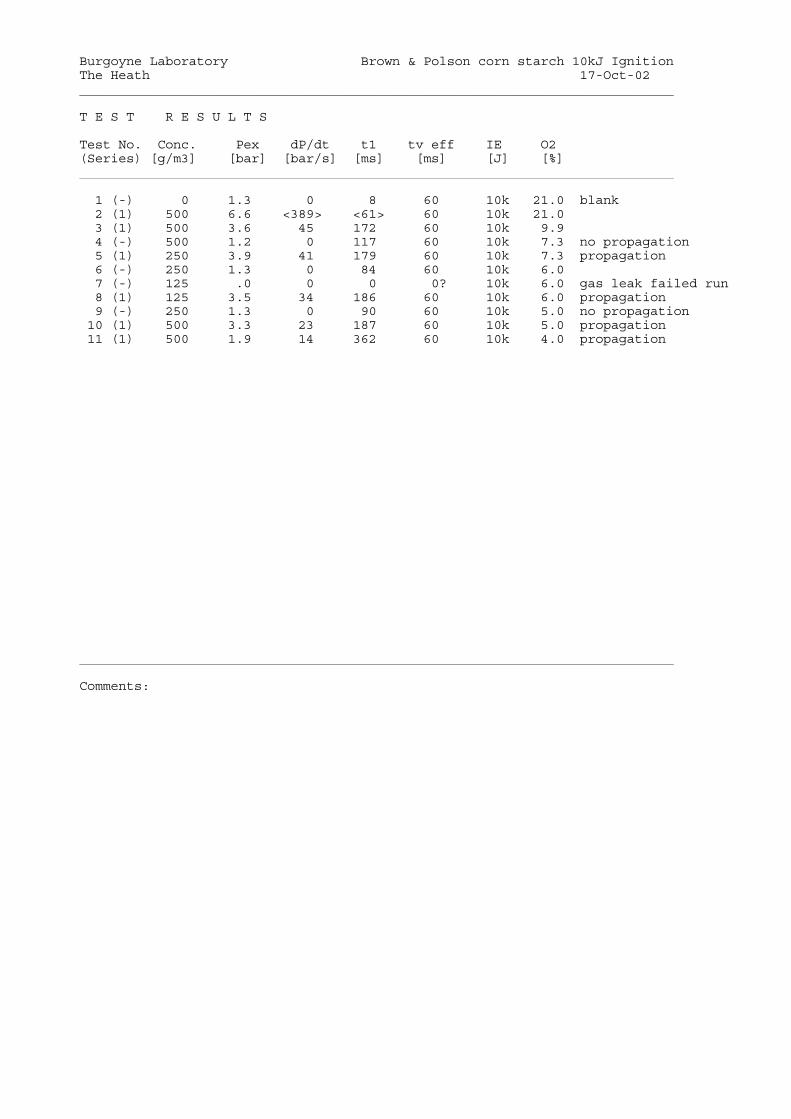
Corn Starch <38 0.2 1 2 10
10.8 - 11.9% 10.0 - 10.8% 8.0 - 9.9% <4%
2.1.4 Conclusions The data indicate that to obtain 20 litre data comparable with 1m3 data an ignition source of 1to 2kJ is required.
2.2 INFLUENCE OF IGNITION SOURCE ENERGY ON LOC OF SEWAGE SLUDGE DETERMINED IN 20 LITRE SPHERE
Samples of dried sewage sludge pellets obtained from North West Water, Barrow Waste Water Treatment Works have been tested in the 20 litre sphere to determine the effect of ignition source energy on LOC. The dust was tested with chemical ignitors of energy 200J, 1kJ, 2kJ and 10kJ.
2.2.1 Data The test details / data given in Appendix 2 are summarised in Table 7 below.
7
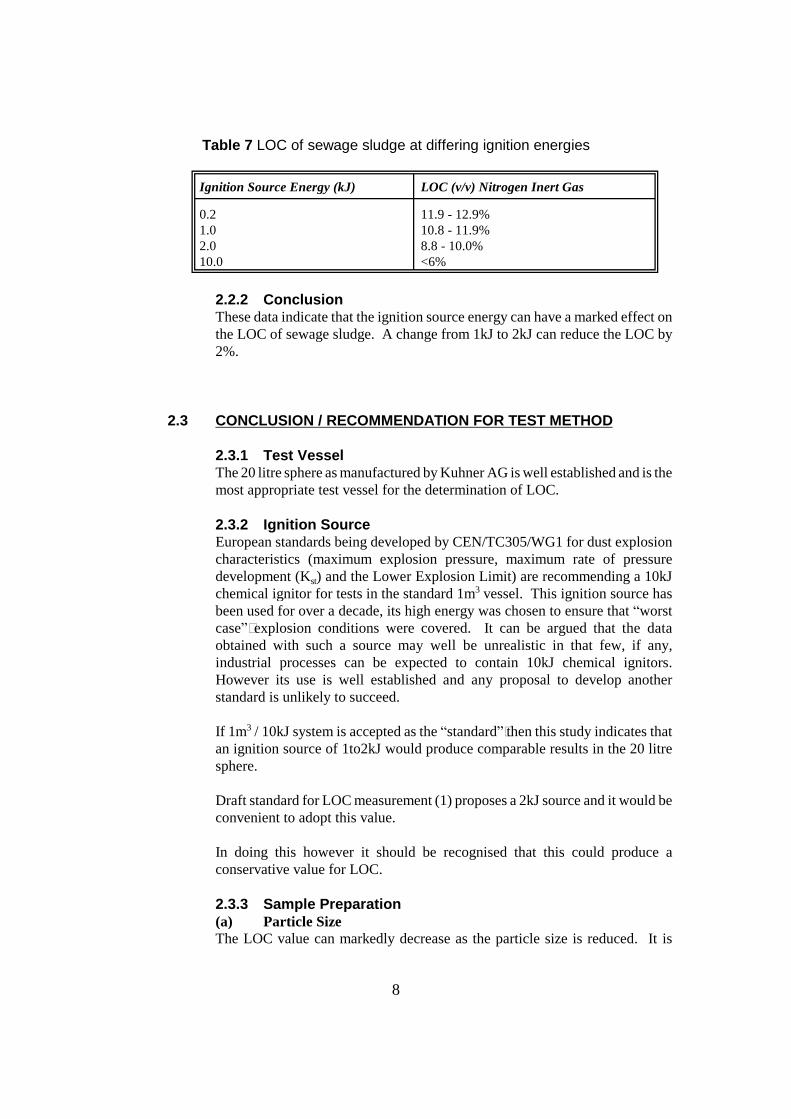
Table 7 LOC of sewage sludge at differing ignition energies
Ignition Source Energy (kJ) LOC (v/v) Nitrogen Inert Gas
0.2 11.9 - 12.9% 1.0 10.8 - 11.9% 2.0 8.8 - 10.0% 10.0 <6%
2.2.2 Conclusion These data indicate that the ignition source energy can have a marked effect on the LOC of sewage sludge. A change from 1kJ to 2kJ can reduce the LOC by 2%.
2.3 CONCLUSION / RECOMMENDATION FOR TEST METHOD
2.3.1 Test Vessel The 20 litre sphere as manufactured by Kuhner AG is well established and is the most appropriate test vessel for the determination of LOC.
2.3.2 Ignition Source European standards being developed by CEN/TC305/WG1 for dust explosion characteristics (maximum explosion pressure, maximum rate of pressure development (Kst) and the Lower Explosion Limit) are recommending a 10kJ chemical ignitor for tests in the standard 1m3 vessel. This ignition source has been used for over a decade, its high energy was chosen to ensure that “worst case” explosion conditions were covered. It can be argued that the data obtained with such a source may well be unrealistic in that few, if any, industrial processes can be expected to contain 10kJ chemical ignitors. However its use is well established and any proposal to develop another standard is unlikely to succeed.
If 1m3 / 10kJ system is accepted as the “standard” then this study indicates that an ignition source of 1to2kJ would produce comparable results in the 20 litre sphere.
Draft standard for LOC measurement (1) proposes a 2kJ source and it would be convenient to adopt this value.
In doing this however it should be recognised that this could produce a conservative value for LOC.
2.3.3 Sample Preparation (a) Particle Size The LOC value can markedly decrease as the particle size is reduced. It is
8

important that an unrealistic level of fineness should not be tested in order not to place too stringent requirements on the inert gas system.
The particle size of dried sewage sludge can vary significantly depending on the nature of the drying process. However our experience to date in assessing a number of such processes suggests a median particle size of 63-90µm is not unreasonable. Prior to testing samples should be milled and passed through a 250µm sieve to produce a median particle size 63-90µm.
(b) Sample Condition After samples have been taken from the process they should be stored in such a manner that their condition at test (e.g. moisture etc.) should be as that in the plant.
9

3. STAGE 2: EFFECT OF ELEVATED TEMPERATURES ON LIMITING OXYGEN CONCENTRATION
The LOC of materials decreases as temperature increases.
The maximum temperature achieved in many thermal sewage sludge dryers is around 125ºC. Tests have been carried out at 25ºC, 75ºC, 125ºC and 150ºC to enable the temperature dependence for sewage sludge to be established.
3.1 EXPERIMENTAL METHOD
The experimental method is based on 20 litre sphere modified to permit tests at the elevated temperatures and on the test procedure in the proposed European Standard (1).
3.1.1 Test Cell To enable the measurement of temperature in the cell to be made, the blank plug in the lid of the 20 litre vessel was removed and replaced with a series of 5 thermocouples set at different depths vertically through the volume. The thermocouples were attached to a data logging system and the temperatures monitored to establish a temperature profile throughout the vessel. Other modifications included lagging the main vessel and adding tape heating and lagging to the sample pot to minimise heat loss and aid the maintenance of a uniform temperature throughout the test cell.
3.1.2 Elevated Temperature Conditions The tests were carried out at nominal temperatures of 25ºC, 75ºC, 125ºC, 150ºC.
The test temperatures were monitored using a K type (chromel) thermocouples tracking across a vertical diameter of the sphere.
The temperature conditions are listed in Table 8 below.
Table 8 Temperature conditions
Nominal Measured Variation Temperature (ºC) Average Across Cell (ºC)
Temperature (ºC)
25 25 1 75 74 2 125 125 2 150 149 3
These data indicate that the average test temperatures in the test cell did not differ by more than 1ºC from the target temperatures. Temperature variation across the cell was small, increasing from 1ºC to 3ºC as the temperature level increased from 25ºC to 150ºC.
10
3.1.3 Ignition Sources The ignition source used in the main series of tests was a 2kJ chemical source. Additional tests were carried out with a 1kJ chemical source.
3.1.4 Test Sequence Testing was carried out in the following sequence. All testing was carried out using material that passed through a 250µm sieve. Before each series of tests a blank test with no sample and 21% oxygen was carried out. A single test was carried out at each concentration, unless there was any doubt over the result when a repeat was carried out. Five tests at various material concentrations using the oxygen concentration below that of the last concentration at which propagation was detected, were carried out.
3.2 DATA
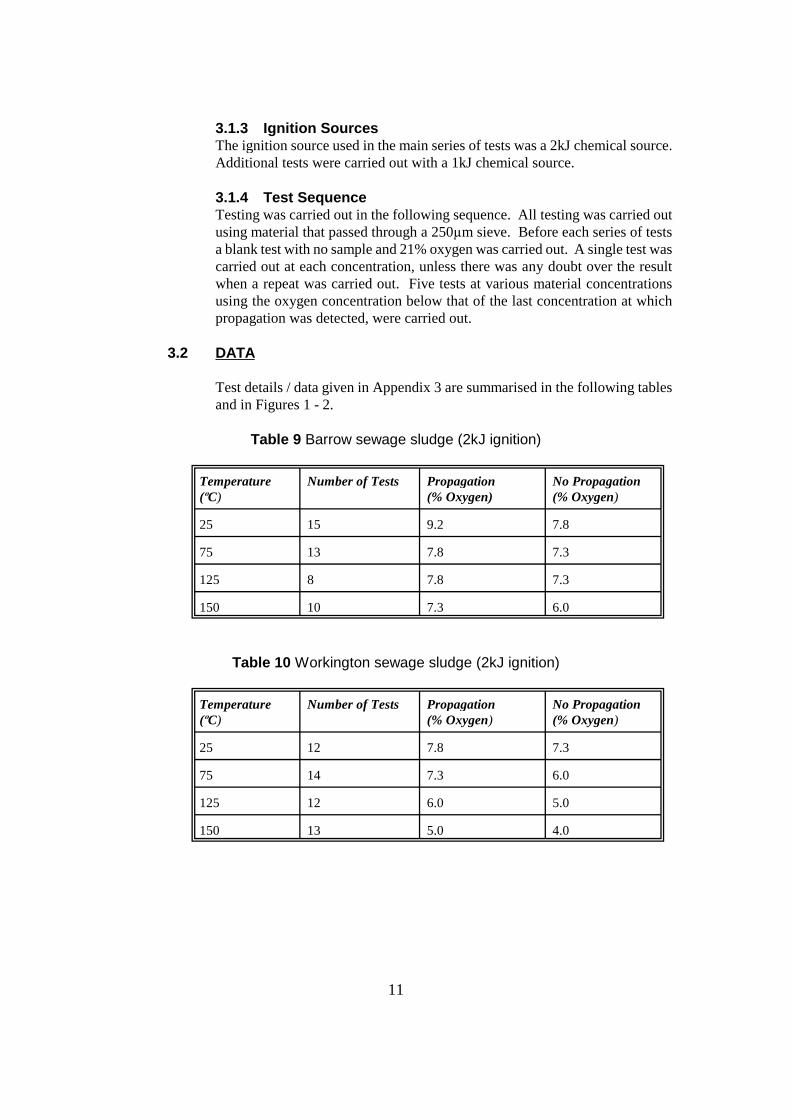
Test details / data given in Appendix 3 are summarised in the following tables and in Figures 1 - 2.
Table 9 Barrow sewage sludge (2kJ ignition)
Temperature (ºC)
Number of Tests Propagation (% Oxygen)
No Propagation (% Oxygen)
25 15 9.2 7.8
75 13 7.8 7.3
125 8 7.8 7.3
150 10 7.3 6.0
Table 10 Workington sewage sludge (2kJ ignition)
Temperature (ºC)
Number of Tests Propagation (% Oxygen)
No Propagation (% Oxygen)
25 12 7.8 7.3
75 14 7.3 6.0
125 12 6.0 5.0
150 13 5.0 4.0
11
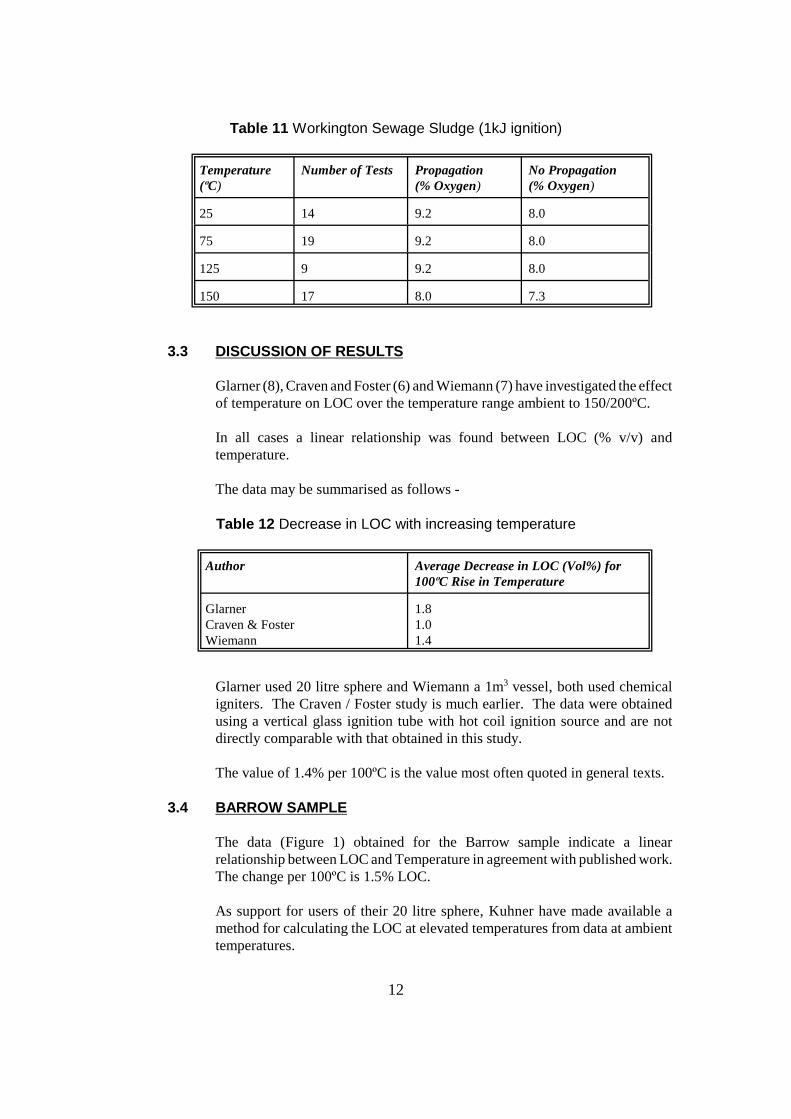
Table 11 Workington Sewage Sludge (1kJ ignition)
Temperature (ºC)
Number of Tests Propagation (% Oxygen)
No Propagation (% Oxygen)
25 14 9.2 8.0
75 19 9.2 8.0
125 9 9.2 8.0
150 17 8.0 7.3
3.3 DISCUSSION OF RESULTS
Glarner (8), Craven and Foster (6) and Wiemann (7) have investigated the effect of temperature on LOC over the temperature range ambient to 150/200ºC.
In all cases a linear relationship was found between LOC (% v/v) and temperature.
The data may be summarised as follows -
Table 12 Decrease in LOC with increasing temperature
Author Average Decrease in LOC (Vol%) for 100ºC Rise in Temperature
Glarner 1.8 Craven & Foster 1.0 Wiemann 1.4
Glarner used 20 litre sphere and Wiemann a 1m3 vessel, both used chemical igniters. The Craven / Foster study is much earlier. The data were obtained using a vertical glass ignition tube with hot coil ignition source and are not directly comparable with that obtained in this study.
The value of 1.4% per 100ºC is the value most often quoted in general texts.
3.4 BARROW SAMPLE
The data (Figure 1) obtained for the Barrow sample indicate a linear relationship between LOC and Temperature in agreement with published work. The change per 100ºC is 1.5% LOC.
As support for users of their 20 litre sphere, Kuhner have made available a method for calculating the LOC at elevated temperatures from data at ambient temperatures.
12
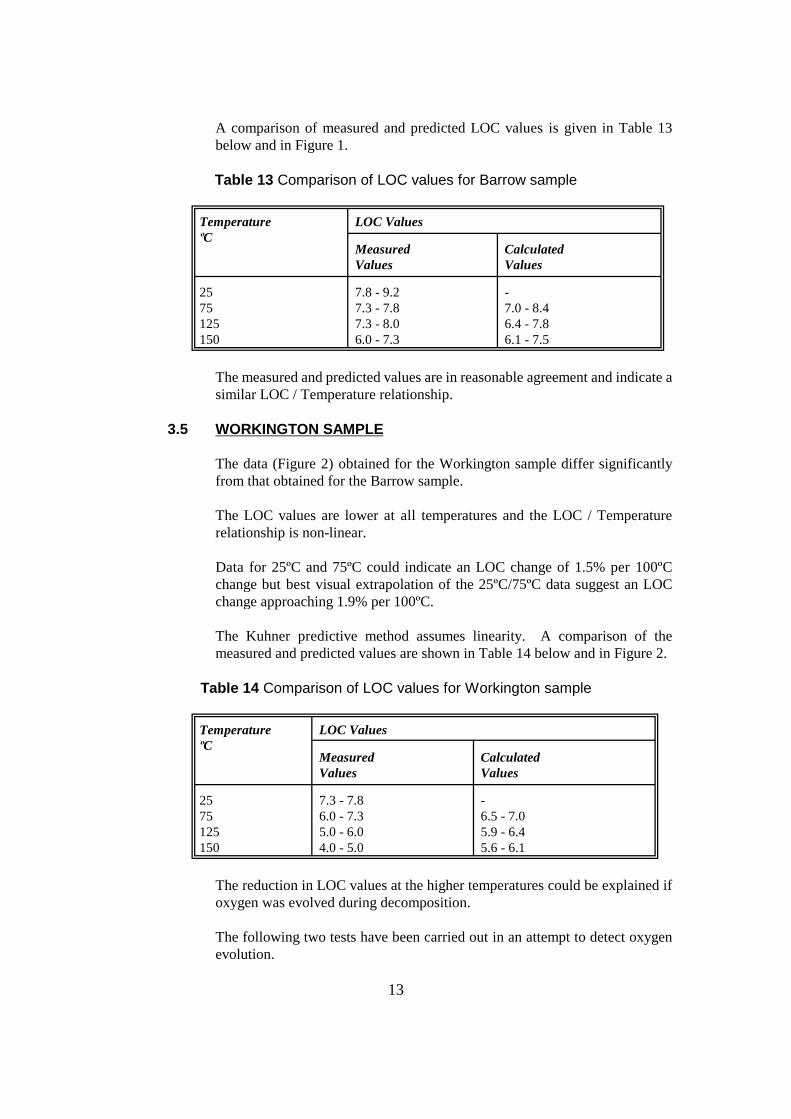
A comparison of measured and predicted LOC values is given in Table 13 below and in Figure 1.
Table 13 Comparison of LOC values for Barrow sample
Temperature LOC Values ºC
Measured Calculated Values Values
25 7.8 - 9.2 -75 7.3 - 7.8 7.0 - 8.4 125 7.3 - 8.0 6.4 - 7.8 150 6.0 - 7.3 6.1 - 7.5
The measured and predicted values are in reasonable agreement and indicate a similar LOC / Temperature relationship.
3.5 WORKINGTON SAMPLE
The data (Figure 2) obtained for the Workington sample differ significantly from that obtained for the Barrow sample.
The LOC values are lower at all temperatures and the LOC / Temperature relationship is non-linear.
Data for 25ºC and 75ºC could indicate an LOC change of 1.5% per 100ºC change but best visual extrapolation of the 25ºC/75ºC data suggest an LOC change approaching 1.9% per 100ºC.
The Kuhner predictive method assumes linearity. A comparison of the measured and predicted values are shown in Table 14 below and in Figure 2.
Table 14 Comparison of LOC values for Workington sample
Temperature LOC Values ºC
Measured Calculated Values Values
25 7.3 - 7.8 -75 6.0 - 7.3 6.5 - 7.0 125 5.0 - 6.0 5.9 - 6.4 150 4.0 - 5.0 5.6 - 6.1
The reduction in LOC values at the higher temperatures could be explained if oxygen was evolved during decomposition.
The following two tests have been carried out in an attempt to detect oxygen evolution.
13
(a) A one litre cylinder containing 500g of milled (<250µm) Workington sewage sludge was evacuated and heated to 150ºC, kept at constant temperature for over one hour. A small pressure rise was noted on the dial gauge. When the gaseous contents of the bomb were passed over the oxygen analyser there was no change in the read out, therefore no significant oxygen was produced.
(b) A second test was carried out using the Carius tube apparatus - 10g of milled (<250µm) Workington sewage sludge added to the tube, a T piece / valve had been added to the usual system close to the transducer to allow any gas produced to be passed over the oxygen analyser. The system was evacuated, and heated to 150ºC and kept at temperature in excess of one hour. A maximum pressure of 8psi was recorded, upon opening the valve to the oxygen analyser no change in the reading was noted.
The oxygen analyser can detect oxygen differences above 0.1 - 0.2%.
These tests did not indicate that oxygen had been evolved when the sewage temperature was increased.
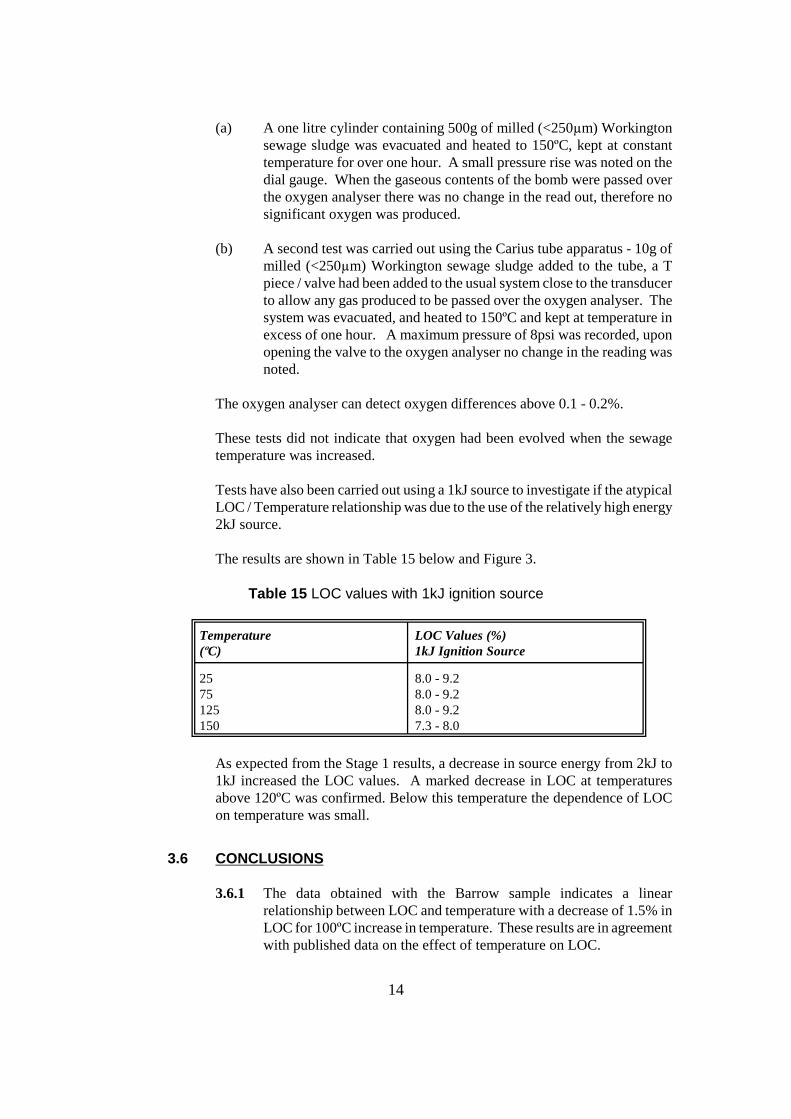
Tests have also been carried out using a 1kJ source to investigate if the atypical LOC / Temperature relationship was due to the use of the relatively high energy 2kJ source.
The results are shown in Table 15 below and Figure 3.
Table 15 LOC values with 1kJ ignition source
Temperature LOC Values (%) (ºC) 1kJ Ignition Source
25 8.0 - 9.2 75 8.0 - 9.2 125 8.0 - 9.2 150 7.3 - 8.0
As expected from the Stage 1 results, a decrease in source energy from 2kJ to 1kJ increased the LOC values. A marked decrease in LOC at temperatures above 120ºC was confirmed. Below this temperature the dependence of LOC on temperature was small.
3.6 CONCLUSIONS
3.6.1 The data obtained with the Barrow sample indicates a linear relationship between LOC and temperature with a decrease of 1.5% in LOC for 100ºC increase in temperature. These results are in agreement with published data on the effect of temperature on LOC.
14
3.6.2 The experimental data for the Barrow sample are in good agreement with values predicted by the Kuhner calculation method.
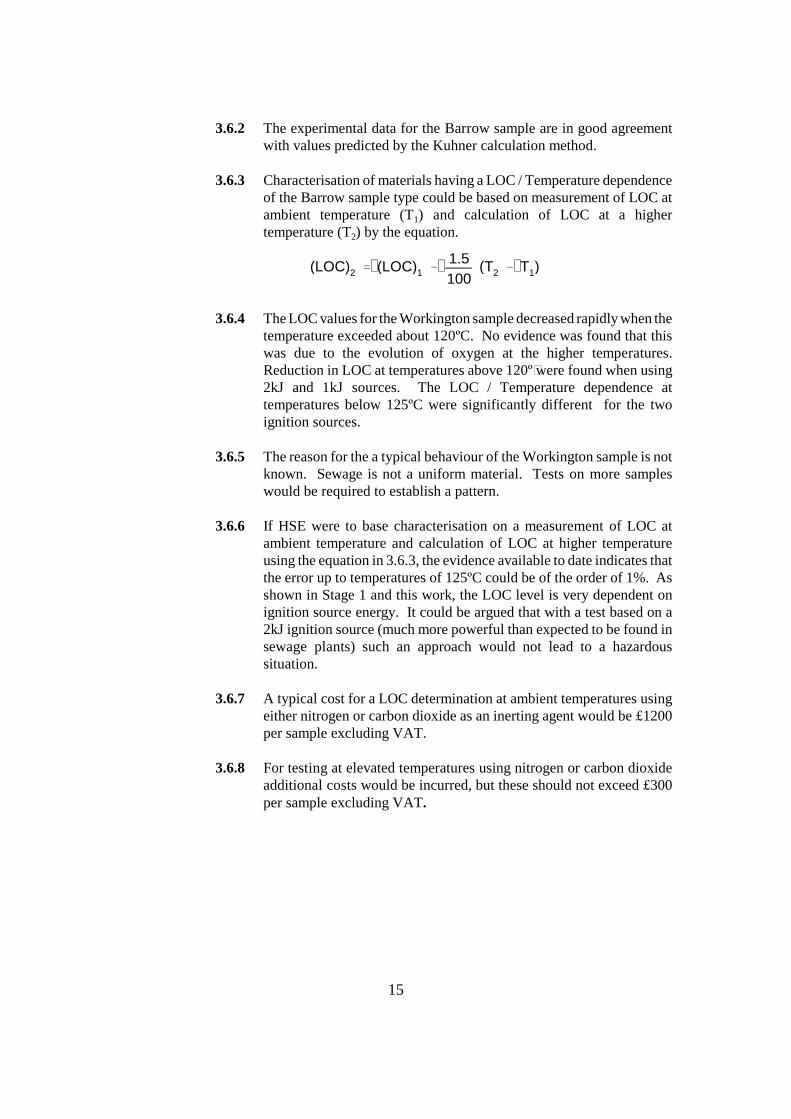
3.6.3 Characterisation of materials having a LOC / Temperature dependence of the Barrow sample type could be based on measurement of LOC at ambient temperature (T1) and calculation of LOC at a higher temperature (T2) by the equation.
(LOC)2 ' (LOC)1 & 1.5 (T2 & T1)100
3.6.4 The LOC values for the Workington sample decreased rapidly when the temperature exceeded about 120ºC. No evidence was found that this was due to the evolution of oxygen at the higher temperatures. Reduction in LOC at temperatures above 120º were found when using 2kJ and 1kJ sources. The LOC / Temperature dependence at temperatures below 125ºC were significantly different for the two ignition sources.
3.6.5 The reason for the a typical behaviour of the Workington sample is not known. Sewage is not a uniform material. Tests on more samples would be required to establish a pattern.
3.6.6 If HSE were to base characterisation on a measurement of LOC at ambient temperature and calculation of LOC at higher temperature using the equation in 3.6.3, the evidence available to date indicates that the error up to temperatures of 125ºC could be of the order of 1%. As shown in Stage 1 and this work, the LOC level is very dependent on ignition source energy. It could be argued that with a test based on a 2kJ ignition source (much more powerful than expected to be found in sewage plants) such an approach would not lead to a hazardous situation.
3.6.7 A typical cost for a LOC determination at ambient temperatures using either nitrogen or carbon dioxide as an inerting agent would be £1200 per sample excluding VAT.
3.6.8 For testing at elevated temperatures using nitrogen or carbon dioxide additional costs would be incurred, but these should not exceed £300 per sample excluding VAT.
15
4. STAGE 3: COMPARISON OF LIMITING OXYGEN CONTENT WITH NITROGEN, STEAM AND CARBON DIOXIDE
Inert atmospheres in sewage sludge dryers may be produced by the injection of nitrogen, steam or carbon dioxide.
To assess the relative efficiency of these in controlling ignition, the LOC valves have been determined using steam and carbon dioxide and the data compared with that obtained for nitrogen in Stage 1 (Section 3 of this report).
4.1 EXPERIMENTAL METHOD
The experimental method is based on the test equipment discussed in Section 2 and used in Section 3.
In summary:
4.1.1 Test Apparatus 20 litre sphere with all components, including powder sample pot, were heated and lagged to maintain uniform temperature throughout the system.
4.1.2 Test Temperature All tests carried out at 150ºC.
4.1.3 Ignition Source Ignition source is a 2kJ chemical ignition.
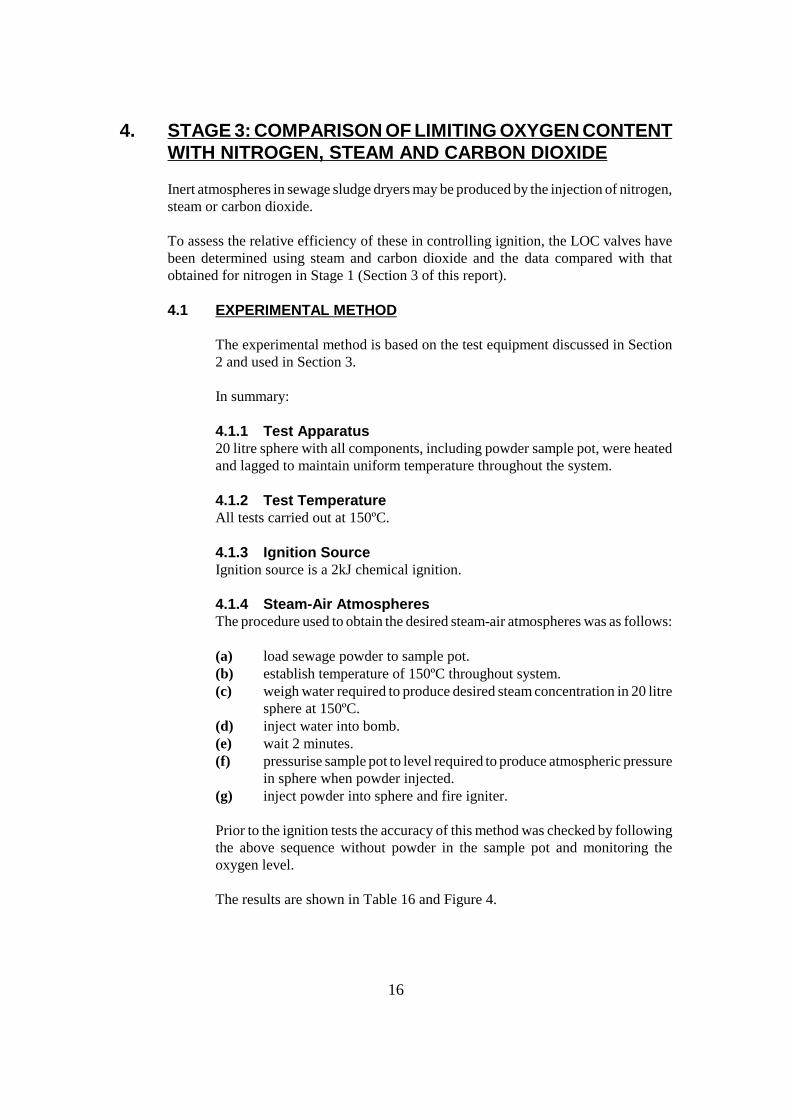
4.1.4 Steam-Air Atmospheres The procedure used to obtain the desired steam-air atmospheres was as follows:
(a) load sewage powder to sample pot. (b) establish temperature of 150ºC throughout system. (c) weigh water required to produce desired steam concentration in 20 litre
sphere at 150ºC. (d) inject water into bomb. (e) wait 2 minutes. (f) pressurise sample pot to level required to produce atmospheric pressure
in sphere when powder injected. (g) inject powder into sphere and fire igniter.
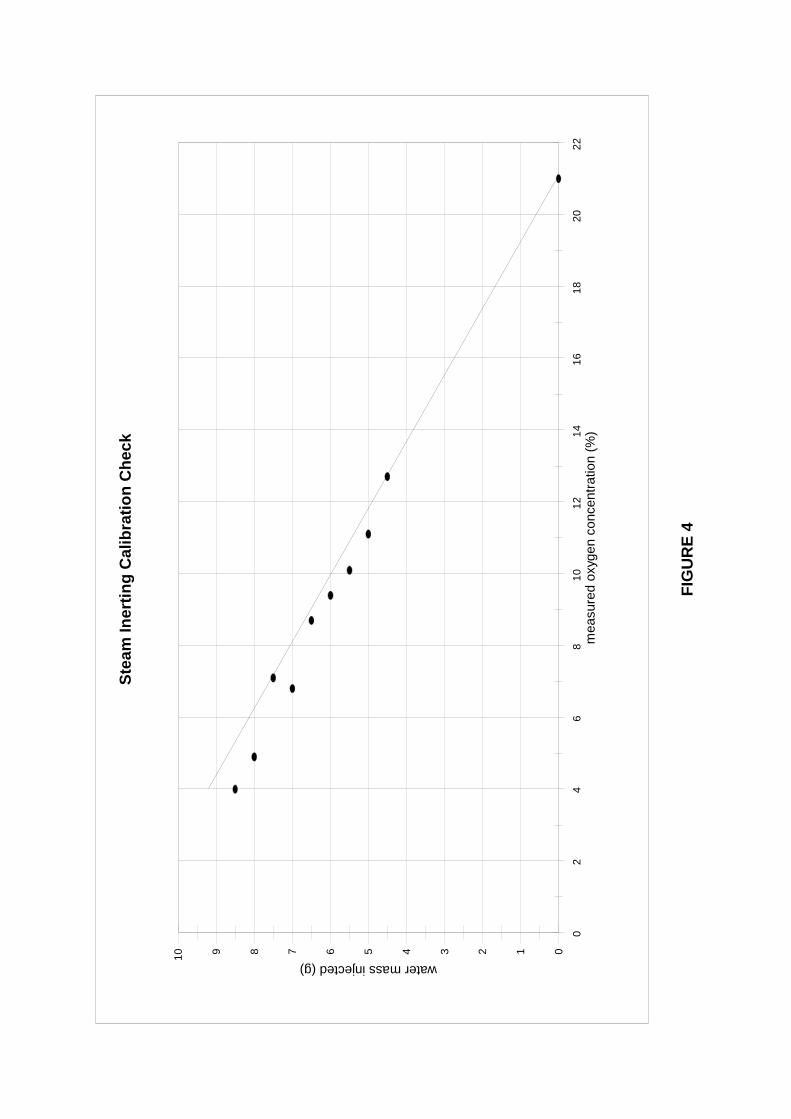
Prior to the ignition tests the accuracy of this method was checked by following the above sequence without powder in the sample pot and monitoring the oxygen level.
The results are shown in Table 16 and Figure 4.
16
Table 16 Steam inerting in 20l sphere @ 150ºc : calibration check
Calc 02
conc % v/v
Steam Volume Litres
Water added grammes
Actual Water added grammes
Sphere initial press bara
Dispersion press bara
Indicated gauge press bara
Measured 02 conc % v/v
4 16.19 8.47 8.5 0.05 4.68 4.8 4.0
5 15.24 7.97 8.0 0.005 6.27 6.0 4.9
6 14.29 7.47 7.5 0.05 7.86 8.0 7.1
7 13.3 6.97 7.0 0.05 9.44 9.0 6.8
8 12.38 6.48 6.5 0.05 11.03 11.5 8.7
9 11.43 5.98 6.0 0.05 12.62 13.0 9.4
10 10.48 5.48 5.5 0.05 14.21 14.0 10.1
11 9.52 4.98 5.0 0.05 15.79 15.5 11.1
12 8.57 4.48 4.5 0.05 17.38 17.5 12.7
Lines to air pump trace heated and set @ 150ºC (Oxygen sensor gas circulation)
4.1.5 Carbon Dioxide - Air Atmospheres To obtain the required carbon dioxide - air atmospheres the system was flushed through and filled with gas mixtures provided and calibrated by BOC.
4.2 SAMPLES
Samples of sewage sludge pellets were obtained from North West Water Barrow waste water treatment works and from North West Water Workington waste water treatment works and prepared as discussed in Section 1 were used in the tests.
4.3 RESULTS
The detailed data for steam and carbon dioxide are in Appendices 4 and 5.
4.4 COMPARISON OF LOC VALUES OBTAINED WITH NITROGEN, STEAM AND CARBON DIOXIDE
The LOC values obtained with the three inert gases are summarised in Table 17 below.
17

Table 17 LOC values with different inerting agents
Gas LOC values (%v/v)
Barrow Workington Sewage Sewage
Nitrogen 6.0 - 7.3 4.0 - 5.0 Average 6.65 4.5
Carbon Dioxide 7.1 - 8.2 4.8 - 5.9 Average 7.65 5.35
Steam 10.1 - 11.1 10.1 - 11.1 Average 10.6 10.6
The following data are available on the relative inerting efficiency of carbon dioxide and nitrogen.
(a) Bartknecht (4) LOC of Brown Coal : Carbon Dioxide : 13.0%
Nitrogen : 11.0%
(b) Zabatekis (9) LOC of Methane (25ºC): Carbon Dioxide : 13.9%
Nitrogen : 11.6%
In Table 18 the ratio of LOC (Carbon Dioxide) / LOC (Nitrogen) is used to compare the above data with the sewage data and with the heat content of the two gases.
Table 18 Ratios of LOC values with CO2 and N2 inerting
Source LOC (CO2) / LOC (N2)
Barrow Sewage 1.15 Workington Sewage 1.19 Brown Coal 1.18 Methane 1.20 Heat Content (kcal / mole) 1.30
The experimental and published data are in good agreement.
18

4.5 CONCLUSION
4.5.1 The order of effectiveness in inerting for the three gases is -
(a) Steam (b) Carbon Dioxide (c) Nitrogen
4.5.2 The relative effectiveness measured for Carbon Dioxide and Nitrogen is in good agreement with published data.
19

5. STAGE 4: LIMITING OXYGEN CONTENT TO PREVENT SMOULDERING COMBUSTION
The ignition of layers of sewage sludge in a dryer can result in fire or in a dust cloud explosion initiated by the burning material.
Ignition of sewage sludge occurs when the temperature of the material is roused to a level at which the heat liberated by the exothermic reaction is sufficient to exceed the heat losses and to produce a runaway increase in temperature. The consequences of this can be combustion of the sewage sludge in bulk or layer form.
Smouldering combustion may occur at lower oxygen concentrations than are typically required to prevent flame propagation in dust clouds.
Characterisation of the exothermic decomposition of a material involves determination of the temperature at which exothermicity is first detected and the rate, magnitude and nature of the subsequent decomposition.
Measurement of exothermic activity involves heating the sample under controlled conditions and noting when its temperature increase independently of the external heat source and recording the maximum temperature produced.
Factors determining exothermic behaviour are many and complex. In addition to the chemical constitution of the material, account has to be taken of:
(a) the effect of bulk or scale (b) the time cycle and duration of exposure to heat (c) auto-catalytic reactions (d) relative rates of heat generation and heat loss from the material should an
exotherm develop.
Test methods that take account of all factors are complicated and no one simple test can cover all aspects of decomposition phenomena.
The following two tests were initially used -
(1) Aerated Cell Test (2) Powder Layer Ignition Test
After consideration of early data it was decided to extend the test programme and use the Dewar Test to obtain data on the onset and progress of decomposition under low heat loss conditions.
5.1 SAMPLE TESTED
The material tested was that obtained from North West Water Barrow Waster Water Treatment Works. The sample was stored and prepared as described in Section 1.
20

5.2 POWDER LAYER IGNITION TEMPERATURE TEST
5.2.1 Method The Powder Layer Ignition Temperature (LIT) is the lowest temperature at which a dust layer on a hot surface ignites. LIT depends not only on the type of powder but also on the geometry of the powder. A thin layer of a dust is likely to have a higher ignition temperature than a thicker layer due to difference in heat loss.
The test used to determine the LIT of the sewage sludge in different nitrogen / air atmospheres is based on that in IEC 61241-2-1 (11).
The apparatus consists of an electrically heated circular plate (200mm diameter) upon which a dust layer 100mm diameter and 15mm thick was placed. The temperature of the plate and powder surface were monitored by thermocouples. The plate was maintained at different levels of constant temperature for a period and the condition of the sample noted.
The apparatus was enclosed in an enclosure containing controlled oxygen / nitrogen mixtures.
In the IEC standard (ii), ignition is considered to have occurred if anyone of the following occurs.
(a) visible glowing or flame is observed or (b) A temperature rise of 250K above plate temperature is measured or (c) A temperature of 450ºC is measured.
5.2.2 Results Detailed results are given in Appendix 6.
In air (21% oxygen) a significant exotherm was initially detected in the temperature range 280ºC - 290ºC. At 290ºC the layer reached a temperature of 495ºC due to the exothermic reaction. At 300ºC a temperature of 595ºC was attained. Thus the sample was at or near combustion conditions.
When the oxygen content was reduced to 10% (v/v), a significant exotherm was detected in the range 370ºC to 380ºC. When exposed to a plate temperature of 390ºC the sample reached a temperature of 500ºC i.e. at or near smouldering conditions.
When the oxygen level was reduced to 6% (v/v) and 3% (v/v) no significant exotherm was detected up to the maximum test temperature of 400ºC.
Although significant exotherm were produced with the 21% and 10% oxygen levels, the temperature required to initiate a developing exotherm was greater than 280ºC, this is significantly above the maximum temperature of 150ºC to
21

which layers can be exposed in the sewage dryers.
This conclusion is only valid to layer thickness of 15mm or less. With layers of greater thickness that produce conditions of lower heat low, exotherms may be initiated at temperatures below those quoted above.
5.3 AERATED CELL TEST
5.3.1 Method Traditionally the exothermic decomposition properties have been determined by enclosing powders in wire baskets of differing size. The wire baskets were placed in an oven and the temperature of the powder recorded as the oven temperature increased.
If however oxidation is the predominant reaction mechanism, the onset of exothermicity can be a function of the availability of external oxygen. The inter-particle oxygen in the basket test may be insufficient to permit reaction at the lowest possible temperature. The Aerated Cell Test was developed in ICI to overcome this problem. It is recommended as one of the tests to establish ignition of powder in drying operations in the Institution of Chemical Engineers guidance on preventing fires and explosions in dryers (10) and it is expected to form part of the European standard test methods for thermal decomposition characterisation.
The equipment is shown schematically in Figure 5. It consists of a glass cylinder (80mm long, 50mm diameter) closed at the base by sintered glass (sinter size 101-160µm) and a close fitting lid which allows air to be passed downwards through the test cell through a second sinter (sinter size 11-16µm).
The test cell is filled with powder until almost full and then placed in a fan assisted air oven. Air is passed downwards through the sample at the rate of 1.0 litres min-1 at the same temperature as that outside the test cell. The temperatures of the oven, sample and air are monitored by thermocouples. The thermocouples within the sample are used to detect the exotherm onset temperature (the temperature at which the sample temperature increases independently of the oven temperature) and the magnitude of the temperature rise. The temperatures of the oven and the air are increased at a rate of 0.5ºC min-1 over the temperature range 20-400ºC.
5.3.2 Results Detailed results are given in Appendix 7. The data are summarised in terms of onset temperature and maximum temperature difference ( �T) between the sample and the oven in Table 19 below.
22

Table 19 Aerated test cell results
Oxygen content Exotherm onset Maximum (%) temperature �t
(ºc) (ºc)
21 130 550 12 140 200 10 130 120 8 140 50 6 140 30 5 No Exotherm Detected No Exotherm Detected
Down to oxygen levels of 6% exothermic activity was detected starting at temperatures of 130-140º.
The data for 21% oxygen indicate a developing exotherm that could progress to red heat.
At oxygen levels 12% and 10% significant exotherms developed but the maximum temperatures (200ºC and 120ºC) were below red heat.
At oxygen levels 8% and 6% the exotherm stabilised at 50ºC and 30ºC respectively above the oven temperature. This indicates that under these conditions the rate of decomposition is low and at temperature differences of 30-50ºC the heat loss from the sample to the oven was sufficient to compensate for the exothermic heat generation.
No exothermic activity was detected at oxygen levels of 5%.
The relationship between �T and oxygen level are shown in Figure 6.
The �T values indicate the temperature rise under the test conditions. The temperature rise value is influenced by the following:
(a) when the temperature of the sample exceeds that of the oven, heat is lost from the former to the latter. This is not a stable situation because both the sample and oven temperatures are changing as the test progresses.
(b) the temperature of the sample depends on that developed by the decomposition and that produced by conduction from the increasing oven temperature.
(c) as the temperature of the sample increases so the decomposition reaction rate will increase. The condition is not isothermal.
Despite the above, the data do indicate that decomposition could be initiated at temperatures of 130 -140ºC and that sewage temperatures could increase with
23
oxygen levels in excess of 5%. The �T values may not indicate the maximum temperatures that could be attained under certain plant conditions e.g. bulk material from which the heat loss rate can be less than that in the test.
5.4 DEWAR TESTS
To obtain data applicable to low heat loss conditions, additional tests have been carried out using the Dewar Test. This test is recommended in the IChemE Dryer Guide (10) for assessing the thermal decomposition of powders and is also used in chemical reaction hazard testing to simulate low heat loss situations.
5.4.1 Method The test cell is a one litre stainless steel Dewar fitted with a screw cap. A thin walled metal tube (4 mm diameter) passed down the centre to the bottom of the Dewar. The nitrogen-air mixtures were passed down the pipe and then they flowed up through the powder at a volume rate of 1 litre / min to fill the inter particle spaces with the required nitrogen / air mixture. A sparge was fitted to the bottom end of the pipe to distribute the gas across the cross-sectional area of the Dewar.
The Dewar was filled up to 80%-90% of its cylindrical height with Barrow sewage sludge powder. The temperature of the sample was monitored with thermocouples fitted near the central axis of the Dewar at ¼, ½ and ¾ levels of the sample. A thermocouple was placed in the ullage space to monitor the gas temperature above the sample.
The Dewar was enclosed in an oven the temperature of which was controlled and monitored.
In each test the oven temperature and the temperature of the gas flowing through the sample were set at 150ºC. The temperature of the sample was monitored until any decomposition exotherm was spent or for up to 4000 minutes.
5.4.2 Results The detailed data are shown in Appendix 8. The samples attained the test temperature of 150ºC after about 2 hours.
There is an indication, that in these low heat loss conditions, the onset of exothermicity could be detected at 100ºC.
At 21% oxygen the exotherm developed rapidly and a temperature of 700ºC was attained i.e. 550ºC above the oven temperature.
When the oxygen level was reduced to 6% an exotherm developed that produced a temperature of 440ºC i.e. 290ºC above the oven / air temperature.
The maximum rate of temperature rise during the exotherm development was
24
about 1ºC/minute. After the decomposition had been completed the rate of temperature decrease was about 0.04ºC/minute. This is a low heat low situation and the temperature rise produced in the test can be expected to be at or near the maximum value that could be produced in sewage plants.
At 4% oxygen an exotherm was detected but the sample temperature stabilised at a temperature of 300ºC i.e. 150ºC above the oven / air temperature. This suggests that at this temperature the heat generation in the exotherm is balanced by the heat loss from the Dewar. On the evidence of the 6% data this would indicate that the exotherm rate with 4% oxygen is slow and producing a temperature rise rate of the order of 0.04ºC/minute. This view is supported by the evidence that the decomposition was not spent during the total test time of over 4,500 minutes.
In a test with 100% nitrogen the temperature of the sample stabilised at the oven temperature of 150ºC. No exotherm was detected during a total test time of 2,800 minutes. This indicates that the gas purge through the sample was producing the required oxygen concentrations in the interparticle spaces.
5.4.3 Conclusions The data indicate that, when exposed to elevated temperatures, sewage sludge will exothermically decompose and increase in temperature.
The differing results from the three tests indicate that the temperature at which the exotherm will initiate a temperature rise and the magnitude of the exotherm depends on the exposure temperature, the gas in the interparticle spaces and the physical form of the sample tested.
Although in the Dewar test a temperature rise was detected at 100ºC, it is most likely that in a wide range of conditions the “onset temperature” will be 130ºC -140ºC.
Reducing the oxygen level had an effect on the magnitude of the temperature rise produced by the decomposition. The temperature rise was very dependent on test conditions. Data are presented for layer heat exposure, small aerated sample and low heat loss conditions. It should be possible to use the data to assess the temperature that will be produced for the different types of sewage deposits found in dryers.
The evidence overall suggests that it is unlikely that sewage sludge will exothermically decompose to smouldering when an atmosphere at 5-6% oxygen is used to prevent dust explosions provided this reduced oxygen level is in the interparticle spaces.
25
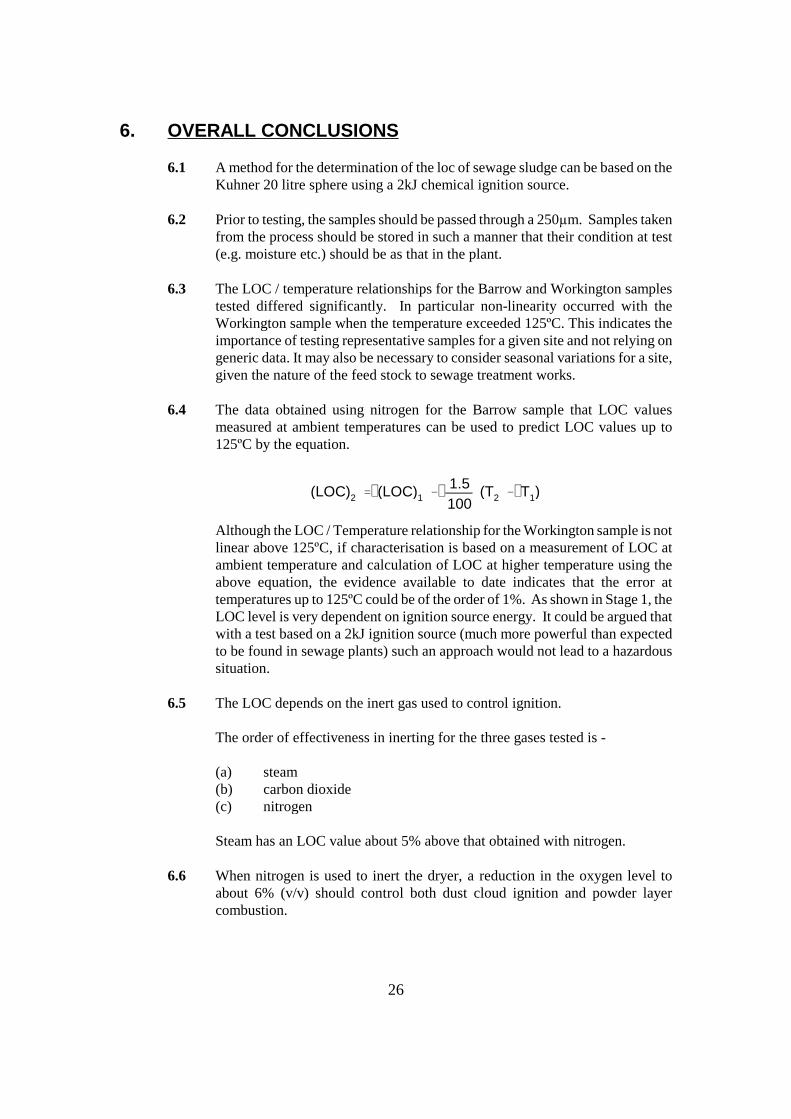
6. OVERALL CONCLUSIONS
6.1 A method for the determination of the loc of sewage sludge can be based on the Kuhner 20 litre sphere using a 2kJ chemical ignition source.
6.2 Prior to testing, the samples should be passed through a 250µm. Samples taken from the process should be stored in such a manner that their condition at test (e.g. moisture etc.) should be as that in the plant.
6.3 The LOC / temperature relationships for the Barrow and Workington samples tested differed significantly. In particular non-linearity occurred with the Workington sample when the temperature exceeded 125ºC. This indicates the importance of testing representative samples for a given site and not relying on generic data. It may also be necessary to consider seasonal variations for a site, given the nature of the feed stock to sewage treatment works.
6.4 The data obtained using nitrogen for the Barrow sample that LOC values measured at ambient temperatures can be used to predict LOC values up to 125ºC by the equation.
(LOC)2 ' (LOC)1 & 1.5 (T2 & T1)100
Although the LOC / Temperature relationship for the Workington sample is not linear above 125ºC, if characterisation is based on a measurement of LOC at ambient temperature and calculation of LOC at higher temperature using the above equation, the evidence available to date indicates that the error at temperatures up to 125ºC could be of the order of 1%. As shown in Stage 1, the LOC level is very dependent on ignition source energy. It could be argued that with a test based on a 2kJ ignition source (much more powerful than expected to be found in sewage plants) such an approach would not lead to a hazardous situation.
6.5 The LOC depends on the inert gas used to control ignition.
The order of effectiveness in inerting for the three gases tested is -
(a) steam (b) carbon dioxide (c) nitrogen
Steam has an LOC value about 5% above that obtained with nitrogen.
6.6 When nitrogen is used to inert the dryer, a reduction in the oxygen level to about 6% (v/v) should control both dust cloud ignition and powder layer combustion.
26
REFERENCES
1. Draft BS EN14034-4 “Determination of the Explosion Characteristics of Dust Clouds Part 4 : Determination of the Limiting Oxygen Concentration of Dust Clouds.” Draft for Public Comment dated 10/11/00. British Standards Institution, London.
2. Rolf K. Eckoff “Dust Explosions in the Process Industries” Butterman Heinemann (1997).
3. BIA “Brenn-und Explosions - Kenngrossen von Stauben”. Berufsgenossenschaftliches Institut for Arbeitssicherheit. Bergbau-Versuchsstrecke. Institut for Explosionschutz and Sprengtechnik. Erich Schmidt Verlag GmbH & Co. Bielefeld (1987).
4. W. Bartknecht “Explosions - Course, Prevention, Protection” Springer Verlag (1989).
5. F.K. Sweiss, C.G. Sinclair “The Effect of Particle Size on the Maximum Permissible Oxygen Concentration to Prevent Dust Explosions” J. Haz. Materials Vol. 10 p.59 (1985).
6. A.D. Craven, M.G. Foster. Combustion and Flame No. 5, p.408 vol. 11 (1967).
7. W. Wiemann. 9 Intern. Kolloquium fur die Verhutung von Arbeitsunfallen und Berufskranheiten in der Chemischen Industry, Luzern June (1984) - quoted in Ref. 4).
8. Th. Glarner Dissertation ETH Zurich Nr. 7350 (1983) (quoted in Ref. 4).
9. M.G. Zabetakis “Flammability Characteristics of Combustible Gaswes and Vapours”. Bulletin 627, U.S. Bureau of Mines (1965).
10. John Abbott “Prevention of Explosions in Fires and Explosions in Dryers” Institution of Chemical Engineers (UK) (1990).
11. IEC 61241-2-1 “Electrical Apparatus for Use in the Presence of Combustible Dusts, Part 2 : Test Methods, Section 1 : Methods for Determining the Minimum Ignition Temperatures of Dusts” (1994).
27

Eff
ect
of
Tem
per
atu
re o
n L
OC
B
arro
w 2
kJ Ig
nitio
n Limiting Oxygen Conc entr ation ( % v/v) 12 11 10 9 8 7 6 5 4
0 25
50
75
10
0 12
5 15
0 T
empe
ratu
re (°C
)
Mea
sure
d D
ata
Cal
cula
ted
Dat
a
FIG
UR
E 1

Eff
ect
of
Tem
per
atu
re o
n L
OC
W
orki
ngto
n 2k
J Ig
nitio
n Limiting Oxygen Conc entr ation ( % v/v) 12 11 10 9 8 7 6 5 4
Gra
dien
t
Gra
dien
t
0 25
50
75
10
0 12
5 15
0 T
empe
ratu
re (°C
)
Mea
sure
d D
ata
Cal
cula
ted
Dat
a
FIG
UR
E 2

456789101112
Limi
0 25
50
75
10
0 12
5 15
0 °C
)
ting Oxygen Conc entr ation ( % v/v)
Tem
pera
ture
(
Mea
sure
d D
ata
Eff
ect
of
Tem
per
atu
re o
n L
OC
W
orki
ngto
n 1k
J Ig
nitio
n
FIG
UR
E 3
Ste
am In
erti
ng
Cal
ibra
tio
n C
hec
k water m ass inj ected (g) 10 9 8 7 6 5 4 3 2 1 0
0 2
4 6
8 10
1214
1618
2022
m
easu
red
oxyg
en c
once
ntra
tion
(%)
FIG
UR
E 4

FIGURE 5
AERATED TEST CELL
Air
Air
Glass
Sample
Thermocouple
Sintered
Powder
Thermocouples
Sintered Glass

APPENDIX 1
DATA SHEETS FOR LOC TESTS ON WHEATFLOUR AND CORN STARCH

____________________________________________________________________________
__________________________________
____________________________________________________________________________
____________________________________________________________________________
____________________________________________________________________________
Burgoyne Laboratory 17-Oct-02The Heath File: K011001A.XYZ
LIMITING OXYGEN CONCENTRATION
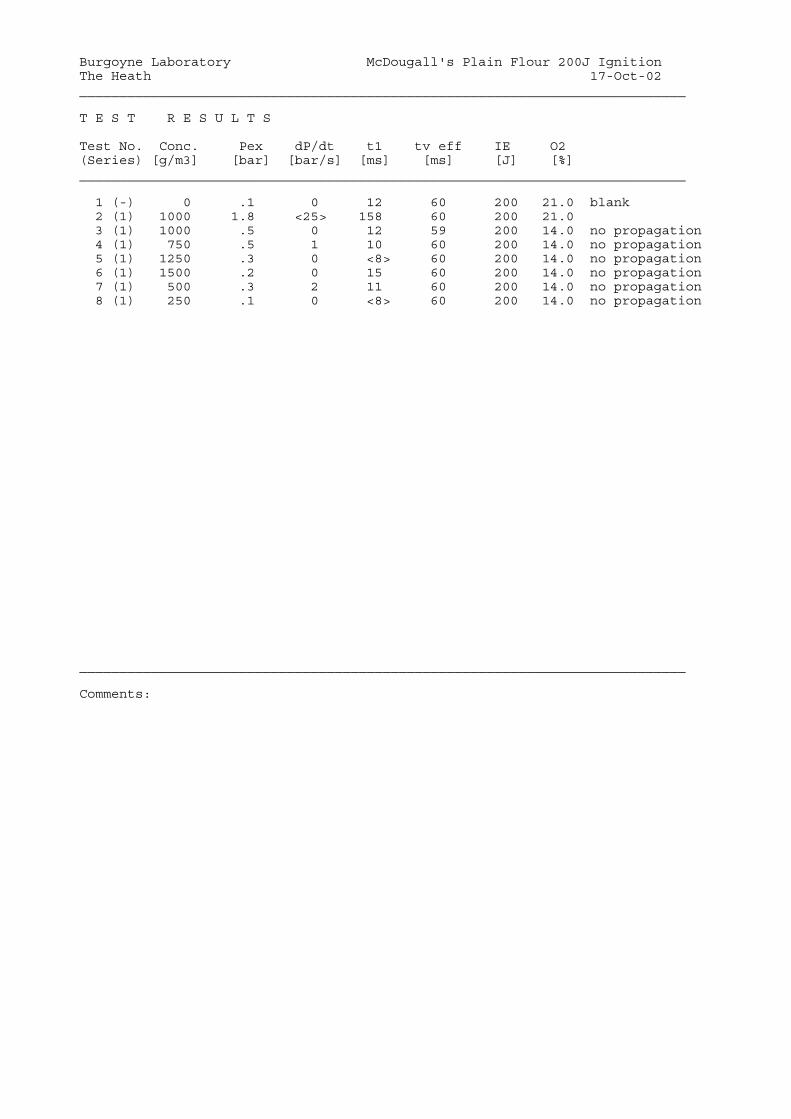
Sample : McDougall's Plain Flour 200J Ignition Client : HSE Sample Preparation : sieved below 63µ m Median Particle Size : <63µ m Moisture Content : 9.2% w/w Ambient Temperature : 25° C
Apparatus : 20-l-sphereIgnition source : 2 x 100 J chemical ignitersDust-dispersion system : rebound nozzle
Limiting Oxygen Concentration : greater than 14% v/v
Pex
2.0
1.5
1.0
0.5
14.0 21.0 O2
dP/dt
40
30
20
10
14.0 21.0 O2
____________________________________________________________________________
____________________________________________________________________________
____________________________________________________________________________
Burgoyne Laboratory McDougall's Plain Flour 200J IgnitionThe Heath 17-Oct-02
T E S T R E S U L T S
Test No. Conc. Pex dP/dt t1 tv eff IE O2(Series) [g/m3] [bar] [bar/s] [ms] [ms] [J] [%]
1 (-) 0 .1 0 12 60 200 21.0 blank 2 (1) 1000 1.8 <25> 158 60 200 21.0 3 (1) 1000 .5 0 12 59 200 14.0 no propagation 4 (1) 750 .5 1 10 60 200 14.0 no propagation 5 (1) 1250 .3 0 <8> 60 200 14.0 no propagation 6 (1) 1500 .2 0 15 60 200 14.0 no propagation 7 (1) 500 .3 2 11 60 200 14.0 no propagation 8 (1) 250 .1 0 <8> 60 200 14.0 no propagation
Comments:

____________________________________________________________________________
__________________________________
____________________________________________________________________________
____________________________________________________________________________
____________________________________________________________________________
Burgoyne Laboratory 17-Oct-02The Heath File: K011002A.XYZ
LIMITING OXYGEN CONCENTRATION
Sample : McDougall's Plain Flour 1kJ IgnitionClient : HSE Sample Preparation Median Particle Size Moisture Content Ambient Temperature
: sieved below 63µ: <63µ: 9.2% w/w : 25° C
m
Apparatus : 20-l-sphereIgnition source : 2 x 500 J chemical ignitersDust-dispersion system : rebound nozzle
Limiting Oxygen Concentration : 11.9% - 12.9% v/v
Pex
4.0
3.0
2.0
1.0
11.9 21.0 O2
dP/dt
40
30
20
10
11.9 21.0 O2

____________________________________________________________________________
____________________________________________________________________________
____________________________________________________________________________
Burgoyne Laboratory McDougall's Plain Flour 1kJ IgnitionThe Heath 17-Oct-02
T E S T R E S U L T S
Test No. Conc. Pex dP/dt t1 tv eff IE O2(Series) [g/m3] [bar] [bar/s] [ms] [ms] [J] [%]
1 (-) 0 .2 0 22 60 1k 21.0 blank 2 (1) 1000 2.9 <42> 500 60 1k 21.0 3 (-) 1000 .2 0 24 60 1k 14.0 no propagation 4 (1) 250 .7 6 12 60 1k 14.0 propagation 5 (-) 250 .4 4 12 60 1k 12.9 propagation? 6 (-) 500 1.0 4 9 60 1k 12.9 propagation? 7 (1) 500 .6 2 10 60 1k 11.9 no propagation 8 (1) 250 .3 2 <8> 60 1k 11.9 no propagation 9 (1) 750 .2 0 50 60 1k 11.9 no propagation
10 (1) 1000 .1 0 12 60 1k 11.9 no propagation 11 (1) 1250 .2 0 9 60 1k 11.9 no propagation 12 (-) 375 .2 2 25 60 1k 12.9 no propagation 13 (1) 750 .6 6 77 60 1k 12.9 propagation 14 (-) 500 .3 5 45 61 1k 14.0 propagation?
Comments:

____________________________________________________________________________
__________________________________
____________________________________________________________________________
____________________________________________________________________________
____________________________________________________________________________
Burgoyne Laboratory 17-Oct-02The Heath File: K011003A.XYZ
LIMITING OXYGEN CONCENTRATION
Sample : MacDougall's Plain Flour 2kJ Ignition Client : HSE Sample Preparation : sieved below 63µ m Median Particle Size : < 63µ m Moisture Content : 9.2% w/w Ambient Temperature : 25° C
Apparatus : 20-l-sphereIgnition source : 2 x 1 kJ chemical ignitersDust-dispersion system : rebound nozzle
Limiting Oxygen Concentration : 8.8% - 10%
Pex
8.0
6.0
4.0
2.0
8.8 10.8 21.0 O2
dP/dt
200
150
100
50
8.8 10.8 21.0 O2
____________________________________________________________________________
____________________________________________________________________________
____________________________________________________________________________
Burgoyne Laboratory MacDougall's Plain Flour 2kJ IgnitionThe Heath 17-Oct-02
T E S T R E S U L T S
Test No. Conc. Pex dP/dt t1 tv eff IE O2(Series) [g/m3] [bar] [bar/s] [ms] [ms] [J] [%]
1 (-) 0 .3 0 33 60 2k 21.0 blank 2 (1) 1000 5.5 <121> 128 60 2k 21.0 3 (-) 1000 .3 0 71 60 2k 12.9 no propagation 4 (1) 500 1.3 14 137 60 2k 12.9 propagation 5 (-) 500 .3 0 36 60 2k 11.9 no propagation 6 (1) 250 .7 10 127 59 2k 11.9 propagation 7 (-) 250 .3 0 29 60 2k 10.8 no propagation 8 (-) 125 .3 0 23 60 2k 10.8 no propagation 9 (1) 500 .4 10 32 60 2k 10.8 propagation? 10 (1) 750 .6 8 158 60 2k 10.8 propagation 11 (1) 750 .8 6 14 60 2k 10.0 propagation? 12 (1) 750 .6 0 10 60 2k 8.8 no propagation 13 (1) 500 .3 0 10 60 2k 8.8 no propagation 14 (1) 250 .4 0 <8> 60 2k 8.8 no propagation 15 (1) 1250 .2 0 9 61 2k 8.8 no propagation 16 (1) 1000 .4 1 10 60 2k 8.8 no propagation
Comments:

____________________________________________________________________________
__________________________________
____________________________________________________________________________
____________________________________________________________________________
____________________________________________________________________________
Burgoyne Laboratory 17-Oct-02The Heath File: K011005A.XYZ
LIMITING OXYGEN CONCENTRATION
Sample : McDougall's Plain Flour 10kJ Ignition Client : HSE Sample Preparation : sieved below 63µ m Median Particle Size : <63µ m Moisture Content : 9.2% w/w Ambient Temperature : 25° C
Apparatus : 20-l-sphereIgnition source : 2 x 5 kJ chemical ignitersDust-dispersion system : rebound nozzle
Limiting Oxygen Concentration : less than 4% v/v
Pex
8.0
6.0
4.0
2.0
4.0 6.0 8.0 10.8 21.0 O2
100
200
300
400
dP/dt
4.0 6.0 8.0 10.8 21.0 O2

____________________________________________________________________________
____________________________________________________________________________
____________________________________________________________________________
Burgoyne Laboratory McDougall's Plain Flour 10kJ IgnitionThe Heath 17-Oct-02
T E S T R E S U L T S
Test No. Conc. Pex dP/dt t1 tv eff IE O2(Series) [g/m3] [bar] [bar/s] [ms] [ms] [J] [%]
1 (-) 0 1.1 43 48 60 10k 21.0 blank 2 (1) 1000 6.6 <285> <59> 61 10k 21.0 3 (-) 1000 4.3 68 113 61 10k 10.8 propagation 4 (-) 1000 4.3 68 111 60 10k 10.8 repeat line not flus 5 (1) 1000 4.3 86 110 60 10k 10.8 propagation 6 (-) 1000 2.6 7 479 61 10k 8.8 propagation 7 (1) 1000 3.6 33 203 60 10k 8.8 propagation (rpt) 8 (-) 1000 1.1 0 59 59 10k 8.0 ? 9 (1) 750 4.0 62 91 60 10k 8.0 propagation 10 (1) 750 3.4 13 272 60 10k 7.3 propagation 11 (-) 750 .6 0 26 60 10k 6.0 no propagation 12 (1) 500 3.0 25 210 60 10k 6.0 propagation 13 (-) 500 1.0 0 54 60 10k 5.0 no propagation 14 (1) 750 1.8 16 345 59 10k 5.0 propagation 15 (-) 1000 .8 0 43 59 10k 4.0 no propagation 16 (-) 1250 .5 0 16 60 10k 4.0 no propagation 17 (-) 750 .7 0 26 60 10k 4.0 no propagation 18 (1) 500 2.1 33 184 60 10k 4.0 propagation
Comments:

____________________________________________________________________________
__________________________________
____________________________________________________________________________
____________________________________________________________________________
____________________________________________________________________________
Burgoyne Laboratory 17-Oct-02The Heath File: K011009B.XYZ
LIMITING OXYGEN CONCENTRATION
Sample : Brown & Polson corn starch 200J Ignition Client : HSE Sample Preparation : sieved below 38µ m Median Particle Size : <38µ m Moisture Content : 8.7% w/w Ambient Temperature : 25° C
Apparatus : 20-l-sphereIgnition source : 2 x 100 J chemical ignitersDust-dispersion system : rebound nozzle
Limiting Oxygen Concentration : 10.8% - 11.9% v/v
Pex
8.0
6.0
4.0
2.0
10.8 14.0 21.0 O2
dP/dt
100
75
50
25
10.8 14.0 21.0 O2
____________________________________________________________________________
____________________________________________________________________________
____________________________________________________________________________
Burgoyne Laboratory Brown & Polson corn starch 200J IgnitionThe Heath 17-Oct-02
T E S T R E S U L T S
Test No. Conc. Pex dP/dt t1 tv eff IE O2(Series) [g/m3] [bar] [bar/s] [ms] [ms] [J] [%]
1 (-) 0 .3 177? 10 59 200 21.0 blank 2 (1) 500 3.4 13 436 60 200 21.0 3 (-) 500 .4 1 11 60 200 14.0 no propagation 4 (-) 250 .2 1 10 60 200 14.0 no propagation 5 (-) 750 .2 0 12 60 200 14.0 no propagation 6 (-) 125 .1 0 11 60 200 14.0 no propagation 7 (1) 1000 4.6 <54> 243 60 200 14.0 propagation 8 (-) 1000 .3 0 12 60 200 12.9 no propagation 9 (1) 1250 4.0 22 549 60 200 12.9 propagation
10 (-) 1500 .4 0 9 60 200 11.9 no propagation 11 (-) 1250 .3 0 12 60 200 11.9 no propagation 12 (1) 1750 3.9 26 441 60 200 11.9 propagation 13 (1) 2000 .4 0 11 60 200 10.8 no propagation 14 (1) 2250 .4 0 8 59 200 10.8 no propagation 15 (1) 2500 .1 0 20 61 200 10.8 no propagation 16 (1) 1750 .0 0 0 60 200 10.8 no propagation 17 (1) 1500 .9 0 11 60 200 10.8 no propagation
Comments:

____________________________________________________________________________
__________________________________
____________________________________________________________________________
____________________________________________________________________________
____________________________________________________________________________
Burgoyne Laboratory 17-Oct-02The Heath File: K011009A.XYZ
LIMITING OXYGEN CONCENTRATION
Sample : Brown & Polson corn starch 1kJ Ignition Client : HSE Sample Preparation : sieved below 38µ m Median Particle Size : <38µMoisture Content : 8.7% w/w Ambient Temperature : 25° C
Apparatus : 20-l-sphereIgnition source : 2 x 500 J chemical ignitersDust-dispersion system : rebound nozzle
Limiting Oxygen Concentration : 10.0% - 10.8% v/v
Pex
4.0
3.0
2.0
1.0
9.9 11.9 21.0 O2
dP/dt
100
75
50
25
9.9 11.9 21.0 O2
____________________________________________________________________________
____________________________________________________________________________
____________________________________________________________________________
Burgoyne Laboratory Brown & Polson corn starch 1kJ IgnitionThe Heath 17-Oct-02
T E S T R E S U L T S
Test No. Conc. Pex dP/dt t1 tv eff IE O2(Series) [g/m3] [bar] [bar/s] [ms] [ms] [J] [%]
1 (-) 0 .4 0 10 60 1k 21.0 blank (1kJ) 2 (1) 500 4.5 <97> 147 60 1k 21.0 1kJ igniters 3 (1) 500 3.7 29 318 60 1k 14.0 propagation 4 (1) 500 1.0 11 161 60 1k 12.9 propagation 5 (-) 500 .3 0 8 60 1k 11.9 no propagation 6 (-) 250 .6 0 11 60 1k 11.9 no propagation 7 (1) 125 .4 6 33 60 1k 11.9 propagation 8 (-) 125 .2 0 11 60 1k 10.8 no propagation 9 (1) 250 .4 7 133 60 1k 10.8 propagation
10 (1) 250 .5 0 <9> 60 1k 9.9 no propagation 11 (1) 500 .2 0 12 60 1k 9.9 no propagation 12 (1) 125 .2 0 11 59 1k 10.0 no propagation 13 (1) 750 .2 0 34 60 1k 10.0 no propagation 14 (1) 1000 .3 0 13 59 1k 10.0 no propagation
Comments:

____________________________________________________________________________
__________________________________
____________________________________________________________________________
____________________________________________________________________________
____________________________________________________________________________
Burgoyne Laboratory 17-Oct-02The Heath File: K011008B.XYZ
LIMITING OXYGEN CONCENTRATION
Sample : Brown & Polson corn starch 2kJ Ignition Client : HSE Sample Preparation : sieved below 38µ m Median Particle Size : <38µ m Moisture Content : 8.7% w/w Ambient Temperature : 25° C
Apparatus : 20-l-sphereIgnition source : 2 x 1 kJ chemical ignitersDust-dispersion system : rebound nozzle
Limiting Oxygen Concentration : 8.0% - 9.9% v/v
Pex
8.0
6.0
4.0
2.0
8.0 10.8 21.0 O2
dP/dt
200
150
100
50
8.0 10.8 21.0 O2
____________________________________________________________________________
____________________________________________________________________________
____________________________________________________________________________
Burgoyne Laboratory Brown & Polson corn starch 2kJ IgnitionThe Heath 17-Oct-02
T E S T R E S U L T S
Test No. Conc. Pex dP/dt t1 tv eff IE O2(Series) [g/m3] [bar] [bar/s] [ms] [ms] [J] [%]
1 (-) 0 .3 0 48 60 2k 21.0 blank 2 (1) 500 5.6 <164> 83 60 2k 21.0 3 (-) 500 .4 0 74 60 2k 11.9 propagation? 4 (1) 250 .9 13 45 60 2k 11.9 propagation 5 (-) 250 .6 1 10 60 2k 10.8 no propagation 6 (-) 125 .4 0 11 60 2k 10.8 propagation? 7 (-) 60 .6 1 12 59 2k 10.8 no propagation 8 (1) 500 3.7 21 389 60 2k 10.8 propagation 9 (-) 500 .3 0 25 60 2k 9.9 no propagation 10 (-) 750 .3 0 11 60 2k 9.9 no propagation 11 (-) 1000 .2 0 14 60 2k 9.9 no propagation 12 (1) 250 .7 14 102 60 2k 9.9 propagation 13 (1) 60 .4 0 <13> 60 2k 8.0 no propagation 14 (1) 125 .3 0 30 59 2k 8.0 no propagation 15 (1) 250 .3 0 18 59 2k 8.0 no propagation 16 (1) 500 .3 0 35 60 2k 8.0 no propagation 17 (1) 750 .4 0 15 60 2k 8.0 no propagation
Comments:
____________________________________________________________________________
__________________________________
____________________________________________________________________________
____________________________________________________________________________
____________________________________________________________________________
Burgoyne Laboratory 17-Oct-02The Heath File: K011008A.XYZ
LIMITING OXYGEN CONCENTRATION
Sample : Brown & Polson corn starch 10kJ Ignition Client : HSE Sample Preparation : sieved below 38µ m Median Particle Size : <38µ m Moisture Content : 8.7% w/w Ambient Temperature : 25° C
Apparatus : 20-l-sphereIgnition source : 2 x 5 kJ chemical ignitersDust-dispersion system : rebound nozzle
Limiting Oxygen Concentration : less than 4% v/v
Pex
8.0
6.0
4.0
2.0
4.0 6.0 9.9 21.0 O2
100
200
300
400
dP/dt
4.0 6.0 9.9 21.0 O2
____________________________________________________________________________
____________________________________________________________________________
____________________________________________________________________________
Burgoyne Laboratory Brown & Polson corn starch 10kJ IgnitionThe Heath 17-Oct-02
T E S T R E S U L T S
Test No. Conc. Pex dP/dt t1 tv eff IE O2(Series) [g/m3] [bar] [bar/s] [ms] [ms] [J] [%]
1 (-) 0 1.3 0 8 60 10k 21.0 blank 2 (1) 500 6.6 <389> <61> 60 10k 21.0 3 (1) 500 3.6 45 172 60 10k 9.9 4 (-) 500 1.2 0 117 60 10k 7.3 no propagation 5 (1) 250 3.9 41 179 60 10k 7.3 propagation 6 (-) 250 1.3 0 84 60 10k 6.0 7 (-) 125 .0 0 0 0? 10k 6.0 gas leak failed run 8 (1) 125 3.5 34 186 60 10k 6.0 propagation 9 (-) 250 1.3 0 90 60 10k 5.0 no propagation 10 (1) 500 3.3 23 187 60 10k 5.0 propagation 11 (1) 500 1.9 14 362 60 10k 4.0 propagation
Comments:

APPENDIX 2
DATA SHEETS FOR LOC TESTS ON SEWAGE SLUDGE IN 20L SPHERE

____________________________________________________________________________
__________________________________
____________________________________________________________________________
____________________________________________________________________________
____________________________________________________________________________
Burgoyne Laboratory 17-Oct-02The Heath File: K010925B.XYZ
LIMITING OXYGEN CONCENTRATION
Sample : Barrow pellets 200J ignitionClient : HSE Sample Preparation Median Particle Size Moisture Content Ambient Temperature
: milled & sieved below 250µ: 63 - 90µ m : 6.5% w/w : 25° C
m
Apparatus : 20-l-sphereIgnition source : 2 x 100 J chemical ignitersDust-dispersion system : rebound nozzle
Limiting Oxygen Concentration : 11.9 - 12.9% v/v
11.9 21.0
11.9 21.0
Pex
4.0
3.0
2.0
1.0
O2
dP/dt
100
75
50
25
O2

____________________________________________________________________________
____________________________________________________________________________
____________________________________________________________________________
Burgoyne Laboratory Barrow pellets 200J ignitionThe Heath 17-Oct-02
T E S T R E S U L T S
Test No. Conc. Pex dP/dt t1 tv eff IE O2(Series) [g/m3] [bar] [bar/s] [ms] [ms] [J] [%]
1 (-) 0 .1 0 10 60 200 21.0 blank 2 (-) 500 .2 2 14 59 200 21.0 the O2 was 14% No go 3 (-) 500 2.2 21 199 59 200 21.0 gas leak but still w 4 (1) 500 4.2 <46> 301 59 200 21.0 5 (-) 1000 .2 5 10 60 200 14.0 No propagation 6 (-) 750 .3 2 176 60 200 14.0 7 (-) 1250 .3 2? 10 59 200 14.0 8 (1) 1500 3.1 10 678 60 200 14.0 propagation 9 (-) 1500 .1 4 12 60 200 12.9 No propagation
10 (1) 1750 1.5 16 242 58 200 12.9 propagation 11 (1) 1750 .1 0 10 60 200 11.9 No Propagation 12 (1) 2000 .4 0 8 60 200 11.9 No Propagation 13 (1) 2250 .1 0 15 59 200 11.9 No Propagation 14 (1) 2500 .0 0 0 59 200 11.9 No propagation 15 (1) 1500 .1 0 57 60 200 11.9 No Propagation 17 (1) 1000 .0 0 0 59 200 11.9 No Propagation 18 (1) 500 .1 0 8 59 200 11.9 No Propagation
Comments:
____________________________________________________________________________
__________________________________
____________________________________________________________________________
____________________________________________________________________________
____________________________________________________________________________
Burgoyne Laboratory 17-Oct-02The Heath File: K010926A.XYZ
LIMITING OXYGEN CONCENTRATION
SampleClientSample PreparationMedian Particle SizeMoisture ContentAmbient Temperature
: Barrow pellets 1kJ ignition : HSE : milled & sieved below 250µ m : 63 - 90µ m : 6.5% w/w : 25° C
Apparatus : 20-l-sphereIgnition source : 2 x 500 J chemical ignitersDust-dispersion system : rebound nozzle
Limiting Oxygen Concentration : 10.8 - 11.9% w/w
Pex
8.0
6.0
4.0
2.0
10.8 21.0 O2
dP/dt
200
150
100
50
10.8 21.0 O2

____________________________________________________________________________
____________________________________________________________________________
____________________________________________________________________________
Burgoyne Laboratory Barrow pellets 1kJ ignitionThe Heath 17-Oct-02
T E S T R E S U L T S
Test No. Conc. Pex dP/dt t1 tv eff IE O2(Series) [g/m3] [bar] [bar/s] [ms] [ms] [J] [%]
1 (-) 0 .3 1 10 61 1k 21.0 blank 2*500J 2 (1) 1000 5.7 <192> 86 60 1k 21.0 3 (1) 1000 4.3 67 153 60 1k 12.9 propagation 4 (1) 1000 .5 1 11 60 1k 10.8 No Propagation 5 (1) 1250 .2 0 10 60 1k 10.8 No Propagation 6 (-) 1250 .3 0 9 60 1k 11.9 No propagation 7 (1) 1000 2.6 15 751 60 1k 11.9 propagation 8 (1) 750 .4 0 <8> 60 1k 10.8 No Propagation 9 (1) 500 .2 0 95 60 1k 10.8 No Propagation
10 (1) 1500 .3 1 78 60 1k 10.8 No Propagation
Comments:

____________________________________________________________________________
__________________________________
____________________________________________________________________________
____________________________________________________________________________
____________________________________________________________________________
Burgoyne Laboratory 17-Oct-02The Heath File: K010927A.XYZ
LIMITING OXYGEN CONCENTRATION
SampleClientSample PreparationMedian Particle SizeMoisture ContentAmbient Temperature
: Barrow pellets 2kJ ignition : HSE : milled and sieved below 250µ m : 63 - 90µ m : 6.5% w/w : 25° C
Apparatus : 20-l-sphereIgnition source : 2 x 1 kJ chemical ignitersDust-dispersion system : rebound nozzle
Limiting Oxygen Concentration : 8.8% - 10.0% v/v
Pex
8.0
6.0
4.0
2.0
8.8 10.8 21.0 O2
dP/dt
100
75
50
25
8.8 10.8 21.0 O2
____________________________________________________________________________
____________________________________________________________________________
____________________________________________________________________________
Burgoyne Laboratory Barrow pellets 2kJ ignitionThe Heath 17-Oct-02
T E S T R E S U L T S
Test No. Conc. Pex dP/dt t1 tv eff IE O2(Series) [g/m3] [bar] [bar/s] [ms] [ms] [J] [%]
1 (-) 0 .4 -1 7 60 2k 21.0 blank 2 (1) 1000 4.9 <95> 104 60 2k 21.0 3 (1) 1000 3.4 24 373 59 2k 11.9 Propagation 4 (-) 1000 .2 0 20 60 2k 10.8 No Propagation 5 (-) 1500 .4 0 9 59 2k 10.8 No Propagation 6 (1) 500 .8 8 71 60 2k 10.8 Propagation 7 (-) 750 .4 0 94 59 2k 10.0 No propagation 8 (-) 500 .4 0 58 59 2k 10.0 no propagation 9 (1) 250 .8 12 136 60 2k 10.0 Propagation 10 (1) 250 .3 0 53 60 2k 8.8 No Propagation 11 (1) 125 .4 0 43 60 2k 8.8 No Propagation 12 (1) 500 .5 6 36 60 2k 8.8 No Propagation 15 (1) 1000 .4 0 <10> 59 2k 8.8 No propagation 16 (-) 750 .0 0 0 60 2k 8.8 igniters failed 17 (1) 750 .3 0 29 60 2k 8.8 No Propagation
Comments:
____________________________________________________________________________
__________________________________
____________________________________________________________________________
____________________________________________________________________________
____________________________________________________________________________
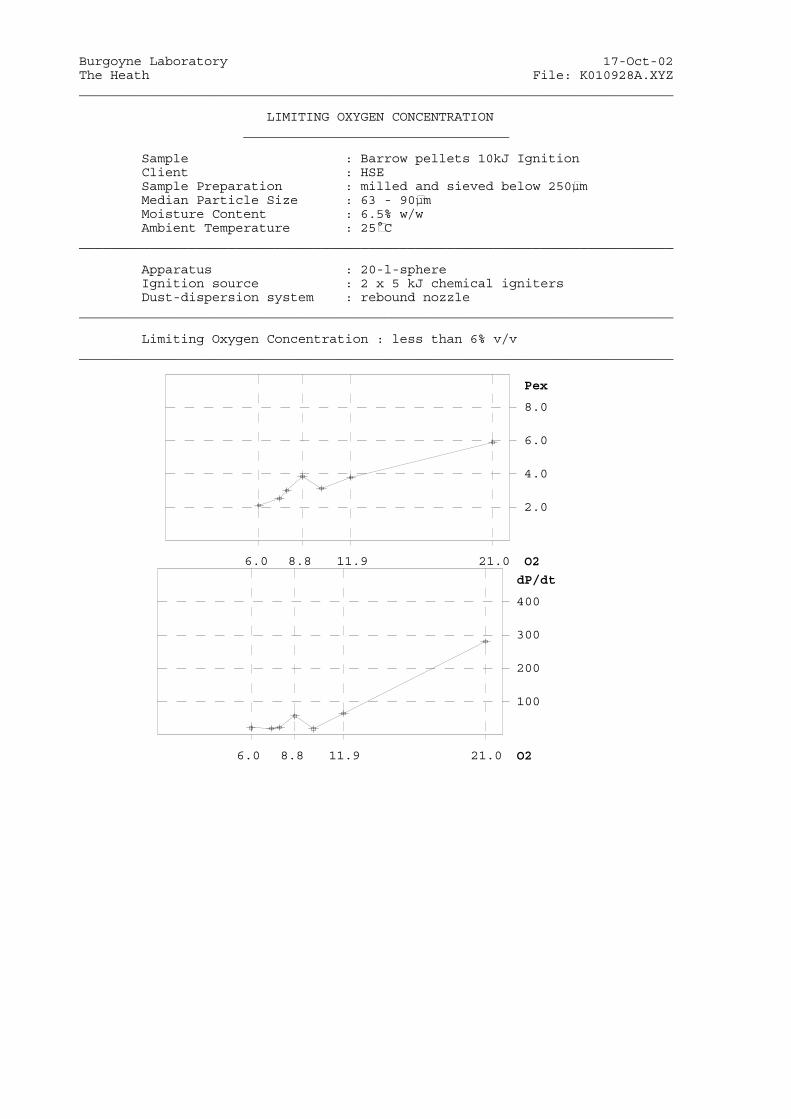
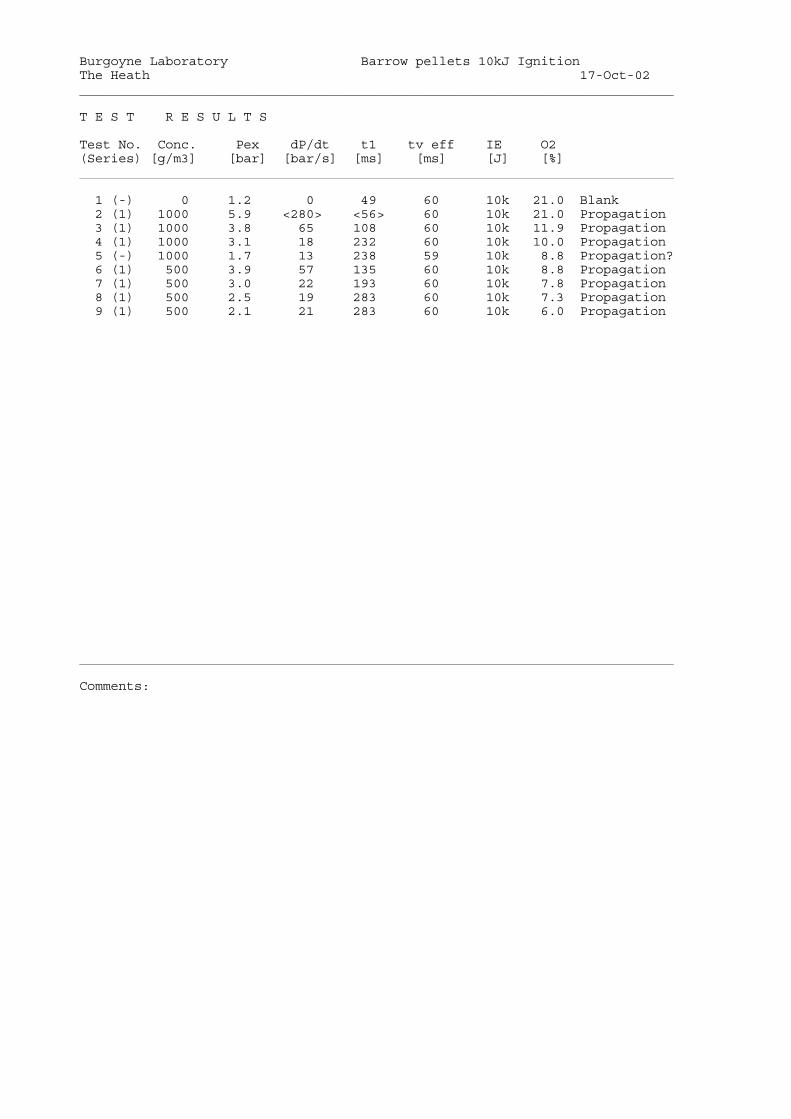
Burgoyne Laboratory 17-Oct-02The Heath File: K010928A.XYZ
LIMITING OXYGEN CONCENTRATION
Sample : Barrow pellets 10kJ IgnitionClient : HSE Sample Preparation : milled and sieved below 250µ m Median Particle Size : 63 - 90µ m Moisture Content Ambient Temperature
: 6.5% w/w : 25° C
Apparatus : 20-l-sphereIgnition source : 2 x 5 kJ chemical ignitersDust-dispersion system : rebound nozzle
Limiting Oxygen Concentration : less than 6% v/v
6.0 8.8 11.9 21.0
Pex
8.0
6.0
4.0
2.0
O2
dP/dt
400
300
200
100
6.0 8.8 11.9 21.0 O2
____________________________________________________________________________
____________________________________________________________________________
____________________________________________________________________________
Burgoyne Laboratory Barrow pellets 10kJ IgnitionThe Heath 17-Oct-02
T E S T R E S U L T S
Test No. Conc. Pex dP/dt t1 tv eff IE O2(Series) [g/m3] [bar] [bar/s] [ms] [ms] [J] [%]
1 (-) 0 1.2 0 49 60 10k 21.0 Blank 2 (1) 1000 5.9 <280> <56> 60 10k 21.0 Propagation 3 (1) 1000 3.8 65 108 60 10k 11.9 Propagation 4 (1) 1000 3.1 18 232 60 10k 10.0 Propagation 5 (-) 1000 1.7 13 238 59 10k 8.8 Propagation? 6 (1) 500 3.9 57 135 60 10k 8.8 Propagation 7 (1) 500 3.0 22 193 60 10k 7.8 Propagation 8 (1) 500 2.5 19 283 60 10k 7.3 Propagation 9 (1) 500 2.1 21 283 60 10k 6.0 Propagation
Comments:

APPENDIX 3
DATA SHEETS FOR EFFECT OF TEMPERATURE ON LOC

____________________________________________________________________________
__________________________________
____________________________________________________________________________
____________________________________________________________________________
____________________________________________________________________________
Burgoyne Laboratory 17-Oct-02The Heath File: K011105A.XYZ
LIMITING OXYGEN CONCENTRATION
SampleClientSample PreparationMedian Particle SizeMoisture ContentAmbient Temperature
: Barrow pellets @25° C : HSE : milled and sieved below 250µ m : 63 - 90µ m : 6.4% w/w : 25° C
Apparatus : 20-l-sphereIgnition source : 2 x 1 kJ chemical ignitersDust-dispersion system : rebound nozzle
Limiting Oxygen Concentration : 7.8% - 9.2% v/v
Pex
8.0
6.0
4.0
2.0
7.8 9.9 12.3 21.0 O2
dP/dt
100
75
50
25
7.8 9.9 12.3 21.0 O2
____________________________________________________________________________
____________________________________________________________________________
____________________________________________________________________________
Burgoyne Laboratory Barrow pellets @25° C The Heath 17-Oct-02
T E S T R E S U L T S
Test No. Conc. Pex dP/dt t1 tv eff IE O2(Series) [g/m3] [bar] [bar/s] [ms] [ms] [J] [%]
3 (-) 0 .3 0 20 60 2k 21.0 blank 5 (1) 500 5.1 <102> 118 60 2k 21.0 propagation 6 (1) 500 .5 13 48 59 2k 12.3 propagation 7 (-) 500 .3 0 65 60 2k 10.8 no propagation 8 (1) 750 1.1 13 154 61 2k 10.8 propagation 9 (1) 750 .6 8 12 60 2k 9.9 propagation 10 (-) 750 .5 0 11 60 2k 9.2 no propagation 11 (-) 1000 .4 0 12 60 2k 9.2 no propagation 12 (1) 250 1.4 6 11 60 2k 9.2 propagation? 13 (1) 500 .7 8 138 60 2k 9.2 propagation 14 (1) 500 .3 0 62 60 2k 7.8 no propagation 15 (1) 250 .4 0 48 60 2k 7.8 no propagation 16 (1) 125 .3 0 34 60 2k 7.8 no propagation 17 (1) 750 .4 0 <9> 60 2k 7.8 no propagation 18 (1) 1000 .3 0 22 60 2k 7.8 no propagation
Comments:
PDC
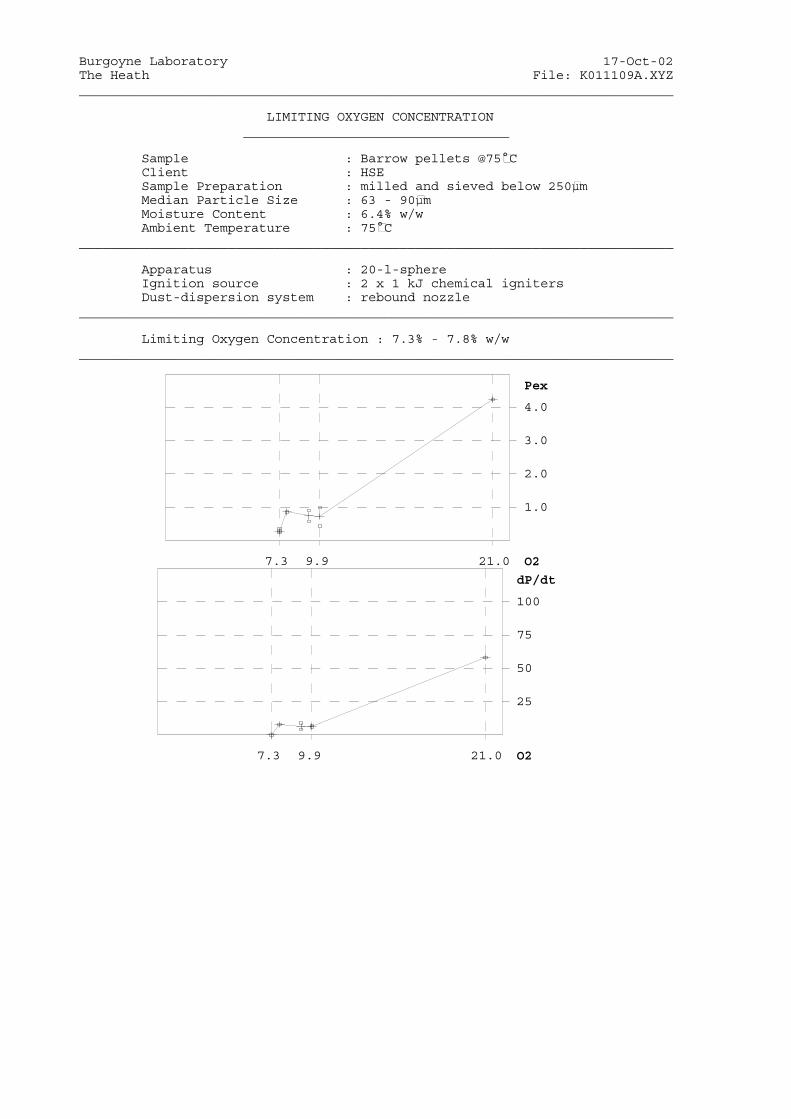
____________________________________________________________________________
__________________________________
____________________________________________________________________________
____________________________________________________________________________
____________________________________________________________________________
Burgoyne Laboratory 17-Oct-02The Heath File: K011109A.XYZ
LIMITING OXYGEN CONCENTRATION
SampleClientSample PreparationMedian Particle SizeMoisture ContentAmbient Temperature
: Barrow pellets @75° C : HSE : milled and sieved below 250µ m : 63 - 90µ m : 6.4% w/w : 75° C
Apparatus : 20-l-sphereIgnition source : 2 x 1 kJ chemical ignitersDust-dispersion system : rebound nozzle
Limiting Oxygen Concentration : 7.3% - 7.8% w/w
Pex
4.0
3.0
2.0
1.0
7.3 9.9 21.0 O2
dP/dt
100
75
50
25
7.3 9.9 21.0 O2
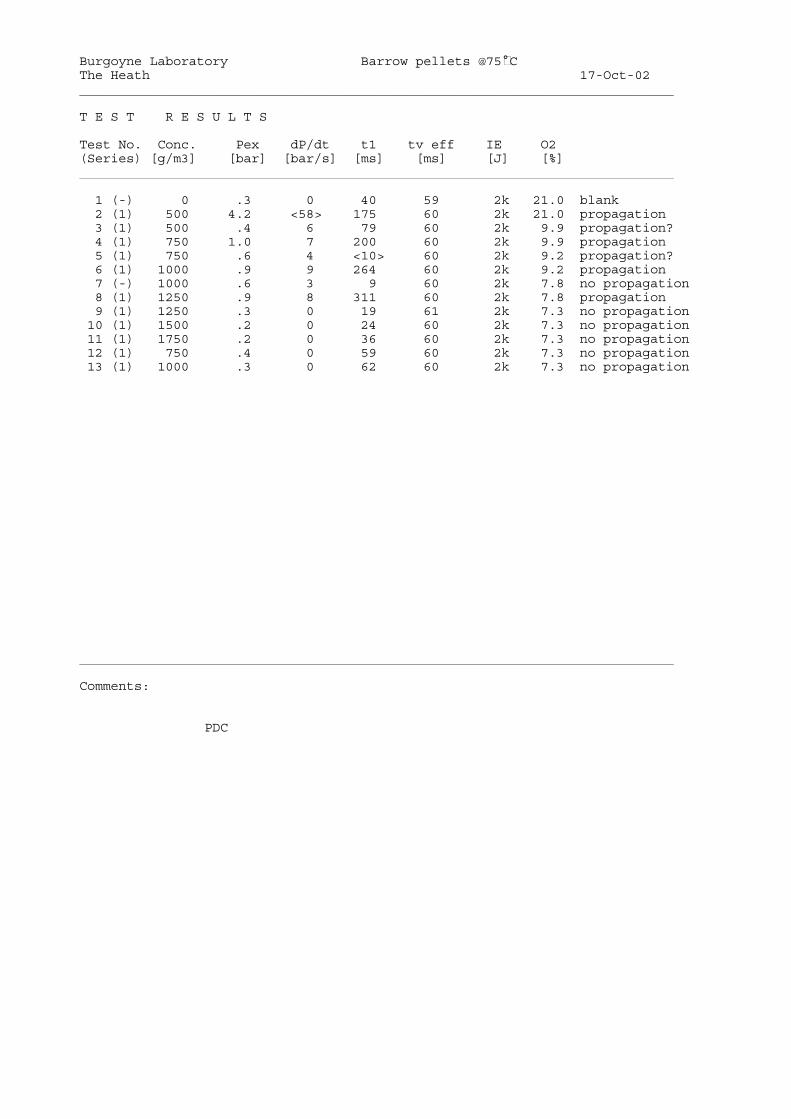
____________________________________________________________________________
____________________________________________________________________________
____________________________________________________________________________
Burgoyne Laboratory Barrow pellets @75° C The Heath 17-Oct-02
T E S T R E S U L T S
Test No. Conc. Pex dP/dt t1 tv eff IE O2(Series) [g/m3] [bar] [bar/s] [ms] [ms] [J] [%]
1 (-) 0 .3 0 40 59 2k 21.0 blank 2 (1) 500 4.2 <58> 175 60 2k 21.0 propagation 3 (1) 500 .4 6 79 60 2k 9.9 propagation? 4 (1) 750 1.0 7 200 60 2k 9.9 propagation 5 (1) 750 .6 4 <10> 60 2k 9.2 propagation? 6 (1) 1000 .9 9 264 60 2k 9.2 propagation 7 (-) 1000 .6 3 9 60 2k 7.8 no propagation 8 (1) 1250 .9 8 311 60 2k 7.8 propagation 9 (1) 1250 .3 0 19 61 2k 7.3 no propagation 10 (1) 1500 .2 0 24 60 2k 7.3 no propagation 11 (1) 1750 .2 0 36 60 2k 7.3 no propagation 12 (1) 750 .4 0 59 60 2k 7.3 no propagation 13 (1) 1000 .3 0 62 60 2k 7.3 no propagation
Comments:
PDC

____________________________________________________________________________
__________________________________
____________________________________________________________________________
____________________________________________________________________________
____________________________________________________________________________
Burgoyne Laboratory 17-Oct-02The Heath File: K011112A.XYZ
LIMITING OXYGEN CONCENTRATION
SampleClientSample PreparationMedian Particle SizeMoisture ContentAmbient Temperature
: Barrow pellets @ 125° C : HSE : milled and sieved below 250µ m : 63 - 90µ m : 6.4% w/w : 125° C
Apparatus : 20-l-sphereIgnition source : 2 x 1 kJ chemical ignitersDust-dispersion system : rebound nozzle
Limiting Oxygen Concentration : 7.3% - 8.0% v/v
Pm
4.0
3.0
2.0
1.0
7.3 21.0 O2
dP/dt
100
75
50
25
7.3 21.0 O2
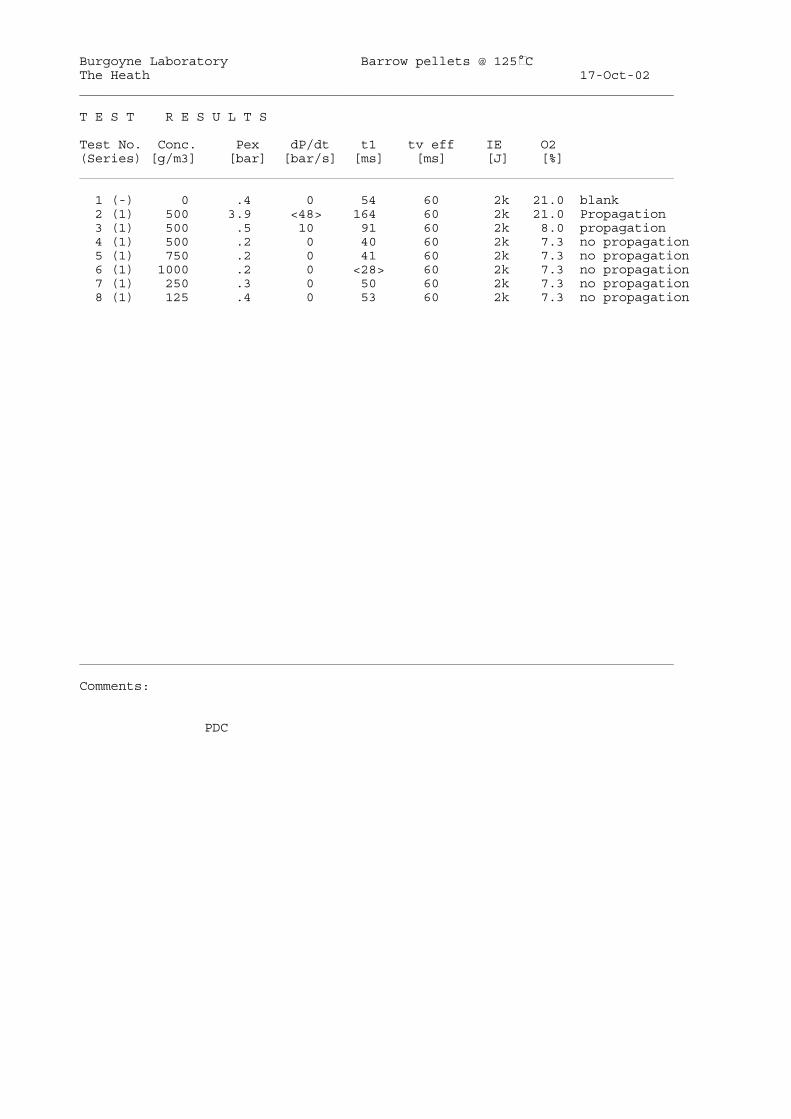
____________________________________________________________________________
____________________________________________________________________________
____________________________________________________________________________
Burgoyne Laboratory Barrow pellets @ 125° C The Heath 17-Oct-02
T E S T R E S U L T S
Test No. Conc. Pex dP/dt t1 tv eff IE O2(Series) [g/m3] [bar] [bar/s] [ms] [ms] [J] [%]
1 (-) 0 .4 0 54 60 2k 21.0 blank 2 (1) 500 3.9 <48> 164 60 2k 21.0 Propagation 3 (1) 500 .5 10 91 60 2k 8.0 propagation 4 (1) 500 .2 0 40 60 2k 7.3 no propagation 5 (1) 750 .2 0 41 60 2k 7.3 no propagation 6 (1) 1000 .2 0 <28> 60 2k 7.3 no propagation 7 (1) 250 .3 0 50 60 2k 7.3 no propagation 8 (1) 125 .4 0 53 60 2k 7.3 no propagation
Comments:
PDC
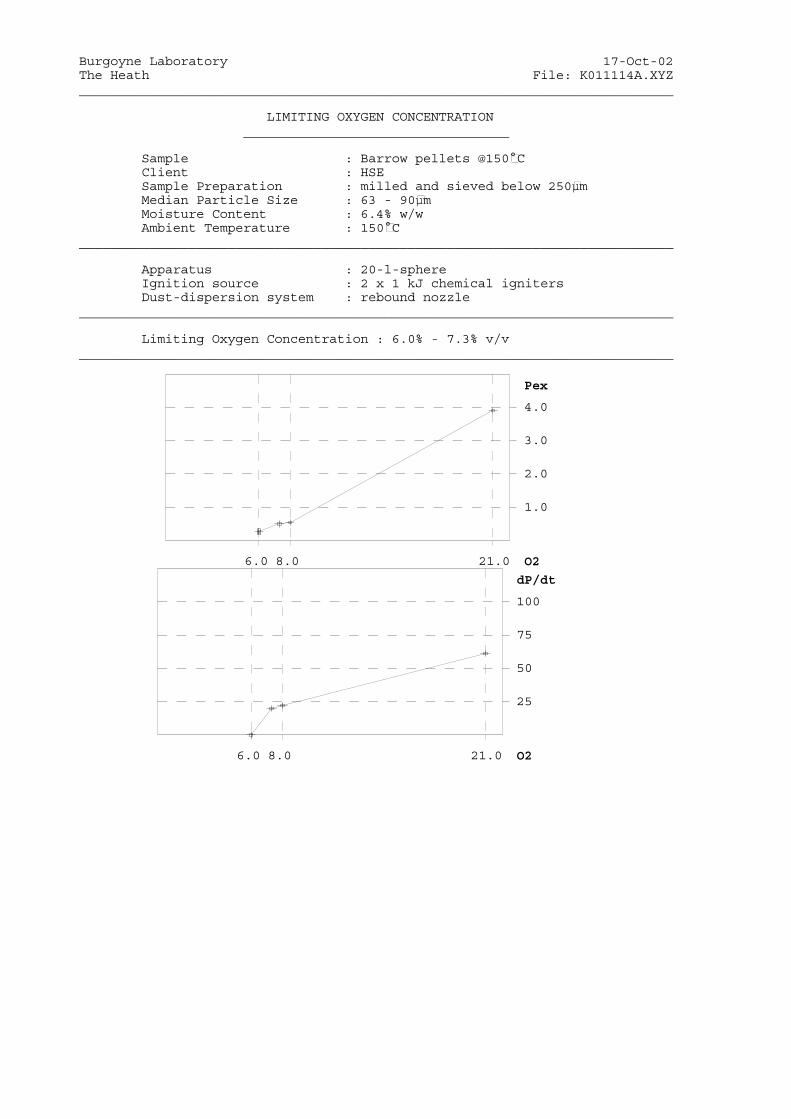
____________________________________________________________________________
__________________________________
____________________________________________________________________________
____________________________________________________________________________
____________________________________________________________________________
Burgoyne Laboratory 17-Oct-02The Heath File: K011114A.XYZ
LIMITING OXYGEN CONCENTRATION
SampleClientSample PreparationMedian Particle SizeMoisture ContentAmbient Temperature
: Barrow pellets @150° C : HSE : milled and sieved below 250µ m : 63 - 90µ m : 6.4% w/w : 150° C
Apparatus : 20-l-sphereIgnition source : 2 x 1 kJ chemical ignitersDust-dispersion system : rebound nozzle
Limiting Oxygen Concentration : 6.0% - 7.3% v/v
Pex
4.0
3.0
2.0
1.0
6.0 8.0 21.0 O2
dP/dt
100
75
50
25
6.0 8.0 21.0 O2

____________________________________________________________________________
____________________________________________________________________________
____________________________________________________________________________
Burgoyne Laboratory Barrow pellets @150° C The Heath 17-Oct-02
T E S T R E S U L T S
Test No. Conc. Pex dP/dt t1 tv eff IE O2(Series) [g/m3] [bar] [bar/s] [ms] [ms] [J] [%]
1 (-) 0 1.4 8 234 59 2k 21.0 blank residues 2 (-) 0 .3 0 41 60 2k .0 rpt blank 3 (1) 500 3.9 <61> 132 59 2k 21.0 Propagation 4 (1) 500 .6 22 118 60 2k 8.0 propagation 5 (1) 750 .5 20 225 59 2k 7.3 propagation 6 (1) 750 .3 0 55 59 2k 6.0 no propagation 7 (1) 1000 .2 0 <26> 60 2k 6.0 no propagation 8 (1) 1250 .3 0 29 60 2k 6.0 no propagation 9 (1) 250 .3 0 48 60 2k 6.0 no propagation 10 (1) 500 .3 0 44 59 2k 6.0 no propagation
Comments:
PDC

____________________________________________________________________________
__________________________________
____________________________________________________________________________
____________________________________________________________________________
____________________________________________________________________________
Burgoyne Laboratory 17-Oct-02The Heath File: K011122A.XYZ
LIMITING OXYGEN CONCENTRATION
SampleClientSample PreparationMedian Particle SizeMoisture ContentAmbient Temperature
: Workington pellets @25° C : HSE : milled and sieved below 250µ m : 63 - 90µ m : 5.9% w/w : 25° C
Apparatus : 20-l-sphereIgnition source : 2 x 1 kJ chemical ignitersDust-dispersion system : rebound nozzle
Limiting Oxygen Concentration : 7.3% - 7.8% v/v
Pex
8.0
6.0
4.0
2.0
7.3 21.0 O2
dP/dt
200
150
100
50
7.3 21.0 O2

____________________________________________________________________________
____________________________________________________________________________
____________________________________________________________________________
Burgoyne Laboratory Workington pellets @25° C The Heath 17-Oct-02
T E S T R E S U L T S
Test No. Conc. Pex dP/dt t1 tv eff IE O2(Series) [g/m3] [bar] [bar/s] [ms] [ms] [J] [%]
1 (-) 0 .9 0 9 60 2k 21.0 blank 2 (-) 0 .3 0 10 60 2k 21.0 repeat blank 3 (1) 500 5.4 <148> 99 59 2k 21.0 propagation 4 (1) 500 1.0 8 148 60 2k 9.2 propagation 5 (1) 500 .5 12 79 60 2k 7.8 propagation 6 (1) 500 .3 0 10 60 2k 7.3 no propagation 7 (1) 750 .4 2 75 60 2k 7.3 no propagation 8 (1) 1000 .4 0 14 60 2k 7.3 no propagation 9 (1) 750 .4 0 <8> 59 2k 7.3 rpt no propagation 10 (-) 125 .7 4 14 60 2k 7.3 misfire! 11 (1) 125 .5 2 10 60 2k 7.3 no propagation 12 (1) 250 .4 0 24 60 2k 7.3 no propagation
Comments:
23/11/01PDC

____________________________________________________________________________
__________________________________
____________________________________________________________________________
____________________________________________________________________________
____________________________________________________________________________
Burgoyne Laboratory 17-Oct-02The Heath File: K011126A.XYZ
LIMITING OXYGEN CONCENTRATION
°Sample : Workington pellets @75 C Client : HSE Sample Preparation : milled and sieved below 250µ m Median Particle Size : 63 - 90 µ m Moisture Content Ambient Temperature
: 5.9% w/w : 75° C
Apparatus : 20-l-sphereIgnition source : 2 x 1 kJ chemical ignitersDust-dispersion system : rebound nozzle
Limiting Oxygen Concentration : 6.0% - 7.3% v/v
6.0 21.0
Pex
4.0
3.0
2.0
1.0
O2
dP/dt
100
75
50
25
6.0 21.0 O2
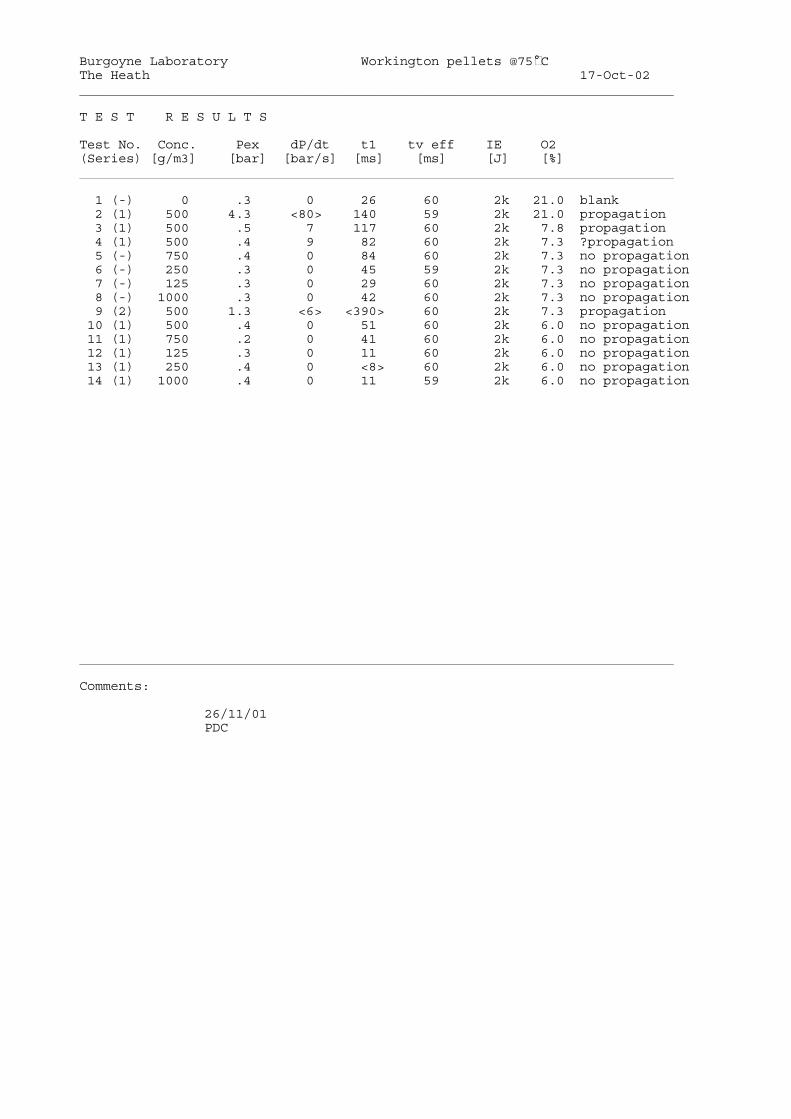
____________________________________________________________________________
____________________________________________________________________________
____________________________________________________________________________
Burgoyne Laboratory Workington pellets @75° C The Heath 17-Oct-02
T E S T R E S U L T S
Test No. Conc. Pex dP/dt t1 tv eff IE O2(Series) [g/m3] [bar] [bar/s] [ms] [ms] [J] [%]
1 (-) 0 .3 0 26 60 2k 21.0 blank 2 (1) 500 4.3 <80> 140 59 2k 21.0 propagation 3 (1) 500 .5 7 117 60 2k 7.8 propagation 4 (1) 500 .4 9 82 60 2k 7.3 ?propagation 5 (-) 750 .4 0 84 60 2k 7.3 no propagation 6 (-) 250 .3 0 45 59 2k 7.3 no propagation 7 (-) 125 .3 0 29 60 2k 7.3 no propagation 8 (-) 1000 .3 0 42 60 2k 7.3 no propagation 9 (2) 500 1.3 <6> <390> 60 2k 7.3 propagation 10 (1) 500 .4 0 51 60 2k 6.0 no propagation 11 (1) 750 .2 0 41 60 2k 6.0 no propagation 12 (1) 125 .3 0 11 60 2k 6.0 no propagation 13 (1) 250 .4 0 <8> 60 2k 6.0 no propagation 14 (1) 1000 .4 0 11 59 2k 6.0 no propagation
Comments:
26/11/01PDC

____________________________________________________________________________
__________________________________
____________________________________________________________________________
____________________________________________________________________________
____________________________________________________________________________
Burgoyne Laboratory 17-Oct-02The Heath File: K011127A.XYZ
LIMITING OXYGEN CONCENTRATION
SampleClientSample PreparationMedian Particle SizeMoisture ContentAmbient Temperature
: Workington pellets 125° C : HSE : milled & sieved below 250µ m : 63 - 90µ m : 5.9% w/w : 125° C
Apparatus : 20-l-sphereIgnition source : 2 x 1 kJ chemical ignitersDust-dispersion system : rebound nozzle
Limiting Oxygen Concentration : 5.0% - 6.0%
Pex
4.0
3.0
2.0
1.0
5.0 7.3 21.0 O2
25
50
75
100
dP/dt
5.0 7.3 21.0 O2
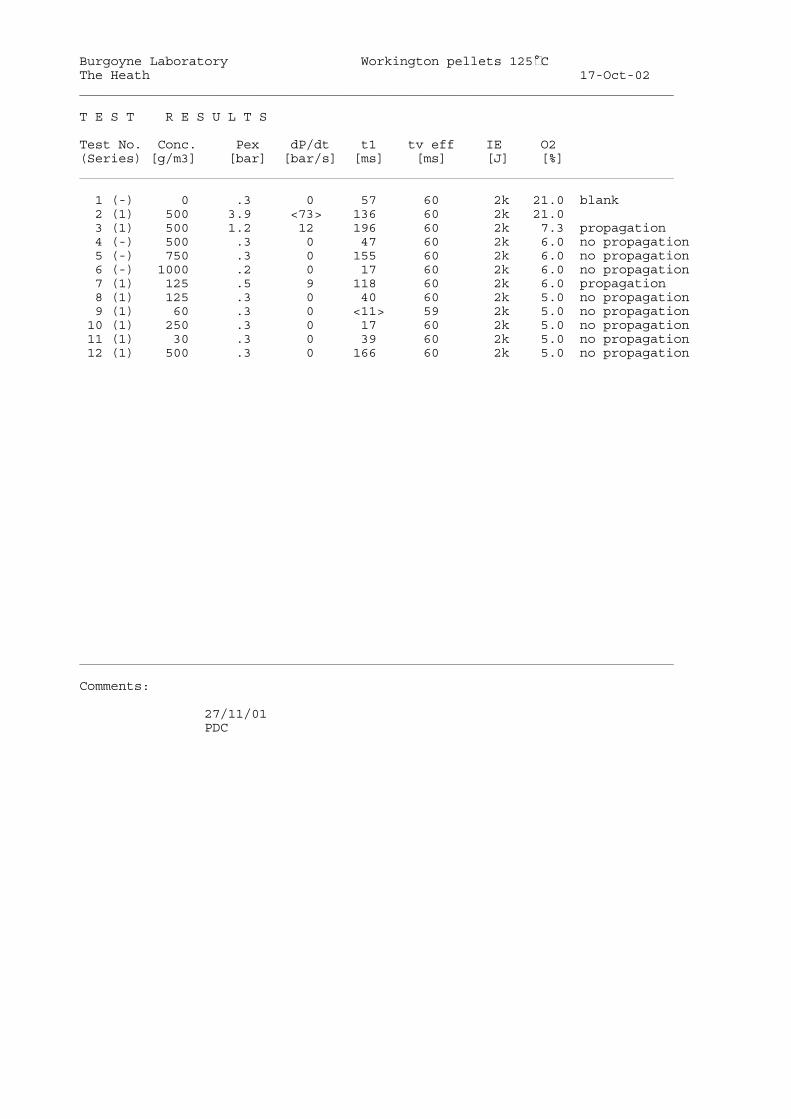
____________________________________________________________________________
____________________________________________________________________________
____________________________________________________________________________
Burgoyne Laboratory Workington pellets 125° C The Heath 17-Oct-02
T E S T R E S U L T S
Test No. Conc. Pex dP/dt t1 tv eff IE O2(Series) [g/m3] [bar] [bar/s] [ms] [ms] [J] [%]
1 (-) 0 .3 0 57 60 2k 21.0 blank 2 (1) 500 3.9 <73> 136 60 2k 21.0 3 (1) 500 1.2 12 196 60 2k 7.3 propagation 4 (-) 500 .3 0 47 60 2k 6.0 no propagation 5 (-) 750 .3 0 155 60 2k 6.0 no propagation 6 (-) 1000 .2 0 17 60 2k 6.0 no propagation 7 (1) 125 .5 9 118 60 2k 6.0 propagation 8 (1) 125 .3 0 40 60 2k 5.0 no propagation 9 (1) 60 .3 0 <11> 59 2k 5.0 no propagation 10 (1) 250 .3 0 17 60 2k 5.0 no propagation 11 (1) 30 .3 0 39 60 2k 5.0 no propagation 12 (1) 500 .3 0 166 60 2k 5.0 no propagation
Comments:
27/11/01PDC
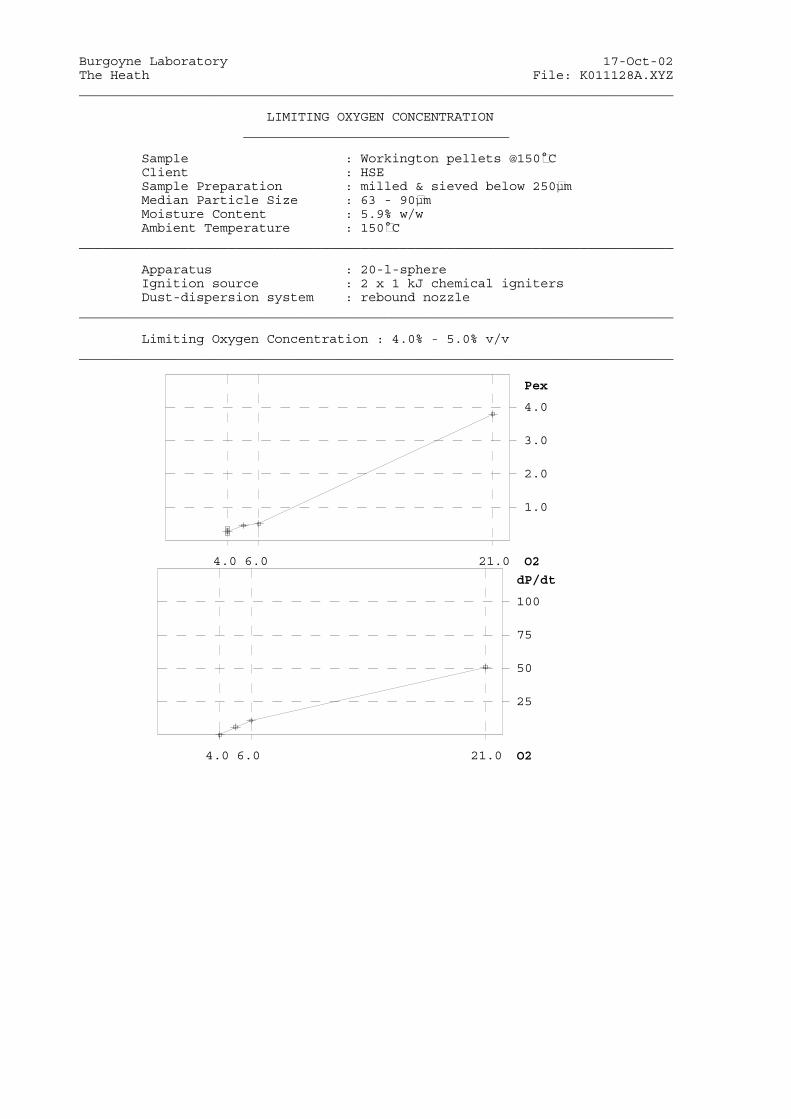
____________________________________________________________________________
__________________________________
____________________________________________________________________________
____________________________________________________________________________
____________________________________________________________________________
Burgoyne Laboratory 17-Oct-02The Heath File: K011128A.XYZ
LIMITING OXYGEN CONCENTRATION
SampleClientSample PreparationMedian Particle SizeMoisture ContentAmbient Temperature
: Workington pellets @150° C : HSE : milled & sieved below 250µ m : 63 - 90µ m : 5.9% w/w : 150° C
Apparatus : 20-l-sphereIgnition source : 2 x 1 kJ chemical ignitersDust-dispersion system : rebound nozzle
Limiting Oxygen Concentration : 4.0% - 5.0% v/v
Pex
4.0
3.0
2.0
1.0
4.0 6.0 21.0 O2
25
50
75
100
dP/dt
4.0 6.0 21.0 O2
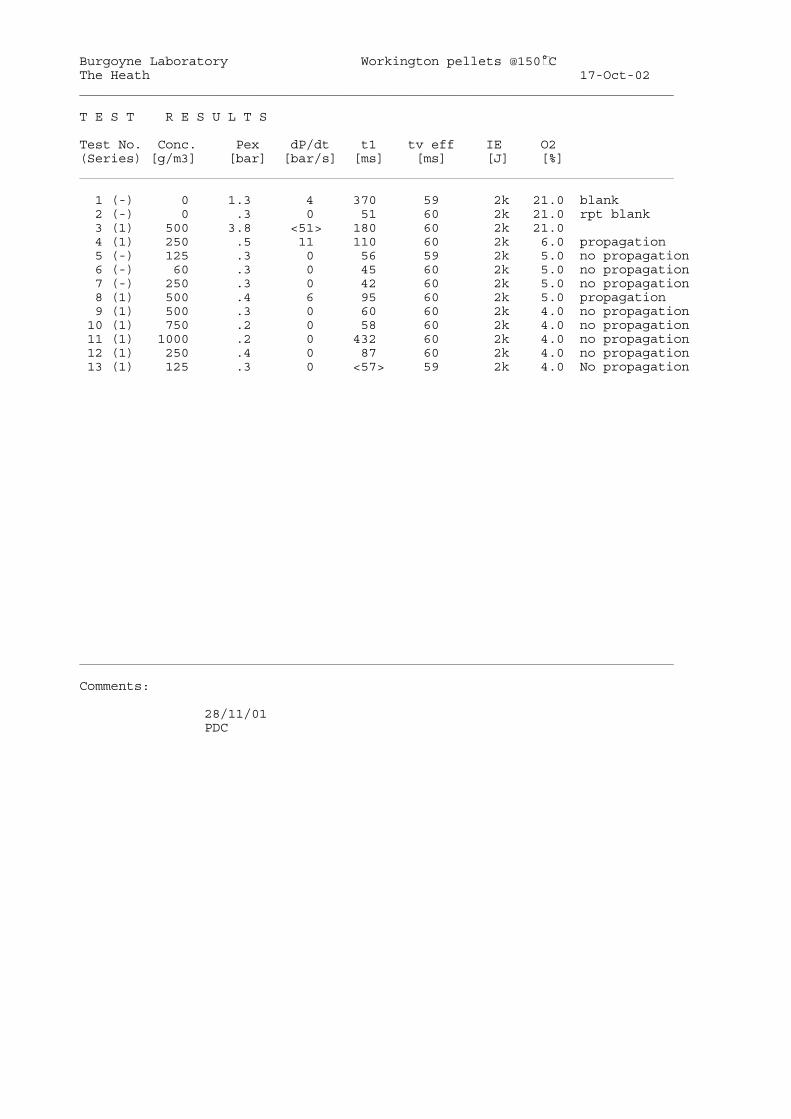
____________________________________________________________________________
____________________________________________________________________________
____________________________________________________________________________
Burgoyne Laboratory Workington pellets @150° C The Heath 17-Oct-02
T E S T R E S U L T S
Test No. Conc. Pex dP/dt t1 tv eff IE O2(Series) [g/m3] [bar] [bar/s] [ms] [ms] [J] [%]
1 (-) 0 1.3 4 370 59 2k 21.0 blank 2 (-) 0 .3 0 51 60 2k 21.0 rpt blank 3 (1) 500 3.8 <51> 180 60 2k 21.0 4 (1) 250 .5 11 110 60 2k 6.0 propagation 5 (-) 125 .3 0 56 59 2k 5.0 no propagation 6 (-) 60 .3 0 45 60 2k 5.0 no propagation 7 (-) 250 .3 0 42 60 2k 5.0 no propagation 8 (1) 500 .4 6 95 60 2k 5.0 propagation 9 (1) 500 .3 0 60 60 2k 4.0 no propagation 10 (1) 750 .2 0 58 60 2k 4.0 no propagation 11 (1) 1000 .2 0 432 60 2k 4.0 no propagation 12 (1) 250 .4 0 87 60 2k 4.0 no propagation 13 (1) 125 .3 0 <57> 59 2k 4.0 No propagation
Comments:
28/11/01PDC

____________________________________________________________________________
__________________________________
____________________________________________________________________________
____________________________________________________________________________
____________________________________________________________________________
Burgoyne Laboratory 17-Oct-02The Heath File: K011218A.XYZ
LIMITING OXYGEN CONCENTRATION
SampleClientSample PreparationMedian Particle SizeMoisture ContentAmbient Temperature
: Workington pellets @25° C (1kJ) : HSE : milled and sieved below 250 µ m : 63 - 90 µ m : 5.9% w/w : 25° C
Apparatus : 20-l-sphereIgnition source : 2 x 500 J chemical ignitersDust-dispersion system : rebound nozzle
Limiting Oxygen Concentration : 8.0 - 9.2% w/w
Pex
8.0
6.0
4.0
2.0
8.0 21.0 O2
dP/dt
200
150
100
50
8.0 21.0 O2

____________________________________________________________________________
____________________________________________________________________________
____________________________________________________________________________
Burgoyne Laboratory Workington pellets @25° C (1kJ)The Heath 17-Oct-02
T E S T R E S U L T S
Test No. Conc. Pex dP/dt t1 tv eff IE O2(Series) [g/m3] [bar] [bar/s] [ms] [ms] [J] [%]
1 (-) 0 .4 12 14 60 1k 21.0 blank 2 (1) 500 5.3 <114> 109 60 1k 21.0 3 (-) 500 .2 0 26 60 1k 9.2 no propagation 4 (-) 250 .2 0 36 59 1k 9.2 no propagation 5 (-) 750 .3 3 11 59 1k 9.2 propagation? 6 (1) 500 .2 0 60 60 1k 8.0 no propagation? 7 (1) 500 .2 0 16 59 1k 8.0 no propagation 8 (-) 750 .0 0 0 60 1k 8.0 connection out 9 (1) 750 .4 0 21 60 1k 8.0 no propagation
10 (1) 1000 .2 0 41 60 1k 8.0 no propagation 11 (1) 250 .4 0 <9> 60 1k 8.0 no propagation 12 (1) 125 .4 0 13 60 1k 8.0 no propagation 14 (-) 750 .1 0 28 59 1k 9.2 no propagation 15 (2) 1000 .8 <4> <269> 60 1k 9.2 propagation
Comments:
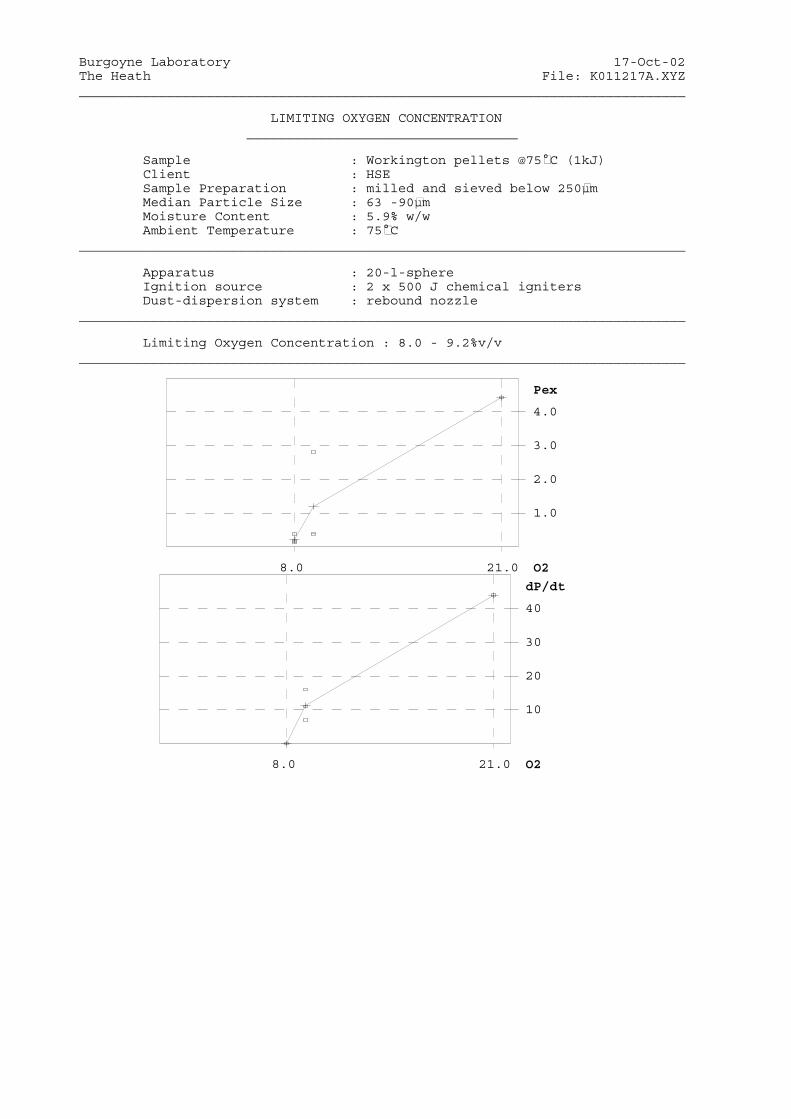
____________________________________________________________________________
__________________________________
____________________________________________________________________________
____________________________________________________________________________
____________________________________________________________________________
Burgoyne Laboratory 17-Oct-02The Heath File: K011217A.XYZ
LIMITING OXYGEN CONCENTRATION
SampleClientSample PreparationMedian Particle SizeMoisture ContentAmbient Temperature
: Workington pellets @75° C (1kJ) : HSE : milled and sieved below 250µ m : 63 -90µ m : 5.9% w/w : 75° C
Apparatus : 20-l-sphereIgnition source : 2 x 500 J chemical ignitersDust-dispersion system : rebound nozzle
Limiting Oxygen Concentration : 8.0 - 9.2%v/v
8.0 21.0
8.0 21.0
Pex
4.0
3.0
2.0
1.0
O2
dP/dt
40
30
20
10
O2
____________________________________________________________________________
____________________________________________________________________________
____________________________________________________________________________
Burgoyne Laboratory Workington pellets @75° C (1kJ)The Heath 17-Oct-02
T E S T R E S U L T S
Test No. Conc. Pex dP/dt t1 tv eff IE O2(Series) [g/m3] [bar] [bar/s] [ms] [ms] [J] [%]
1 (-) 0 2.2 5 581 60 1k 21.0 blank 2 (-) 0 .3 7 9 60 1k 21.0 repeat 3 (1) 500 4.4 <44> 213 60 1k 21.0 4 (-) 500 .3 8 71 60 1k 8.0 propagation? 5 (-) 500 .4 0 28 60 1k 7.3 no propagation 6 (-) 750 .2 0 10 60 1k 7.3 no propagation 7 (-) 1000 .2 0 29 59 1k 7.3 no propagation 8 (-) 250 .2 0 49 60 1k 7.3 no propagation 9 (-) 125 .4 0 11 60 1k 7.3 no propagation
10 (2) 500 .2 0 <31> 59 1k 8.0 no propagation 11 (1) 750 .2 0 48 60 1k 8.0 no propagation 12 (1) 1000 .1 0 34 59 1k 8.0 no propagation 13 (1) 125 .2 0 37 60 1k 8.0 no propagation 14 (1) 250 .4 0 <10> 59 1k 8.0 no propagation 15 (-) 500 .2 0 51 59 1k 9.2 no propagation 16 (-) 250 .3 0 10 60 1k 9.2 no propagation 17 (1) 750 .4 7 114 59 1k 9.2 propagation 18 (1) 1000 2.8 16? 496 60 1k 9.2 propagation 19 (2) 1000 .4 <11> 92 60 1k 9.2 propagation
Comments:

____________________________________________________________________________
__________________________________
____________________________________________________________________________
____________________________________________________________________________
____________________________________________________________________________
Burgoyne Laboratory 17-Oct-02The Heath File: K011214A.XYZ
LIMITING OXYGEN CONCENTRATION
SampleClientSample PreparationMedian Particle SizeMoisture ContentAmbient Temperature
: Workington pellets@125° C (1kJ) : HSE : milled and sieved below 250µ m : 63 - 90µ m : 5.9% w/w : 125° C
Apparatus : 20-l-sphereIgnition source : 2 x 500 J chemical ignitersDust-dispersion system : rebound nozzle
Limiting Oxygen Concentration : 8.0 - 9.2% v/v
Pex
8.0
6.0
4.0
2.0
8.0 21.0 O2
dP/dt
200
150
100
50
8.0 21.0 O2
____________________________________________________________________________
____________________________________________________________________________
____________________________________________________________________________
Burgoyne Laboratory Workington pellets@125° C (1kJ)The Heath 17-Oct-02
T E S T R E S U L T S
Test No. Conc. Pex dP/dt t1 tv eff IE O2(Series) [g/m3] [bar] [bar/s] [ms] [ms] [J] [%]
1 (-) 0 .3 0 14 60 1k 21.0 blank 2 (1) 500 4.6 <159> 90 60 1k 21.0 3 (1) 500 .6 7 197 60 1k 9.9 propagation 4 (1) 500 .9 6 253 60 1k 9.2 propagation 5 (1) 500 .2 0 31 60 1k 8.0 no propagation 6 (1) 250 .2 0 84 60 1k 8.0 no propagation 7 (1) 750 .2 0 49 59 1k 8.0 no propagation 8 (1) 1000 .2 0 66 60 1k 8.0 no propagation 9 (1) 125 .4 2 <8> 60 1k 8.0 no propagation
Comments:

____________________________________________________________________________
__________________________________
____________________________________________________________________________
____________________________________________________________________________
____________________________________________________________________________
Burgoyne Laboratory 17-Oct-02The Heath File: K011213A.XYZ
LIMITING OXYGEN CONCENTRATION
SampleClientSample PreparationMedian Particle SizeMoisture ContentAmbient Temperature
: Workington pellets @150° C (1kJ) : HSE : milled and sieved below 250µ m : 63 - 90µ m : 5.9% w/w : 150° C
Apparatus : 20-l-sphereIgnition source : 2 x 500 J chemical ignitersDust-dispersion system : rebound nozzle
Limiting Oxygen Concentration : 7.3% - 8.0% v/v
Pex
4.0
3.0
2.0
1.0
7.3 21.0 O2
dP/dt
100
75
50
25
7.3 21.0 O2

____________________________________________________________________________
____________________________________________________________________________
____________________________________________________________________________
Burgoyne Laboratory Workington pellets @150° C (1kJ)The Heath 17-Oct-02
T E S T R E S U L T S
Test No. Conc. Pex dP/dt t1 tv eff IE O2(Series) [g/m3] [bar] [bar/s] [ms] [ms] [J] [%]
1 (-) 0 .1 0 52 60 1k 21.0 blank 2 (1) 500 3.8 <50> 179 60 1k 21.0 3 (1) 500 .2 0 39 60 1k 7.3 no propagation 4 (1) 250 .3 2 94 60 1k 7.3 no propagation 5 (1) 125 .1 0 43 60 1k 7.3 no propagation 6 (1) 750 .2 0 <38> 59 1k 7.3 no propagation 7 (1) 1000 .2 0 73 59 1k 7.3 no propagation 8 (-) 250 .3 0 47 59 1k 8.0 ? 9 (-) 500 .2 0 45 60 1k 8.0 no propagation
10 (-) 125 .3 0 48 60 1k 8.0 ? 11 (1) 250 .5 6 151 59 1k 9.2 propagation 12 (1) 750 .4 3 275 60 1k 8.0 propagation 13 (-) 250 .2 0 45 60 1k 6.0 no propagation 14 (-) 500 .2 0 17 59 1k 6.0 no propagation 15 (-) 750 .2 0 28 60 1k 6.0 no propagation 16 (-) 1000 .1 0 18 59 1k 6.0 no propagation 17 (-) 125 .2 0 47 60 1k 6.0 no propagation
Comments:

APPENDIX 4
DATA FOR LOC WITH STEAM
____________________________________________________________________________
__________________________________
____________________________________________________________________________
____________________________________________________________________________
____________________________________________________________________________
Burgoyne Laboratory 17-Oct-02The Heath File: K020612A.XYZ
LIMITING OXYGEN CONCENTRATION
SampleClientSample PreparationMedian Particle SizeMoisture ContentAmbient Temperature
: Barrow pellets - Steam inerting : HSE : milled & sieved below 250µ m : 63 - 90µ m : 6.4%w/w : 150° C
Apparatus : 20-l-sphereIgnition source : 2 x 1 kJ chemical ignitersDust-dispersion system : rebound nozzle
Limiting Oxygen Concentration : 10.1 - 11.1%v/v
Pex
4.0
3.0
2.0
1.0
9.0 11.0 21.0 O2
dP/dt
100
75
50
25
9.0 11.0 21.0 O2
____________________________________________________________________________
____________________________________________________________________________
____________________________________________________________________________
Burgoyne Laboratory Barrow pellets - Steam inertingThe Heath 17-Oct-02
T E S T R E S U L T S
Test No. Conc. Pex dP/dt t1 tv eff IE O2(Series) [g/m3] [bar] [bar/s] [ms] [ms] [J] [%]
1 (-) 0 2.2 13 283 60 2k 21.0 blank 2 (-) 0 .5 19 10 60 2k 21.0 blank rpt 3 (1) 500 4.3 <47> 183 60 2k 21.0 propagation 4 (1) 500 .3 0 59 59 2k 12.0 no propagation 5 (1) 750 .5 2 290 59 2k 12.0 propagation 6 (1) 750 .4 0 97 60 2k 11.0 propagation 7 (1) 1000 .3 0 34 60 2k 11.0 no propagation 8 (1) 250 .4 0 77 59 2k 10.0 no propagation 9 (2) 250 .4 0 <95> 59 2k 10.0 no propagation 10 (1) 250 .3 0 54 60 2k 9.0 no propagation 11 (1) 500 .3 0 32 60 2k 9.0 no propagation 12 (1) 750 .2 0 38 60 2k 9.0 no propagation 13 (1) 1000 .2 0 585 60 2k 9.0 no propagation 14 (1) 125 .3 0 60 61 2k 9.0 no propagation 15 (1) 125 .4 2 81 59 2k 11.0 propagation 16 (1) 250 .4 0 77 60 2k 11.0 propagation ? 17 (1) 500 .6 2 130 60 2k 11.0 propagation 18 (1) 125 .3 0 69 60 2k 10.0 no propagation 19 (1) 500 .3 0 34 59 2k 10.0 no propagation 20 (1) 750 .2 0 60 61 2k 10.0 no propagation 21 (1) 1000 .2 0 <28> 60 2k 10.0 no propagation
Comments:
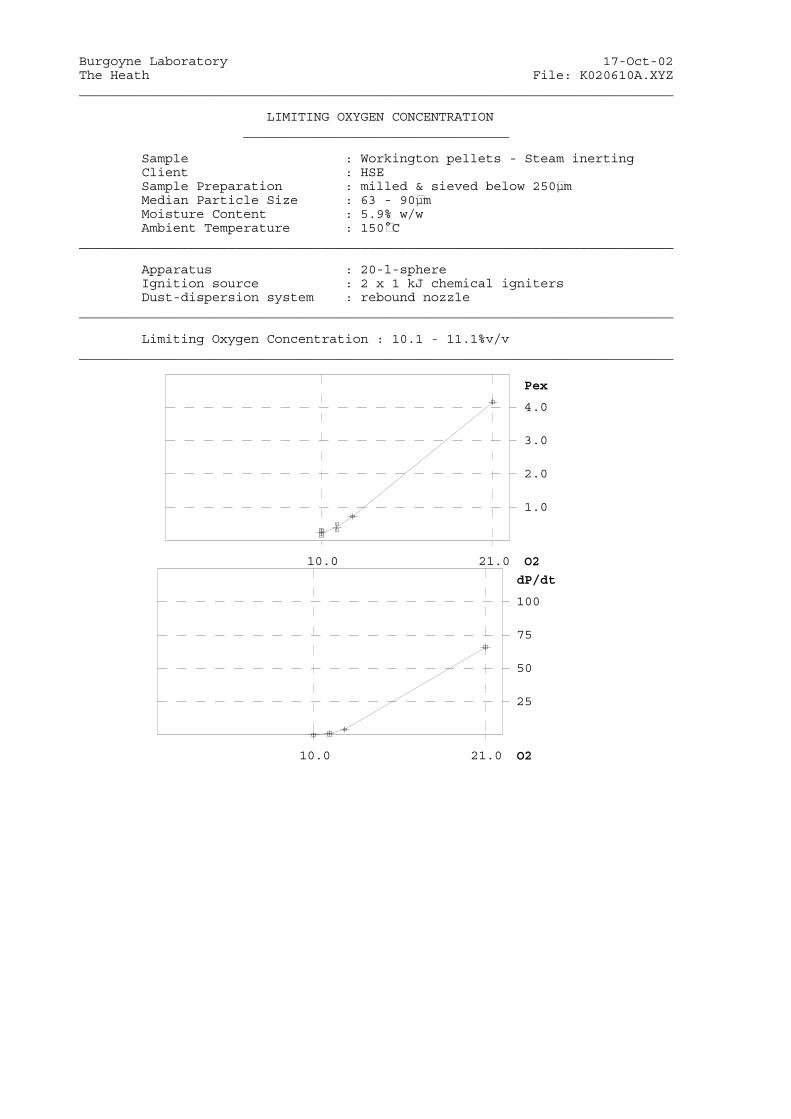
____________________________________________________________________________
__________________________________
____________________________________________________________________________
____________________________________________________________________________
____________________________________________________________________________
Burgoyne Laboratory 17-Oct-02The Heath File: K020610A.XYZ
LIMITING OXYGEN CONCENTRATION
Sample : Workington pellets - Steam inertingClient : HSE Sample Preparation : milled & sieved below 250µ m Median Particle Size : 63 - 90µ m Moisture Content Ambient Temperature
: 5.9% w/w : 150° C
Apparatus : 20-l-sphereIgnition source : 2 x 1 kJ chemical ignitersDust-dispersion system : rebound nozzle
Limiting Oxygen Concentration : 10.1 - 11.1%v/v
10.0 21.0
Pex
4.0
3.0
2.0
1.0
O2
dP/dt
100
75
50
25
10.0 21.0 O2
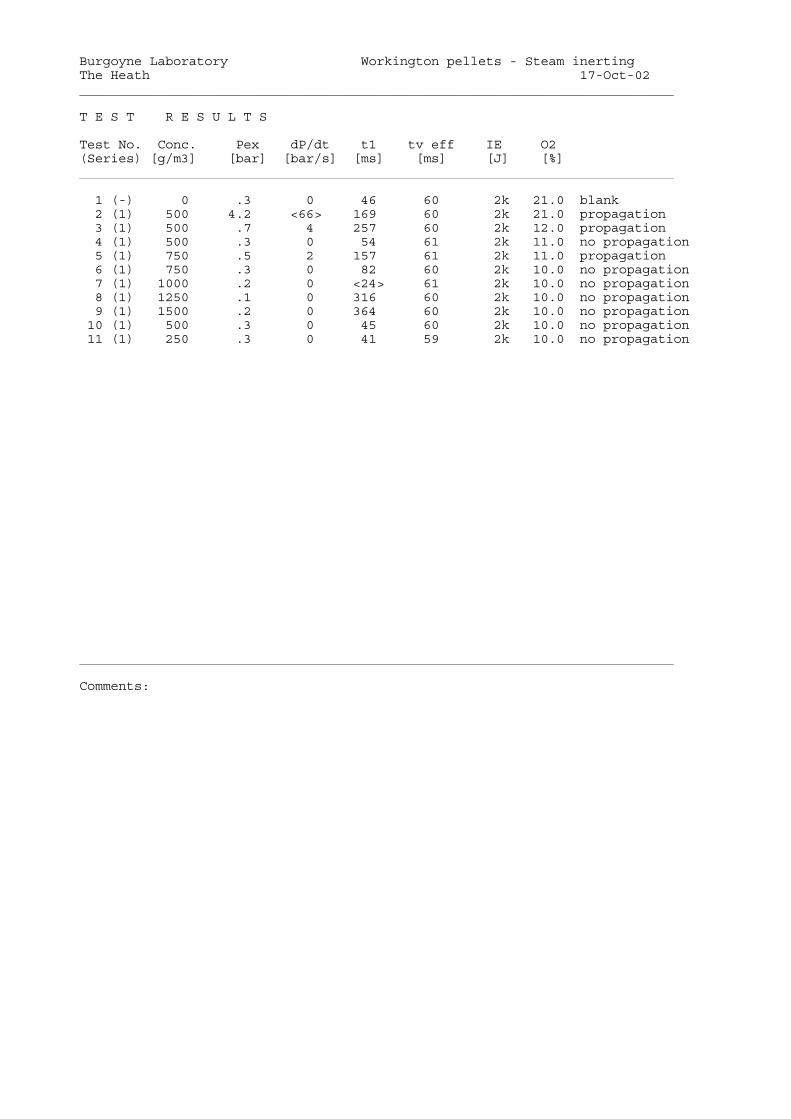
____________________________________________________________________________
____________________________________________________________________________
____________________________________________________________________________
Burgoyne Laboratory Workington pellets - Steam inertingThe Heath 17-Oct-02
T E S T R E S U L T S
Test No. Conc. Pex dP/dt t1 tv eff IE O2(Series) [g/m3] [bar] [bar/s] [ms] [ms] [J] [%]
1 (-) 0 .3 0 46 60 2k 21.0 blank 2 (1) 500 4.2 <66> 169 60 2k 21.0 propagation 3 (1) 500 .7 4 257 60 2k 12.0 propagation 4 (1) 500 .3 0 54 61 2k 11.0 no propagation 5 (1) 750 .5 2 157 61 2k 11.0 propagation 6 (1) 750 .3 0 82 60 2k 10.0 no propagation 7 (1) 1000 .2 0 <24> 61 2k 10.0 no propagation 8 (1) 1250 .1 0 316 60 2k 10.0 no propagation 9 (1) 1500 .2 0 364 60 2k 10.0 no propagation 10 (1) 500 .3 0 45 60 2k 10.0 no propagation 11 (1) 250 .3 0 41 59 2k 10.0 no propagation
Comments:

APPENDIX 5
DATA FOR LOC WITH CARBON DIOXIDE
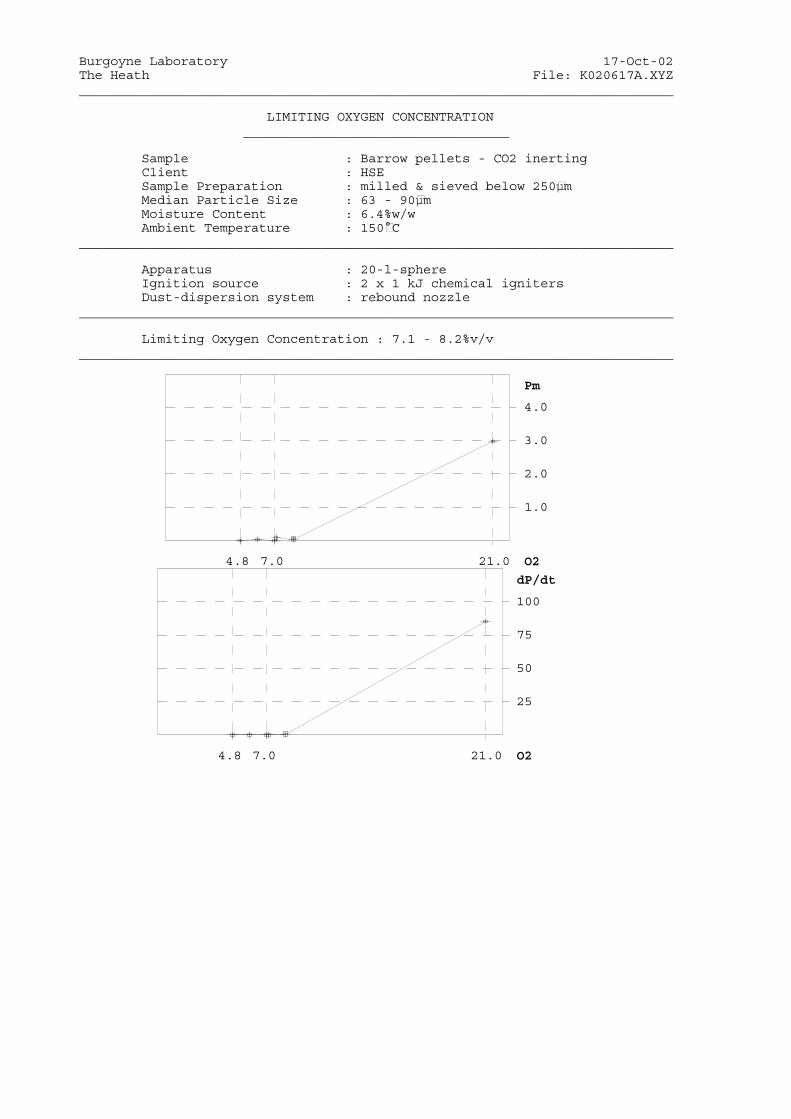
____________________________________________________________________________
__________________________________
____________________________________________________________________________
____________________________________________________________________________
____________________________________________________________________________
Burgoyne Laboratory 17-Oct-02The Heath File: K020617A.XYZ
LIMITING OXYGEN CONCENTRATION
SampleClientSample PreparationMedian Particle SizeMoisture ContentAmbient Temperature
: Barrow pellets - CO2 inerting : HSE : milled & sieved below 250µ m : 63 - 90µ m : 6.4%w/w : 150° C
Apparatus : 20-l-sphereIgnition source : 2 x 1 kJ chemical ignitersDust-dispersion system : rebound nozzle
Limiting Oxygen Concentration : 7.1 - 8.2%v/v
Pm
4.0
3.0
2.0
1.0
4.8 7.0 21.0 O2
25
50
75
100
dP/dt
4.8 7.0 21.0 O2

____________________________________________________________________________
____________________________________________________________________________
____________________________________________________________________________
Burgoyne Laboratory Barrow pellets - CO2 inertingThe Heath 17-Oct-02
T E S T R E S U L T S
Test No. Conc. Pex dP/dt t1 tv eff IE O2(Series) [g/m3] [bar] [bar/s] [ms] [ms] [J] [%]
1 (-) 0 .3 0 74 59 2k 21.0 blank 2 (1) 500 3.1 <85> 111 59 2k 21.0 3 (-) 500 .2 0 54 59 2k 8.2 wrong vac (0.05)!!!! 4 (1) 500 .4 2 93 60 2k 8.2 propagation 5 (1) 500 .4 0 114 60 2k 7.1 no propagation? 6 (1) 500 .4 0 93 60 2k 5.9 no propagation? 7 (-) 0 .4 14 9 61 2k 5.9 CO2 blank! 8 (1) 500 .3 0 55 60 2k 4.8 no propagation 9 (1) 750 .2 0 60 59 2k 4.8 no propagation 10 (1) 1000 .2 0 328 60 2k 4.8 no propagation 11 (1) 250 .3 0 61 59 2k 4.8 no propagation 12 (1) 125 .2 0 44 59 2k 4.8 no propagation 13 (1) 125 .3 0 43 60 2k 8.2 no propagation 14 (1) 250 .3 0 42 60 2k 8.2 no propagation 15 (-) 750 .3 0 76 60 2k 8.2 no propagation 16 (2) 500 .4 0 83 60 2k 8.2 propagation 17 (1) 125 .2 0 45 60 2k 7.0 no propagation 18 (1) 250 .3 0 <39> 60 2k 7.0 no propagation 19 (2) 500 .3 0 <41> 59 2k 7.0 no propagation 20 (1) 750 .3 0 52 59 2k 7.0 no propagation 21 (1) 1000 .3 0 74 60 2k 7.0 no propagation
Comments:

____________________________________________________________________________
__________________________________
____________________________________________________________________________
____________________________________________________________________________
____________________________________________________________________________
Burgoyne Laboratory 17-Oct-02The Heath File: K020618A.XYZ
LIMITING OXYGEN CONCENTRATION
Sample : Workington pellets - CO2 inerting Client : HSE Sample Preparation : milled & sieved below 250µ m Median Particle Size : 63 -90µ m Moisture Content : 5.9% w/w Ambient Temperature : 150° C
Apparatus : 20-l-sphereIgnition source : 2 x 1 kJ chemical ignitersDust-dispersion system : rebound nozzle
Limiting Oxygen Concentration : 4.8 - 5.9%v/v
Pex
8.0
6.0
4.0
2.0
4.8 7.1 21.0 O2
50
100
150
200
dP/dt
4.8 7.1 21.0 O2

____________________________________________________________________________
____________________________________________________________________________
____________________________________________________________________________
Burgoyne Laboratory Workington pellets - CO2 inertingThe Heath 17-Oct-02
T E S T R E S U L T S
Test No. Conc. Pex dP/dt t1 tv eff IE O2(Series) [g/m3] [bar] [bar/s] [ms] [ms] [J] [%]
1 (-) 0 .3 20 54 60 2k 21.0 blank 2 (1) 500 4.7 <135> 112 60 2k 21.0 propagation 3 (1) 500 .5 4 84 60 2k 8.2 propagation 4 (1) 500 .5 2 102 59 2k 7.1 propagation 5 (1) 500 .4 2 105 60 2k 5.9 propagation? 6 (1) 500 .3 0 143 60 2k 4.8 no propagation 7 (1) 750 .2 0 325 60 2k 4.8 no propagation 8 (1) 250 .2 0 <44> 59 2k 4.8 no propagation 9 (1) 125 .3 0 78 59 2k 4.8 no propagation 10 (1) 1000 .3 0 386 60 2k 4.8 no propagation 11 (1) 1250 .2 0 368 61 2k 4.8 no propagation 12 (-) 0 .3 18 20 60 2k 4.8 CO2 blank
Comments:
APPENDIX 6
POWDER LAYER IGNITION TEMPERATURE DATA

LIT
Bar
row
Sew
age
Slu
dge
300C
15m
m la
yer
21%
oxy
gen
TE M P E R A T U R E ( degC ) 600
500
400
300
200
100 0
0 10
20
30
40
50
60
70
80
90
100
ELA
PS
ED
TIM
E
(min
s)
lle
Hot
pat
e sa
mp

LIT
Bar
row
Sew
age
Slu
dge
290C
15m
m la
yer
21%
oxy
gen
TE M P E R A T U R E ( degC ) 600
500
400
300
200
100 0
0 10
20
30
40
50
60
70
80
90
100
ELA
PS
ED
TIM
E
(min
s)
lle
Hot
pat
e S
amp
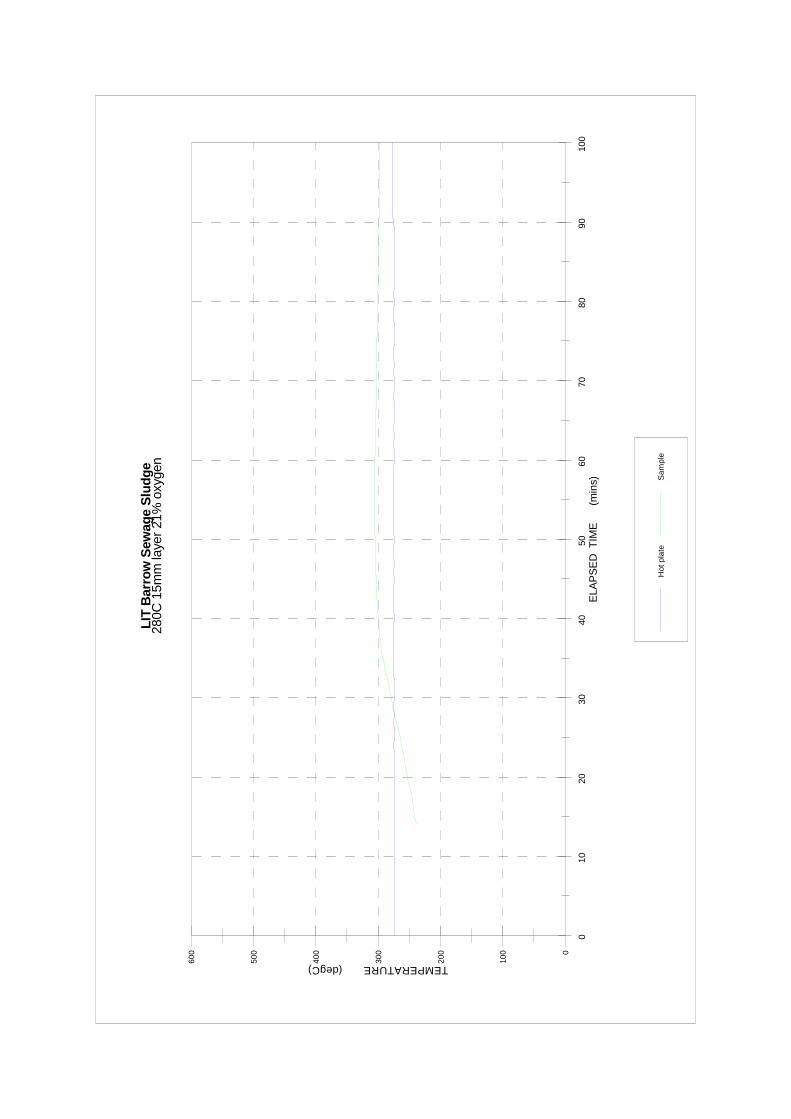
LIT
Bar
row
Sew
age
Slu
dge
280C
15m
m la
yer
21%
oxy
gen
TE M P E R A T U R E ( degC ) 600
500
400
300
200
100 0
0 10
20
30
40
50
60
70
80
90
100
ELA
PS
ED
TIM
E
(min
s)
lle
Hot
pat
e S
amp
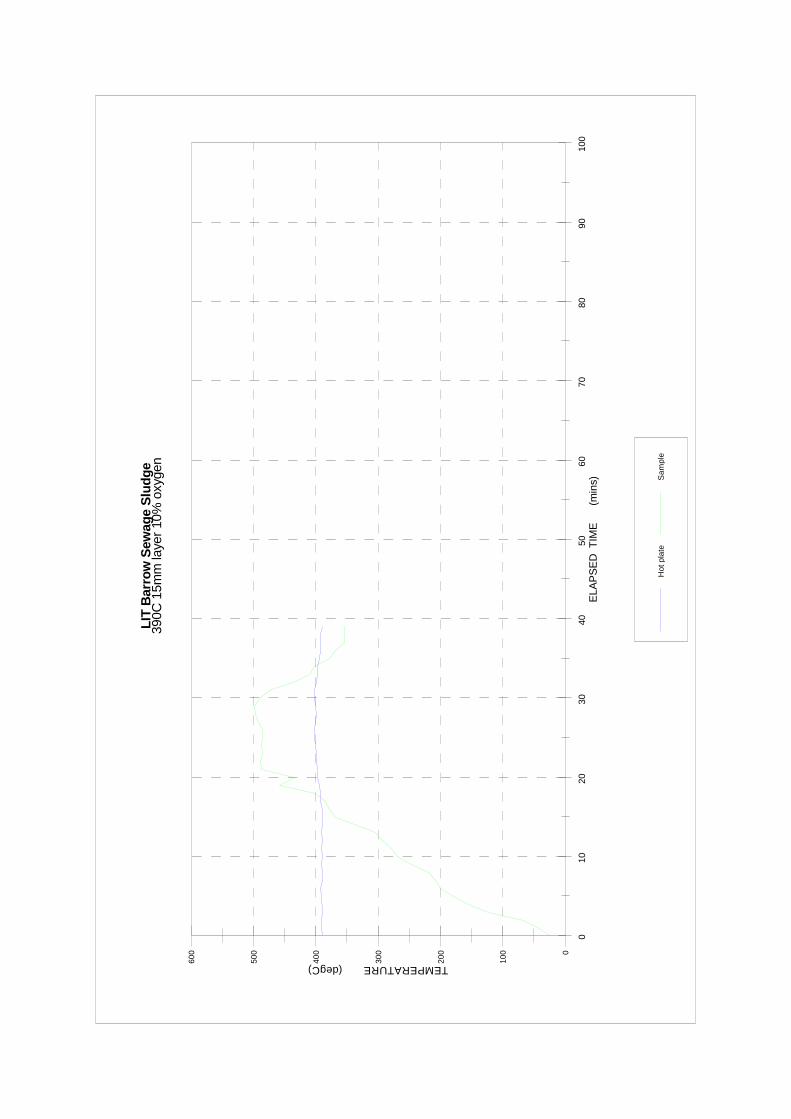
LIT
Bar
row
Sew
age
Slu
dge
390C
15m
m la
yer
10%
oxy
gen
TE M P E R A T U R E ( degC ) 600
500
400
300
200
100 0
0 10
20
30
40
50
60
70
80
90
100
ELA
PS
ED
TIM
E
(min
s)
lle
Hot
pat
e S
amp
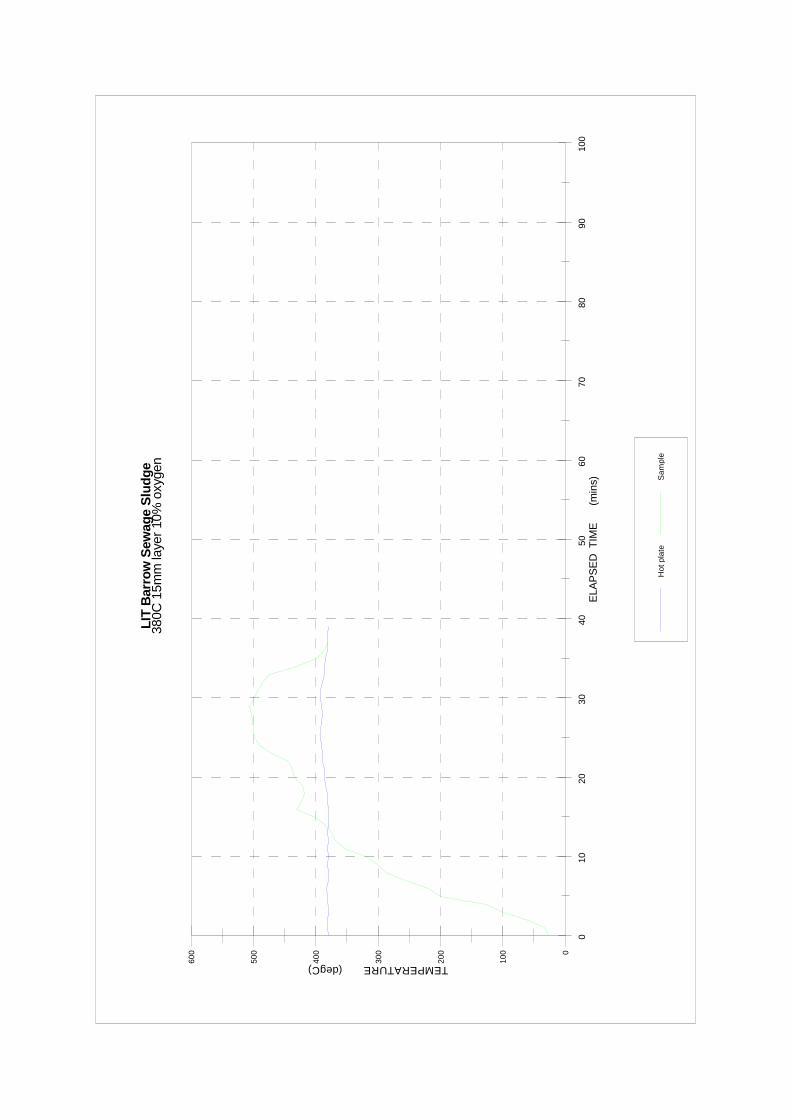
LIT
Bar
row
Sew
age
Slu
dge
380C
15m
m la
yer
10%
oxy
gen
TE M P E R A T U R E ( degC ) 600
500
400
300
200
100 0
0 10
20
30
40
50
60
70
80
90
100
ELA
PS
ED
TIM
E
(min
s)
lle
Hot
pat
e S
amp
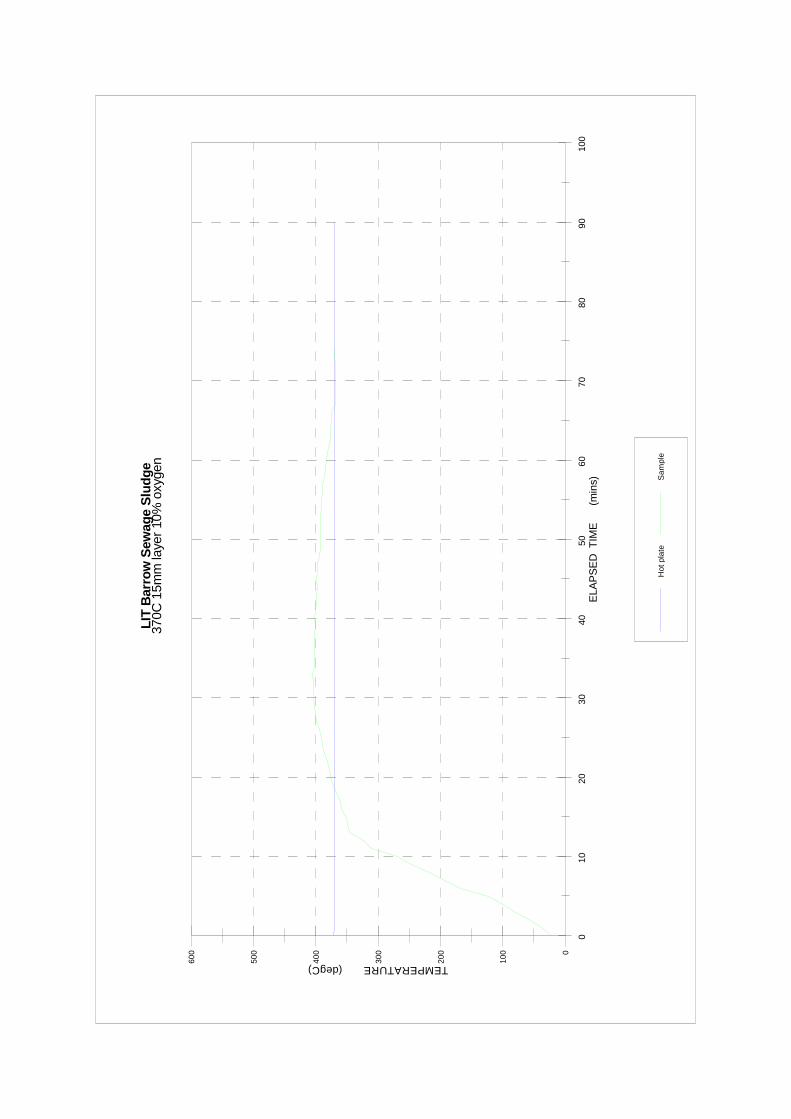
LIT
Bar
row
Sew
age
Slu
dge
370C
15m
m la
yer
10%
oxy
gen
TE M P E R A T U R E ( degC ) 600
500
400
300
200
100 0
0 10
20
30
40
50
60
70
80
90
100
ELA
PS
ED
TIM
E
(min
s)
lle
Hot
pat
e S
amp
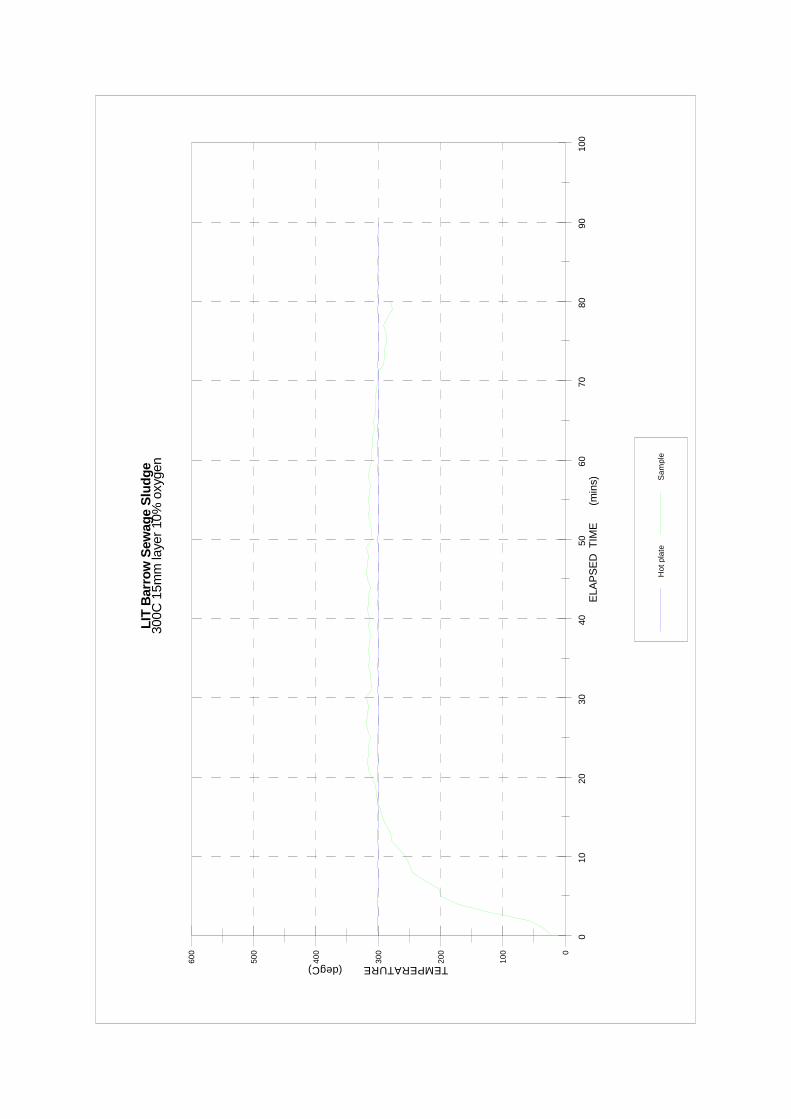
LIT
Bar
row
Sew
age
Slu
dge
300C
15m
m la
yer
10%
oxy
gen
TE M P E R A T U R E ( degC ) 600
500
400
300
200
100 0
0 10
20
30
40
50
60
70
80
90
100
ELA
PS
ED
TIM
E
(min
s)
lle
Hot
pat
e S
amp

LIT
Bar
row
Sew
age
Slu
dge
400C
15m
m la
yer
6% o
xyge
n TE M P E R A T U R E ( degC ) 60
0
500
400
300
200
100 0
0 10
20
30
40
50
60
70
80
90
100
ELA
PS
ED
TIM
E
(min
s)
lle
Hot
pat
e S
amp
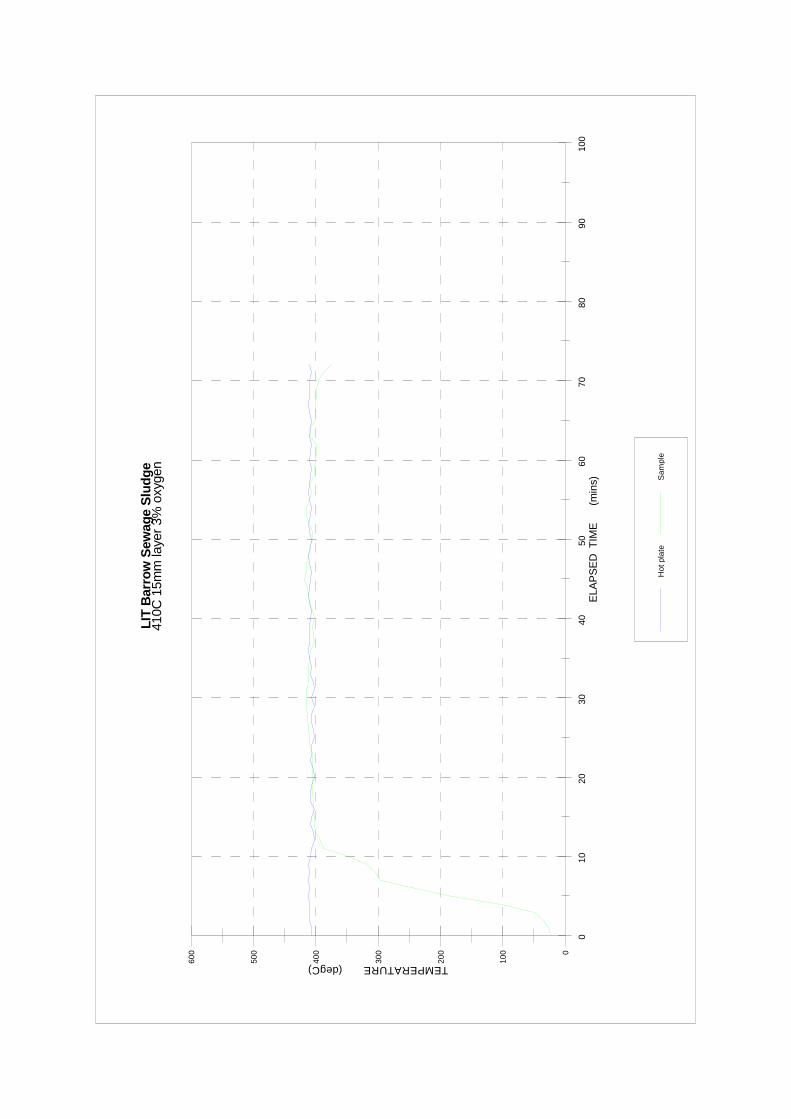
LIT
Bar
row
Sew
age
Slu
dge
410C
15m
m la
yer
3% o
xyge
n TE M P E R A T U R E ( degC ) 60
0
500
400
300
200
100 0
0 10
20
30
40
50
60
70
80
90
100
ELA
PS
ED
TIM
E
(min
s)
lle
Hot
pat
e S
amp

APPENDIX 7
AERATED CELL IGNITION TEMPERATURE DATA

Bar
row
Sew
age
Slu
dge
Ram
ped
air
thro
ugh
21%
O2
TEMPERATURE (degC) 800
700
600
500
400
300
200
100 0
0 12
0 24
0 36
0 48
0 60
0 72
0 84
0 96
0 10
80
1200
E
LAP
SE
D T
IME
(m
ins)
oven
Ch1
C
h3
Ch5
C
h9

Bar
row
Sew
age
Slu
dge
Ram
ped
air
thro
ugh
12%
O2
TEMPERATURE (degC) 800
700
600
500
400
300
200
100 0
0 12
0 24
0 36
0 48
0 60
0 72
0 84
0 96
0 10
80
1200
E
LAP
SE
D T
IME
(m
ins)
Ove
nC
h1
Ch3
C
h5
Ch7
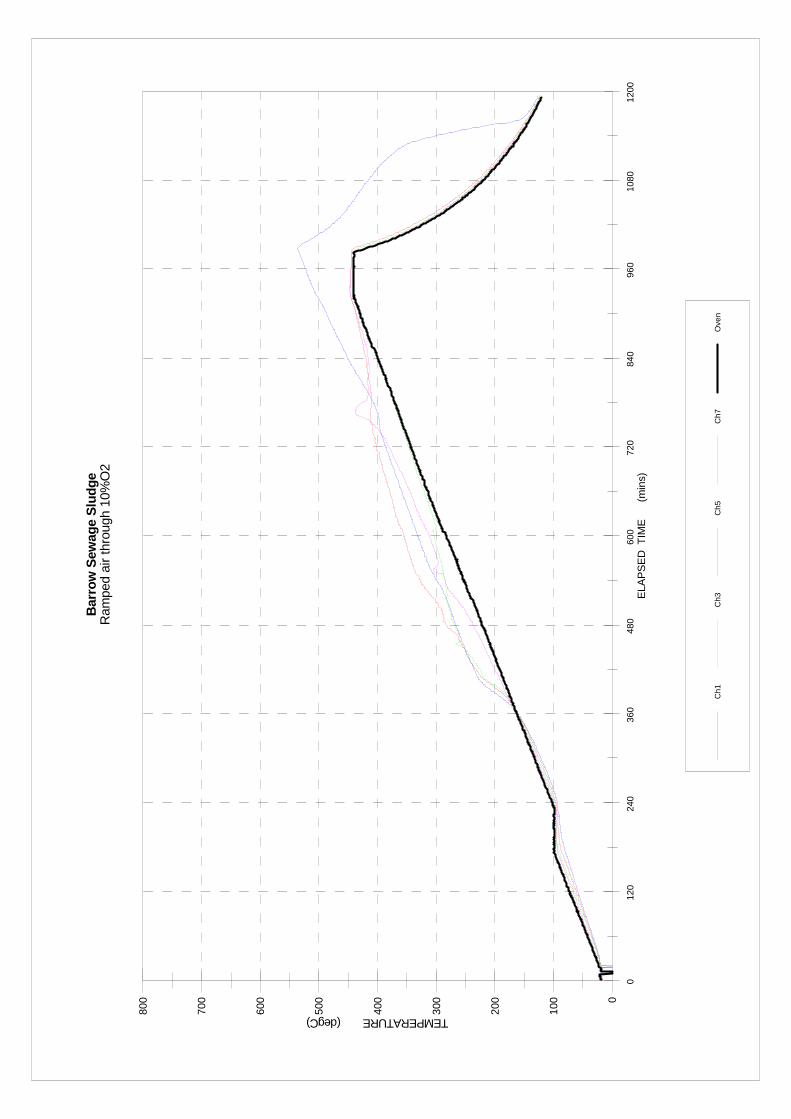
Bar
row
Sew
age
Slu
dge
Ram
ped
air
thro
ugh
10%
O2
TEMPERATURE (degC) 800
700
600
500
400
300
200
100 0
0 12
0 24
0 36
0 48
0 60
0 72
0 84
0 96
0 10
80
1200
E
LAP
SE
D T
IME
(m
ins)
Ove
nC
h1
Ch3
C
h5
Ch7
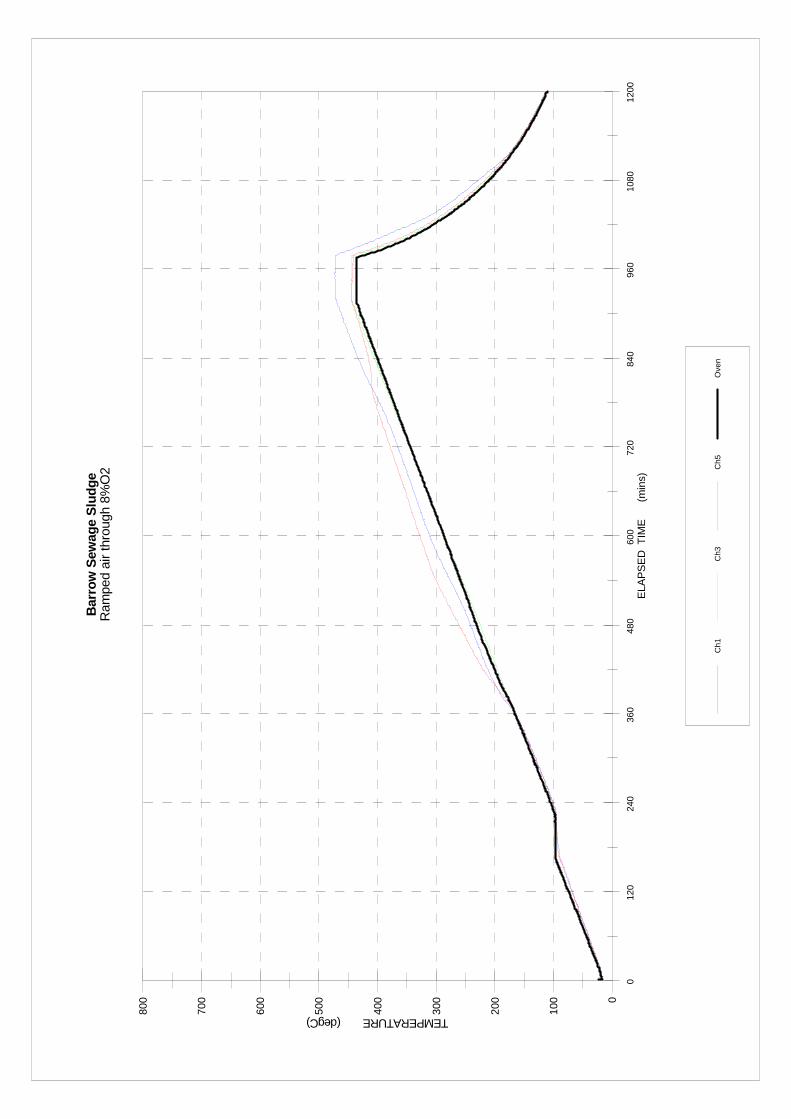
Bar
row
Sew
age
Slu
dge
Ram
ped
air
thro
ugh
8%O
2 TEMPERATURE (degC) 80
0
700
600
500
400
300
200
100 0
0 12
0 24
0 36
0 48
0 60
0 72
0 84
0 96
0 10
80
1200
E
LAP
SE
D T
IME
(m
ins)
Ove
nC
h1
Ch3
C
h5

Bar
row
Sew
age
Slu
dge
Ram
ped
air
thro
ugh
6%O
2 TEMPERATURE (degC) 80
0
700
600
500
400
300
200
100 0
0 12
0 24
0 36
0 48
0 60
0 72
0 84
0 96
0 10
80
1200
E
LAP
SE
D T
IME
(m
ins)
Ove
nC
h1
Ch3
C
h5
Ch7

Bar
row
Sew
age
Slu
dge
Ram
ped
air
thro
ugh
5%O
2 TEMPERATURE (degC) 80
0
700
600
500
400
300
200
100 0
0 12
0 24
0 36
0 48
0 60
0 72
0 84
0 96
0 10
80
1200
E
LAP
SE
D T
IME
(m
ins)
Ove
nC
h1
Ch3
C
h5
Ch9

APPENDIX 8
DEWAR TEST IGNITION TEMPERATURE DATA

Bar
row
Sew
age
Slu
dge
Dew
ar 1
50C
1 li
tre
21%
oxy
gen
TE M P E R A T U R E ( degC ) 800
700
600
500
400
300
200
100 0
0 30
0 60
0 90
0 12
00
1500
18
00
2100
24
00
2700
30
00
ELA
PS
ED
TIM
E
(min
s)
Ch1
(C
) C
h2 (
C)
Ch3
(C
) C
h4 (
C)
Ove
n

Bar
row
Sew
age
Slu
dge
Dew
ar 1
50C
1 li
tre
6% o
xyge
n TE M P E R A T U R E ( degC ) 80
0
700
600
500
400
300
200
100 0
0 30
0 60
0 90
0 12
00
1500
18
00
2100
24
00
2700
30
00
ELA
PS
ED
TIM
E
(min
s)
Ch1
(C
) C
h2 (
C)
Ch3
(C
) C
h4 (
C)
Ove
n

Bar
row
Sew
age
Slu
dge
Dew
ar 1
50C
1 li
tre
4% o
xyge
n TE M P E R A T U R E ( degC ) 80
0
700
600
500
400
300
200
100 0
0 30
0 60
0 90
0 12
00
1500
18
00
2100
24
00
2700
30
00
ELA
PS
ED
TIM
E
(min
s)
Ch1
(C
) C
h2 (
C)
Ch3
(C
) C
h4 (
C)
Ove
n

0
100
200
300
400
500
600
700
800
0 30
0 60
0 90
0 12
00
1500
18
00
2100
24
00
2700
30
00
i
liTE M P E R A T U R E ( degC )
ELA
PS
ED
TIM
E
(mns
)
Ch1
(C
) C
h2 (
C)
Ch3
(C
) C
h4 (
C)
Ove
n
Bar
row
Sew
age
Slu
dge
Dew
ar 1
50C
1
tre
no o
xyge
n

Printed and published by the Health and Safety ExecutiveC30 1/98
Printed and published by the Health and Safety Executive C1.25 02/03
ISBN 0-7176-2620-2
RR 075
780717626205£30.00 9

Measu
rem
ent o
f limitin
g o
xygen co
nce
ntra
tion in
sew
age slu
dge d
rying p
lants
HS
E B
OO
KS