research projects in renewable energy for high … projects in renewable energy for high school ......
TRANSCRIPT
RESEARCH PROJECTSIN RENEWABLE ENERGY
FOR HIGH SCHOOLSTUDENTS
National Renewable Energy LaboratoryEducation Programs
1617 Cole Blvd.Golden, CO 80401
Tel: (303) 275-3044Home page: http://www.nrel.gov

ACKNOWLEDGMENTS
The Education Office at NREL would like to thank Dr. James Schreck, Professor of Chemistry andBiochemistry, University of Northern Colorado, for his commitment and hard work in the development ofthis activity booklet. His expertise was invaluable in producing a final product that attempts to be "userfriendly."
It is the goal of the Education Office to make these kits accessible, easy to use, and fun. We want yourstudents to gain, not only an understanding of renewable and nonrenewable energy resources, but agreater confidence in investigating, questioning, and experimenting with scientific ideas.
If you have questions, please call the Education Office at (303) 275-3044 or e-mail:[email protected]
HOW TO USE THIS BOOKLET
The purpose of this booklet is to provide high school students with a variety of projects to broaden theirknowledge of science, in particular renewable energy, and the scientific method. Projects are available inthese areas of renewable energy: biofuels, wind, and solar.
Science projects described here apply the disciplines of chemistry, physics, biology, and mathematics.Below are some suggestions for effective use of this booklet:
1. First, check your EQ (energy quotient). Let your teachers grade the test you take and then decide if youneed to improve your energy background. The Education Office at the National Renewable EnergyLaboratory (NREL) has a small library you can use to improve your background. It is also useful forobtaining background material on an energy project described in this booklet. Contact the Education Officeat NREL in Golden, Colorado at 303-275-3080 to set a time to visit the facility. It is not advisable to visitthe facility without prior contact since NREL is a government facility, and your visit must be approved.Don't let that keep you away, however; the Education Office staff is happy to help you if they can.
2. Read the section on "How to do a Science Project."
3. Decide if you want to do a technical report or a hands-on activity research project in the area of biofuels,wind energy, or solar energy.
4. Choose a project, and discuss it with your teachers. You will likely need an area in your laboratory for aperiod of time. Your teacher will help you with the availability of equipment and materials.
5. Use the Idea for Study to decide on a project. In many cases, suggestions are made for the study. Don'tattempt every possible angle (variable); don't try to answer every question. Discuss your progress on aroutine basis with your teachers. Often those not directly involved with the project have insight andsuggestions that are worthwhile considering.
6. Keep in mind that the length of time spent on the project is not indicative of the quality of the work. Aresearch project always provides the answer to the original question and raises one or two more questionsfor future study.
7. Keep a research notebook, and write in your notebook on a routine basis. When you complete yourproject, the notebook entries can be used to write the report.
8. Be sure to communicate your results with others through the research report and/or a poster display.
GOOD LUCK!
WHAT' S YOUR ENERGY QUOTIENT?Pretest on Energy Principles
I. Check those statements that describe energy:
_____ leaves moving in the wind_____ a pot of boiling water_____ driving a car to school_____ finding your way in the dark with a flashlight_____ burning gas in a furnace_____ grilling a steak
2. What does the phrase "I don't have much energy today" mean to you?
3. What do you think the phrase "energy source" means?
4. Make a list of as many energy sources as you can think of.
5. Energy sources can be placed in two categories: renewable and nonrenewable. How do you thinkthese two energy sources differ from each other?
6. Look at your list of energy sources in question 4, and label them as renewable or nonrenewable.
7. In contrast to nonrenewable, renewable energy sources produce little or no pollution or hazardouswastes, pose few risks to public safety, and are entirely domestic resources. Explain why you agree ordisagree with this statement.
8. Energy sources are used mainly to produce electricity--a more useful energy source. Choose any energysource you listed in question 4, and describe how this is accomplished.
9. Why is it important not to waste energy? As a citizen, how to you conserve energy?
10. Assume all the reserves of nonrenewable energy sources have been depleted. How do you think peoplewill light and heat buildings, and what will they use for transportation?
specific topics. On theother hand, someperiodicals, such asScientific American andScience, cover a rangeof scientific issues.
• Make sure to record theauthor(s), titles of thearticle and the journal, tilepage numbers, and pertinent publishinginformation for every reference used.(Recording this information on note cardsis helpful.)
3. Select a specific problem within the areaof interest
It is important to narrow the research area toa specific problem. One common error is totry to do too much. (This process would berepeated as more information is gathered.)
4. Gather more information
It may be necessary to return to the libraryand look for information that deals directlywith the specific topic. Look for ideas thatmay help in the experimental design or forideas that complement the topic.
5. Plan an investigation or an experiment
Keep these things in mind when designingthe experiment:
• Are tile variables appropriate?• Are tile variables independent?• Are the variables measurable?• What kind of controls will be included?• What data will be collected?• Is the experiment designed appropriately
if the results are to be analyzedstatistically?
• Are the materials and equipment available?• Are there some special safety or environ-
mental concerns?
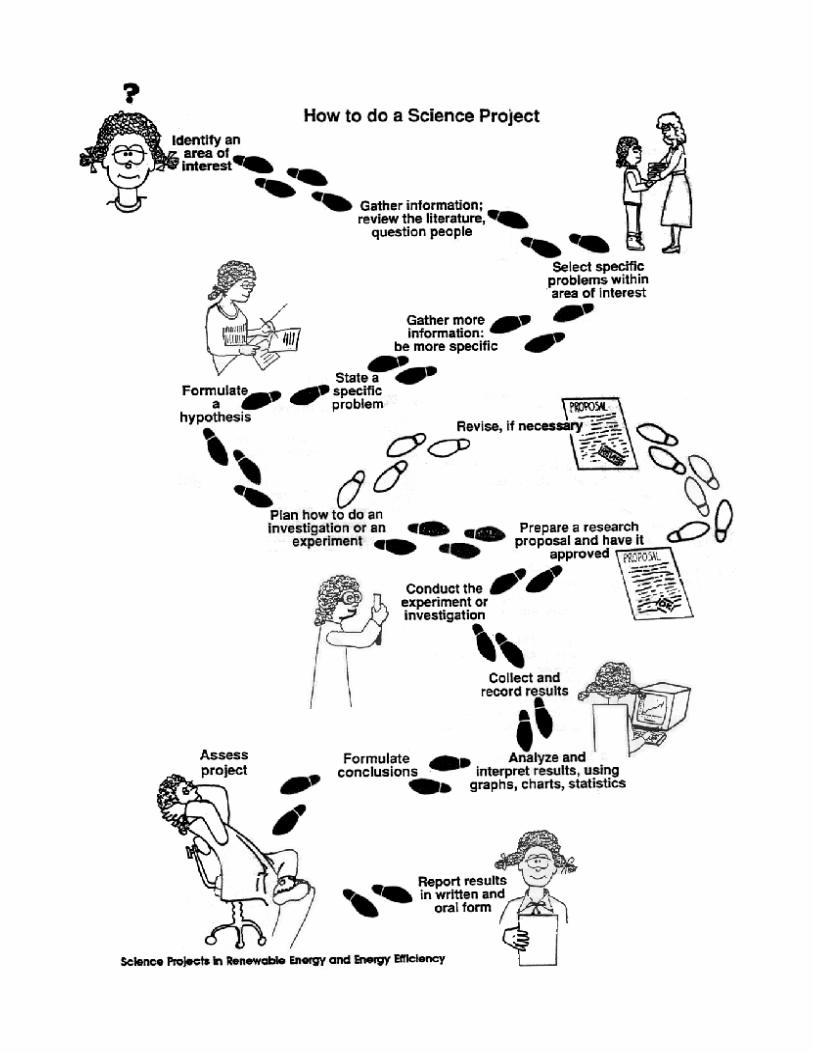
The scientific method is a pattern of inquiry thatforms a structure for advancing scientificunderstanding. By identifying a problem,forming a hypothesis, designing and con-ducting an experiment, taking data, and ana-1yzing the results, scientists have answeredquestions ranging from the simplest to the mostcomplex. Yet the process can be broken downinto several distinct steps.
We've tried to be quite explicit in outlining thesteps of the process. And we believe doing allthe steps is appropriate for the student doing anindividual project-either as a classroom projector for a competitive fair. On the other hand,teachers doing projects in the classroom mightchoose to skip some of the steps, depending onthe level of the students and the time available.
1. Identify an area of interest
• Decide what area ofscience is of intereste.g., physics,biology, chemistry,or engineering.
• Narrow the area ofinterest so that it ismore specific, e.g.,solar energy, plants,or anima1s.
2. Gather information
Our knowledge of the world results fromideas and observations made by us and byothers. Many of these observations arerecorded in such scientific literature asscientific journals, government documents,periodicals, and books.
• Search for information in the area ofinterest in the library.
• Begin in an organized manner by usingreference material such as the Reader'sGuide or the card catalog.
• Keep in mind that most Scientificjournals publish information pertainingto a single field of Science. For example,the American Journal of Physics and theAmerican Journal of Botany relate to
HOW TO DO A SCIENCE PROJECT
• Record other observations about the experiment .ina notebook. e.g., describe\ progress, take pictures,make sketches. Are some things not goingaccording to plan? Are there any surprises? Theseobservations may be important later.
8. Organize and report the results
Most data involve numbers and can bequantified. Therefore, using statistics.graphs, tables, and charts areappropriate. Remember, this is theportion of the research on whichconclusions are based. The better thisportion is presented, the easier it is toformulate conclusions. Data shouldbe presented:
• in written form with graphs, tables, and charts• without conclusions or value judgments
9. Analyze and discuss the resultsThink about the results. What do they mean? Howshould they be interpreted? By discussing variousaspects of the experimentand observations, provideadditional context for the results shown by thedata. Look for patterns,relationships andcorrelations.
10. Formulate conclusions
Was the hypothesis supported? This is an importantstep and must emphasize what has been learned fromdoing the project. Conclusion statements must besupported by data collected and related directly to the
purpose and hypothesis.
11. Assess the projectDid the expe1iment go as planned? If so, were thereother interesting aspects that deserve follow-up
If the project uses mathematical or computermodeling instead of experimentation, how willthe results be validated? Is therea way to test the model?
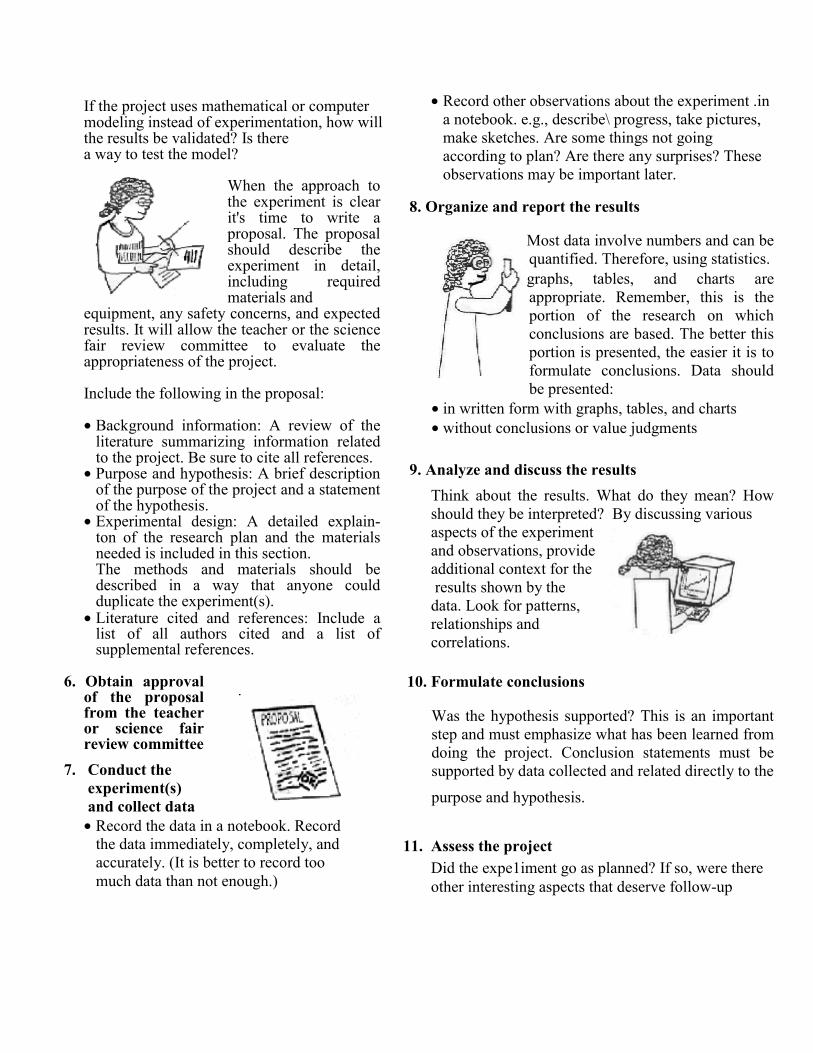
When the approach tothe experiment is clearit's time to write aproposal. The proposalshould describe theexperiment in detail,including requiredmaterials and
equipment, any safety concerns, and expectedresults. It will allow the teacher or the sciencefair review committee to evaluate theappropriateness of the project.
Include the following in the proposal:
• Background information: A review of theliterature summarizing information relatedto the project. Be sure to cite all references.
• Purpose and hypothesis: A brief descriptionof the purpose of the project and a statementof the hypothesis.
• Experimental design: A detailed explain-ton of the research plan and the materialsneeded is included in this section.
The methods and materials should bedescribed in a way that anyone couldduplicate the experiment(s).
• Literature cited and references: Include alist of all authors cited and a list ofsupplemental references.
6. Obtain approvalof the proposalfrom the teacheror science fairreview committee
7. Conduct theexperiment(s)and collect data• Record the data in a notebook. Record
the data immediately, completely, andaccurately. (It is better to record toomuch data than not enough.)
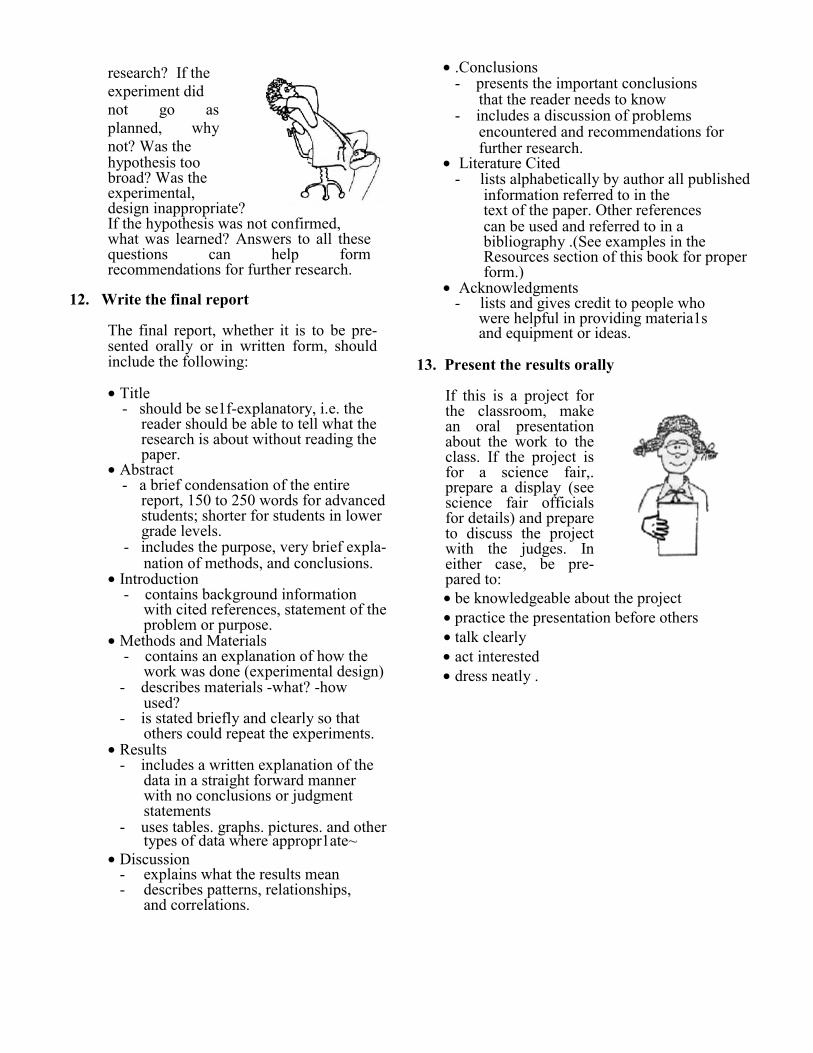
research? If theexperiment didnot go asplanned, whynot? Was thehypothesis toobroad? Was theexperimental,design inappropriate?If the hypothesis was not confirmed,what was learned? Answers to all thesequestions can help formrecommendations for further research.
12. Write the final report
The final report, whether it is to be pre-sented orally or in written form, shouldinclude the following:
• Title- should be se1f-explanatory, i.e. the
reader should be able to tell what theresearch is about without reading thepaper.
• Abstract- a brief condensation of the entire
report, 150 to 250 words for advancedstudents; shorter for students in lowergrade levels.
- includes the purpose, very brief expla-nation of methods, and conclusions.
• Introduction - contains background information
with cited references, statement of theproblem or purpose.
• Methods and Materials - contains an explanation of how the
work was done (experimental design)- describes materials -what? -how
used?- is stated briefly and clearly so that
others could repeat the experiments.• Results
- includes a written explanation of thedata in a straight forward mannerwith no conclusions or judgmentstatements
- uses tables. graphs. pictures. and othertypes of data where appropr1ate~
• Discussion- explains what the results mean- describes patterns, relationships,
and correlations.
• .Conclusions- presents the important conclusions
that the reader needs to know- includes a discussion of problems
encountered and recommendations forfurther research.
• Literature Cited- lists alphabetically by author all published
information referred to in thetext of the paper. Other referencescan be used and referred to in abibliography .(See examples in theResources section of this book for properform.)
• Acknowledgments- lists and gives credit to people who
were helpful in providing materia1sand equipment or ideas.
13. Present the results orally
If this is a project forthe classroom, makean oral presentationabout the work to theclass. If the project isfor a science fair,.prepare a display (seescience fair officialsfor details) and prepareto discuss the projectwith the judges. Ineither case, be pre-pared to:• be knowledgeable about the project• practice the presentation before others• talk clearly• act interested• dress neatly .
TECHNICAL REPORT
Preparing a science report that does not involve hands-on activities is a very important andworthwhile endeavor. Some students enjoy science, but don't find laboratory activities fun andexciting. Similarly, other students enjoy hands-on activities, but don't enjoy the task of writing abouttheir results. However, both tasks (doing science and writing about science) are important to bothscientists and citizens, and neither is more useful than the other. It is a matter of personal choice.
The research report suggested here is for students who would prefer to write a technical, scientificreport. However, this project involves more than just writing. As such it involves the following tasks:
• topic research• report preparation• photography• art• technical display
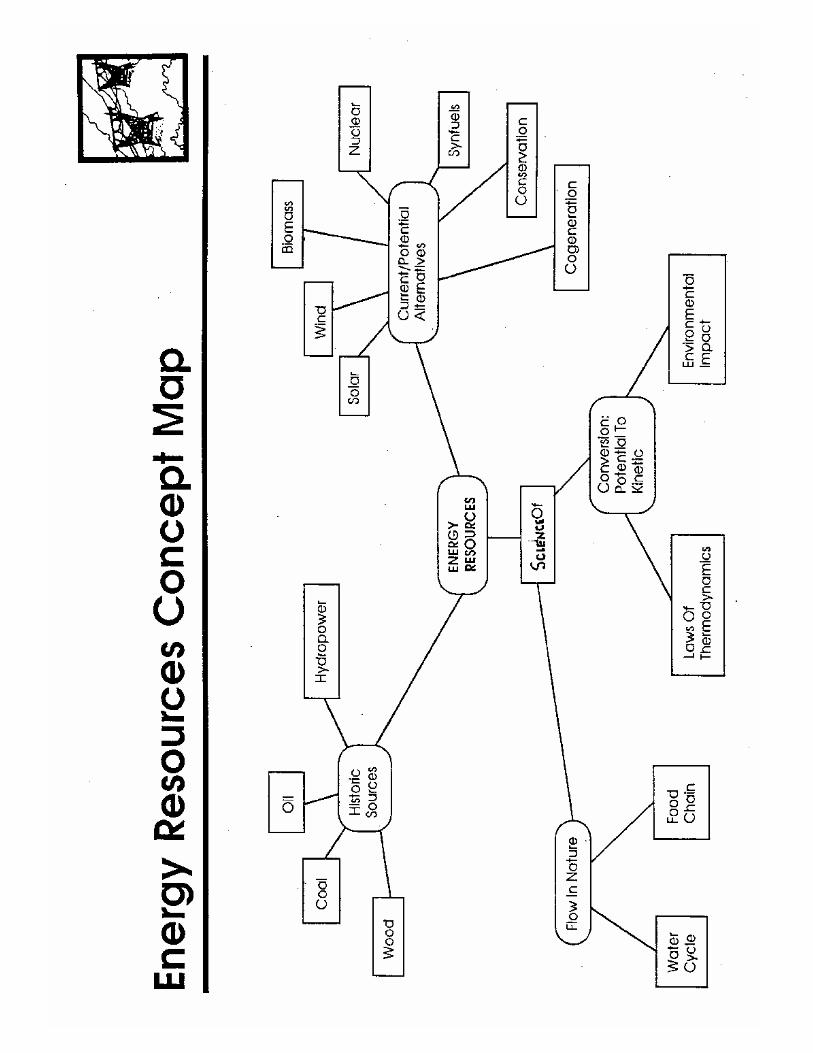
It could easily be a group project that would culminate in a written report and poster display. Thetask is to prepare a report based on the concept map in Appendix 1. This energy concept mapcategorizes some of the important aspects of energy .The task is to research and describe thefollowing facets of each category .The suggested questions in each category below are designed tohelp you with ideas that are important in a discussion of the category, and should be incorporated inyour report.
• WHAT IS ENERGY? Define and describe energy. Distinguish between potential and kineticenergy and give examples of each. What is the Law of Conservation of Energy .Why is itsignificant to know that when energy is transformed it is conserved in quantity but not inquality? What is the primary energy transformation for most energy resources? What effect doesusing energy have on citizens' lives? What is energy conservation and why should citizensconserve energy? In what way(s) does energy use impact the environment?
• ENERGY FLOW. How does the flow of energy from the sun affect wind and water cycles?How does sunlight help plants trap energy? How does the energy in plants get passed alongthrough the food chain? How do humans utilize this energy?
• HISTORIC RESOURCES. Describe the manner in which these resources are used for energy?Define renewable and nonrenewable energy resources and categorize each of the ones listedhere as renewable and nonrenewable. How much is used each day and for what purpose? Are allthese resources available in your state? How much? What are the pros and cons of each as anenergy resource?
• ENERGY ALTERNATIVES. Describe each of these and give pros and cons about each.Which are renewable and nonrenewable? Are all alternatives available in your state? Whatenvironmental impact would these energy resources have?
Ideas to Study1. Prepare a poster display. You will need to write a brief overview (called an abstract) of your reportby section. You might work with a group and have someone take or obtain 3-4 photographs relatingto ideas of each section (for example, you could illustrate potential versus kinetic energy by having aphotograph of your team ' s quarterback before the ball is snapped, and then another as the ball isreleased for a pass) .You might work with a friend from the school newspaper or yearbook staffinterested in page layout and technical display.

2. Prepare a shorter version of your report to be published in the school newspaper.
3. Give an oral presentation (with slides or overhead transparencies) to a science class in yourschool.or to a middle school classroom that you have permission to visit.
Doing science in this manner can be satisfying and rewarding. Technical reports are numerous onTV and in the newsprint. Maybe someday you will have written the paragraph read by yourfavorite TV newsperson or reported in Time and Newsweek magazines on the yet to be discoveredfourth state of matter.
BIOFUELS
Project #1: What is the efficiency ofethanol production from various sources?Project #2: What kind of biomass is best
for producing methane gas?Project #3: What kinds of plants have themost heat energy in a given quantity of
biomass?Project #4: How much energy can be
obtained from alcohol fuels?Project #5: What factors affect biomass
growth?
BIOFUELS
Biofuels are produced from biomass. Biomass includes living organisms such as plants, trees andcrops, as well as half of all trash. The major potential of biomass is for production of liquidtransportation fuels. These fuels include ethanol and methanol, two alcohol fuels made from corn,wheat and other crops, and methane, a colorless, odorless and flammable gas made from waste.Ethanol, methanol and methane offer an attractive alternative to petroleum-based gasoline anddiesel fuels.
There are more than 185 million vehicles in the U.S., and these vehicles are responsible for two-thirds of the nation's total oil consumption. The quantity of biomass currently available couldproduce enough liquid transportation fuel to replace all the gasoline we currently use in thesevehicles. By the end of the decade, technological advancements will make these fuels as affordableand easy to use as today's petroleum-based gasoline and diesel fuels.
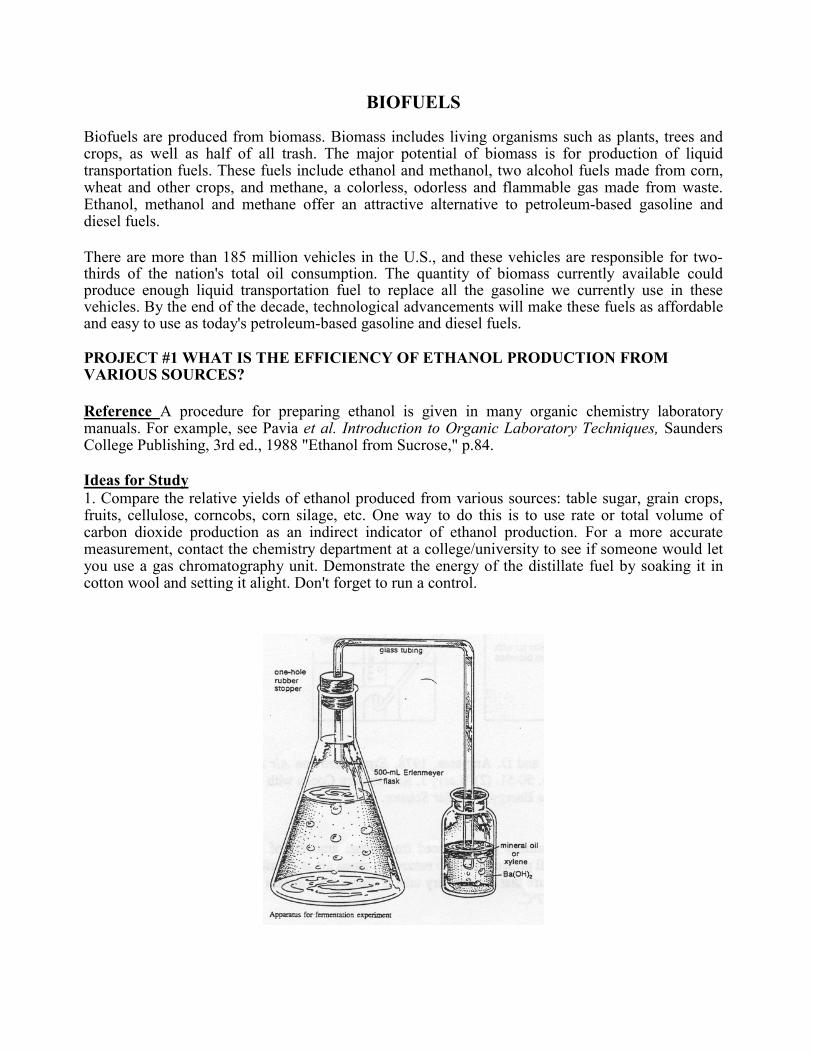
PROJECT #1 WHAT IS THE EFFICIENCY OF ETHANOL PRODUCTION FROMVARIOUS SOURCES?
Reference A procedure for preparing ethanol is given in many organic chemistry laboratorymanuals. For example, see Pavia et al. Introduction to Organic Laboratory Techniques, SaundersCollege Publishing, 3rd ed., 1988 "Ethanol from Sucrose," p.84.
Ideas for Study1. Compare the relative yields of ethanol produced from various sources: table sugar, grain crops,fruits, cellulose, corncobs, corn silage, etc. One way to do this is to use rate or total volume ofcarbon dioxide production as an indirect indicator of ethanol production. For a more accuratemeasurement, contact the chemistry department at a college/university to see if someone would letyou use a gas chromatography unit. Demonstrate the energy of the distillate fuel by soaking it incotton wool and setting it alight. Don't forget to run a control.
2. Develop a procedure for determining the percentage of alcohol you can prepare from the varioussources. One method might be to use potassium dichromate standards. This substance is the basis forsome commercial kits for determining alcohol levels before and after consuming alcoholic beverages.
3. Investigate optimum temperature for fermentation.
4. Investigate aerobic and anaerobic conditions for producing ethanol.
5. Investigate methods of quantifying ethanol production from one or more sources.
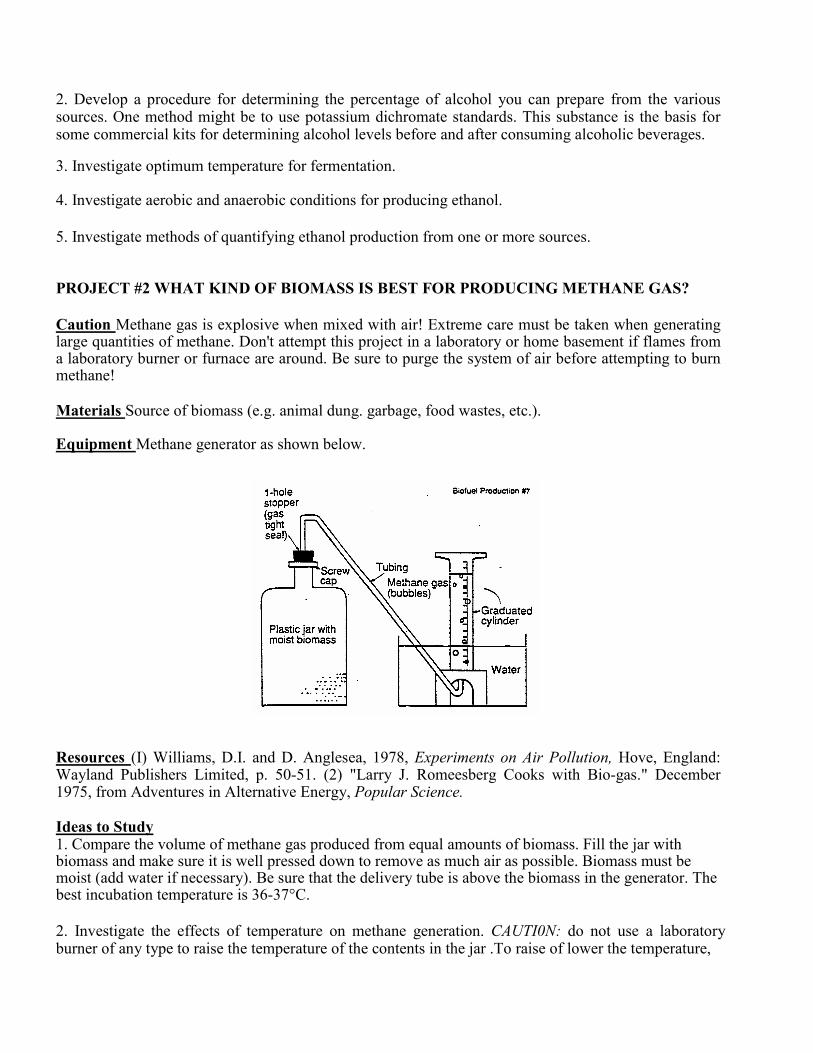
PROJECT #2 WHAT KIND OF BIOMASS IS BEST FOR PRODUCING METHANE GAS?
Caution Methane gas is explosive when mixed with air! Extreme care must be taken when generatinglarge quantities of methane. Don't attempt this project in a laboratory or home basement if flames froma laboratory burner or furnace are around. Be sure to purge the system of air before attempting to burnmethane!
Materials Source of biomass (e.g. animal dung. garbage, food wastes, etc.).
Equipment Methane generator as shown below.
Resources (I) Williams, D.I. and D. Anglesea, 1978, Experiments on Air Pollution, Hove, England:Wayland Publishers Limited, p. 50-51. (2) "Larry J. Romeesberg Cooks with Bio-gas." December1975, from Adventures in Alternative Energy, Popular Science.
Ideas to Study1. Compare the volume of methane gas produced from equal amounts of biomass. Fill the jar withbiomass and make sure it is well pressed down to remove as much air as possible. Biomass must bemoist (add water if necessary). Be sure that the delivery tube is above the biomass in the generator. Thebest incubation temperature is 36-37°C.
2. Investigate the effects of temperature on methane generation. CAUTI0N: do not use a laboratoryburner of any type to raise the temperature of the contents in the jar .To raise of lower the temperature,
place a pan of hot or ice cold water beneath the gas generator. You made need to devise a safe wayto keep the temperature warmer or colder than the optimum temperature.
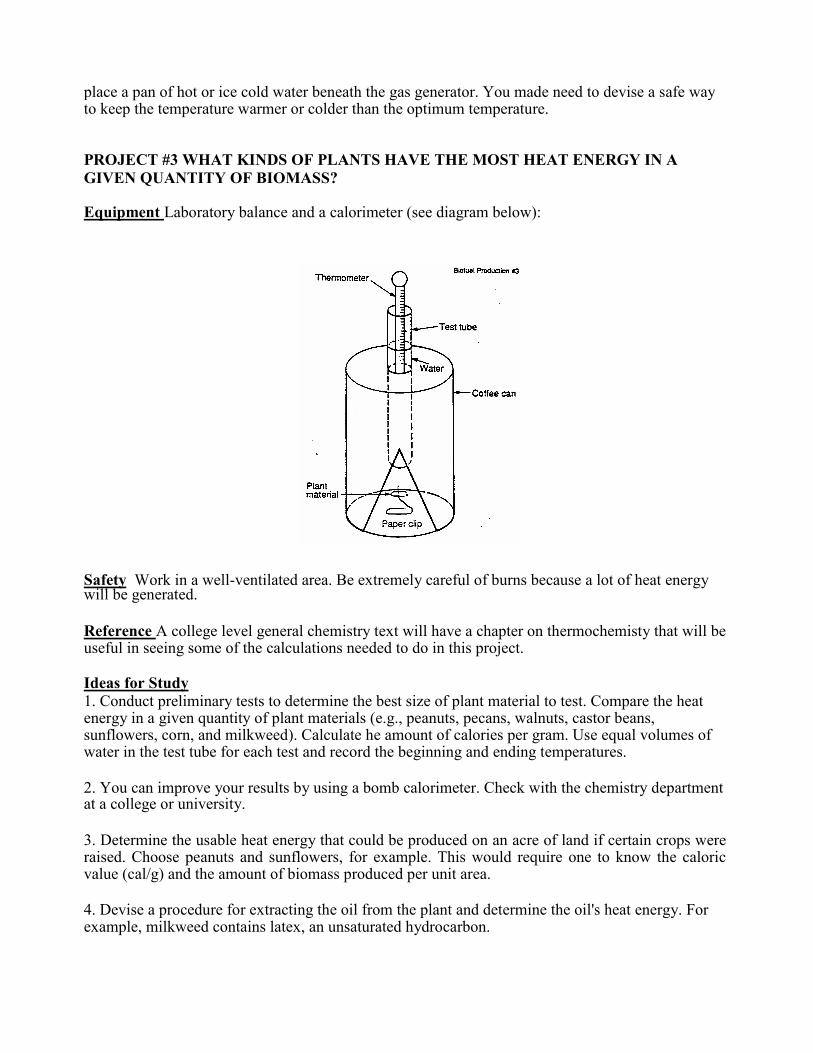
PROJECT #3 WHAT KINDS OF PLANTS HAVE THE MOST HEAT ENERGY IN AGIVEN QUANTITY OF BIOMASS?
Equipment Laboratory balance and a calorimeter (see diagram below):
Safety Work in a well-ventilated area. Be extremely careful of burns because a lot of heat energywill be generated.
Reference A college level general chemistry text will have a chapter on thermochemisty that will beuseful in seeing some of the calculations needed to do in this project.
Ideas for Study1. Conduct preliminary tests to determine the best size of plant material to test. Compare the heatenergy in a given quantity of plant materials (e.g., peanuts, pecans, walnuts, castor beans,sunflowers, corn, and milkweed). Calculate he amount of calories per gram. Use equal volumes ofwater in the test tube for each test and record the beginning and ending temperatures.
2. You can improve your results by using a bomb calorimeter. Check with the chemistry departmentat a college or university.
3. Determine the usable heat energy that could be produced on an acre of land if certain crops wereraised. Choose peanuts and sunflowers, for example. This would require one to know the caloricvalue (cal/g) and the amount of biomass produced per unit area.
4. Devise a procedure for extracting the oil from the plant and determine the oil's heat energy. Forexample, milkweed contains latex, an unsaturated hydrocarbon.
PROJECT #4 HOW MUCH ENERGY CAN BE OBTAINED FROM ALCOHOL FUELS?
Materials Use the set up for the calorimeter as described in Project #3, but use an alcohol burner as thesource of heat.
Caution Alcohols are very flammable. Work in the science laboratory under supervision of your teacheror another adult.
Ideas for Study1. Compare the heat energy from burning alcohols (e.g., methanol, ethanol, propanol, rubbing alcohol,etc). Measure the weight of alcohol before and after the burning alcohol raises the temperature of 100 mL(equals 100 g) of water at least SOOC. Calculate the calories per gram for each alcohol tested.
2. Devise a more efficient procedure that reduces heat loss. Determination of heat values and efficienciesas related to cost would be important to know. How could these fuels be used?
PROJECT #5 WHAT FACTORS AFFECT BIOMASS GROWTH?
Caution Handle fertilizers, pesticides, and plant hormones with care.
Procedure Grow plants from seeds in cups or pots. Measure height and width daily or measure dryweight after several days or weeks. Use a variety of plant types -food and nonfood, grasses, and weeds.Weigh soil to see how much "earth" is used.
Ideas to Study1. Investigate plant growth utilizing one of these factors. Keep in mind each factor can be a study initself:
a. Type of light.
b. Amount of light.
c. Spacing of seedlings.
d. Soil type.
e. Frequency of watering.
f. Fertilizer vs. no fertilizer.
g. Pesticide vs. no pesticide.
h. Salt content of water [use varying concentrations of salt water and measure dry weight afterdays or weeks].
i. Plant hormone vs. no plant hormone. [Apply plant hormone with aspirator or a perfume bottleor small paint brush, but apply evenly. Biomass can be determined as fresh weight and dryweight (dry in oven) for 24 hrs at 90"C -include roots.]
j. Orientation of a single seed when planted. [Replicate the orientation of seeds planted severaltimes. Remember the greater the sample size the more reliable the data. Plant each seed at thesame depth as the others. Make sure that the light source is equally distributed on each traycontaining the seeds.]
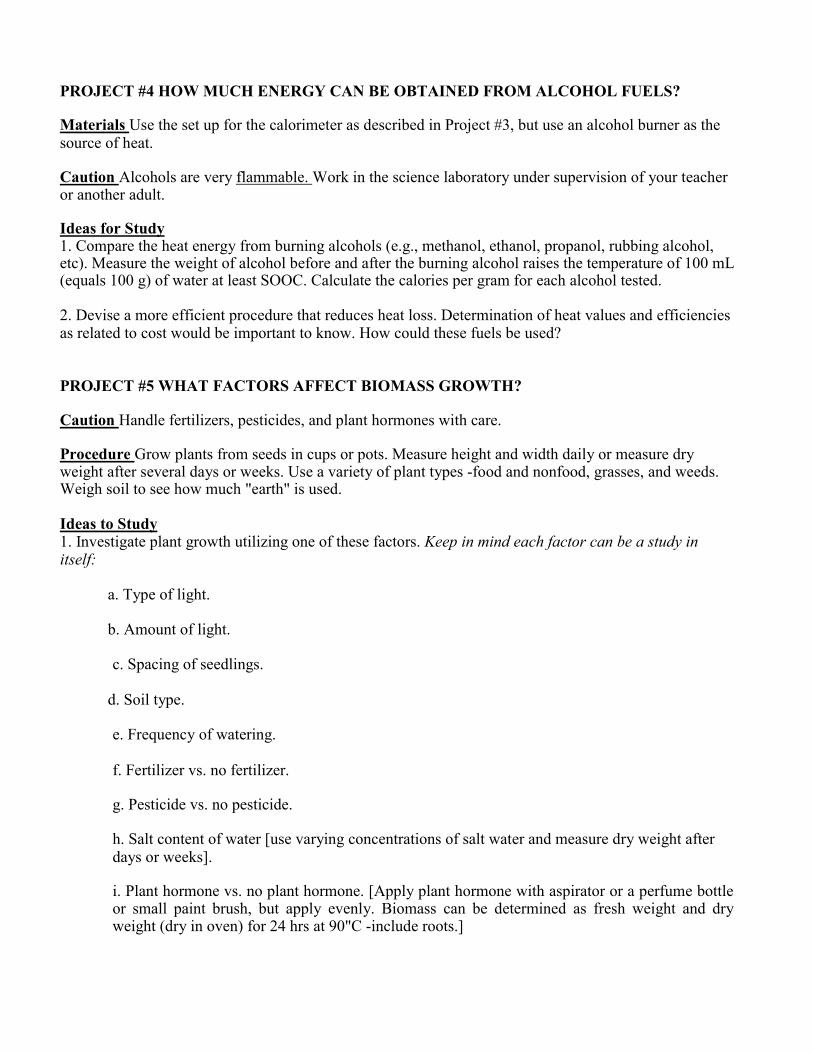
k. Depth seed is planted in soil.l. Effect of increased amount of carbon dioxide (see diagram below and handle dry ice withcare). [plants should have a minimum of 5-6 leaves and be of approximately equal size.Calculate total leaf at the beginning and end of the experiment for each plant. If dry ice is used,consider that carbon dioxide is heavier than air and also consider the temperature effect onplants. Use same soil provide equal amounts of water and light. Could use sodium bicarbonate and monitor pH.]
m. Effect of temperature on the rate of photosynthesis [Assemble the apparatus as shown in thediagram below and take care assembling the apparatus, specifically the insertion of a glass tubeinto a rubber stopper. Be careful of the hypodermic syringe. Many general biology lab manualsgive directions for measuring gas production in photosynthesis. Don't forget to set up a control(minus the plant). Keep light intensity the same and remember that most light sources produceheat.
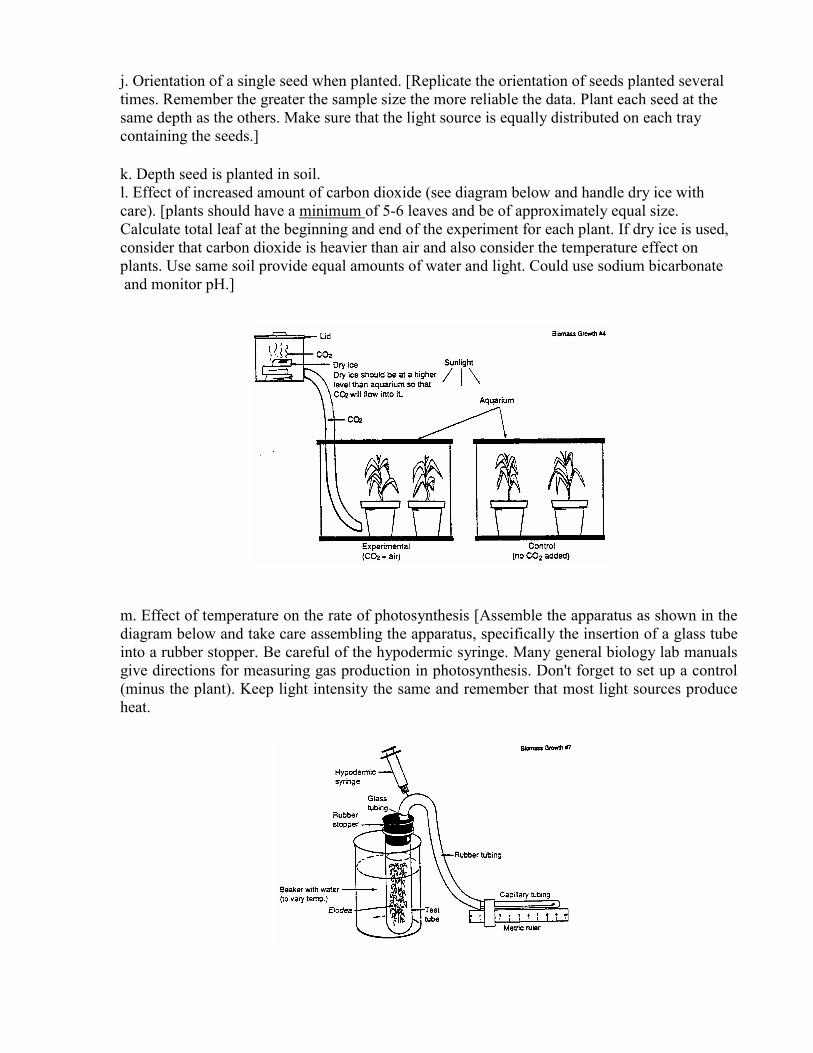
WIND ENERGYProject #1: What techniques can be used to
measure and compare wind direction andspeed?
Project #2: How does a wind propelleraffect how much electricity it produces?Project #3: What is the most efficient
spacing of wind turbines for “farming” windin a given unit of space?
WIND ENERGY
The Earth's winds contain vast amounts of energy. People have harnessed this energy for thousandsof years to sail ships, grind grain and pump water. Today, advanced wind turbines offer an efficientmeans of capturing wind energy and using it to produce electricity. Wind turbines are used forindividual homes and also grouped together in wind farms to generate electricity for utility grids.Wind turbines have two or three long, light-weight blades that turn quickly. The longer the bladeand the greater the wind speed, the more electricity generated. Steady wind speeds of no less than12 miles per hour year round are required to effectively generate electricity.
CAUTION: Take precautions when working with fans and electricity.
PROJECT #1 WHAT TECHNIQUES CAN BE USED TO MEASURE AND COMPAREWIND DIRECTION AND SPEED?
Materials Beaufort Wind Scale (see Appendix 1), wind vane, and anemometer. Calibrate vane witha compass and calibrate the anemometer through the window of a car.
Resource Bulletin of the American Meteorological Society, May 1989.Vol. 70, No.5, p.490-508.
Ideas to Study1. Compare the Beaufort Wind Scale to the wind vane and anemometer for measuring winddirection and speed at a specific site for a determined time period (e.g., morning, noon, andafternoon or evening for a six week period of time). At what time of day do the fastest winds usuallyoccur? Which method is more reliable and why?
2. Compare the design of the wind vane and/or anemometer for efficiency at a specific site over aperiod of time.
3. Compare different sites for collecting wind energy using the wind vane and/or anemometer for agiven period of time.
4. Determine how the topography affects the results in one of the studies above.
5. Determine how the height of the device (wind vane or anemometer) affects the results in one ofthe studies?
6. Make a map of measured wind versus location, time of year, and time of day.
PROJECT #2 HOW DOES A WIND PROPELLER AFFECT HOW MUCH ELECTRICITYIT PRODUCES?
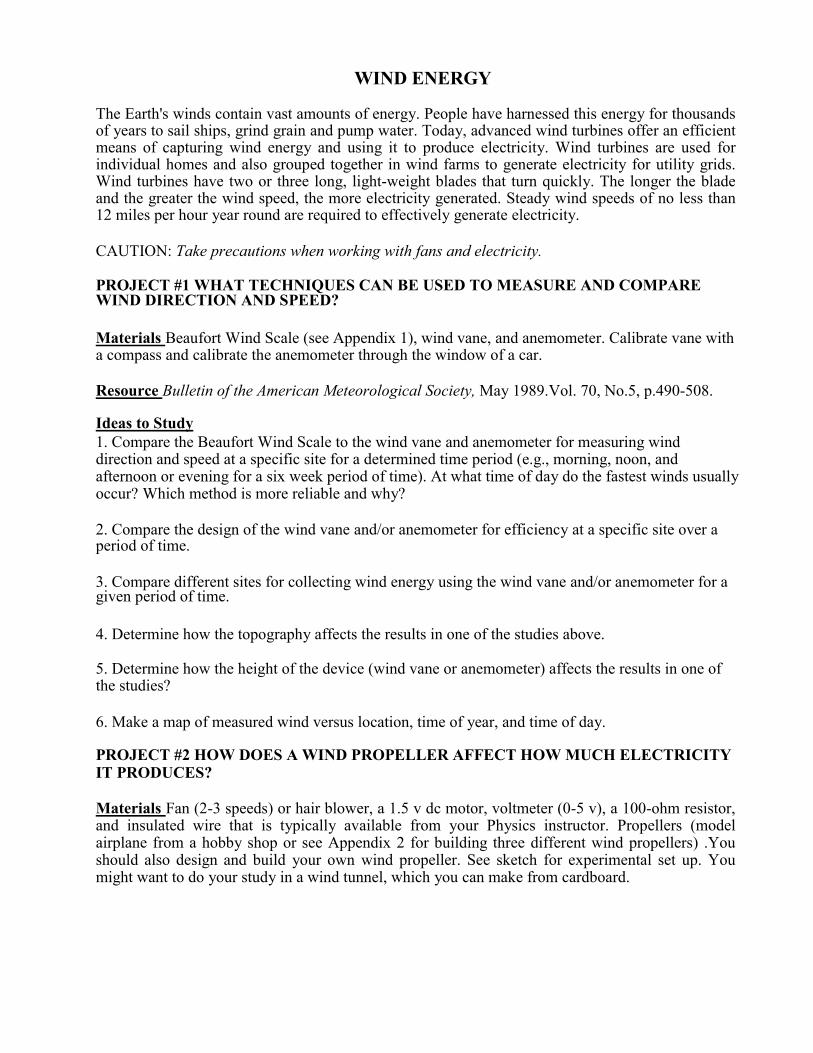
Materials Fan (2-3 speeds) or hair blower, a 1.5 v dc motor, voltmeter (0-5 v), a 100-ohm resistor,and insulated wire that is typically available from your Physics instructor. Propellers (modelairplane from a hobby shop or see Appendix 2 for building three different wind propellers) .Youshould also design and build your own wind propeller. See sketch for experimental set up. Youmight want to do your study in a wind tunnel, which you can make from cardboard.
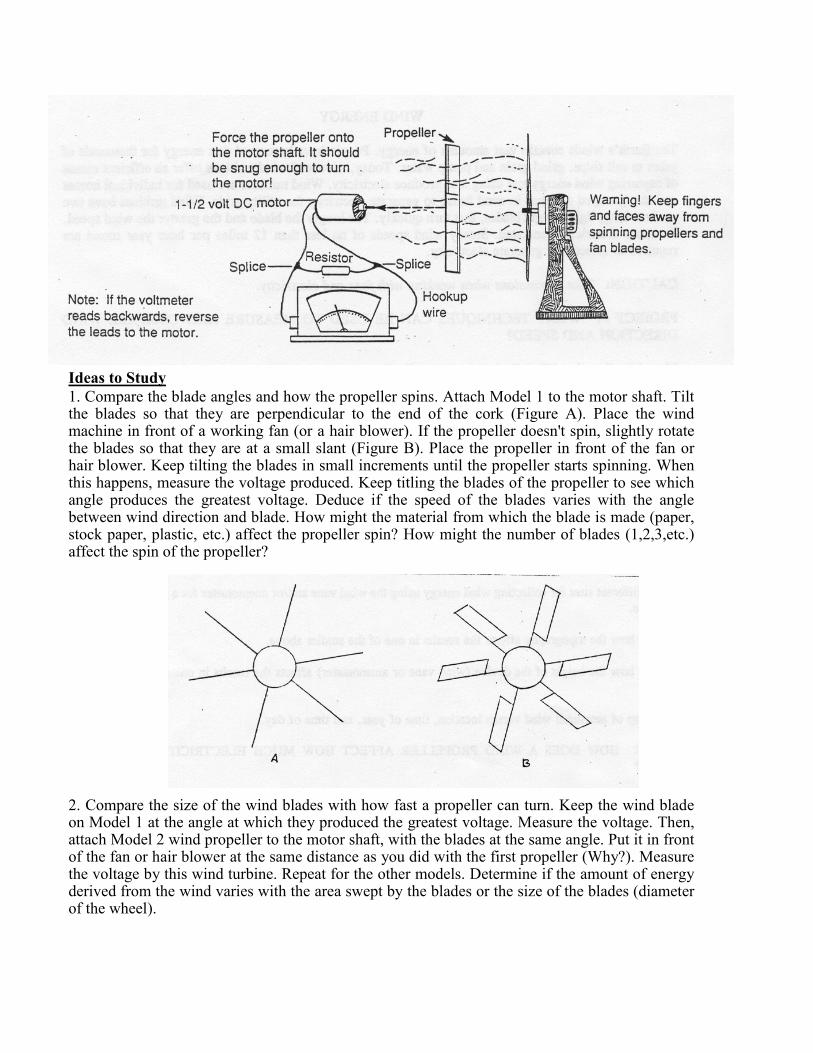
Ideas to Study1. Compare the blade angles and how the propeller spins. Attach Model 1 to the motor shaft. Tiltthe blades so that they are perpendicular to the end of the cork (Figure A). Place the windmachine in front of a working fan (or a hair blower). If the propeller doesn't spin, slightly rotatethe blades so that they are at a small slant (Figure B). Place the propeller in front of the fan orhair blower. Keep tilting the blades in small increments until the propeller starts spinning. Whenthis happens, measure the voltage produced. Keep titling the blades of the propeller to see whichangle produces the greatest voltage. Deduce if the speed of the blades varies with the anglebetween wind direction and blade. How might the material from which the blade is made (paper,stock paper, plastic, etc.) affect the propeller spin? How might the number of blades (1,2,3,etc.)affect the spin of the propeller?
2. Compare the size of the wind blades with how fast a propeller can turn. Keep the wind bladeon Model 1 at the angle at which they produced the greatest voltage. Measure the voltage. Then,attach Model 2 wind propeller to the motor shaft, with the blades at the same angle. Put it in frontof the fan or hair blower at the same distance as you did with the first propeller (Why?). Measurethe voltage by this wind turbine. Repeat for the other models. Determine if the amount of energyderived from the wind varies with the area swept by the blades or the size of the blades (diameterof the wheel).
3. Compare the shape of the propeller blades and how fast they can spin. Keep the wind bladeson Models 1 and 2 at the same angle as in the previous study. Measure the voltage again. Thenattach Model 3 wind propeller to the motor shaft, with the blades at the same angle as the Models1 and 2 wind propellers? Measure the voltage. Repeat with the wind propeller you designed, andmeasure the voltage. Deduce if the shape of the blades in a wind propeller determine theefficiency of conversion.
4. Compare how wind speed affects the electricity output of wind machines. Use any of thepropellers, and place the wind machine in front of a two-speed fan. Turn fan on low speed.Measure voltage. Then turn fan of high speed and repeat measurement. Determine if there is amathematical relationship between the energy derived from the wind and the wind speed. Deducehow concentrating the wind speed through a cone affects the electricity output.
5. Alter any of the wind turbines such that it is strong enough to power a flashlight bulb (averagevoltage 2.5 volts). Were any of the models you used here strong enough?
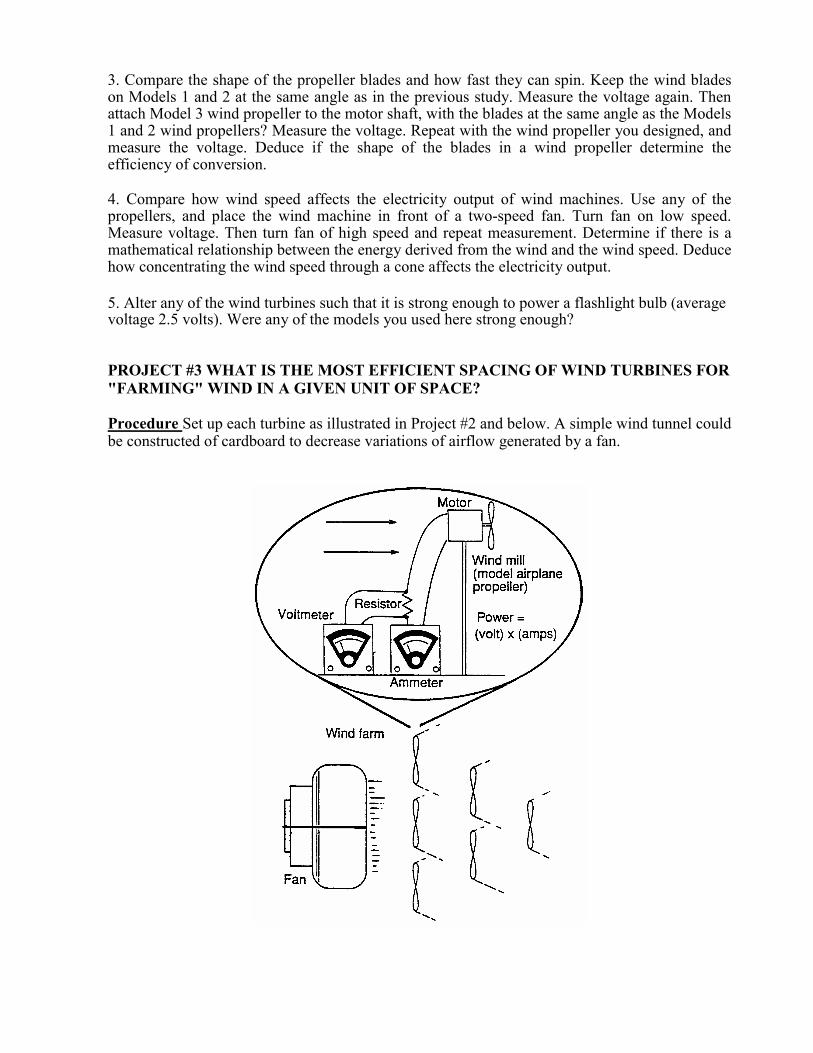
PROJECT #3 WHAT IS THE MOST EFFICIENT SPACING OF WIND TURBINES FOR"FARMING" WIND IN A GIVEN UNIT OF SPACE?
Procedure Set up each turbine as illustrated in Project #2 and below. A simple wind tunnel couldbe constructed of cardboard to decrease variations of airflow generated by a fan.
Ideas to Study1. Determine total electricity produced for a model land area and then calculate the total electricityproduced for a larger area by extrapolation.
2. Compare the total electricity produced using variables such as wind direction, topography, andnumber and design of the wind turbines.
PROJECT #4 IS A VERTICAL WIND TURBINE MORE EFFICIENT THAN AHORIZONTAL WIND TURBINE?
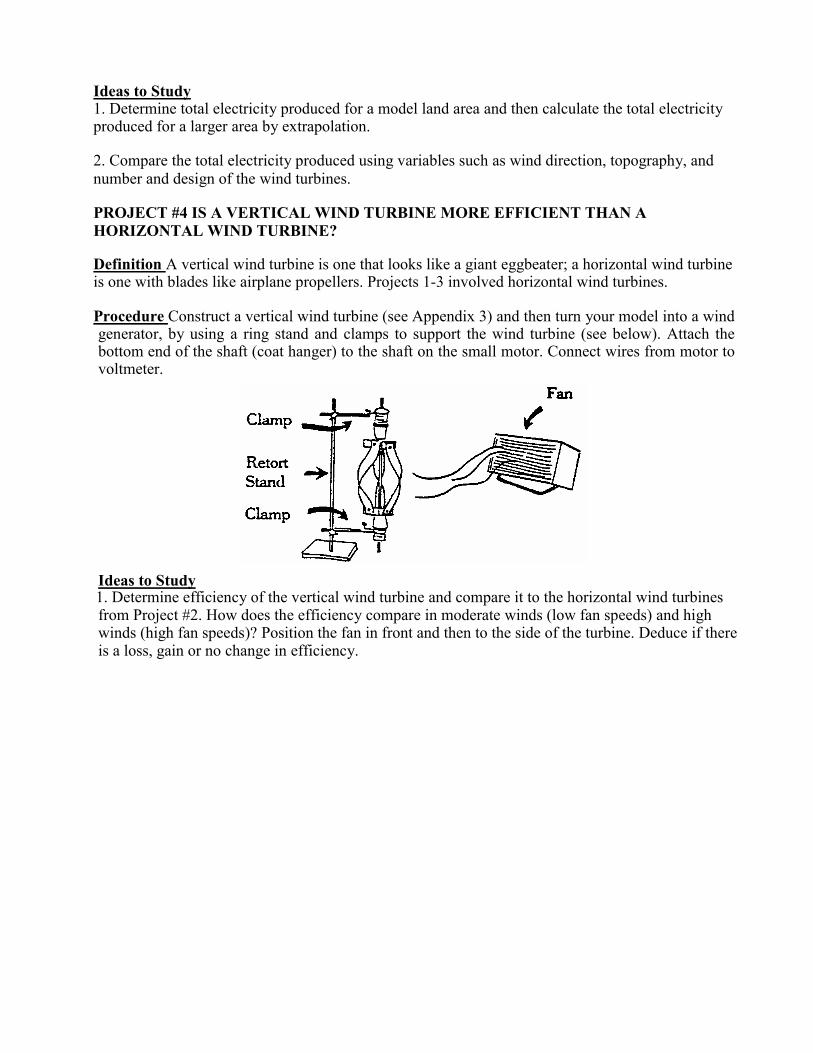
Definition A vertical wind turbine is one that looks like a giant eggbeater; a horizontal wind turbineis one with blades like airplane propellers. Projects 1-3 involved horizontal wind turbines.
Procedure Construct a vertical wind turbine (see Appendix 3) and then turn your model into a windgenerator, by using a ring stand and clamps to support the wind turbine (see below). Attach thebottom end of the shaft (coat hanger) to the shaft on the small motor. Connect wires from motor tovoltmeter.
Ideas to Study1. Determine efficiency of the vertical wind turbine and compare it to the horizontal wind turbinesfrom Project #2. How does the efficiency compare in moderate winds (low fan speeds) and highwinds (high fan speeds)? Position the fan in front and then to the side of the turbine. Deduce if thereis a loss, gain or no change in efficiency.

BEAUFORT WIND SCALEThis is the Beaufort Wind Scale. It is to measure wind speeds. It relies on human observations, nomechanical devices, to calculate the speed of the wind.
BEAUFORT NUMBER DESCRIPTI0N OBSERVATI0N
0 calm (0-1 mph) smoke rises vertically
1 light air (2-3 mph) smoke drifts slowly
2 slight breeze (4-7 mph) leaves rustle; windvane moves
3 gentle breeze (8-12 mph) twigs move; flags extended
4 moderate breeze (13-18 mph) branches move; dust and paper rise
5 fresh breeze (19-24 mph) small trees sway
6 strong breeze (25-31 mph) large branches sway; wires whistle
7 moderate gale (32-38 mph) trees in motion; walking difficult
8 fresh gale (39-46 mph) twigs break off trees
9 strong gale ((47-54 mph) branches break; roofs damaged
10 whole gale (55-63 mph) trees snap; damage evident
11 storm (64-72 mph) widespread damage
12 hurricane (73-82 mph) extreme damage
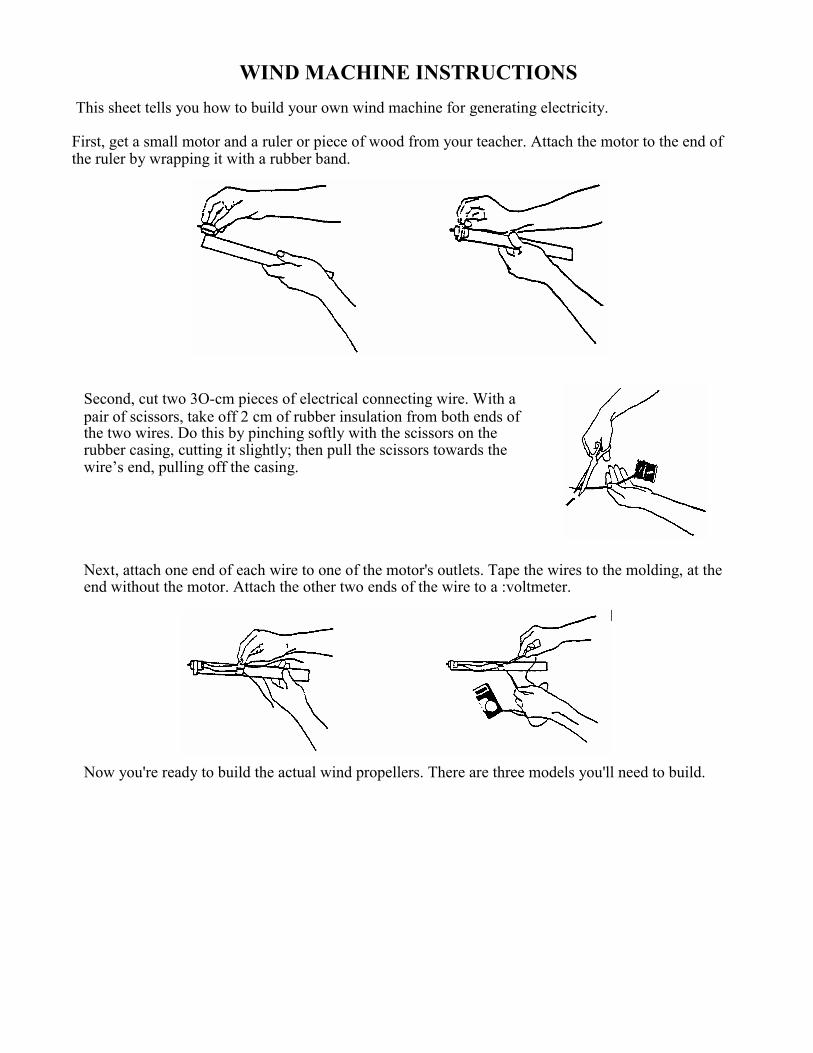
WIND MACHINE INSTRUCTIONS This sheet tells you how to build your own wind machine for generating electricity.
First, get a small motor and a ruler or piece of wood from your teacher. Attach the motor to the end ofthe ruler by wrapping it with a rubber band.
Second, cut two 3O-cm pieces of electrical connecting wire. With apair of scissors, take off 2 cm of rubber insulation from both ends ofthe two wires. Do this by pinching softly with the scissors on therubber casing, cutting it slightly; then pull the scissors towards thewire’s end, pulling off the casing.
Next, attach one end of each wire to one of the motor's outlets. Tape the wires to the molding, at theend without the motor. Attach the other two ends of the wire to a :voltmeter.
Now you're ready to build the actual wind propellers. There are three models you'll need to build.
WIND MACHINE INSTRUCTIONS (cont.)
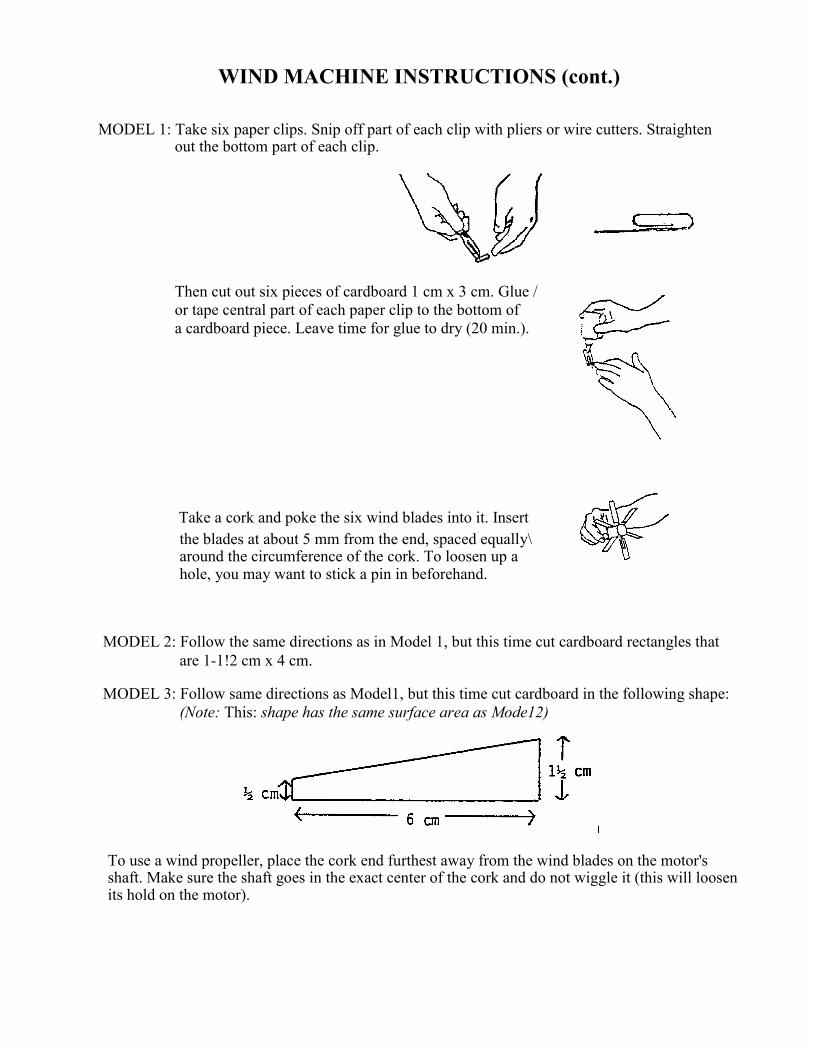
MODEL 1: Take six paper clips. Snip off part of each clip with pliers or wire cutters. Straightenout the bottom part of each clip.
Then cut out six pieces of cardboard 1 cm x 3 cm. Glue /or tape central part of each paper clip to the bottom ofa cardboard piece. Leave time for glue to dry (20 min.).
Take a cork and poke the six wind blades into it. Insertthe blades at about 5 mm from the end, spaced equally\around the circumference of the cork. To loosen up ahole, you may want to stick a pin in beforehand.
MODEL 2: Follow the same directions as in Model 1, but this time cut cardboard rectangles thatare 1-1!2 cm x 4 cm.
MODEL 3: Follow same directions as Model1, but this time cut cardboard in the following shape:(Note: This: shape has the same surface area as Mode12)
To use a wind propeller, place the cork end furthest away from the wind blades on the motor'sshaft. Make sure the shaft goes in the exact center of the cork and do not wiggle it (this will loosenits hold on the motor).
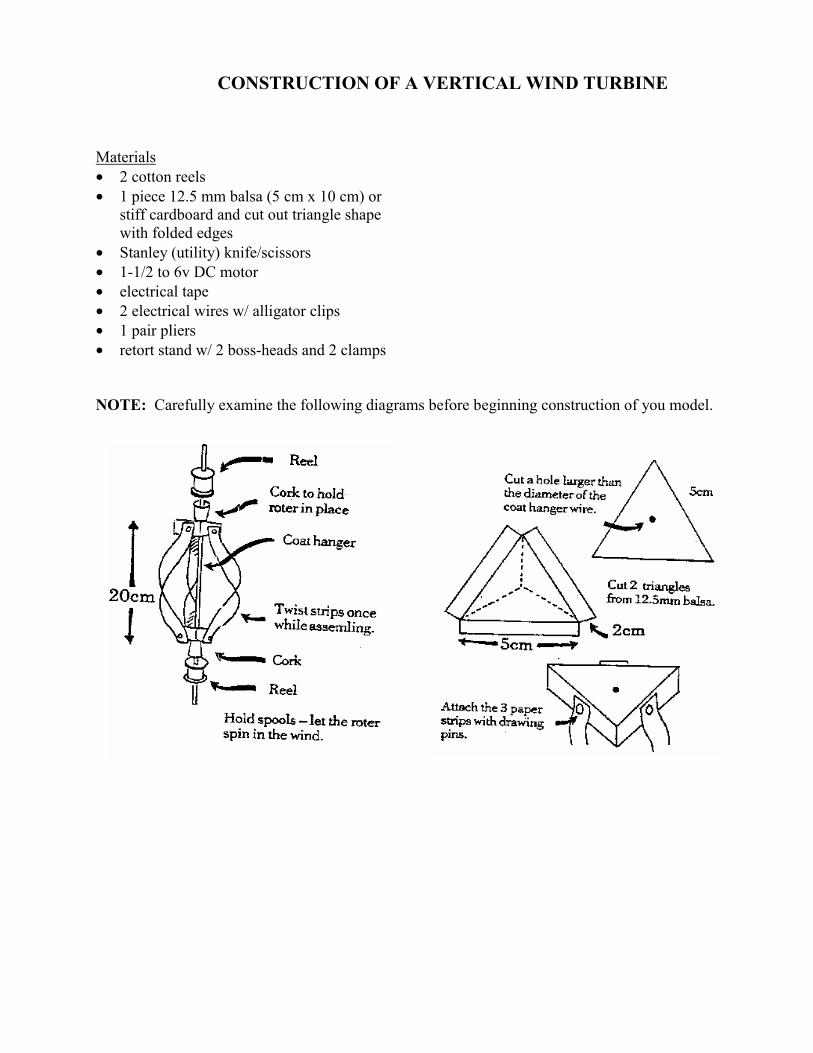
CONSTRUCTION OF A VERTICAL WIND TURBINE
Materials• 2 cotton reels• 1 piece 12.5 mm balsa (5 cm x 10 cm) or stiff cardboard and cut out triangle shape
with folded edges• Stanley (utility) knife/scissors• 1-1/2 to 6v DC motor• electrical tape• 2 electrical wires w/ alligator clips• 1 pair pliers• retort stand w/ 2 boss-heads and 2 clamps
NOTE: Carefully examine the following diagrams before beginning construction of you model.
SOLAR ENERGYProject #1: How does a solar box cooker
work?Project #2: What is the quality, quantity,
and distribution of the sun’s energy?Project #3: What are solar concentrators
and how do they work?Project #4: Photovoltaics
SOLAR ENERGY
The sun is a tremendous emitter of energy. Most of the energy is in the form of light and heat,which can be collected and used for generating electricity, as well as for heating, cooling andlighting building.
Photovoltaic Conversion Photovoltaic (solar) cells are large-area semiconductors that convertsunlight directly into electricity. Most of us have seen photographs of photovoltaics on roofs or onthe ground near homes and buildings. Photovoltaics can meet virtually any electric power need andare used for numerous applications including watches, calculators, satellites, telecommunications,homes, schools, factories and businesses. Because of the cost, photovoltaic systems are not widelyused, but advancements in efficiency and cost reduction should make photovoltaics economicallycompetitive with traditional power sources by the end of the decade.
Solar Thermal Systems Solar thermal systems convert the energy in sunlight to heat by usingconcentrations such as mirrors to focus sunlight onto a receiver. The receiver contains a fluid thatabsorbs the heat. The heat is then used to generate electricity or to warm buildings, dry agriculturalproducts or destroy harmful wastes. Solar thermal systems use three different types of concentrators-central receivers, parabolic dishes, and parabolic troughs. Central receiver systems use heliostats(highly reflective mirrors) that track the sun and reflect it to a central receiver atop a tower.Parabolic dish systems use dish-shaped reflectors to concentrate and reflect sunlight onto a receivermounted above the dish at its focal point. Parabolic trough systems use parabolic reflectors in atrough configuration and are the most mature solar thermal technology .
Solar Heating, Cooling and Lighting Energy from the sun is also used to heat, cool, and lightbuildings. Buildings are heated and cooled with active and passive systems. Active systems rely onmechanical components to collect and deliver heat. For example, active solar water heaters useelectrically powered pumps and valves to control the movement of warmed water. In contrast,passive systems use few mechanical components, relying instead on design features, gravity andnatural ventilation to heat and cool homes and buildings. Design features such as an atrium or highwindows that allow more sunlight to reach the interior reduce the need for electric lighting.
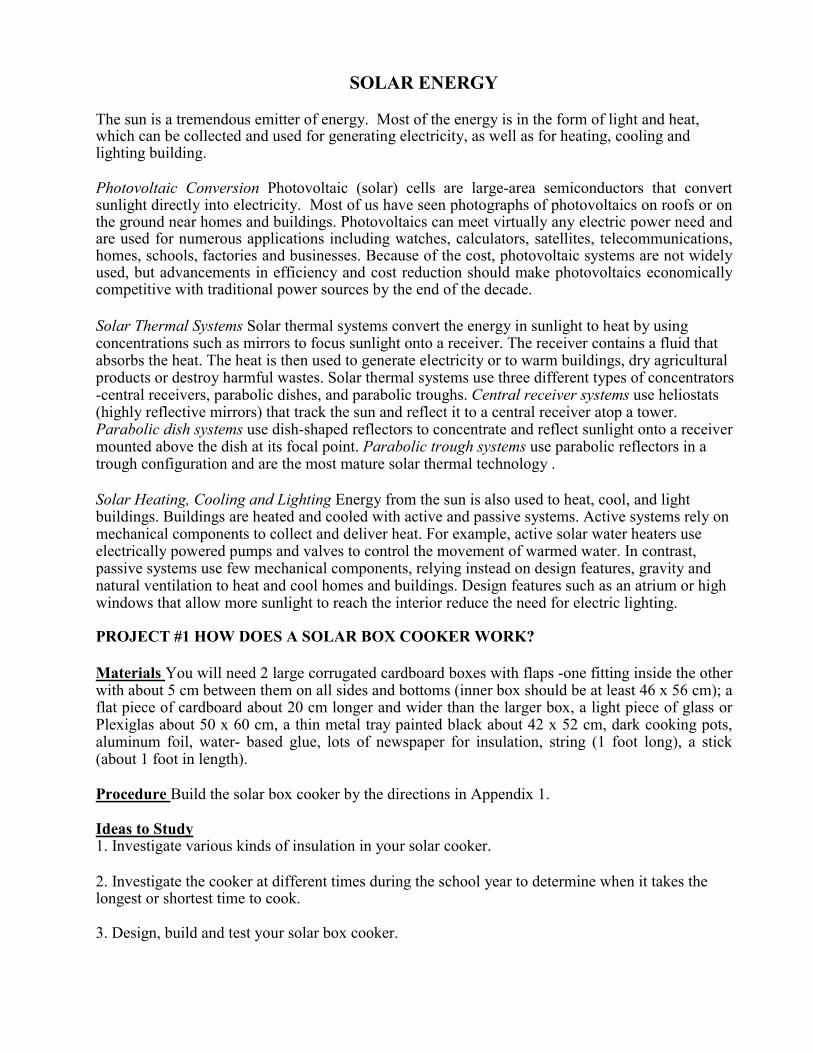
PROJECT #1 HOW DOES A SOLAR BOX COOKER WORK?
Materials You will need 2 large corrugated cardboard boxes with flaps -one fitting inside the otherwith about 5 cm between them on all sides and bottoms (inner box should be at least 46 x 56 cm); aflat piece of cardboard about 20 cm longer and wider than the larger box, a light piece of glass orPlexiglas about 50 x 60 cm, a thin metal tray painted black about 42 x 52 cm, dark cooking pots,aluminum foil, water- based glue, lots of newspaper for insulation, string (1 foot long), a stick(about 1 foot in length).
Procedure Build the solar box cooker by the directions in Appendix 1.
Ideas to Study1. Investigate various kinds of insulation in your solar cooker.
2. Investigate the cooker at different times during the school year to determine when it takes thelongest or shortest time to cook.
3. Design, build and test your solar box cooker.
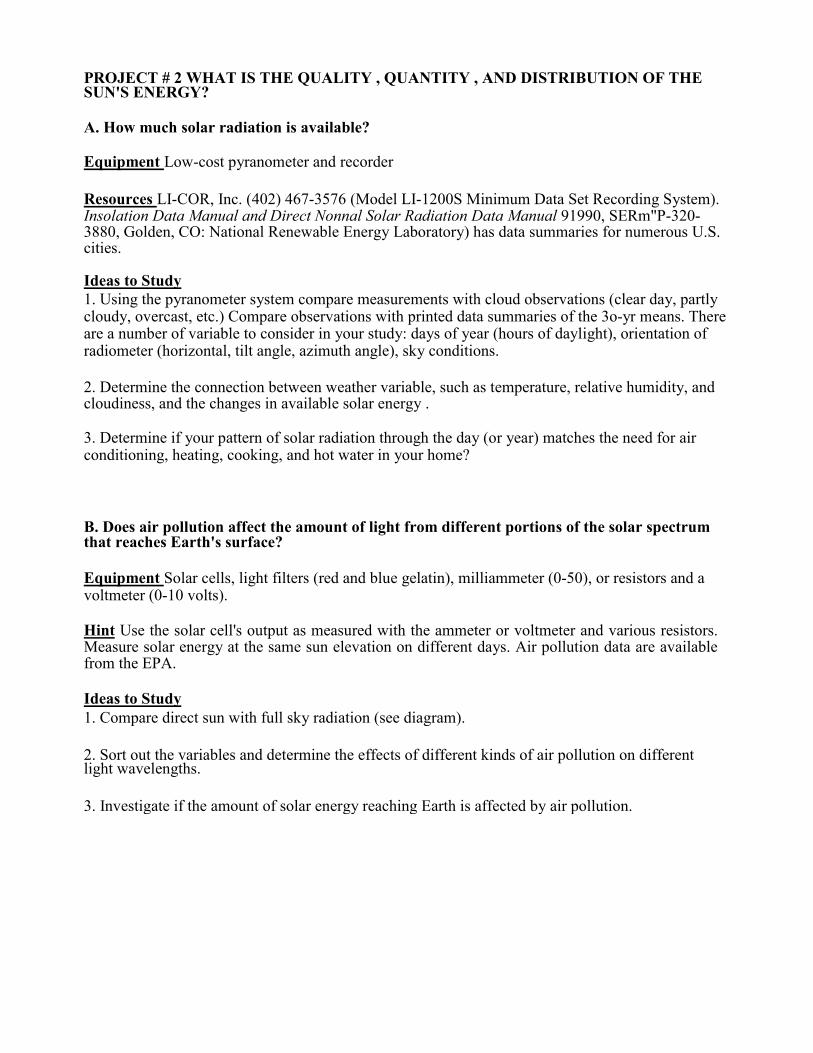
PROJECT # 2 WHAT IS THE QUALITY , QUANTITY , AND DISTRIBUTION OF THESUN'S ENERGY?
A. How much solar radiation is available?
Equipment Low-cost pyranometer and recorder
Resources LI-COR, Inc. (402) 467-3576 (Model LI-1200S Minimum Data Set Recording System).Insolation Data Manual and Direct Nonnal Solar Radiation Data Manual 91990, SERm"P-320-3880, Golden, CO: National Renewable Energy Laboratory) has data summaries for numerous U.S.cities.
Ideas to Study1. Using the pyranometer system compare measurements with cloud observations (clear day, partlycloudy, overcast, etc.) Compare observations with printed data summaries of the 3o-yr means. Thereare a number of variable to consider in your study: days of year (hours of daylight), orientation ofradiometer (horizontal, tilt angle, azimuth angle), sky conditions.
2. Determine the connection between weather variable, such as temperature, relative humidity, andcloudiness, and the changes in available solar energy .
3. Determine if your pattern of solar radiation through the day (or year) matches the need for airconditioning, heating, cooking, and hot water in your home?
B. Does air pollution affect the amount of light from different portions of the solar spectrumthat reaches Earth's surface?
Equipment Solar cells, light filters (red and blue gelatin), milliammeter (0-50), or resistors and avoltmeter (0-10 volts).
Hint Use the solar cell's output as measured with the ammeter or voltmeter and various resistors.Measure solar energy at the same sun elevation on different days. Air pollution data are availablefrom the EPA.
Ideas to Study1. Compare direct sun with full sky radiation (see diagram).
2. Sort out the variables and determine the effects of different kinds of air pollution on differentlight wavelengths.
3. Investigate if the amount of solar energy reaching Earth is affected by air pollution.
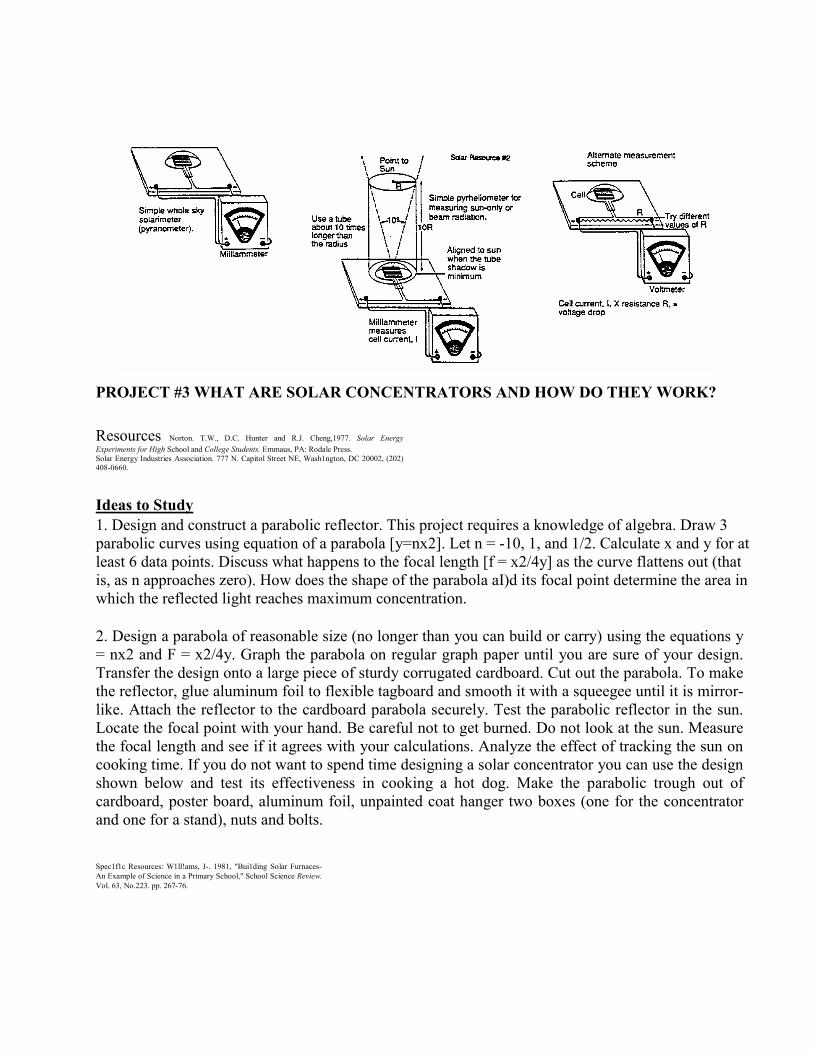
PROJECT #3 WHAT ARE SOLAR CONCENTRATORS AND HOW DO THEY WORK?
Resources Norton. T.W., D.C. Hunter and R.J. Cheng,1977. Solar EnergyExperiments for High School and College Students. Emmaus, PA: Rodale Press.Solar Energy Industries Association. 777 N. Capitol Street NE, Wash1ngton, DC 20002, (202)408-0660.
Ideas to Study1. Design and construct a parabolic reflector. This project requires a knowledge of algebra. Draw 3parabolic curves using equation of a parabola [y=nx2]. Let n = -10, 1, and 1/2. Calculate x and y for atleast 6 data points. Discuss what happens to the focal length [f = x2/4y] as the curve flattens out (thatis, as n approaches zero). How does the shape of the parabola aI)d its focal point determine the area inwhich the reflected light reaches maximum concentration.
2. Design a parabola of reasonable size (no longer than you can build or carry) using the equations y= nx2 and F = x2/4y. Graph the parabola on regular graph paper until you are sure of your design.Transfer the design onto a large piece of sturdy corrugated cardboard. Cut out the parabola. To makethe reflector, glue aluminum foil to flexible tagboard and smooth it with a squeegee until it is mirror-like. Attach the reflector to the cardboard parabola securely. Test the parabolic reflector in the sun.Locate the focal point with your hand. Be careful not to get burned. Do not look at the sun. Measurethe focal length and see if it agrees with your calculations. Analyze the effect of tracking the sun oncooking time. If you do not want to spend time designing a solar concentrator you can use the designshown below and test its effectiveness in cooking a hot dog. Make the parabolic trough out ofcardboard, poster board, aluminum foil, unpainted coat hanger two boxes (one for the concentratorand one for a stand), nuts and bolts.
Spec1f1c Resources: W1ll!ams, J-. 1981, "Bui1ding Solar Furnaces-An Example of Science in a Primary School," School Science Review.Vol. 63, No.223. pp. 267-76.
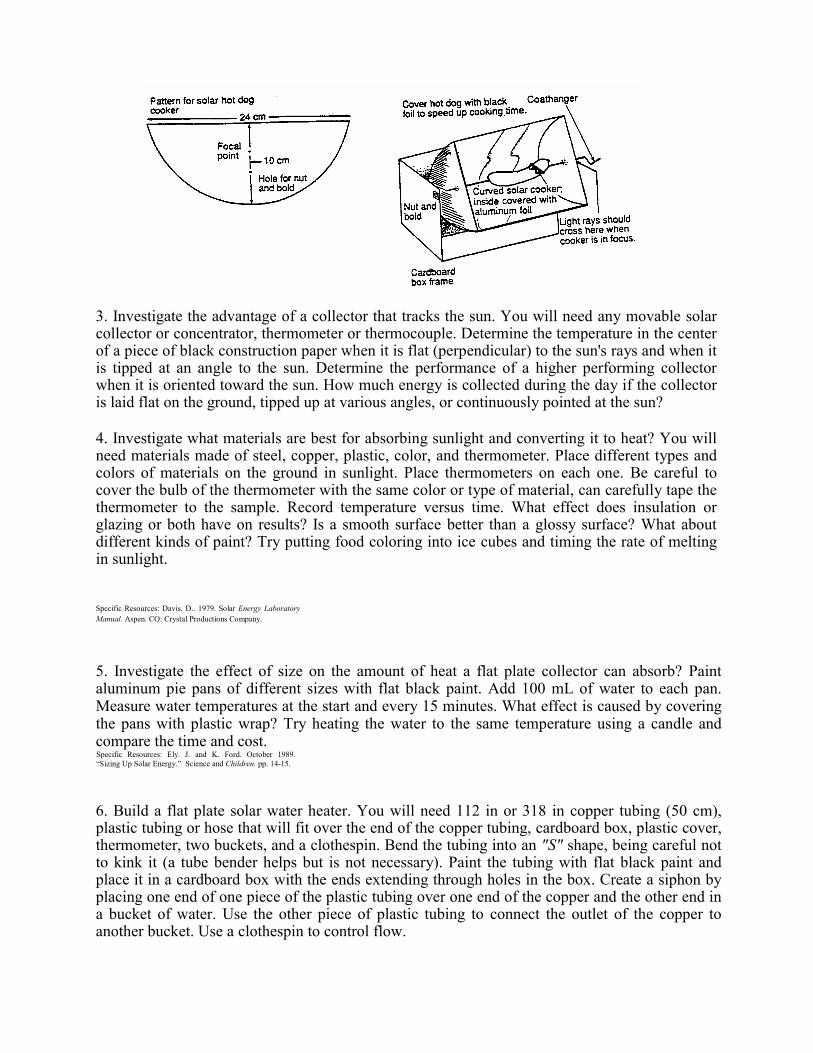
3. Investigate the advantage of a collector that tracks the sun. You will need any movable solarcollector or concentrator, thermometer or thermocouple. Determine the temperature in the centerof a piece of black construction paper when it is flat (perpendicular) to the sun's rays and when itis tipped at an angle to the sun. Determine the performance of a higher performing collectorwhen it is oriented toward the sun. How much energy is collected during the day if the collectoris laid flat on the ground, tipped up at various angles, or continuously pointed at the sun?
4. Investigate what materials are best for absorbing sunlight and converting it to heat? You willneed materials made of steel, copper, plastic, color, and thermometer. Place different types andcolors of materials on the ground in sunlight. Place thermometers on each one. Be careful tocover the bulb of the thermometer with the same color or type of material, can carefully tape thethermometer to the sample. Record temperature versus time. What effect does insulation orglazing or both have on results? Is a smooth surface better than a glossy surface? What aboutdifferent kinds of paint? Try putting food coloring into ice cubes and timing the rate of meltingin sunlight.
Specific Resources: Davis. D.. 1979. Solar Energy LaboratoryManual. Aspen. CO: Crystal Productions Company.
5. Investigate the effect of size on the amount of heat a flat plate collector can absorb? Paintaluminum pie pans of different sizes with flat black paint. Add 100 mL of water to each pan.Measure water temperatures at the start and every 15 minutes. What effect is caused by coveringthe pans with plastic wrap? Try heating the water to the same temperature using a candle andcompare the time and cost.Specific Resources: Ely. J. and K. Ford. October 1989.“Sizing Up Solar Energy.” Science and Children. pp. 14-15.
6. Build a flat plate solar water heater. You will need 112 in or 318 in copper tubing (50 cm),plastic tubing or hose that will fit over the end of the copper tubing, cardboard box, plastic cover,thermometer, two buckets, and a clothespin. Bend the tubing into an "S" shape, being careful notto kink it (a tube bender helps but is not necessary). Paint the tubing with flat black paint andplace it in a cardboard box with the ends extending through holes in the box. Create a siphon byplacing one end of one piece of the plastic tubing over one end of the copper and the other end ina bucket of water. Use the other piece of plastic tubing to connect the outlet of the copper toanother bucket. Use a clothespin to control flow.
Cover the box with plastic and set it in the sun. Measure the inlet and outlet water temperatures.Study the number of turns of copper tubing.
7. Investigate what collector (non-concentrating) designs work best for heating air .You willneed thermometers, fan, empty aluminum or steel cans, wood or cardboard box. Make a simpleair heater from a cardboard box. Paint the inside black and cover with plastic. Make two holesdiagonally (at opposite comers). Use a small fan to blow air through the collector or just let thewarm air flow out of the upper hole. Measure air temperatures at the inlet and outlet. You canalso measure the airflow rate. Cut cans in half, paint them black, and attach them to the bottomof the box to improve heat transfer to the air . Try insulation. Balance the cost of materials,construction time, and durability against performance.
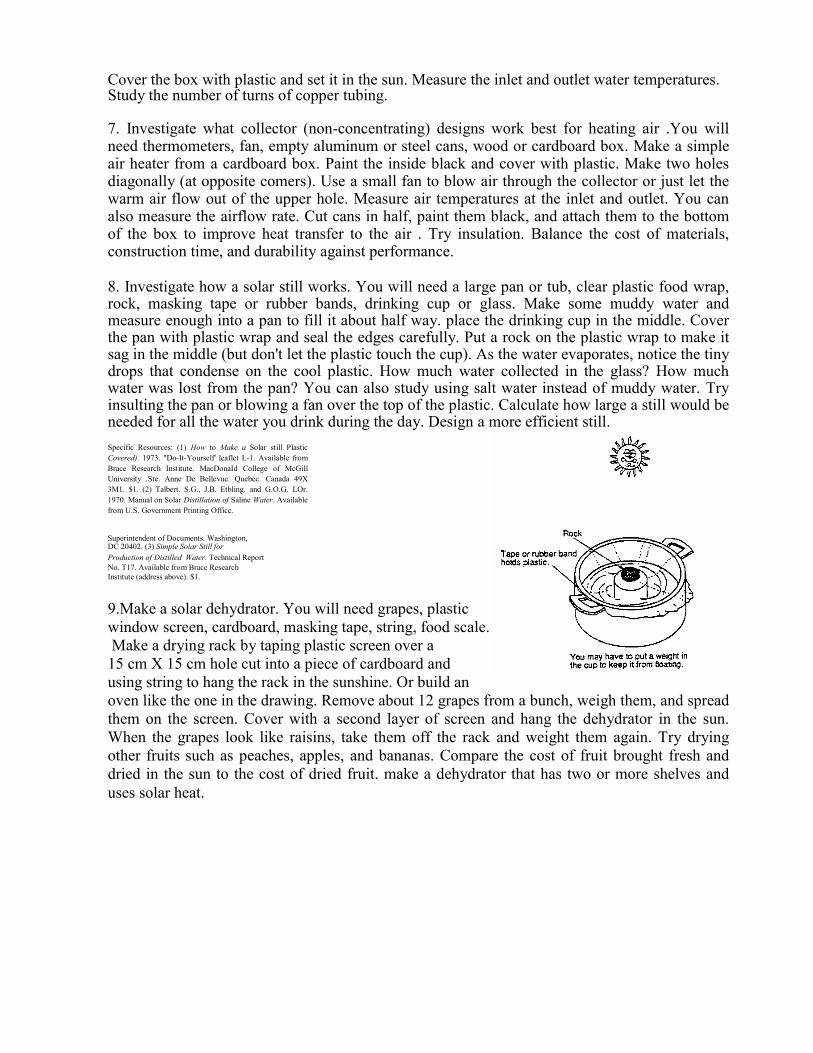
8. Investigate how a solar still works. You will need a large pan or tub, clear plastic food wrap,rock, masking tape or rubber bands, drinking cup or glass. Make some muddy water andmeasure enough into a pan to fill it about half way. place the drinking cup in the middle. Coverthe pan with plastic wrap and seal the edges carefully. Put a rock on the plastic wrap to make itsag in the middle (but don't let the plastic touch the cup). As the water evaporates, notice the tinydrops that condense on the cool plastic. How much water collected in the glass? How muchwater was lost from the pan? You can also study using salt water instead of muddy water. Tryinsulting the pan or blowing a fan over the top of the plastic. Calculate how large a still would beneeded for all the water you drink during the day. Design a more efficient still.Specific Resources: (1) How to Make a Solar still PlasticCovered). 1973. "Do-It-Yourself' leaflet L-1. Available fromBrace Research Institute. MacDonaId College of McGillUniversity .Ste. Anne De Bellevue. Quebec. Canada 49X3M1. $1. (2) Talbert. S.G., J.B. Etbling. and G.O.G. LOr.1970. Manual on Solar Distillation of Saline Water. Availablefrom U.S. Government Printing Office.
Superintendent of Documents. Washington,DC 20402. (3) Simple Solar Still forProduction of Distilled Water. Technical ReportNo. T17. Available from Brace ResearchInstitute (address above). $1.
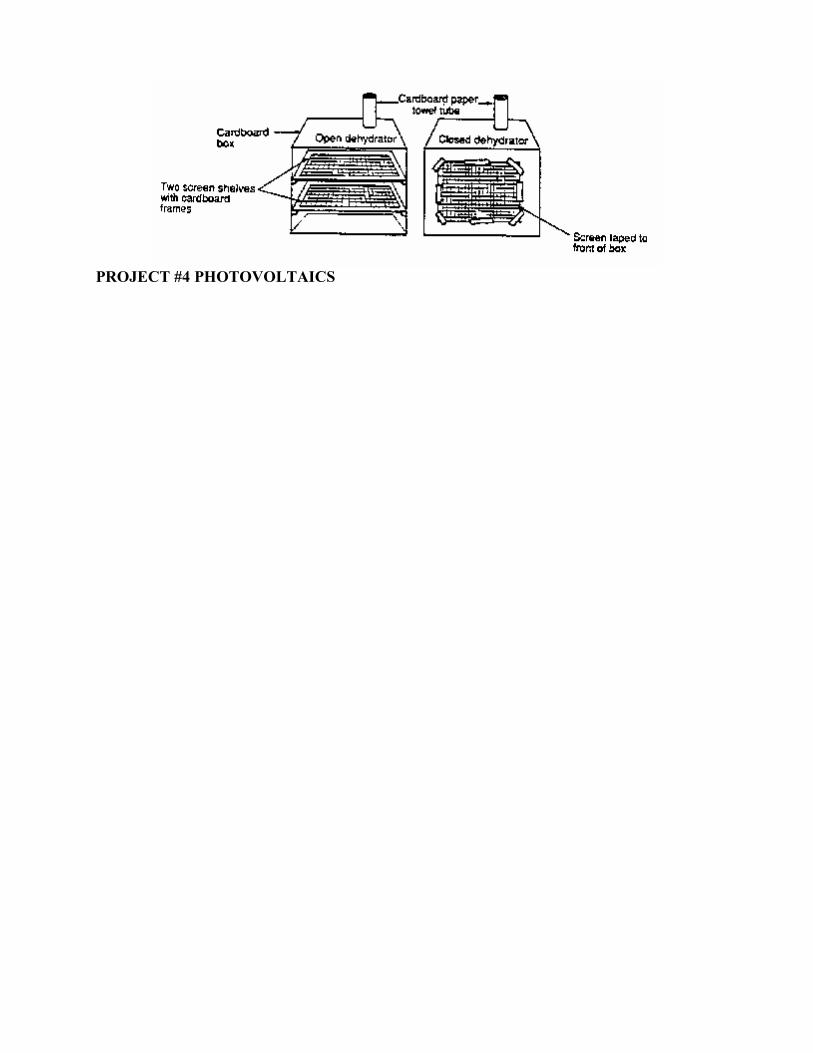
9.Make a solar dehydrator. You will need grapes, plasticwindow screen, cardboard, masking tape, string, food scale. Make a drying rack by taping plastic screen over a15 cm X 15 cm hole cut into a piece of cardboard andusing string to hang the rack in the sunshine. Or build anoven like the one in the drawing. Remove about 12 grapes from a bunch, weigh them, and spreadthem on the screen. Cover with a second layer of screen and hang the dehydrator in the sun.When the grapes look like raisins, take them off the rack and weight them again. Try dryingother fruits such as peaches, apples, and bananas. Compare the cost of fruit brought fresh anddried in the sun to the cost of dried fruit. make a dehydrator that has two or more shelves anduses solar heat.
PROJECT #4 PHOTOVOLTAICS
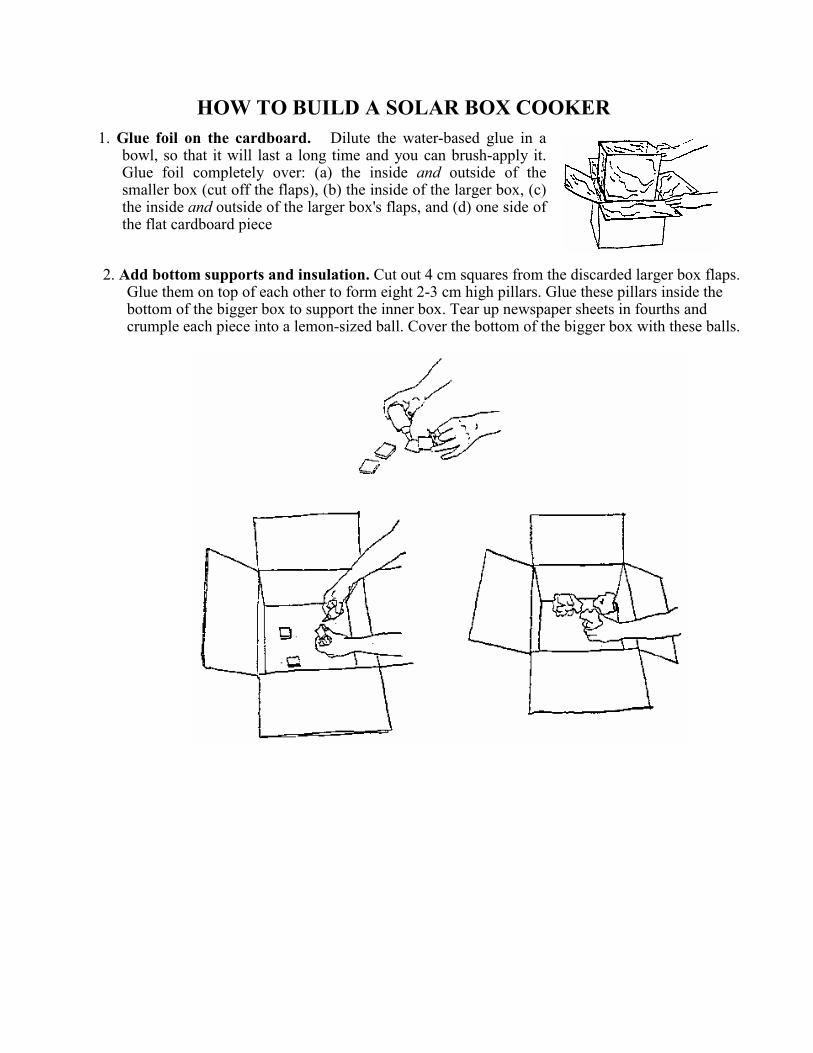
HOW TO BUILD A SOLAR BOX COOKER1. Glue foil on the cardboard. Dilute the water-based glue in a
bowl, so that it will last a long time and you can brush-apply it.Glue foil completely over: (a) the inside and outside of thesmaller box (cut off the flaps), (b) the inside of the larger box, (c)the inside and outside of the larger box's flaps, and (d) one side ofthe flat cardboard piece
2. Add bottom supports and insulation. Cut out 4 cm squares from the discarded larger box flaps.Glue them on top of each other to form eight 2-3 cm high pillars. Glue these pillars inside thebottom of the bigger box to support the inner box. Tear up newspaper sheets in fourths andcrumple each piece into a lemon-sized ball. Cover the bottom of the bigger box with these balls.
HOW TO BUILD A SOLAR BOX COOKER
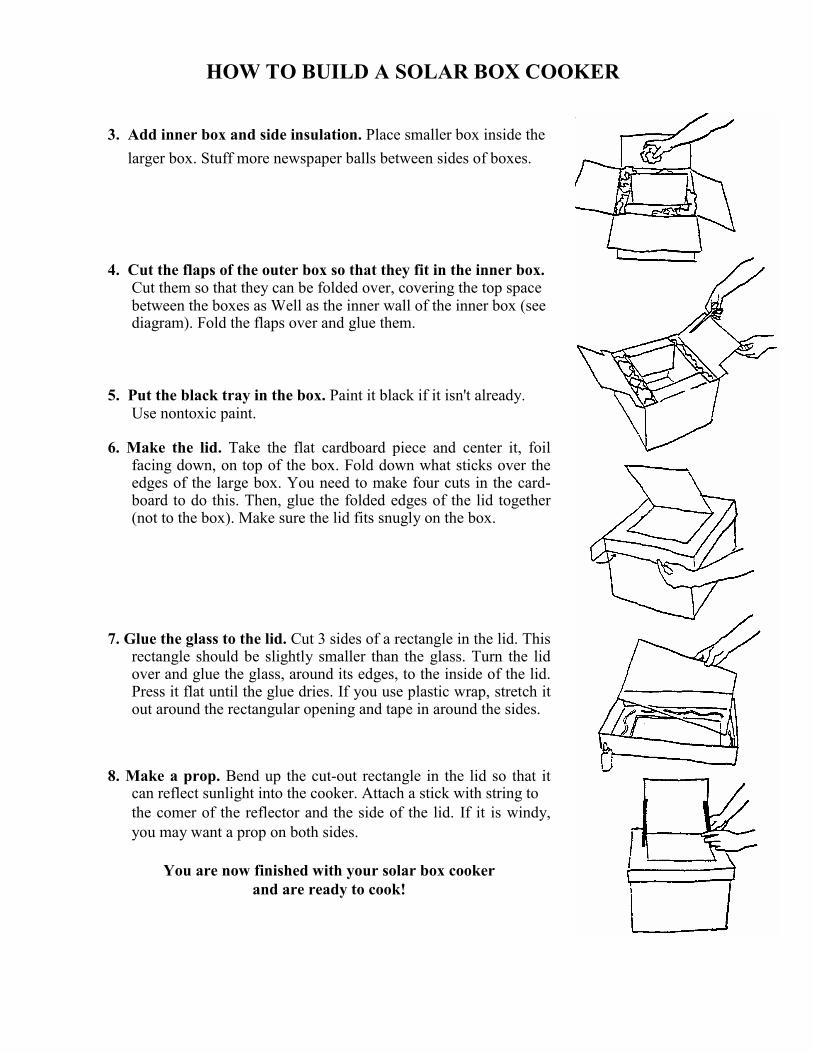
3. Add inner box and side insulation. Place smaller box inside the larger box. Stuff more newspaper balls between sides of boxes.
4. Cut the flaps of the outer box so that they fit in the inner box.Cut them so that they can be folded over, covering the top spacebetween the boxes as Well as the inner wall of the inner box (seediagram). Fold the flaps over and glue them.
5. Put the black tray in the box. Paint it black if it isn't already.Use nontoxic paint.
6. Make the lid. Take the flat cardboard piece and center it, foilfacing down, on top of the box. Fold down what sticks over theedges of the large box. You need to make four cuts in the card-board to do this. Then, glue the folded edges of the lid together(not to the box). Make sure the lid fits snugly on the box.
7. Glue the glass to the lid. Cut 3 sides of a rectangle in the lid. Thisrectangle should be slightly smaller than the glass. Turn the lidover and glue the glass, around its edges, to the inside of the lid.Press it flat until the glue dries. If you use plastic wrap, stretch itout around the rectangular opening and tape in around the sides.
8. Make a prop. Bend up the cut-out rectangle in the lid so that itcan reflect sunlight into the cooker. Attach a stick with string to
the comer of the reflector and the side of the lid. If it is windy,you may want a prop on both sides.
You are now finished with your solar box cookerand are ready to cook!
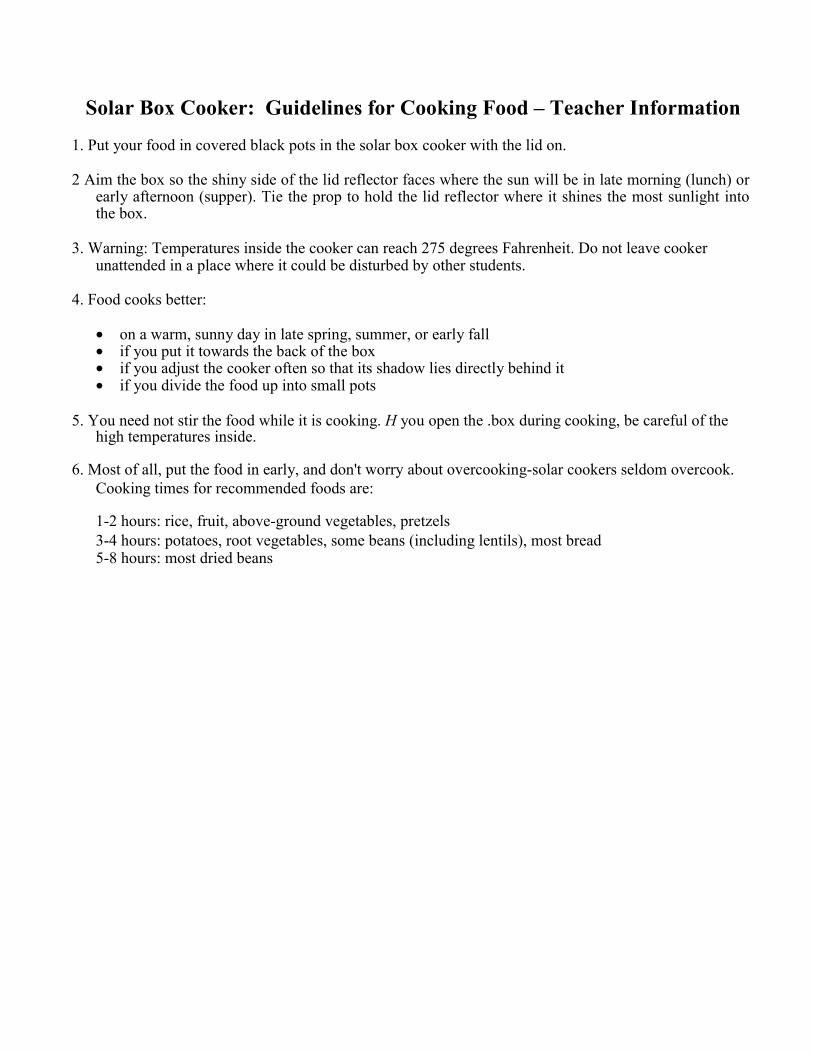
Solar Box Cooker: Guidelines for Cooking Food – Teacher Information
1. Put your food in covered black pots in the solar box cooker with the lid on.
2 Aim the box so the shiny side of the lid reflector faces where the sun will be in late morning (lunch) orearly afternoon (supper). Tie the prop to hold the lid reflector where it shines the most sunlight intothe box.
3. Warning: Temperatures inside the cooker can reach 275 degrees Fahrenheit. Do not leave cookerunattended in a place where it could be disturbed by other students.
4. Food cooks better:
• on a warm, sunny day in late spring, summer, or early fall• if you put it towards the back of the box• if you adjust the cooker often so that its shadow lies directly behind it• if you divide the food up into small pots
5. You need not stir the food while it is cooking. H you open the .box during cooking, be careful of thehigh temperatures inside.
6. Most of all, put the food in early, and don't worry about overcooking-solar cookers seldom overcook.Cooking times for recommended foods are:
1-2 hours: rice, fruit, above-ground vegetables, pretzels3-4 hours: potatoes, root vegetables, some beans (including lentils), most bread5-8 hours: most dried beans
RUBRIC FOR TASKASSESSMENTS
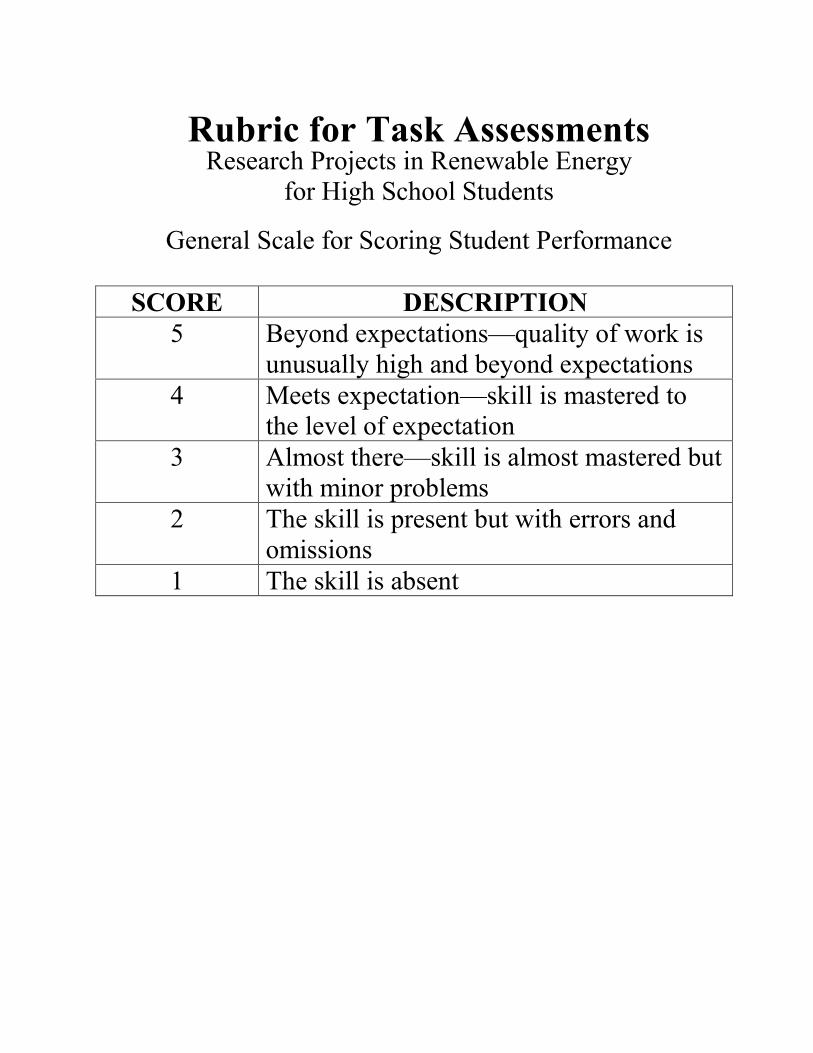
Rubric for Task AssessmentsResearch Projects in Renewable Energy
for High School Students
General Scale for Scoring Student Performance
SCORE DESCRIPTION5 Beyond expectations—quality of work is
unusually high and beyond expectations4 Meets expectation—skill is mastered to
the level of expectation3 Almost there—skill is almost mastered but
with minor problems2 The skill is present but with errors and
omissions1 The skill is absent