research project grants (rpgs) · pdf filenih extramural data book – last update may...
TRANSCRIPT

NIH Extramural Data Book – last update May 2008 Data provided by the Division of Information Services, Reporting Branch RPG 1
RESEARCH PROJECT GRANTS (RPGs)
Size of Awards

NIH Extramural Data Book – last update May 2008 Data provided by the Division of Information Services, Reporting Branch RPG 2
TABLE OF CONTENTS
RESEARCH PROJECT GRANTS SLIDE
NUMBER
RESEARCH PROJECT GRANTS BUDGET SHARE OF ACTUAL TOTAL NIH BUDGET FY 2007 3
RESEARCH PROJECT GRANTS BUDGET SHARE OF ENACTED TOTAL NIH BUDGET
FY 2008 4
AVERAGE AWARD AMOUNT OF ALL RESEARCH PROJECT GRANTS 5
AVERAGE AWARD AMOUNT OF SELECT RESEARCH PROJECT GRANTS – P01 6
AVERAGE AWARD AMOUNT OF SELECT RESEARCH PROJECT GRANTS – R01 7
AVERAGE AWARD AMOUNT OF SELECT RESEARCH PROJECT GRANTS – R03 8
AVERAGE AWARD AMOUNT OF SELECT RESEARCH PROJECT GRANTS – R15 9
AVERAGE AWARD AMOUNT OF SELECT RESEARCH PROJECT GRANTS – R21 10
AVERAGE AWARD AMOUNT OF SELECT RESEARCH PROJECT GRANTS – R37 11
AVERAGE AWARD AMOUNT OF SELECT RESEARCH PROJECT GRANTS – U01 12
AVERAGE AWARD AMOUNT OF SELECT RESEARCH PROJECT GRANTS – U19 13
NUMBER OF RESEARCH PROJECT GRANTS BY INSTITUTES AND CENTERS 14
Research Project Grants: Success Rates and Funding Rates 15
SUCCESS RATE OF RESEARCH PROJECT GRANT APPLICATIONS 16
FUNDING RATE OF RESEARCH PROJECT GRANT APPLICANTS 17
Research Project Grants: as a Percent of All Research Grants and
Solicited Awards 18
NUMBER OF RESEARCH PROJECT GRANT AWARDS AS A PERCENT OF ALL RESEARCH GRANT AWARDS 19
RESEARCH PROJECT GRANT FUNDING AS A PERCENT OF ALL RESEARCH GRANT FUNDING 20
NUMBER OF RESEARCH PROJECT GRANTS AWARDED THROUGH SOLICITED RESEARCH 21
RESEARCH PROJECT GRANTS FUNDED THROUGH SOLICITED RESEARCH 22
DEFINITIONS AND ADDITIONAL INFORMATION 23
DEFINITIONS AND ADDITIONAL INFORMATION 24

NIH Extramural Data Book – last update May 2008 Data provided by the Division of Information Services, Reporting Branch RPG 3
RESEARCH PROJECT GRANTS BUDGET SHARE OF ACTUAL TOTAL NIH BUDGET
FY 2007

NIH Extramural Data Book – last update May 2008 Data provided by the Division of Information Services, Reporting Branch RPG 4
RESEARCH PROJECT GRANTS BUDGET SHARE OF ENACTED TOTAL NIH BUDGET
FY 2008

NIH Extramural Data Book – last update May 2008 Data provided by the Division of Information Services, Reporting Branch RPG 5
$0
$50
$100
$150
$200
$250
$300
$350
$400
1998 1999 2000 2001 2002 2003 2004 2005 2006 2007
AVERAGE AWARD AMOUNT OF ALL RESEARCH PROJECT GRANTS
Fiscal Year
Ave
rage
Aw
ard
Am
ount
(in th
ousa
nds)
Average Amount Median

NIH Extramural Data Book – last update May 2008 Data provided by the Division of Information Services, Reporting Branch RPG 6
$0
$250
$500
$750
$1,000
$1,250
$1,500
$1,750
$2,000
1998 1999 2000 2001 2002 2003 2004 2005 2006 2007
AVERAGE AWARD AMOUNT OF SELECT RESEARCH PROJECT GRANTS – P01A
vera
ge A
war
d A
mou
nt(in
thou
sand
s)
Fiscal Year
Average Amount Median

NIH Extramural Data Book – last update May 2008 Data provided by the Division of Information Services, Reporting Branch RPG 7
$0
$50
$100
$150
$200
$250
$300
$350
$400
1998 1999 2000 2001 2002 2003 2004 2005 2006 2007
AVERAGE AWARD AMOUNT OF SELECT RESEARCH PROJECT GRANTS –
R01
Fiscal Year
Ave
rage
Aw
ard
Am
ount
(in th
ousa
nds)
Average Amount Median

NIH Extramural Data Book – last update May 2008 Data provided by the Division of Information Services, Reporting Branch RPG 8
$0
$15
$30
$45
$60
$75
$90
1998 1999 2000 2001 2002 2003 2004 2005 2006 2007
AVERAGE AWARD AMOUNT OF SELECT RESEARCH PROJECT GRANTS – R03
Fiscal Year
Ave
rage
Aw
ard
Am
ount
(in th
ousa
nds)
Average Amount Median

NIH Extramural Data Book – last update May 2008 Data provided by the Division of Information Services, Reporting Branch RPG 9
$0
$50
$100
$150
$200
$250
1998 1999 2000 2001 2002 2003 2004 2005 2006 2007
AVERAGE AWARD AMOUNT OF SELECT RESEARCH PROJECT GRANTS – R15
Fiscal Year
Ave
rage
Aw
ard
Am
ount
(in th
ousa
nds)
Average Amount Median

NIH Extramural Data Book – last update May 2008 Data provided by the Division of Information Services, Reporting Branch RPG 10
$0
$50
$100
$150
$200
$250
1998 1999 2000 2001 2002 2003 2004 2005 2006 2007
AVERAGE AWARD AMOUNT OF SELECT RESEARCH PROJECT GRANTS – R21
Fiscal Year
Ave
rage
Aw
ard
Am
ount
(in th
ousa
nds)
Average Amount Median

NIH Extramural Data Book – last update May 2008 Data provided by the Division of Information Services, Reporting Branch RPG 11
$0
$100
$200
$300
$400
$500
1998 1999 2000 2001 2002 2003 2004 2005 2006 2007
AVERAGE AWARD AMOUNT OF SELECT RESEARCH PROJECT GRANTS – R37
Fiscal Year
Ave
rage
Aw
ard
Am
ount
(in th
ousa
nds)
Average Amount Median

NIH Extramural Data Book – last update May 2008 Data provided by the Division of Information Services, Reporting Branch RPG 12
$0
$200
$400
$600
$800
$1,000
$1,200
1998 1999 2000 2001 2002 2003 2004 2005 2006 2007
AVERAGE AWARD AMOUNT OF SELECT RESEARCH PROJECT GRANTS – U01
Fiscal Year
Ave
rage
Aw
ard
Am
ount
(in th
ousa
nds)
Average Amount Median

NIH Extramural Data Book – last update May 2008 Data provided by the Division of Information Services, Reporting Branch RPG 13
$0
$500
$1,000
$1,500
$2,000
$2,500
1998 1999 2000 2001 2002 2003 2004 2005 2006 2007
AVERAGE AWARD AMOUNT OF SELECT RESEARCH PROJECT GRANTS – U19
Average Amount Median
Fiscal Year
Ave
rage
Aw
ard
Am
ount
(in th
ousa
nds)

NIH Extramural Data Book – last update May 2008 Data provided by the Division of Information Services, Reporting Branch RPG 14
NUMBER OF RESEARCH PROJECT GRANTS
BY INSTITUTES AND CENTERS
199819992000200120022003200420052006
NCMHDNLMNCCAMNIBIB
NHGRIFICNCRRNINR
NIDCR
NIEHS
NIDCD
NIAAA
NIAMSNEI
NIDANIA
NICHDNIM
H
NINDS
NIDDK
NIAID
NIGMS
NHLBINCI
0
500
1,000
1,500
2,000
2,500
3,000
3,500
4,000
4,500
2007
NCMHDNLM
NCCAMNIBIB
NHGRIFIC
NCRR
NINR
NIDCR
NIEHS
NIDCD
NIAAA
NIAM
SNEI
NIDANIA
NICHD
NIMH
NINDS
NIDDK
NIAID
NIGMS
NHLBI
NCI
0
5001,000
1,5002,000
2,5003,000
3,5004,000
4,500
Fiscal Year
NIH Institutes and Centers
Num
ber o
f Aw
ards

NIH Extramural Data Book – last update May 2008 Data provided by the Division of Information Services, Reporting Branch RPG 15
RESEARCH PROJECT GRANTS (RPG)
Success Rates and Funding Rates
NIH Extramural Data Book – last update May 2008 Data provided by the Division of Information Services, Reporting Branch RPG 16
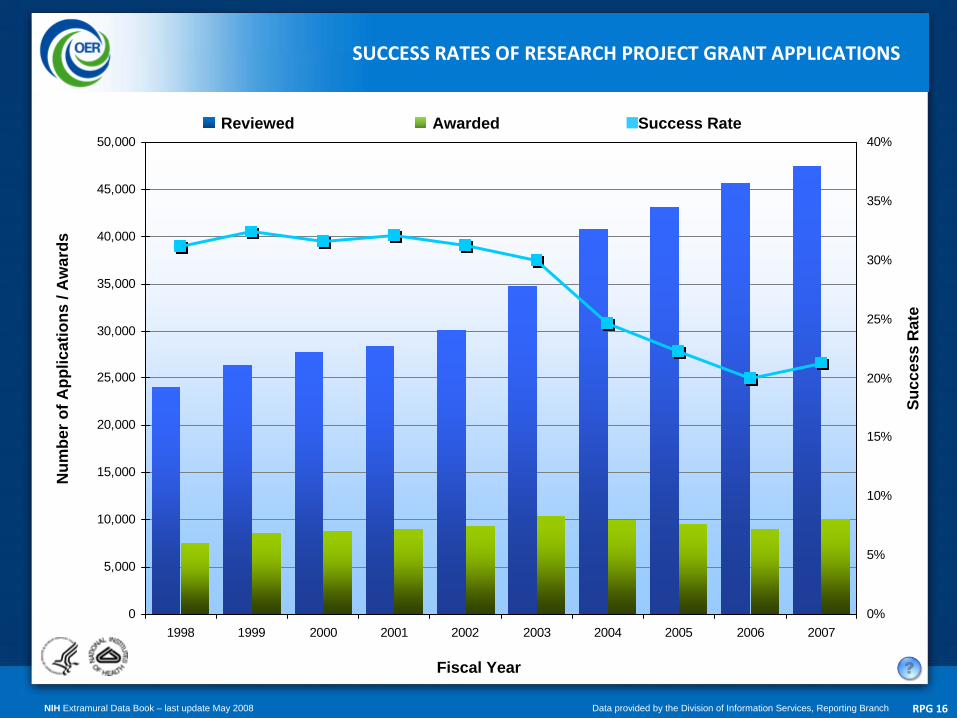
SUCCESS RATES OF RESEARCH PROJECT GRANT APPLICATIONS
0
5,000
10,000
15,000
20,000
25,000
30,000
35,000
40,000
45,000
50,000
1998 1999 2000 2001 2002 2003 2004 2005 2006 20070%
5%
10%
15%
20%
25%
30%
35%
40%
Fiscal Year
Num
ber o
f App
licat
ions
/ A
war
ds
Succ
ess
Rat
e
Reviewed Awarded Success Rate

NIH Extramural Data Book – last update May 2008 Data provided by the Division of Information Services, Reporting Branch RPG 17
0
5,000
10,000
15,000
20,000
25,000
30,000
35,000
1998 1999 2000 2001 2002 2003 2004 2005 2006 20070%
5%
10%
15%
20%
25%
30%
35%
40%
FUNDING RATE OF RESEARCH PROJECT GRANT APPLICANTS
Fiscal Year
Num
ber of App
lican
ts / Awarde
es
Fund
ing
Rat
e
Reviewed Awarded Funding Rate
NIH Extramural Data Book – last update May 2008 Data provided by the Division of Information Services, Reporting Branch RPG 18
RESEARCH PROJECT GRANTS (RPGs)
as a Percent of All Research Grants and Solicited Awards
NIH Extramural Data Book – last update May 2008 Data provided by the Division of Information Services, Reporting Branch RPG 19
0
5,000
10,000
15,000
20,000
25,000
30,000
35,000
40,000
1998 1999 2000 2001 2002 2003 2004 2005 2006 20070%
10%
20%
30%
40%
50%
60%
70%
80%
90%
100%
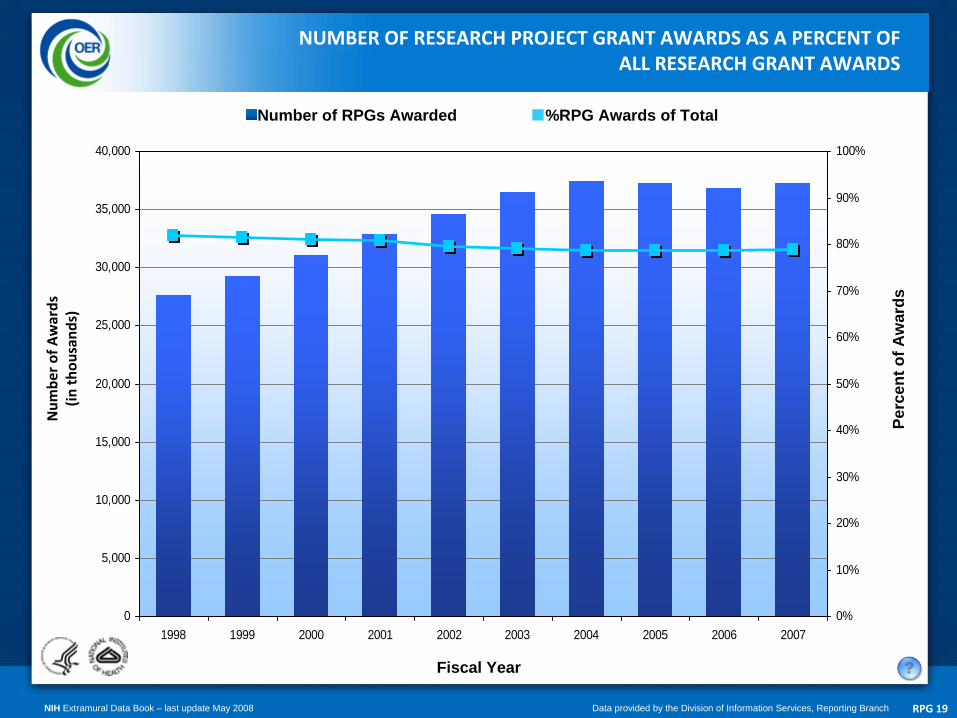
NUMBER OF RESEARCH PROJECT GRANT AWARDS AS A PERCENT OF
ALL RESEARCH GRANT AWARDS
Fiscal Year
Num
ber of Awards
(in th
ousand
s)
Perc
ent o
f Aw
ards
Number of RPGs Awarded %RPG Awards of Total

NIH Extramural Data Book – last update May 2008 Data provided by the Division of Information Services, Reporting Branch RPG 20
$0
$2
$4
$6
$8
$10
$12
$14
$16
1998 1999 2000 2001 2002 2003 2004 2005 2006 20070%
10%
20%
30%
40%
50%
60%
70%
80%
90%
100%
RESEARCH PROJECT GRANT FUNDING AS A PERCENT OF
ALL RESEARCH GRANT FUNDING
Fiscal Year
Fund
ing
(in b
illio
ns)
Perc
ent F
undi
ng
RPGs Funding %RPG Funding of Total

NIH Extramural Data Book – last update May 2008 Data provided by the Division of Information Services, Reporting Branch RPG 21
0
5,000
10,000
15,000
20,000
25,000
30,000
35,000
40,000
1998 1999 2000 2001 2002 2003 2004 2005 2006 20070%
10%
20%
30%
40%
50%
60%
70%
80%
90%
100%
NUMBER OF RESEARCH PROJECT GRANTS AWARDED
THROUGH SOLICITED RESEARCH
Fiscal Year
Num
ber o
f Aw
ards
(in th
ousa
nds)
Perc
ent o
f Aw
ards
Number of RPGs Awarded % Awarded Through Solicited Research

NIH Extramural Data Book – last update May 2008 Data provided by the Division of Information Services, Reporting Branch RPG 22
$0
$2
$4
$6
$8
$10
$12
$14
$16
1998 1999 2000 2001 2002 2003 2004 2005 2006 20070%
10%
20%
30%
40%
50%
60%
70%
80%
90%
100%
RESEARCH PROJECT GRANTS FUNDED THROUGH SOLICITED RESEARCH
Fiscal Year
Fund
ing
(in b
illio
ns)
Perc
ent F
undi
ng
RPGs Funding % Funding Through Solicited Research

NIH Extramural Data Book – last update May 2008 Data provided by the Division of Information Services, Reporting Branch RPG 23
DEFINITIONS AND ADDITIONAL INFORMATION
TERM DEFINITION ADDITIONAL
INFORMATION
Funding Rate Indicates the percentage of applicants receiving awards on a fiscal year basis. This
percentage is computed by dividing the number of applicants that
received funding by the
total number of applicants that competed for a grant in the same
fiscal year.
Funding rates differ from success rates in that calculated percentages are based on applicants
(individuals) and not applications.
Research Grants Extramural awards made for Other Research Grants, Research Centers , Research Projects,
and SBIR/STTRs.
Includes the following: R, P, M, S, K, U series (excluding UC6) DP1, DP2, D42,G12.
Research Project Grants
(RPGs)Includes the following selected Research Grant and Cooperative Agreement activities: R00,
R01, R03, R15, R21, R22, R23, R29, R33, R34, R35, R36, R37, R55,
R56, RL1, RL2, RL5, RL9,
P01, P42, PN1, UC1, UC7, U01, U19, U34, DP1, and DP2. Also includes RPGs
from NLM as of
FY07.
Exceptions:• In 1980 & 1981 activity code, U01 was not a research project.
• From 1989 until 1992 activity code, R55 was not a research project.
• In 1986 NINR did not have any research projects. • From 1984 until 1989 NCRR did not have any research projects.
• FIC did not have any research projects until 1994. • From 1991 until 1996 NCRR did not consider R21's research projects.
• NLM had no research projects prior to 2007. • In FY 2002, P41s not RPG for NIGMS.
Activity Code Descriptions
To access data tables for each slide while in presentation view right-click on the slide and select “edit slides” Then double-click on the graph image and the datasheet should appear in a separate window or select the data tab from the
spreadsheet. If the datasheet does not appear, right-click in the chart area and select “datasheet”

NIH Extramural Data Book – last update May 2008 Data provided by the Division of Information Services, Reporting Branch RPG 24
TERM DEFINITION ADDITIONAL
INFORMATION
Solicited Research Responses to Requests for Applications (RFA’s) Funding Opportunities and Notices
Success Rate Indicates the percentage of reviewed applications
receiving funding computed on a fiscal year basis. It is
determined by dividing the number of competing applications funded by the sum of the total number of
competing applications reviewed and the number of funded carryovers.
Success rates differ from funding rates in that calculated percentages are based on applications and not
applicants (individuals).
NOTE: Applications having one or more amendments in the same fiscal year are only counted once.
DEFINITIONS AND ADDITIONAL INFORMATION