research paper memory in multiple sclerosis is linked to...
TRANSCRIPT
RESEARCH PAPER
Memory in multiple sclerosis is linked to glutamateconcentration in grey matter regionsNils Muhlert,1,2 Matteo Atzori,3,4 Enrico De Vita,5,6 David L Thomas,6
Rebecca S Samson,1 Claudia A M Wheeler-Kingshott,1 Jeroen J G Geurts,7
David H Miller,1,8 Alan J Thompson,3,8 Olga Ciccarelli3,8
▸ Additional material ispublished online only. To viewplease visit the journal online(http://dx.doi.org/10.1136/jnnp-2013-306662).1Department ofNeuroinflammation, NMRResearch Unit, UCL Institute ofNeurology, London, UK2Cognitive Neuroscience,Department of Psychology,Cardiff University, Cardiff, UK3Department of Brain Repairand Rehabilitation, NMRResearch Unit, UCL Institute ofNeurology, London, UK4Department of Neurology,University of Padova, Padova,Italy5Lysholm Department ofNeuroradiology, NationalHospital for Neurology andNeurosurgery, London, UK6Neuroradiological AcademicUnit, Department of BrainRepair and Rehabilitation, UCLInstitute of Neurology,London, UK7Department of Anatomy andNeuroscience, Section ofClinical Neuroscience, VUUniversity Medical Center,VUmc MS Center Amsterdam,Amsterdam, The Netherlands8National Institute for Healthand Research (NIHR) UniversityCollege London Hospital(UCLH) Biomedical ResearchCentre, London, UK
Correspondence toDr Nils Muhlert, CognitiveNeuroscience, CardiffUniversity, Tower Building,Cardiff CF10 3AT, UK;[email protected]
Received 28 August 2013Revised 3 December 2013Accepted 5 December 2013Published Online First15 January 2014
To cite: Muhlert N,Atzori M, De Vita E, et al.J Neurol Neurosurg Psychiatry2014;85:834–840.
ABSTRACTObjective Glutamate is the principal excitatoryneurotransmitter and is involved in normal brain function.Cognitive impairment is common in multiple sclerosis(MS), and understanding its mechanisms is crucial fordeveloping effective treatments. We used structural andmetabolic brain imaging to test two hypotheses: (i)glutamate levels in grey matter regions are abnormal inMS, and (ii) patients show a relationship betweenglutamate concentration and memory performance.Methods Eighteen patients with relapsing-remitting MSand 17 healthy controls were cognitively assessed andunderwent 1H-magnetic resonance spectroscopy at 3 T toassess glutamate levels in the hippocampus, thalamus,cingulate and parietal cortices. Regression modelsinvestigated the association between glutamateconcentration and memory performance independently ofmagnetisation transfer ratio values and grey matterlesions withint he same regions, and whole-brain greymatter volume.Results Patients had worse visual and verbal memorythan controls. A positive relationship between glutamatelevels in the hippocampal, thalamic and cingulate regionsand visuospatial memory was detected in patients, butnot in healthy controls.Conclusions The relationship between memory andglutamate concentration, which is unique to MS patients,suggests the reliance of memory on glutamatergic systemsin MS.
INTRODUCTIONCognitive impairment is common in multiple scler-osis (MS), occurs at all stages of the disease andgreatly impacts on patients’ lives.1 Memory is fre-quently affected and has been linked to both wide-spread grey matter (GM) cortical thinning2 andatrophy in specific GM regions, such as the hippo-campus.3 MRI-derived GM atrophy may reflectneuronal loss, demyelination or reduced synapse orglial densities.4 Neuronal loss and demyelinationcan be prominent features in the hippocampi ofMS patients.5 Demyelinated MS hippocampi alsoshow reductions in synaptic density and in theneuronal proteins essential for axonal transport,synaptic plasticity, glutamate neurotransmission,glutamate homeostasis and memory, relative to nor-mally myelinated hippocampi.6 Similarly, reduc-tions in excitatory amino acid transporters, whichcarry glutamate from the synaptic cleft to astro-cytes, have been observed.7 These postmortem
findings implicate abnormal glutamate neurotrans-mission in cognitive impairment in MS.Current imaging techniques do not allow direct
measurement of glutamate neurotransmissionbecause several of its components are not detectablein vivo, including the functioning of glutamate recep-tors and transporters, glutamate–glutamine cyclingand synaptic activity. However, estimates of the totalconcentration of glutamate (and its precursor glutam-ine) can be obtained with in vivo MR spectroscopy(MRS). Although the availability of the neurotrans-mitter pool cannot be measured in vivo, the concen-tration of glutamate inside the nerve terminal cells isseveral thousand times higher than in the extracellu-lar fluid. MRS studies in patients with schizophreniahave demonstrated reduced glutamate levels andincreased glutamine concentration in the medial pre-frontal region,8 suggesting aberrant glutamatergicprocesses in schizophrenia. In people with MS, MRSstudies have shown increased glutamate levels inactive lesions and normal-appearing white matter(WM), suggesting possible mechanisms of glutamate-mediated excitotoxicity, but normal levels in chroniclesions, compared with controls.9 The effect of MSon levels of glutamate in the GM remains unknown.In this study, we address two hypotheses: (i) glu-
tamate levels in hippocampal, thalamic, cingulateand parietal GM regions are abnormal in patientswith relapsing-remitting (RR) MS; (ii) there is anassociation between glutamate levels in GM regionsand memory function. In particular, we predictedthat visuospatial memory would be related to glu-tamate in these regions, given its links with theright hippocampus,10 and previous links with thal-amic integrity in people with MS.11 12 We alsoinvestigated whether this association was independ-ent of imaging measures derived from the sameareas, reflecting structural damage (such as demye-lination and reduced axonal density).
MATERIALS AND METHODSSubjectsEighteen patients with a diagnosis of RRMS13 andwithout a history of relapse or treatment with corti-costeroids within the preceding 4 weeks wererecruited. Seventeen age-matched and gender-matched healthy volunteers were also studied.Matching was carried out at group level and not ona case-by-case basis. Written informed consent wasobtained for participation in the study, which wasapproved by our local ethics committee.
Open AccessScan to access more
free content
834 Muhlert N, et al. J Neurol Neurosurg Psychiatry 2014;85:834–840. doi:10.1136/jnnp-2013-306662
Multiple sclerosis
on 26 June 2018 by guest. Protected by copyright.
http://jnnp.bmj.com
/J N
eurol Neurosurg P
sychiatry: first published as 10.1136/jnnp-2013-306662 on 15 January 2014. Dow
nloaded from

Cognitive testsVisuospatial learning and memory was assessed using the PairedAssociates Learning (PAL) test from the CANTAB (CambridgeCognition, Cambridge, UK). In this test, participants have toremember the location of patterns presented in different areas ofthe screen. The number of patterns increases over a series oftrials from two to eight patterns. Two age-scaled z-scores are pro-duced based on standardised normative data: the number oftrials completed at the first attempt and the total number of trialsneeded to complete the test. To assess cognition generally, wealso assessed verbal learning and memory using list-learning fromthe Adult Memory and Information Processing Battery (AMIPB)and working memory with the digit-span from the WechslerAdult Intelligence Scale-III.14 Speed of information processingwas assessed using the oral version of the Symbol-DigitModalities Test (SDMT), for which z-scores were obtained withreference to published norms.15 Executive function was mea-sured using the Stroop colour-word interference test.16
Premorbid IQ was measured using the National Adult ReadingTest, and current IQ was measured with the two-subtest versionof the Wechsler Abbreviated Scale of Intelligence (vocabulary andmatrix reasoning). Levels of anxiety and depression were mea-sured with the Hospital Anxiety and Depression Scale.17
Failure of a test (ie, PAL trials at first attempt, PAL total trials,AMIPB list learning, AMIPB delayed recall, SDMT, Stroop) wasdefined as a score at two or more SDs below the mean of thecontrols. Patients with significant cognitive impairment weredefined as those showing failure on at least two tests.
MRI protocol and analysisImaging was performed on a 3 T Siemens Tim Trio scannerwith a 32-channel head coil.
Magnetisation Transfer (MT) imagingSagittal volumes were acquired at 1×1×1 mm3 (FOV240×256×176 mm3; phase encoding direction superior/inferior;GRAPPA acceleration factor 2). A slab selective 3D multiechoFLASH sequence (repetition time (TR)=23.7 ms, echo time (TE)=2.2 ms, flip angle (α)=6°) was performed twice, with either pre-dominantly PD-weighting (eight equally spaced echoes with a TEdifference of 2.5 ms) or MT-weighting (with an additional 4 msoff-resonance Gaussian radiofrequency (RF) pulse (nominalα=220°, offset frequency 2 kHz) before each excitation pulse, sixequally spaced echoes18). The multiecho data were averaged (forthe PD-weighted images, the first six echoes only were averaged)and the resulting MT-w (MTon) and PD-w (MToff) images werecoregistered to the T1-weighted volume prior to calculation of themagnetisation transfer ratio (MTR) maps (MTR=MToff – MTon/MToff). MTR maps were masked using the spectroscopicvolumes-of-interest (VOIs), and the mean MTR was calculatedwithin each VOI.
Single-voxel spectroscopyA single-voxel PRESS with chemical selective saturation water sup-pression was used (TR=6000 ms, TE=30 ms). The long TR waschosen to minimise the potential effect of pathological T1 changeson the acquired spectra. The dimensions and averages for the VOIwere as follows: (1) right hippocampus: dimensions26×16×16 mm3, VOI volume=7.3 mL, 144 averages; (2) rightthalamus: dimensions 26×16×16 mm3, VOI volume=6.7 mL,144 averages; (3) posterior cingulate cortex: dimensions30×25×16 mm3, VOI volume=12 mL, 48 averages; and (4)medial posterior parietal cortex: dimensions 25×25×25 mm3, VOI
volume=15.6 mL, 48 averages. Example placements of each VOIcan be seen in figure 1. A non-water-suppressed spectrum was alsoacquired with the same parameters (two averages) to provide aninternal water reference to scale the measured metabolite signals.
The spectra were analysed using LCModel 6.1.19 LCModel wasused to estimate the concentrations of glutamate ([Glu]),glutamate plus glutamine ([Glx]), total N-acetyl-aspartate andN-acetyl-aspartate glutamate ([tNA]), choline-containing com-pounds ([Cho]), creatine-plus-phosphocreatine ([tCr]) andmyo-Inositol ([mIns]), which were scaled using the water signalfrom a non-water-suppressed spectrum. All spectra were checkedfor quality. The right hippocampal spectrum was not acquired inone patient, and the cingulate spectrum was not acquired in onecontrol due to time constraints. Four patients and two controlshad poor hippocampal spectra and two patients had poor thalamicspectra, with signal to noise ratios (SNR) less than 10. These wereexcluded from the analyses. Reanalysing data with all participantsincluded did not affect the pattern of results. Example spectra foreach VOI in a control participant can be seen in figure 1.
The GM, WM and cerebrospinal fluid (CSF) masks obtainedby segmentation of the T1 scans were used to calculate the frac-tional tissue content of each VOI. With these, it was possible toestimate the water concentration within each VOI and estimatethe amplitude of the water signal in each VOI. We also usedliterature-based values of T1 and T2 relaxation times of GM,WM and CSF for each VOI, and the sequence parameters (TEand TR), to correct the LCModel output for VOI water content(see online supplementary information for further details).Estimated metabolite concentrations thus corrected are reportedin ‘institutional units’ (iu).
Conventional imagingParticipants underwent axial T2-weighted imaging (turbo spin–echo (TSE) with spatial resolution of 0.9×0.9×3 mm3,TR=5760 ms, TE=101 ms), which was used to markT2-hyperintense lesions, and 3D T1-weighted imaging(magnetisation-prepared rapid gradient echo with spatial reso-lution of 0.9×0.9×0.9 mm3, inversion time (TI)=900 ms,TR=1900 ms, TE=2.81 ms). Hypointense lesions on theT1-weighted volume were marked and filled using the averageWM intensity20 before segmentation using the ‘new_segment’function in SPM8 (http://www.fil.ion.ucl.ac.uk/spm/software/spm8), which reduces the impact of lesion-associated segmenta-tion bias on GM and WM segmentations.20 Intracranialvolumes were defined in each subject by first using a maximumlikelihood algorithm to binarise the GM, WM and CSF tissuevolumes and then summing each of these volumes.
Double inversion recovery lesionsAll subjects also underwent 3D double inversion recovery (DIR)imaging (using an optimised long echo train TSE readout withspatial resolution of 1.3×1.2×1.2 mm3, TR=10 000 ms,TE=274 ms, TI=3000/510 ms). DIR lesions were marked foreach patient, following recent consensus recommendations.21 Inorder to count the number of DIR lesions within each spectro-scopic voxel, T1-weighted scans were rigidly registered to DIRscans; the resulting transformation parameters were thenapplied to the MRS voxels to transform them into DIR space.
Statistical analysesDifferences in cognitive performance and metaboliteconcentrations between groupsDifferences between all patients (and cognitively impaired (CI)and cognitively preserved (CP) patients, see online supplementary
Muhlert N, et al. J Neurol Neurosurg Psychiatry 2014;85:834–840. doi:10.1136/jnnp-2013-306662 835
Multiple sclerosis
on 26 June 2018 by guest. Protected by copyright.
http://jnnp.bmj.com
/J N
eurol Neurosurg P
sychiatry: first published as 10.1136/jnnp-2013-306662 on 15 January 2014. Dow
nloaded from

information) and controls in demographics, neuropsychologicaltest performance, MTR values in the spectroscopic regions and inthe GM or WM volume fractions in the VOIs were comparedusing independent-sample t tests. Group differences in [Glu] (andother metabolites) were initially tested using a repeated measuresmultivariate analysis of variance (MANOVA) with factors of group
(patient vs control) and spectroscopic VOI (hippocampus, thal-amus, cingulate and parietal cortices), therefore applying family-wise correction for multiple comparisons. The repeated measuresMANOVA was used to examine group differences in metabolitesand interactions between groups and regions. When theMANOVA showed significant group differences across all four
Figure 1 Placement of MR spectroscopy (MRS) voxels (left) with their example MRS spectra (right) in the right hippocampus (A), parietal cortices(B), right thalamus (C) and cingulate (D).
836 Muhlert N, et al. J Neurol Neurosurg Psychiatry 2014;85:834–840. doi:10.1136/jnnp-2013-306662
Multiple sclerosis
on 26 June 2018 by guest. Protected by copyright.
http://jnnp.bmj.com
/J N
eurol Neurosurg P
sychiatry: first published as 10.1136/jnnp-2013-306662 on 15 January 2014. Dow
nloaded from
VOIs, group differences were then tested in each VOI using inde-pendent samples t tests. A significance threshold of p<0.05 wasused throughout.
Association between cognitive performance and regionalglutamate levels in patients and controlsAssociations between [Glu] and cognitive performance in allpatients were investigated using three linear regression models,each with different independent variables. In the first, the [Glu]of each region was entered into the model as predictor, andvisuospatial memory as the outcome variable. The same analyseswere repeated in controls.
When a significant association (or a trend towards signifi-cance) between [Glu] and cognitive test performance was found,a second linear regression model was run, entering the [Glu] ofa specific VOI, the DIR GM lesions within the spectroscopicVOI and the MTR value of the VOI, as predictors, and the cog-nitive test performance as the dependent variable. This aimed atidentifying whether [Glu] was associated with memory perform-ance independently from MTR and GM lesions. The partialcorrelation coefficients (PCCs), which give a measure of therelative strengths of the independent associations between pre-dictors and dependent variable, were reported when more thanone predictor was found to be significant. Finally, the regressionanalyses in which [Glu] significantly predicted memory perform-ance were repeated, including whole-brain GM volume fractionas predictor, to assess whether GM volume mediated the effect.All statistical analyses were carried out using the statisticalpackage for social scientists (SPSS) V.20.0. An α level of p<0.05was used throughout, and significance values less than 0.10were considered trends.
To complete this study, the link between [Glu] and [tNA] andbetween [tNA] and memory was assessed in patients; methodsand results for this section are described in the online supple-mentary information.
RESULTSDemographics, clinical and cognitive resultsThe demographic and clinical characteristics of all subjectgroups are shown in table 1. Taken together, all patients showedworse visuospatial memory than controls on the PAL test, withfewer trials completed at the first attempt (t=2.4, p<0.05) andfewer trials completed overall (t=3.0, p<0.01) (table 1).Patients also had worse verbal memory than controls, withworse learning of the list (t=3.3, p<0.01), fewer words recalledafter distraction (t=3.2, p<0.01) and fewer words recalled aftera 30 min delay (t=2.2, p<0.05). Patients had slower processingspeed than controls on the SDMT (t=4.7, p<0.001) and wereworse on the Stroop task, suggesting impaired executive func-tion (t=−4.0, p<0.01) (table 1). In contrast, patients and con-trols did not differ on working memory (t=1.7, p=0.10) (table1). Additionally, patients did not differ from controls in theirage, their premorbid IQ or their current IQ; the two groupsshowed no significant differences in levels of anxiety or depres-sion (table 1).
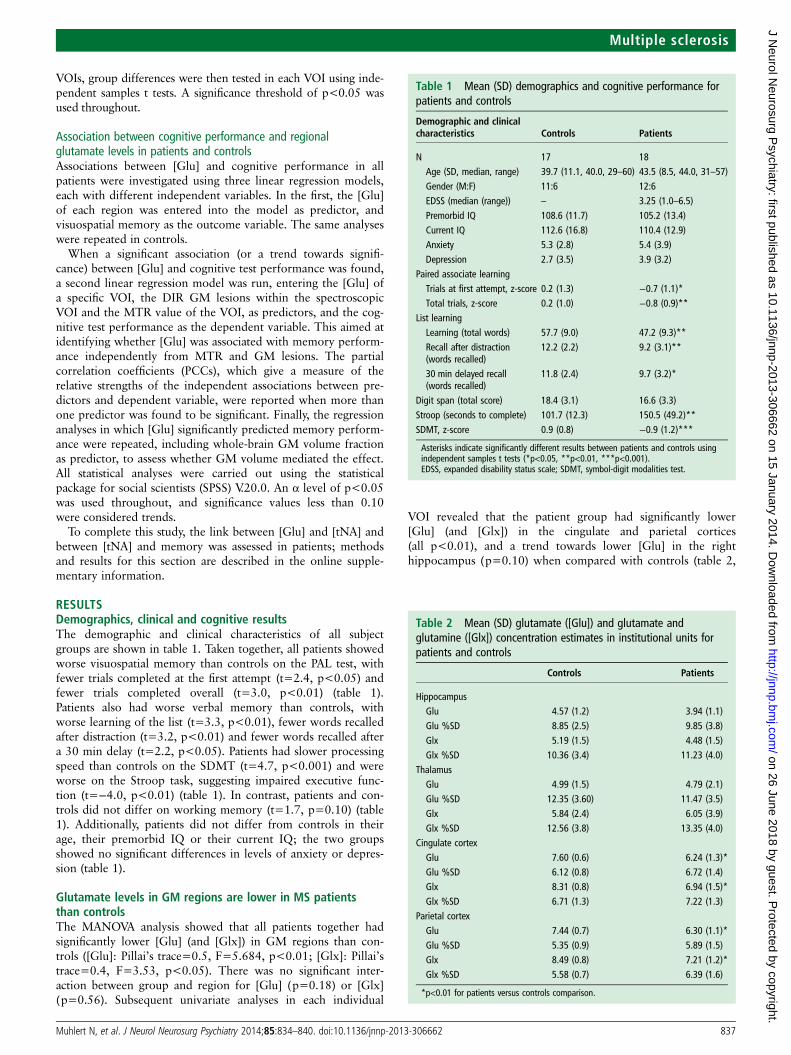
Glutamate levels in GM regions are lower in MS patientsthan controlsThe MANOVA analysis showed that all patients together hadsignificantly lower [Glu] (and [Glx]) in GM regions than con-trols ([Glu]: Pillai’s trace=0.5, F=5.684, p<0.01; [Glx]: Pillai’strace=0.4, F=3.53, p<0.05). There was no significant inter-action between group and region for [Glu] (p=0.18) or [Glx](p=0.56). Subsequent univariate analyses in each individual
VOI revealed that the patient group had significantly lower[Glu] (and [Glx]) in the cingulate and parietal cortices(all p<0.01), and a trend towards lower [Glu] in the righthippocampus (p=0.10) when compared with controls (table 2,
Table 1 Mean (SD) demographics and cognitive performance forpatients and controls
Demographic and clinicalcharacteristics Controls Patients
N 17 18Age (SD, median, range) 39.7 (11.1, 40.0, 29–60) 43.5 (8.5, 44.0, 31–57)Gender (M:F) 11:6 12:6EDSS (median (range)) – 3.25 (1.0–6.5)Premorbid IQ 108.6 (11.7) 105.2 (13.4)Current IQ 112.6 (16.8) 110.4 (12.9)Anxiety 5.3 (2.8) 5.4 (3.9)Depression 2.7 (3.5) 3.9 (3.2)
Paired associate learningTrials at first attempt, z-score 0.2 (1.3) −0.7 (1.1)*Total trials, z-score 0.2 (1.0) −0.8 (0.9)**
List learningLearning (total words) 57.7 (9.0) 47.2 (9.3)**Recall after distraction(words recalled)
12.2 (2.2) 9.2 (3.1)**
30 min delayed recall(words recalled)
11.8 (2.4) 9.7 (3.2)*
Digit span (total score) 18.4 (3.1) 16.6 (3.3)
Stroop (seconds to complete) 101.7 (12.3) 150.5 (49.2)**SDMT, z-score 0.9 (0.8) −0.9 (1.2)***
Asterisks indicate significantly different results between patients and controls usingindependent samples t tests (*p<0.05, **p<0.01, ***p<0.001).EDSS, expanded disability status scale; SDMT, symbol-digit modalities test.
Table 2 Mean (SD) glutamate ([Glu]) and glutamate andglutamine ([Glx]) concentration estimates in institutional units forpatients and controls
Controls Patients
HippocampusGlu 4.57 (1.2) 3.94 (1.1)Glu %SD 8.85 (2.5) 9.85 (3.8)Glx 5.19 (1.5) 4.48 (1.5)Glx %SD 10.36 (3.4) 11.23 (4.0)
ThalamusGlu 4.99 (1.5) 4.79 (2.1)Glu %SD 12.35 (3.60) 11.47 (3.5)Glx 5.84 (2.4) 6.05 (3.9)Glx %SD 12.56 (3.8) 13.35 (4.0)
Cingulate cortexGlu 7.60 (0.6) 6.24 (1.3)*Glu %SD 6.12 (0.8) 6.72 (1.4)Glx 8.31 (0.8) 6.94 (1.5)*Glx %SD 6.71 (1.3) 7.22 (1.3)
Parietal cortexGlu 7.44 (0.7) 6.30 (1.1)*Glu %SD 5.35 (0.9) 5.89 (1.5)Glx 8.49 (0.8) 7.21 (1.2)*Glx %SD 5.58 (0.7) 6.39 (1.6)
*p<0.01 for patients versus controls comparison.
Muhlert N, et al. J Neurol Neurosurg Psychiatry 2014;85:834–840. doi:10.1136/jnnp-2013-306662 837
Multiple sclerosis
on 26 June 2018 by guest. Protected by copyright.
http://jnnp.bmj.com
/J N
eurol Neurosurg P
sychiatry: first published as 10.1136/jnnp-2013-306662 on 15 January 2014. Dow
nloaded from
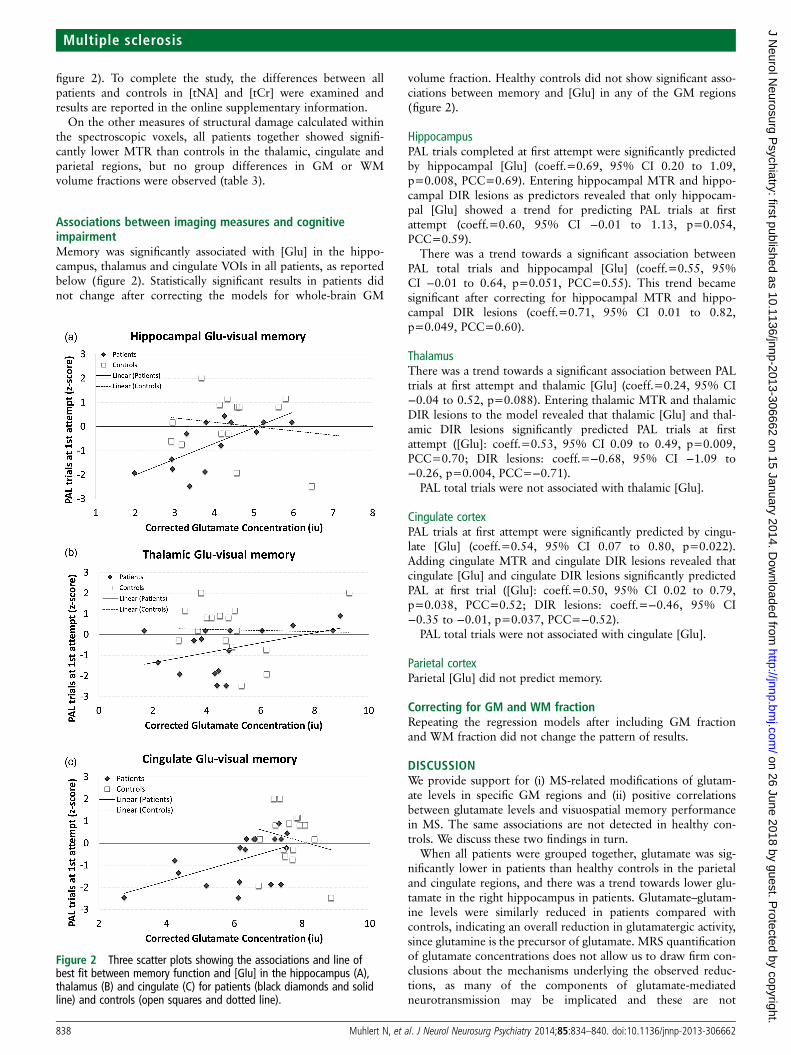
figure 2). To complete the study, the differences between allpatients and controls in [tNA] and [tCr] were examined andresults are reported in the online supplementary information.
On the other measures of structural damage calculated withinthe spectroscopic voxels, all patients together showed signifi-cantly lower MTR than controls in the thalamic, cingulate andparietal regions, but no group differences in GM or WMvolume fractions were observed (table 3).
Associations between imaging measures and cognitiveimpairmentMemory was significantly associated with [Glu] in the hippo-campus, thalamus and cingulate VOIs in all patients, as reportedbelow (figure 2). Statistically significant results in patients didnot change after correcting the models for whole-brain GM
volume fraction. Healthy controls did not show significant asso-ciations between memory and [Glu] in any of the GM regions(figure 2).
HippocampusPAL trials completed at first attempt were significantly predictedby hippocampal [Glu] (coeff.=0.69, 95% CI 0.20 to 1.09,p=0.008, PCC=0.69). Entering hippocampal MTR and hippo-campal DIR lesions as predictors revealed that only hippocam-pal [Glu] showed a trend for predicting PAL trials at firstattempt (coeff.=0.60, 95% CI −0.01 to 1.13, p=0.054,PCC=0.59).
There was a trend towards a significant association betweenPAL total trials and hippocampal [Glu] (coeff.=0.55, 95%CI −0.01 to 0.64, p=0.051, PCC=0.55). This trend becamesignificant after correcting for hippocampal MTR and hippo-campal DIR lesions (coeff.=0.71, 95% CI 0.01 to 0.82,p=0.049, PCC=0.60).
ThalamusThere was a trend towards a significant association between PALtrials at first attempt and thalamic [Glu] (coeff.=0.24, 95% CI−0.04 to 0.52, p=0.088). Entering thalamic MTR and thalamicDIR lesions to the model revealed that thalamic [Glu] and thal-amic DIR lesions significantly predicted PAL trials at firstattempt ([Glu]: coeff.=0.53, 95% CI 0.09 to 0.49, p=0.009,PCC=0.70; DIR lesions: coeff.=−0.68, 95% CI −1.09 to−0.26, p=0.004, PCC=−0.71).
PAL total trials were not associated with thalamic [Glu].
Cingulate cortexPAL trials at first attempt were significantly predicted by cingu-late [Glu] (coeff.=0.54, 95% CI 0.07 to 0.80, p=0.022).Adding cingulate MTR and cingulate DIR lesions revealed thatcingulate [Glu] and cingulate DIR lesions significantly predictedPAL at first trial ([Glu]: coeff.=0.50, 95% CI 0.02 to 0.79,p=0.038, PCC=0.52; DIR lesions: coeff.=−0.46, 95% CI−0.35 to −0.01, p=0.037, PCC=−0.52).
PAL total trials were not associated with cingulate [Glu].
Parietal cortexParietal [Glu] did not predict memory.
Correcting for GM and WM fractionRepeating the regression models after including GM fractionand WM fraction did not change the pattern of results.
DISCUSSIONWe provide support for (i) MS-related modifications of glutam-ate levels in specific GM regions and (ii) positive correlationsbetween glutamate levels and visuospatial memory performancein MS. The same associations are not detected in healthy con-trols. We discuss these two findings in turn.
When all patients were grouped together, glutamate was sig-nificantly lower in patients than healthy controls in the parietaland cingulate regions, and there was a trend towards lower glu-tamate in the right hippocampus in patients. Glutamate–glutam-ine levels were similarly reduced in patients compared withcontrols, indicating an overall reduction in glutamatergic activity,since glutamine is the precursor of glutamate. MRS quantificationof glutamate concentrations does not allow us to draw firm con-clusions about the mechanisms underlying the observed reduc-tions, as many of the components of glutamate-mediatedneurotransmission may be implicated and these are not
Figure 2 Three scatter plots showing the associations and line ofbest fit between memory function and [Glu] in the hippocampus (A),thalamus (B) and cingulate (C) for patients (black diamonds and solidline) and controls (open squares and dotted line).
838 Muhlert N, et al. J Neurol Neurosurg Psychiatry 2014;85:834–840. doi:10.1136/jnnp-2013-306662
Multiple sclerosis
on 26 June 2018 by guest. Protected by copyright.
http://jnnp.bmj.com
/J N
eurol Neurosurg P
sychiatry: first published as 10.1136/jnnp-2013-306662 on 15 January 2014. Dow
nloaded from

detectable in vivo. Glutamate is much more abundant inside cellsthan in the extracellular space, and its highest concentrations arefound in the synaptic vesicles. Therefore, a possible interpret-ation is that reduced synapses and neuronal–axonal degeneration,which have been described in histological analyses of MSbrains,22 may be relevant for determining lower glutamate levels.Along the same lines, reduced glutamate, possibly associated withshrinkage/neuronal loss, has been described during the ageingprocess23 and in schizophrenia.8 Finally, the observed (and posi-tive) correlations between glutamate and tNA in the hippocam-pal, cingulate and parietal regions suggest that reduced neuronalintegrity and/or metabolism, reflected by reduced tNA,24 mayunderlie the same pathological processes reflected by reducedglutamate levels.
Considering the thalamic and hippocampal regions, no groupdifferences in glutamate and glutamate–glutamine were found inthe thalamic voxel, and a trend towards statistical significancewas detected in the hippocampus. This may reflect the uniquetissue microstructure of the thalamus when compared with cor-tical regions (the thalamus is a striated GM and WM structure)and be related to the greater technical challenge of segmentingthe thalamic region with SPM8,25 and of acquiring spectra inthe thalamus and, to a lesser extent, the hippocampus.26 Yet,whereas previous studies carried out at lower field strengths(1.5 T) have generally considered glutamate and glutaminetogether, we were able to identify the glutamate resonance withan acceptable level of confidence. We also improved the accur-acy of our metabolite concentrations by adjusting them forwater content of GM, WM and CSF and for regional T1 andT2 values.
When looking at the associations between glutamate concen-trations and cognitive tests, we found that, in patients, visuo-spatial memory was significantly associated with hippocampalglutamate independently of MTR and DIR GM lesions withinthe same region. Additionally, in patients, visuospatial memorywas more strongly predicted by cingulate glutamate than by DIRlesions within the cingulate. Worse visuospatial memory inpatients was also predicted by lower glutamate in the thalamicregion, although thalamic DIR lesions were equally (and
independently) predictive. All these associations remained sig-nificant after adjusting for whole-brain GM volume fraction.Since MTR is sensitive to cortical demyelination,27 while DIRlesions reflect focal areas of demyelination,28 these findingssuggest that the association between memory and glutamatelevels may not depend on cortical demyelination or overall GMatrophy. Overall, these findings suggest that (i) glutamate levelsin these GM regions reflect processes that are linked withmemory function in MS; these processes are unlikely to occurin the general population given that these correlations were notfound in healthy controls. (ii) DIR GM lesions in the thalamicregion may also affect memory function, which confirms previ-ously published reports on the association between thalamiclesions and atrophy and memory function in MS.11
In schizophrenia, reduced cortical glutamate in frontal regionsis known to be associated with impaired cognition,29 and cogni-tion is impaired in healthy humans given NMDA antagonists.30
Both CI and CP patients showed similar reductions in glutamatelevels in the parietal and cingulate GM regions when comparedwith controls (overall differences were between 15% and 22%,see online supplementary information), suggesting that glutam-ate levels reflect MS-related pathological processes, rather than adysfunction that specifically mediates cognitive impairment.Future work will aim to examine whether people with MS alsoshow changes in glutamate levels in other GM regions that areknown to contribute to cognitive function, such as the frontalregions and subcortical GM nuclei, and whether such changeshelp to explain cognitive impairment.
In contrast to glutamate, tNA did not significantly predictmemory. This study did not aim to assess the comparative pre-dictive values of glutamate and tNA, and given their strong cor-relation, it would have been underpowered to do so.
Our study has some unavoidable limitations. First, because ofthe cuboidal shape of the spectroscopic VOIs and the linearrelation between VOI volume and spectroscopic SNR, in orderto achieve reliable estimates of metabolite concentrations in rea-sonable acquisition times, it was necessary to have VOIs thatencompassed the GM of interest rather than being completelycontained within it. Therefore, inevitably these VOIs included
Table 3 T2 lesion load and total and regional DIR GM lesions of patients, and MTR values within the spectroscopic voxels of patients andcontrols
Controls Patients
T2 lesion load (mean (SD)) – 7.05 mL (7.60)DIR lesions (median (range))Total grey matter lesions – 22 lesions (range 6–275)Hippocampal lesions in the right hippocampal spectroscopic VOI – 0.5 lesions (range 0–3)Thalamic lesions in the right thalamic VOI – 0 lesions (range 0–2)Grey matter lesions in the cingulate cortex VOI – 0 lesions (range 0–12)Grey matter lesions in the post. parietal VOI – 1 lesion (range 0–6)
Total GM lesions in each structure on DIR (median[range])Right hippocampal lesions 0.5 lesions (range 0–3)Right thalamic lesions 0 lesions (range 0–2)GM fraction (mean (SD)) 0.45 (0.04) 0.42 (0.02)*
MTR (mean (SD))MTR in the right hippocampal VOI 33.1 (2.0) 31.1 (4.4)MTR in the right thalamic VOI 30.8 (1.5) 29.1 (2.8)*MTR in the cingulate cortex VOI 30.9 (1.1) 28.6 (2.7)*MTR in the posterior parietal VOI 37.9 (0.9) 35.3 (2.5)*
Note that the number of DIR lesions in the patients’ hippocampus and thalamus was similar to those seen in the spectroscopic hippocampal and thalamic voxels.*p<0.05.DIR, double inversion recovery; GM, grey matter; MTR, magnetisation transfer ratio; VOI, spectroscopic volume of interest; WM, white matter.
Muhlert N, et al. J Neurol Neurosurg Psychiatry 2014;85:834–840. doi:10.1136/jnnp-2013-306662 839
Multiple sclerosis
on 26 June 2018 by guest. Protected by copyright.
http://jnnp.bmj.com
/J N
eurol Neurosurg P
sychiatry: first published as 10.1136/jnnp-2013-306662 on 15 January 2014. Dow
nloaded from

some of the WM surrounding the regions of interest. However,patients and controls showed no differences in the GM andWM volume fractions, the regressions were generally unaffectedafter accounting for GM and WM fractions and fractions wereused to adjust the glutamate concentration for water content ofboth tissue types. Additionally, the relationship between glutam-ate levels and cognitive performance did not change after cor-recting for whole-brain GM volume fraction. Second, 16regressions were performed without formal correction for mul-tiple comparisons. This can be justified by the fact that this is ahypothesis-driven rather than an exploratory study, making theneed for multiple comparison corrections less relevant.31 In thiscase, controlling for type II errors is as important as controllingfor type I errors. Finally, while the study was powered to assessdifferences in glutamate between patients and controls, it wasnot powered to assess differences between CI and CP patients.These data however answer an interesting posthoc question thatcan be explored in future work.
CONCLUSIONUsing a MRS protocol optimised for glutamate detection, butwidely available at 3 T, this study provides the first evidence thatMS affects glutamate levels in GM and that worse visuospatialmemory is linked to lower glutamate in the hippocampal, thal-amic and cingulate regions in RRMS patients. As in otherneuropsychiatric diseases,29 the discovery of a link between glu-tamate abnormalities in the GM of MS patients and reducedmemory performance may lead to new treatment approachesthat specifically modulate this neurotransmitter.
Acknowledgements We thank the people who took part in this study.
Contributors NM, MA, JJGG and OC designed and carried out the study. NM,EDeV, RSS and DLT were involved in the analysis. DHM, AJT and CAMW-K criticallyrevised the manuscript for intellectual content.
Funding This work was supported by the Wellcome Trust, grant 074618/Z/04.The NMR Research Unit is supported by the Multiple Sclerosis Society in theUK, and Department of Health’s NIHR UCLH Comprehensive Biomedical ResearchCentre.
Competing interests NM, MA, EDeV and DLT have no disclosures. RSS receivesresearch support from the Multiple Sclerosis Society in the UK and received personalcompensation from Biogen Idec for giving a lecture. CAMW-K has been on theadvisory board for Biogen Idec. JJGG is on the scientific advisory board of the DutchMS Research Foundation, MS Academia, MerckSerono, and has served as aconsultant for MerckSerono, Biogen Idec and Teva Pharmaceuticals; he is a memberof the editorial board for MS International and BMC Neurology. DHM has receivedhonoraria, through payments to UCL Institute of Neurology, for Advisory Committeeand/or consultancy advice in multiple sclerosis studies from Biogen Idec,GlaxoSmithKline, Novartis, Merck, Chugai, Mitsubishi Pharma Europe and BayerSchering Pharma and has received compensation through payments to UCL Instituteof Neurology for performing central MRI analysis of multiple sclerosis trials fromGlaxoSmithKline, Biogen Idec, Novartis and Merck. AJT chairs the Eisai AdvisoryBoard (Clinical Neuroscience), is a member of the Imanova Advisory Board, is atrustee of the Brain Appeal, National Hospital for Neurology and Neurosurgery,Queen Square, receives a grant from the NIHR as a Senior Investigator, is aco-recipient of grants from the NIHR CBRC, Wolfson Foundation, MRC, WellcomeTrust, Multiple Sclerosis Society in the UK, SRH Holding, Eisai Inc; has receivedhonoraria and support for travel from Novartis, Serono Symposia InternationalFoundation, and Remedica for invited lectures; receives an honorarium asEditor-in-Chief for Multiple Sclerosis Journal, a free subscription as a member of theEditorial Board for Lancet Neurology, and publishing royalties from CambridgeUniversity Press. OC receives research grant support from the Multiple SclerosisSociety in the UK and from the Department of Health NIHR ComprehensiveBiomedical Centre; she has received honoraria and funding for travel from BayerSchering and TEVA; she receives honoraria for consultancy from GE.
Ethics approval University College London Hospitals NHS Ethics committee.
Provenance and peer review Not commissioned; externally peer reviewed.
Open Access This is an Open Access article distributed in accordance with theterms of the Creative Commons Attribution (CC BY 3.0) license, which permits
others to distribute, remix, adapt and build upon this work, for commercial use,provided the original work is properly cited. See: http://creativecommons.org/licenses/by/3.0/
REFERENCES1 Langdon DW. Cognition in multiple sclerosis. Curr Opin Neurol 2011;24:244–9.2 Calabrese M, Rinaldi F, Mattisi I, et al. Widespread cortical thinning characterizes
patients with MS with mild cognitive impairment. Neurology 2010;74:321–8.3 Sicotte NL, Kern KC, Giesser BS, et al. Regional hippocampal atrophy in multiple
sclerosis. Brain 2008;131:1134–41.4 Geurts JJ, Calabrese M, Fisher E, et al. Measurement and clinical effect of grey
matter pathology in multiple sclerosis. Lancet Neurol 2012;11:1082–92.5 Papadopoulos D, Dukes S, Patel R, et al. Substantial archaeocortical atrophy and
neuronal loss in multiple sclerosis. Brain Pathol 2009;19:238–53.6 Dutta R, Chang A, Doud MK, et al. Demyelination causes synaptic alterations in
hippocampi from multiple sclerosis patients. Ann Neurol 2011;69:445–54.7 Vercellino M, Merola A, Piacentino C, et al. Altered glutamate reuptake in
relapsing-remitting and secondary progressive multiple sclerosis cortex: correlationwith microglia infiltration, demyelination, and neuronal and synaptic damage.J Neuropathol Exp Neurol 2007;66:732–9.
8 Marsman A, van den Heuvel MP, Klomp DW, et al. Glutamate in schizophrenia:a focused review and meta-analysis of 1H-MRS studies. Schizophr Bull2013;39:120–9.
9 Srinivasan R, Sailasuta N, Hurd R, et al. Evidence of elevated glutamate in multiplesclerosis using magnetic resonance spectroscopy at 3T. Brain 2005;128:1016–25.
10 Burgess N, Maguire EA, O’Keefe J. The human hippocampus and spatial andepisodic memory. Neuron 2000;35:625–41.
11 Houtchens MK, Benedict RH, Killiany R, et al. Thalamic atrophy and cognition inmultiple sclerosis. Neurology 2007;69:1213–23.
12 Staffen W, Zauner H, Mair A, et al. Magnetic resonance spectroscopy of memoryand frontal brain region in early multiple sclerosis. J Neuropsychiatry Clin Neurosci2005;17:357–63.
13 Polman CH, Reingold SC, Edan G, et al. Diagnostic criteria for multiple sclerosis:2005 revisions to the “McDonald Criteria”. Ann Neurol 2005;58:840–6.
14 Wechsler D. The Wechsler Adult Intelligence Scale III. San Antonio, TX: HarcourtAssessment, 1997.
15 Lezak MD, Howieson DB, Loring DW. Neuropsychological Assessment. 4th edn.New York, NY: Oxford University Press, 2004.
16 Trenerry MR. Stroop neuropsychological assessment manual. Odessa, FL:Psychological Assessment Resources, 1989.
17 Zigmond AS, Snaith RP. The hospital anxiety and depression scale. Acta PsychiatrScand 1983;67:361–70.
18 Helms G, Dathe H, Kallenberg K, et al. High-resolution maps of magnetizationtransfer with inherent correction for RF inhomogeneity and T1 relaxation obtainedfrom 3D FLASH MRI. Magn Reson Med 2008;60:1396–1407.
19 Provencher SW. Estimation of metabolite concentrations from localized in vivoproton NMR spectra. Magn Reson Med 1993;30:672–9.
20 Chard DT, Jackson JS, Miller DH, et al. Reducing the impact of white matter lesionson automated measures of brain gray and white matter volumes. J Magn ResonImaging 2010;32:223–8.
21 Geurts JJ, Roosendaal SD, Calabrese M, et al. Consensus recommendations for MScortical lesion scoring using double inversion recovery MRI. Neurology2011;76:418–24.
22 Wegner C, Esiri MM, Chance SA, et al. Neocortical neuronal, synaptic, and glialloss in multiple sclerosis. Neurology 2006;67:960–7.
23 Kaiser LG, Schuff N, Cashdollar N, et al. Age-related glutamate and glutamineconcentration changes in normal human brain: 1H MR spectroscopy study at 4T.Neurobiol Aging 2005;26:665–72.
24 Moffett JR, Ross B, Arun P, et al. N-Acetylaspartate in the CNS: fromneurodiagnostics to neurobiology. Prog Neurobiol 2007;81:89–131.
25 Ashburner J, Friston KJ. Unified segmentation. NeuroImage 2005;26:839–51.26 McLean M, Woermann FG, Simister RJ, et al. In vivo short echo time 1H-Magnetic
resonance spectroscopic imaging (MRSI) of the temporal lobes. NeuroImage2001;14:501–9.
27 Chen JT, Easley K, Schneider C, et al. Clinically feasible MTR is sensitive to corticaldemyelination in MS. Neurology 2013;80:246–52.
28 Seewann A, Kooi EJ, Roosendaal SD, et al. Postmortem verification of MS corticallesion detection with 3D DIR. Neurology 2012;78:302–8.
29 Moghaddam B, Javitt D. Schizophrenia from revolution to evolution: the glutamatehypothesis of schizophrenia and its implication for treatment.Neuropsychopharmacology 2012;37:4–15.
30 Ghoneim MM, Hinrichs JV, Mewaldt SP, et al. Ketamine: behavioral effects ofsubanesthetic doses. J Clin Psychopharmacol 1985;5:70–7.
31 Rothman KJ. No adjustments are needed for multiple comparisons. Epidemiology1990;1:43–6.
840 Muhlert N, et al. J Neurol Neurosurg Psychiatry 2014;85:834–840. doi:10.1136/jnnp-2013-306662
Multiple sclerosis
on 26 June 2018 by guest. Protected by copyright.
http://jnnp.bmj.com
/J N
eurol Neurosurg P
sychiatry: first published as 10.1136/jnnp-2013-306662 on 15 January 2014. Dow
nloaded from