research openaccess … · ment our own java application to be independent and to eliminate the...
TRANSCRIPT

EURASIP Journal onEmbedded Systems
Kenner et al. EURASIP Journal on Embedded Systems (2017) 2017:12 DOI 10.1186/s13639-016-0045-7
RESEARCH Open Access
Comparison of smart grid architecturesfor monitoring and analyzing power grid datavia Modbus and RESTSusanne Kenner*, Raphael Thaler, Markus Kucera, Klaus Volbert and Thomas Waas
Abstract
Smart grid, smart metering, electromobility, and the regulation of the power network are keywords of the transitionin energy politics. In the future, the power grid will be smart. Based on different works, this article presents a datacollection, analyzing, and monitoring software for a reference smart grid. We discuss two possible architectures forcollecting data from energy analyzers and analyze their performance with respect to real-time monitoring, load peakanalysis, and automated regulation of the power grid. In the first architecture, we analyze the latency, neededbandwidth, and scalability for collecting data over the Modbus TCP/IP protocol and in the second one over a RESTfulweb service. The analysis results show that the solution with Modbus is more scalable as the one with RESTful webservice. However, the performance and scalability of both architectures are sufficient for our reference smart grid anduse cases.
Keywords: Smart grid, Real-time monitoring, Modbus, HTTP performance
1 IntroductionResearches at the smart grid topic are widespread and inprogress worldwide. In [1], the authors published a surveyon smart grid concepts and architectures in India, China,USA, and Europe and explained the different startingpoints and reasons of their studies.In Germany, the transition from conventional power
producers to renewable energy sources like wind and solaris one of the key points for researching. The increas-ing amount of distributed volatile energy production ofrenewable energy sources has a negative impact on thestability of the grid and in addition the demand and costof energy will increase in the future. With the integra-tion of communication technologies, sensor nodes, andsmart regulation algorithms into the existing power grid,it is possible to counteract these effects. The sensor nodes(energy analyzers) are able to measure energy data likepower and voltage from the grid and provide this datafor monitoring and analyzing. Based on these data and
*Correspondence: [email protected] of Computer Science and Mathematics, Technical University ofApplied Sciences, Regensburg, Germany
analysis, further concepts can be developed for reducingenergy demand and costs [1–7].Electrical power supply is demand-oriented to date and
not flexible enough for the challenges described above.In the future, it will be necessary to change the energydemand according to power generation of renewableenergy sources, which means that the regulation will bemoved from electricity suppliers to the consumer’s side.Through suitable concepts of demand regulation and dis-tribution, the power grid will be stabilized and optimized[8]. Possible concepts are demand side management anddemand response, which are described in [9–11]. Demandside management techniques like load shifting and peakclipping are the most known approaches. At load shift-ing, the load is shifted from a peak period to an off-peakperiod without changing the total energy consumption ofboth periods, whereas at peak clipping, the load is reducedby reducing the power consumption [12]. To use thesetechniques, it is necessary to identify load peaks throughanalyzing power data from the grid. Based on analysis, analgorithm for shifting load peaks could be developed [13].In this paper, we present two different architectures
for gathering data from energy analyzers distributed atpower grid of the Technical University of Applied Sciences
© 2016 Kenner et al. Open Access This article is distributed under the terms of the Creative Commons Attribution 4.0International License (http://creativecommons.org/licenses/by/4.0/), which permits unrestricted use, distribution, andreproduction in any medium, provided you give appropriate credit to the original author(s) and the source, provide a link to theCreative Commons license, and indicate if changes were made.
Kenner et al. EURASIP Journal on Embedded Systems (2017) 2017:12 Page 2 of 13
Regensburg (OTH) as well as a software application fordata monitoring, visualizing, and analyzing. We comparethe performance of data collection of both architectureswith respect to real-timemonitoring, load peak identifica-tion, and automated regulation. This article is an extendedversion of a conference paper published at 12th Interna-tional Workshop on Intelligent Solutions in EmbeddedSystems (WISES), 2015 [14]. For a better understanding ofthe analysis, we explain the hardware, developed software,and test environment in more detail.The paper is organized as follows: Section 2 describes
the backgrounds of our work and name some similarworks in this area. Section 3 presents our software appli-cation with two different system architectures. Section 4discusses performance tests of collecting data over thenetwork and compares the different architectures. Finally,Section 5 concludes this paper.
2 Motivation and related workIn the past few years, our research focus at OTH hasbeen on communication networks and security in smartgrids. In [15], mobile communication tests to acquiredata from a medium voltage grid were carried out. Theauthors present a mobile communication architectureand tests of latency, transfer rate, reliability, and secu-rity for a smart grid application. Furthermore, practicaltests of different mobile communication standards andproviders on mobile routers were carried out, which areused in the same project cited above [16]. Other scientificgroups at OTH are focused on electromobility, energy,and power management. So many energy measurementdevices were integrated in the local power network foranalyzing the grid data and to get a better comprehen-sion over the power grid. Our software application “smartenergy campus” collects, monitors, and displays measure-ments to get an overview on the grid. The application iswritten in Java, collects data from measurement devicesevery second, and saves them at a NO-SQL databaseApache Cassandra. By using a web page, the user canview and analyze data like power, effective power, voltage,active energy, and further measurements as described indetail in Section 3.3. The project “smart energy campus”aims to analyze the grid in order to get a better compre-hension about the technologies, monitoring and visual-izing the grid. In the next step, we are going to analyzethe data in order to identify potentials for an automatedenergy and power management with focus on load shift-ing and peak clipping. To realize this target, the softwareapplication needs functionalities like fast performanceand low latency. Therefore, we test the performance of twodifferent system architectures for data collecting and seewhether these are usable for such a scenario.Different architectures for smart grid applications
are possible. Depending on the requirements of the
applications, services, and environments, the suitablearchitecture must be chosen. Performance tests are onepossible decision support for choosing an architecture.For example, in [17], the authors analyze the performanceof different data processing architectures in smart grids.We analyze the performance and latency of the ModbusTCP/IP protocol and requests over a RESTful web ser-vice in our system. There are several systems in literature,in which web services in smart grid systems are used, forexample, in [4–6, 18].The Modbus and HTTP protocols are popular and used
in industry and Internet for a long time. So some perfor-mance tests have been carried out. In [19], the authorspresent performance tests of the Modbus TCP/IP pro-tocol with regard to the increasing number of real-timescenarios. Another real-time scenario is shown in [20]. In[21], the authors evaluate the performance of the Mod-bus TCP/IP protocol with focus on the response time.There are also some research papers where the authorsanalyze the performance of web services. For example,in [22], the authors compare the performance of RESTfulweb services and the Advanced Message Queuing Proto-col. In [23], the authors evaluate the performance of RESTand SOAP web services for mobile devices. Analysis ofembedded web services for machine-to-machine commu-nication is presented in [24]. In the last named paper, theauthor refers to the limits of web services in scenarioswith a large number of data. For energy monitoring andan automated energy and power management, we have tohandle a large number of data. In one architecture, we usethe software GridVis from Janitza. This software is usedby the Maintenance Service (MS) of our university. Wetest the performance of the RESTful web service of theGridVis Software below, especially to find out how muchdata the web service in one request provides and if it ispossible to request a large number of data every secondfor our real-time scenarios. In contrast to the papers citedabove, we carry out practical performance tests on a realpower grid.Additionally, we implement a software application,
which visualizes the collected data and make them avail-able for analyzing. There are some projects in the topicof monitoring and visualization cited below. In [25], theauthors present an analysis of a Geographical Informa-tion System to display real-time data on maps. A furtherproject is described in [26]. There, the authors presentan energy monitoring system with 3D views and energyconsumption data of a city. Another project presentsthe energy management system framework WattDepot,which is an open source framework and also visualizesenergy consumption data on a map, for example, in [27].In our work, we not only want to display data but alsowant to simplify the process of analysis with respect toidentifying periodically load peaks to regulate the power

Kenner et al. EURASIP Journal on Embedded Systems (2017) 2017:12 Page 3 of 13
consumption. We want to automate the process of analy-sis of load peaks and so we implement an own software forthese purposes.
3 Energy campusAbout 35 energy analyzers are installed in the local smartgrid. Inter alia, we can analyze data from six main low-voltage transformers, big electrical consumers like thecanteen, laboratories, and the computer center. Data fromsmall photovoltaic plants are also available. Applicationswritten in java collect data and view them on a web page.The next section describes two different system architec-tures, which were designed and adjusted during projectprogression.
3.1 Architecture AThis architecture was designed at the beginning of theproject and is shown in Fig. 1. It shows three mainareas representing three stakeholder groups, which needthe data from energy analyzers for research, daily oper-ations, or cost control. The stakeholder groups are theDepartment of Electrical Engineering and InformationTechnology (EI), Department of Computer Science andMathematics (IM), and the Maintenance Service (MS).Hardware: Each group works on a virtual server
machine with Windows Server 2008 R2 Enterprise oper-ating system with Service Pack 1. The virtual Server of IMhas 2 Intel(R) Xeon(R) E5645 processors with 2.40 GHzand 4-GB main memory. It is connected to the networkover a 1 GBit/s Ethernet interface. The virtual server of EIhas 2 Intel(R) Xeon(R) X5650 processors with 2.67 GHzand also 4-GB main memory. The connection to the
network is accomplished with a 10 GBit/s Ethernet inter-face. All servers are connected to the network of the OTHwith a large amount of users at university campus.On a previous project, energy analyzers from Siemens
(Siemens PAC4200) [28] and Janitza (UMG96RM) [29]companies were integrated in the local power grid andconnected with the IT network via 10/100 MBit/s Ether-net. The energy analyzers are able to measure about 300different values from the power grid. Both device types areequipped with a display unit to receive a quick overviewof the current situation of the relevant power grid sectionand in addition, the devices provide Modbus RTU andModbus over TCP/IP as communication protocols, whichcan be used to request data from the devices and for con-figuration. The devices refresh the measurements every200 ms. This is the smallest interval for requesting data.In our scenario we collects data over the Modbus TCP/IPprotocol every second.Software: The companies Siemens and Janitza sell soft-
ware applications for their energy analyzers to collect dataand visualize them. These commercial products are usedfrom EI and MS. The application Siemens Powermanageris used for training lessons and for visualizing informa-tion about the local Smart Grid on monitors, which areinstalled around the campus. For this purpose, the Power-manager is useful but it needs a long training period due toits complexity. A little bit easier to handle is the softwareapplication GridVis from Janitza, which is used by theMS. Both applications collect data over the Modbus overTCP/IP interface from energy analyzers and save them ina relational database. The Powermanager software pro-vides many kinds of visualization, but it is not possible
Fig. 1 Architecture A

Kenner et al. EURASIP Journal on Embedded Systems (2017) 2017:12 Page 4 of 13
to connect devices from other companies to this softwareand to extract out collected data. The MS uses Grid-Vis to get an overview of the grid and to control energycosts. It can integrate devices from other companies, butthey not fully supported through the application, so somefunctions are not available. Additionally, the possibilitiesto visualize the data in charts are limited. Both applica-tions provide data collection every second, but they donot save them in a database. However, second-by-secondcollected measurements are very interesting for researchin the power grid. For example, the EI analyzes relation-ships of different measurements and the changes of thevalues from one second to the next. Therefore, we imple-ment our own java application to be independent and toeliminate the imperfections of the commercial softwareapplications. To simplify the visualization and analysisof the grid data and to create charts especially for loadpeak analysis are other aspects to implement our ownapplication.The software SmartGridFetch was implemented at a
previous student work and continually developed andadjusted on the circumstances of the current work. Itruns on the virtual machine of IM, collects data fromenergy analyzers over Modbus protocol, and saves themin the Apache Cassandra database. The software is writ-ten in Java and consists essentially of two main classes forrequesting and receiving data over the Modbus TCP/IPprotocol and for saving the values in a database. The soft-ware starts a thread pool with several threads for request-ing data from energy analyzers. Each thread requests18 measurements from one device every second. Afterreceiving the response, each thread saves the measure-ments with a timestamp at database. The settings anddevice parameter like IP address, device description,measurements to be requested, and further settings canbe set over an option class. The measurements wererequested over the Modbus Read Holding Register func-tion, so several continuous registers can be read out in onerequest. The initial SmartGridFetch application only pro-vides requests of continuous register blocks over ModbusTCP/IP and only Siemens PAC4200 devices. For the cur-rent work, we adjust the application, so that it is possibleto request measurements saved at discontinuous registerblocks and to support different device types, especially theJanitza devices we use. With these features, the software ismore flexible.Cassandra is a NoSQL (not only SQL) column-oriented
database and has a flexible database scheme [30], whichcould be suited for changes of the energy analyzer infras-tructure. Furthermore, the database scales horizontally incontrast to the most relational databases, which scale ver-tically. In a smart grid, the data volume is high and sothe performance and flexibility of the database are impor-tant properties for real-time monitoring and demand-side
management in a smart grid [31, 32]. The web applicationenergy campus communicates over web socket technol-ogy with clients and allows the user to view and analyzethe data of the local smart grid via browser.
3.2 Architecture BThe amount of projects accessing the energy analyzerover Modbus protocol increased. At the beginning ofthe project, two access operations were planned for eachdevice. However, now there are more accesses and theSiemens devices cannot handle more than two connec-tions at the same time. This resulted in access contentionsand data loss in all systems and therefore we modified thearchitecture as shown in Fig. 2. In this architecture, thedata from energy analyzers are collected from the Grid-Vis Software and consequently, there is only one accessoperation. The energy analyzers are in a separate IP net-work and only GridVis is able to establish a connectionto the devices. Outside the network, a test network exists,which is accessible from all systems for testing differ-ent energy analyzers and software applications. All otherstakeholders receive the grid data via the RESTful inter-face of GridVis. For this purpose, we implemented theadditional software application GridVisFetch.GridVisFetch sends data requests to the RESTful inter-
face of GridVis every second and every 15 min. Thedata are saved in the Apache Cassandra database asdescribed above. From this database the Powermanagerreceives the data through implemented virtual devices,which simulate the energy analyzers. TheMS has the totalcontrol of the most devices and data, but through thisarchitecture, all stakeholders receive measurements forresearch and the device access operations are minimized.In addition, all heat and water analyzers, which are inte-grated in the software GridVis, are also available for otherstakeholders.
3.3 Web applicationThe web application featured many views, charts, and adevice and user management. It is the interface betweenuser and power grid data for visualization and analy-sis. In the following, the web application is described indetail.
3.3.1 TechnologiesThe web page is written in HTML5 and JQuery. Theapplication visualizes the data with the JQuery librariesHighcharts and Highstock [33]. As middleware, we imple-mented a server application deployed on an ApacheTomcat 8 Server. This software communicates with thedatabase and calculates some measurements. Clientscommunicate over bidirectional web sockets with theserver. We use the web socket technology for real-time monitoring and sending push notifications from the

Kenner et al. EURASIP Journal on Embedded Systems (2017) 2017:12 Page 5 of 13
Fig. 2 Figure shows an architecture without concurrent device access operations
server to the clients. Through the bidirectional commu-nication, the server can react to warning events etc. andforward them to the clients [34, 35].
3.3.2 Data visualization and analysisThe web application consists of the following views:dashboard, analyze, map, and management. The dash-board shows real time data of active energy consumptionand power generation through the photovoltaic plant as
shown in Fig. 3. From left to right, the charts at the topshow the total amount of the current active energy con-sumption of the OTH, the daily total amount of activeenergy consumption, and the current produced energythrough the photovoltaic plants. The installed energy ana-lyzers are grouped in three main areas and the charts atthe bottom line show the total amount of current activeenergy consumption from these three areas. All valuesare refreshed every second, so it provides an up-to-date
Fig. 3 Dashboard of energy campus application. The dashboard shows current values of the power grid. The data were refreshed every second
Kenner et al. EURASIP Journal on Embedded Systems (2017) 2017:12 Page 6 of 13
overview. While the dashboard shows current data fromgrouped energy analyzers, the map view supports datavisualization from single devices and for any time period.It displays the topology of the local smart grid on aninteractive map. There, the user sees all energy analyz-ers marked at the map, so he is able to choose a deviceand request data from each device. The measured data areaggregated to 1-, 5-, and 15-min values, so it is possibleto choose the level of aggregation. The response data areviewed in an interactive line chart with zoom in and outfunctionality.At the analyze tab, users are able to create charts
to study data and to identify load peaks. Comparisonsof different measurements and devices are possible. Forexample, one chart shows the amount of available dataat database, in which the available data were put in rela-tion to the amount of expected data. Different types ofload peak charts are supported, which make it possible toidentify load peaks from single devices or compare loadpeaks of several devices in one chart. In addition, thereare charts simplifying the identification of regularities inthe timing of load peak events. Devices are installed atthe power grid, are viewed in a tree structure, which isconstructed as the network plan. Charts were generatedby selecting devices on the tree structure and choosing achart type. The charts a user generated during his sessionwere saved at database and loaded automatically at thenext login. So users can continue their work at a later timewithout requesting all data again.The last tab of the web application is a simple user and
device management. To protect the sensitive data againstunauthorized access and manipulation of device parame-ters, the users of the web page are limited and the accessis password protected. In addition, the web page is onlyaccessible within the network of OTH.
4 Architecture analysis and resultsAccording to the use cases of our application and futureworks in energy and power management, we analyzednetwork traffic of two scenarios based on the architec-tures described above. To realize real-time monitoring,load shifting, and future research projects, it is necessaryto fetch data from energy analyzers every second. In thissection, we present the results of network analysis of botharchitectures with focus on latency, amount of transferreddata, and needed bandwidth of second-by-second fetcheddata.
4.1 Scenario AScenario A is based on the initial system architectureshown in Fig. 1 and described above. We use the Mod-bus TCP/IP protocol, described in Section 4.1.2, torequest data directly from energy analyzers. Afterwards,we describe the test environment we used, the tests and
their results. Test results are compared with theoreticalanalysis.
4.1.1 Test environmentServer: As a server, the virtual machine of EI with Win-dows Server 2008 R2 Enterprise 64 Bit operating system isused. The virtual machine has two Intel(R) Xeon(R) X56502.67 GHz processors and is integrated in the IP networkvia a 10 GBit/s Ethernet interface.Energy analyzer: In the tests, we used 27 physi-
cal devices, which are integrated in the network over10/100 MBit/s Ethernet. Because of hardware problems,some energy analyzers were unavailable at time of testing.Software: The Java software application SmartGridFetch
collects data over Modbus TCP/IP from the energy ana-lyzers. For each device, the application starts a threadwhich requests 18 measurements at the same time everysecond. For each measurement, we request 2 registerswith 2 bytes over the Read Holding Register function andso each measurement has a size of 4 bytes.
4.1.2 Modbus over TCP/IP protocol analysisThe Modbus TCP/IP protocol is a request/reply proto-col and consists of an application data unit (ADU) anda protocol data unit (PDU). The data are stored in 2-byte registers. To request data from a device over ModbusTCP/IP, we use the Read Holding Register function andread contiguous blocks of registers. The maximum size ofa Modbus protocol data unit is 253 bytes. In the request,3 bytes are used by a function code (1 byte) and the start-ing register address (2 bytes). Two bytes are used for theamount of registers to read, so the maximum is 125 reg-isters. The response consists of 1 byte for the functioncode, 1 byte for count, and the remaining for the val-ues we read out [36]. The Modbus communication overTCP/IP is shown in Fig. 4. Between opening and closingthe communication, several request-response blocks arepossible. Each block consists of one Read Holding Regis-ter request, followed by an acknowledgement (ACK) andresponse data, and finished through a further ACK. Foranalyzing latency, amount of transferred data, and neededbandwidth of second-by-second fetched data, we focus onthe request-response blocks, which cause the most data.Figure 5 shows the request and response packets trans-ported over the network. We assume that no additionaloptions are set at the IP and TCP header, so we calcu-late with the minimal header size. One packet consists ofan Ethernet (14 bytes), IP (20 bytes), and TCP (20 bytes)header, which encapsulate the Modbus ADU (8 + x bytes),followed by the Ethernet checksum (4 bytes). Therefore,each packet has a size of 14 + 20 + 20 + 8 + x + 4 =66 + x bytes. For the Read-Holding-Register request, thepacket size with x = 4 bytes is 70 bytes. The responseis depending on the amount of requested values N. With

Kenner et al. EURASIP Journal on Embedded Systems (2017) 2017:12 Page 7 of 13
Fig. 4Modbus TCP/IP communication
x = 1 + 2 · N bytes, the response packet has a size of67 + 2 · N bytes. The ACK is an empty TCP packet withsome activated option flags and has a size of 58 bytes forheader overhead + 6 padding bytes, due to the fact, thatevery Ethernet frame musts be at least 64 bytes. On thebasis of these values, we have a request-response blocksize of 70+ 2 · 64+ 67+ 2 ·N = 265+ 2 ·N bytes, whichis transferred each second for one Modbus device.In an ideal network, without concurrent network traf-
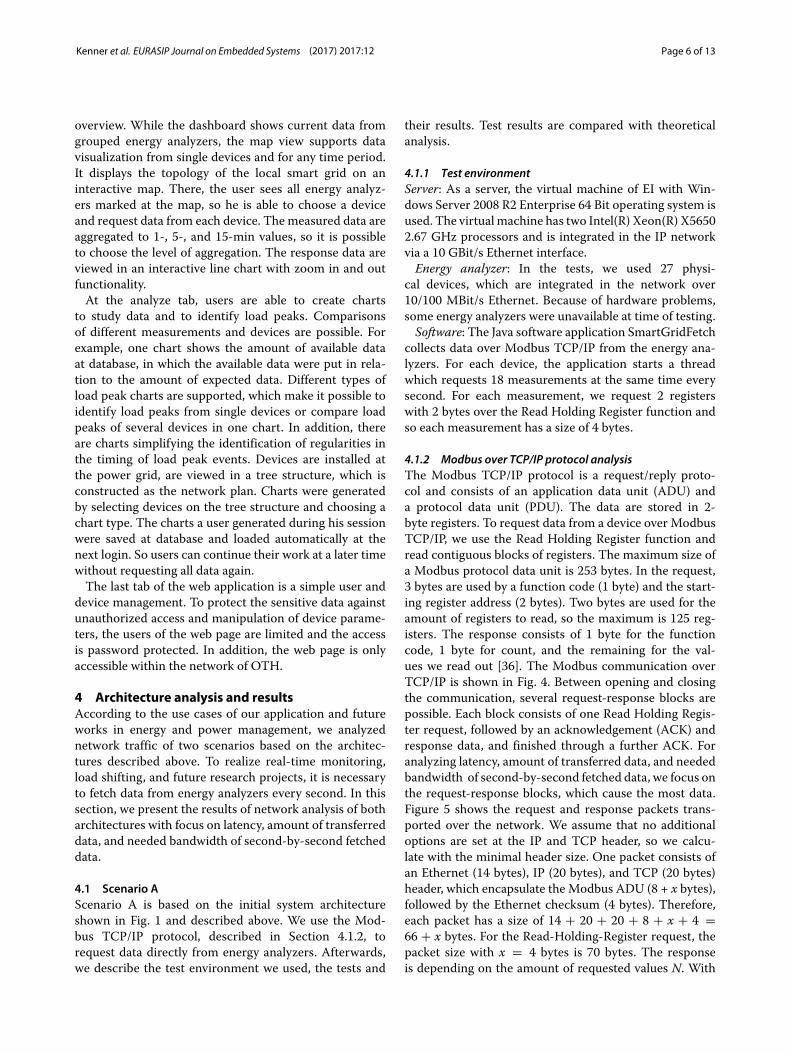
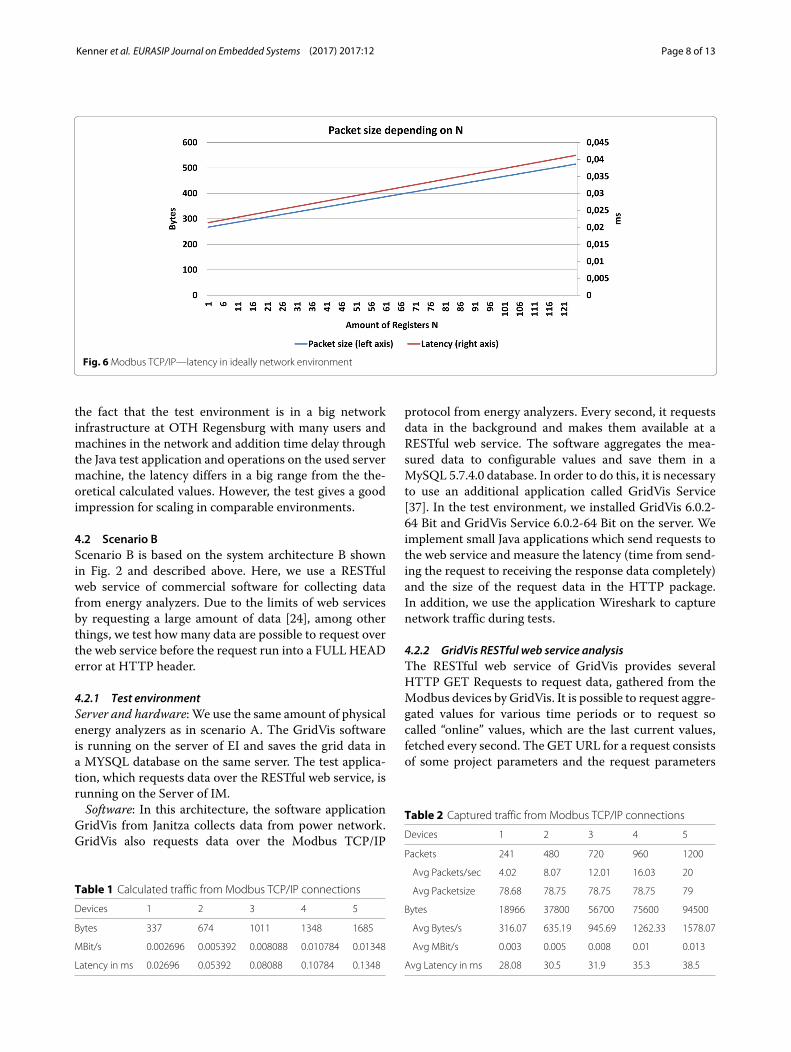
fic, application, and other overhead, latency and size oftransferred packets depending on amount of requestedregisters N is shown in Fig. 6. With each register, thelatency grows in steps of 0.00016 ms. The latency for the
maximum possible amount of registers in one request is0.0412 ms for 62 measurements (515 bytes packet size).As described above, we request 18 measurements foreach energy analyzer. For 18 measurements (36 regis-ters), the request-response block has a size of 337 bytesand a latency of 0.02696 ms. Table 1 shows the valuesfor up to 5 devices as example. Each device requests 18measurements per second. For 5 devices, 2575 bytes/sare transferred over the network in 0.206 ms. Calcu-lated to 100 devices with a total amount of 33700bytes, the latency is 2.696 ms and the needed bandwidthis 0.2696 MBit/s.
4.1.3 Tests and resultsIn our test, we send a request to one device and readout 18 measurements. Then, we increment the amountof devices and respectively the amount of threads. Wemeasure the time between sending the request and get-ting the response data. With Wireshark the transferredtraffic is captured and shown in Table 2. The occupiedbandwidth and all other values increase linearly and theyare proportionally to the amount of requested data. Ifwe calculate these values to 100 devices, we get a band-width of 0.3 MBit/s and a bandwidth of 3 MBit/s for 1000devices. This means that the bandwidth of 100 MBit/s isenough for a big infrastructure of energy analyzers. Thelast row shows the average latency of request/responseperiod. This value is not proportional to the amount ofdevices and transferred data. The latency increases slowlyand a further test with all 27 devices results in an averagelatency of 68.58 ms. In this case, we request 27 · 18 = 486measurements in less than 100 ms. For our scenario, thisis sufficient. If we assume that the time increases linearlywith a value of 3 ms for each additional device as an upperlimit, we get also fast transferred periods for this scenario.In this theoretical case, we get an average latency time of328.08 ms for 100 devices (1800 measurements). In com-parison with the values in an ideal network, as describedabove, the latency is very high and fluctuating. Due to
Fig. 5Modbus request/response packet size
Kenner et al. EURASIP Journal on Embedded Systems (2017) 2017:12 Page 8 of 13
Fig. 6Modbus TCP/IP—latency in ideally network environment
the fact that the test environment is in a big networkinfrastructure at OTH Regensburg with many users andmachines in the network and addition time delay throughthe Java test application and operations on the used servermachine, the latency differs in a big range from the the-oretical calculated values. However, the test gives a goodimpression for scaling in comparable environments.
4.2 Scenario BScenario B is based on the system architecture B shownin Fig. 2 and described above. Here, we use a RESTfulweb service of commercial software for collecting datafrom energy analyzers. Due to the limits of web servicesby requesting a large amount of data [24], among otherthings, we test howmany data are possible to request overthe web service before the request run into a FULL HEADerror at HTTP header.
4.2.1 Test environmentServer and hardware: We use the same amount of physicalenergy analyzers as in scenario A. The GridVis softwareis running on the server of EI and saves the grid data ina MYSQL database on the same server. The test applica-tion, which requests data over the RESTful web service, isrunning on the Server of IM.Software: In this architecture, the software application
GridVis from Janitza collects data from power network.GridVis also requests data over the Modbus TCP/IP
Table 1 Calculated traffic from Modbus TCP/IP connections
Devices 1 2 3 4 5
Bytes 337 674 1011 1348 1685
MBit/s 0.002696 0.005392 0.008088 0.010784 0.01348
Latency in ms 0.02696 0.05392 0.08088 0.10784 0.1348
protocol from energy analyzers. Every second, it requestsdata in the background and makes them available at aRESTful web service. The software aggregates the mea-sured data to configurable values and save them in aMySQL 5.7.4.0 database. In order to do this, it is necessaryto use an additional application called GridVis Service[37]. In the test environment, we installed GridVis 6.0.2-64 Bit and GridVis Service 6.0.2-64 Bit on the server. Weimplement small Java applications which send requests tothe web service and measure the latency (time from send-ing the request to receiving the response data completely)and the size of the request data in the HTTP package.In addition, we use the application Wireshark to capturenetwork traffic during tests.
4.2.2 GridVis RESTful web service analysisThe RESTful web service of GridVis provides severalHTTP GET Requests to request data, gathered from theModbus devices by GridVis. It is possible to request aggre-gated values for various time periods or to request socalled “online” values, which are the last current values,fetched every second. The GETURL for a request consistsof some project parameters and the request parameters
Table 2 Captured traffic from Modbus TCP/IP connections
Devices 1 2 3 4 5
Packets 241 480 720 960 1200
Avg Packets/sec 4.02 8.07 12.01 16.03 20
Avg Packetsize 78.68 78.75 78.75 78.75 79
Bytes 18966 37800 56700 75600 94500
Avg Bytes/s 316.07 635.19 945.69 1262.33 1578.07
Avg MBit/s 0.003 0.005 0.008 0.01 0.013
Avg Latency in ms 28.08 30.5 31.9 35.3 38.5
Kenner et al. EURASIP Journal on Embedded Systems (2017) 2017:12 Page 9 of 13
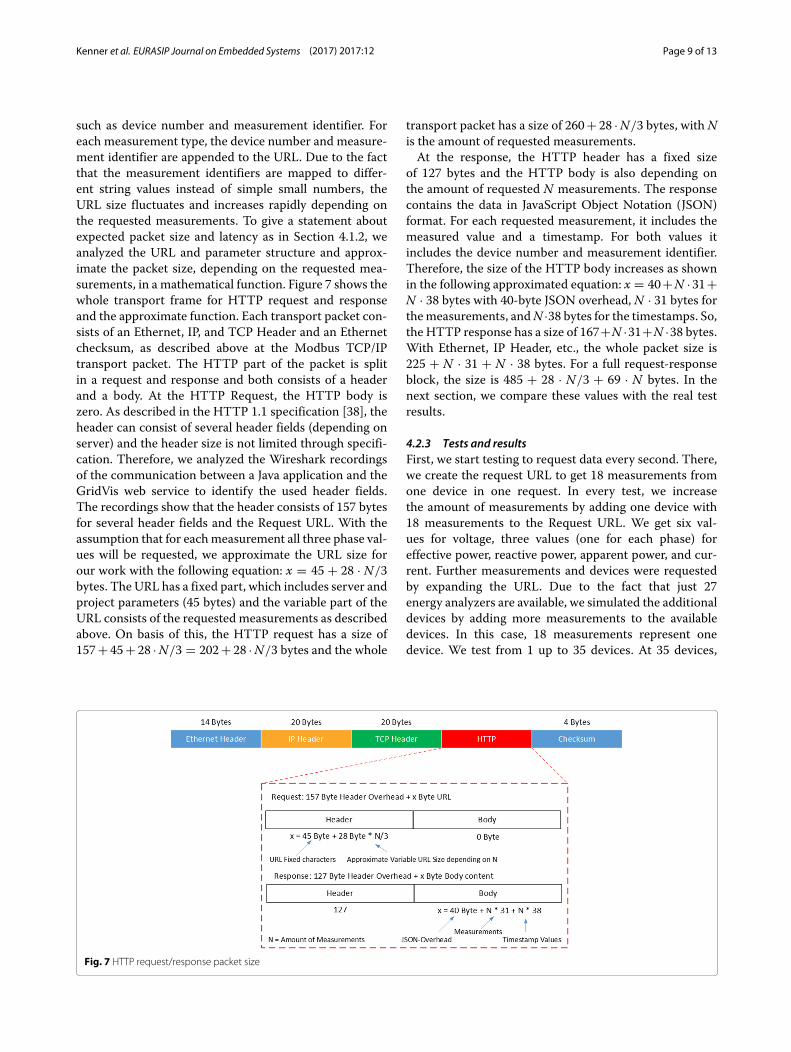
such as device number and measurement identifier. Foreach measurement type, the device number and measure-ment identifier are appended to the URL. Due to the factthat the measurement identifiers are mapped to differ-ent string values instead of simple small numbers, theURL size fluctuates and increases rapidly depending onthe requested measurements. To give a statement aboutexpected packet size and latency as in Section 4.1.2, weanalyzed the URL and parameter structure and approx-imate the packet size, depending on the requested mea-surements, in a mathematical function. Figure 7 shows thewhole transport frame for HTTP request and responseand the approximate function. Each transport packet con-sists of an Ethernet, IP, and TCP Header and an Ethernetchecksum, as described above at the Modbus TCP/IPtransport packet. The HTTP part of the packet is splitin a request and response and both consists of a headerand a body. At the HTTP Request, the HTTP body iszero. As described in the HTTP 1.1 specification [38], theheader can consist of several header fields (depending onserver) and the header size is not limited through specifi-cation. Therefore, we analyzed the Wireshark recordingsof the communication between a Java application and theGridVis web service to identify the used header fields.The recordings show that the header consists of 157 bytesfor several header fields and the Request URL. With theassumption that for eachmeasurement all three phase val-ues will be requested, we approximate the URL size forour work with the following equation: x = 45 + 28 · N/3bytes. The URL has a fixed part, which includes server andproject parameters (45 bytes) and the variable part of theURL consists of the requested measurements as describedabove. On basis of this, the HTTP request has a size of157+ 45+ 28 ·N/3 = 202+ 28 ·N/3 bytes and the whole
transport packet has a size of 260+ 28 ·N/3 bytes, with Nis the amount of requested measurements.At the response, the HTTP header has a fixed size
of 127 bytes and the HTTP body is also depending onthe amount of requested N measurements. The responsecontains the data in JavaScript Object Notation (JSON)format. For each requested measurement, it includes themeasured value and a timestamp. For both values itincludes the device number and measurement identifier.Therefore, the size of the HTTP body increases as shownin the following approximated equation: x = 40+N ·31+N · 38 bytes with 40-byte JSON overhead, N · 31 bytes forthemeasurements, andN ·38 bytes for the timestamps. So,the HTTP response has a size of 167+N ·31+N ·38 bytes.With Ethernet, IP Header, etc., the whole packet size is225 + N · 31 + N · 38 bytes. For a full request-responseblock, the size is 485 + 28 · N/3 + 69 · N bytes. In thenext section, we compare these values with the real testresults.
4.2.3 Tests and resultsFirst, we start testing to request data every second. There,we create the request URL to get 18 measurements fromone device in one request. In every test, we increasethe amount of measurements by adding one device with18 measurements to the Request URL. We get six val-ues for voltage, three values (one for each phase) foreffective power, reactive power, apparent power, and cur-rent. Further measurements and devices were requestedby expanding the URL. Due to the fact that just 27energy analyzers are available, we simulated the additionaldevices by adding more measurements to the availabledevices. In this case, 18 measurements represent onedevice. We test from 1 up to 35 devices. At 35 devices,
Fig. 7 HTTP request/response packet size

Kenner et al. EURASIP Journal on Embedded Systems (2017) 2017:12 Page 10 of 13
Fig. 8 Packet size—without overhead from underlying protocols
we get 35 · 18 = 630 measurements in one request.Every additional measurement causes the expected fullhead status code at the HTTP header so we receive nodata, because the Jetty Server application of the webservice limits the Request URL. Figure 8 shows therequest and response packet size in comparison with theapproximated packet size. The approximated packet sizeis calculated with the mathematical function describedabove. The figure shows that the approximated packetsize just changes in a small range from the real testedvalues. Figure 9 shows the real transferred data, cap-tured with Wireshark, and compares the real packet sizewith the approximated packet size. It shows that the realpacket size is larger than the approximated size. In the
approximated model, we did not consider ACK messagesin the communication, so the size of real tested data isdifferent. Additionally, we did not consider that big pack-ets could be fragmented, so the overhead from underlyingprotocol stacks increases. Figure 10 shows the average ofthe needed bandwidth in MBit/s and Fig. 11 presents theaverage latency in milliseconds between sending a requestand receiving the data of the corresponding responsecompletely. The test is over a period of 60 s as shown atthe x-axis. The lines show the average latency in millisec-onds at the primary (left) y-axis for the different amount ofdevices. The dots present the maximummeasured latencyin the test period of 60 s at the secondary (right) y-axis inmilliseconds for the different amount of devices. The blue
Fig. 9 Packet size—with overhead from underlying protocols

Kenner et al. EURASIP Journal on Embedded Systems (2017) 2017:12 Page 11 of 13
Fig. 10 Average MBit/s
dot shows the maximummeasured latency for one device,the red one for 10 devices, and so on. The average latencyis low for 1, 10, and 20 devices. For 30 and 35 devices,the average latency is also less than a second but there,the maximum measured latency is above 1 s. In the caseof 35 devices, we get latency above 1 s twice. This meansthat in a period of 60 s, we receive 58 response pack-ets with measurements instead of 60. The results showthat the average latency is not increasing proportionallywith the transferred data size, which is almost linearlyto the number of requested measurements. In our case,we need measurements in an interval of 1 s for real-time
monitoring, future energy, and power management andfor the analysis in EI. The measured latency, with outliersshown above, is suitable for these use cases. Additionally,the measurements were aggregated to 1-min values, so adata density of 96.67 % is acceptable, because themeasure-ments of the power network do not differ in a big rangefrom 1 s to the next. Figure 12 shows the average latencyin comparison with the approximated latency. As such, aswe described for the Modbus protocol, the latency differsin a big range from the approximated latency through highnetwork load, application time delay, and utilization rateof the used server machine.
Fig. 11 Average latency

Kenner et al. EURASIP Journal on Embedded Systems (2017) 2017:12 Page 12 of 13
Fig. 12 Comparison of average latency
The tests show that time and needed bandwidth are notthe limiting factors but the amount of requested mea-surements. It is possible to request 630 measurements,which is equivalent to 35 devices with 18 measurements,at one request in less than a second. For our powernetwork infrastructure, this is a suitable value. Throughsplitting the amount of requested devices and runningseveral threads, we can increase the amount of devices.Each thread requests 10 devices, respectively 180 mea-surements. We run this test with 10, 20, 30, and 40threads. Figure 13 shows the average of needed bandwidthinMBit/s. Here, the latency for 10 and 20 threads is also inour range of 1 s. The bandwidth for 1, 10, and 20 threads,respectively, 10, 100, and 200 devices, which increases lin-early, is acceptable. At the test with 30 and 40 threads,the REST interface is operating to full capacity and theCPU capacity of the server is 100 %. Therefore, we do notreceive all data we requested.
5 ConclusionsThis paper presents a software application for analyzingand monitoring real-time data of a smart grid. This appli-cation forms the basis of future projects with focus on loadshifting and peak clipping. We describe the web appli-cation and two possible architectures for collecting datain order to avoid concurrent access operations on energyanalyzers. On the basis of the described architectures, wecarry out performance tests for each architecture. Thetests show that both architectures are currently useablein a small energy landscape and give a good impres-sion for scaling in comparable environments. TheModbusTCP/IP protocol is a fast communication protocol for thisuse case. The solution with the GridVis software wherewe get data over the REST interface is useable for a smallamount of energy analyzers. In contrast, if the energylandscape is expanded, the REST interface of this softwareruns into its limits.
Fig. 13 Average MBit/s—threads

Kenner et al. EURASIP Journal on Embedded Systems (2017) 2017:12 Page 13 of 13
AcknowledgementsThis work was supported by the Regensburg Center of Energy and Resources(RCER) and the Technology and Science Network Oberpfalz (TWO). Furtherinformation is under www.rcer.de.
Competing interestsThe authors declare that they have no competing interests.
Received: 29 February 2016 Accepted: 23 July 2016
References1. M Hashmi, S Hänninen, K Mäki, in Innovative Smart Grid Technologies (ISGT
Latin America), 2011 IEEE PES Conference On. Survey of smart grid concepts,architectures, and technological demonstrations worldwide (IEEE, 2011),pp. 1–7
2. Y Yan, Y Qian, H Sharif, D Tipper, A survey on smart grid communicationinfrastructures: Motivations, requirements and challenges. IEEE Commun.Surv. Tutor. 15(1), 5–20 (2013)
3. J Gao, Y Xiao, J Liu, W Liang, CP Chen, A survey of communication/networking in smart grids. Futur. Gener. Comput. Syst. 28(2), 391–404(2012)
4. E Tronci, T Mancini, F Mari, I Melatti, RH Jacobsen, E Ebeid, SA Mikkelsen,M Prodanovic, JK Gruber, B Hayes, in Proceedings of theWork in ProgressSession (euromicro Dsd/seaa 2014). SmartHG: energy demand aware openservices for smart grid intelligent automation, (2014)
5. V Alimguzhin, F Mari, I Melatti, E Tronci, E Ebeid, SA Mikkelsen, RHylsberg Jacobsen, JK Gruber, B Hayes, F Huerta, et al., in Digital SystemDesign (DSD), 2015 Euromicro Conference On. A glimpse of SmartHG projecttest-bed and communication infrastructure (IEEE, 2015), pp. 225–232
6. F Pallonetto, E Mangina, D Finn, F Wang, A Wang, in Proceedings of the 1stACM Conference on Embedded Systems for Energy-Efficient Buildings. Arestful API to control a energy plus smart grid-ready residential building:demo abstract (ACM, 2014), pp. 180–181
7. RF Eggea, M Ferreira, AR Aoki, RJ Riella, in Innovative Smart GridTechnologies Latin America (ISGT LATAM), 2015 IEEE PES. Energymanagement including photovoltaic panel and energy storage for smartgrids through mobile application (IEEE, 2015), pp. 177–181
8. S Chakraborty, MD Weiss, MG Simoes, Distributed intelligent energymanagement system for a single-phase high-frequency AC microgrid.IEEE Trans. Ind. Electron. 54(1), 97–109 (2007)
9. P Palensky, D Dietrich, Demand side management: demand response,intelligent energy systems, and smart loads. IEEE Trans. Ind. Inform. 7(3),381–388 (2011)
10. BP Esther, KS Kumar, A survey on residential demand side managementarchitecture, approaches, optimization models and methods. Renew.Sust. Energ. Rev. 59, 342–351 (2016)
11. P Siano, Demand response and smart grids—a survey. Renew. Sust.Energ. Rev. 30, 461–478 (2014)
12. J Ekanayake, N Jenkins, K Liyanage, J Wu, A Yokoyama, Smart Grid:Technology and Applications. (Wiley, United Kingdom, 2012)
13. R Palma-Behnke, C Benavides, F Lanas, B Severino, L Reyes, J Llanos, DSáez, A microgrid energy management system based on the rollinghorizon strategy. IEEE Trans. Smart Grid. 4(2), 996–1006 (2013)
14. S Kenner, R Thaler, M Kucera, K Volbert, T Waas, in Intelligent Solutions inEmbedded Systems (WISES), 2015 12th International Workshop On. Smartgrid architecture for monitoring and analyzing, including Modbus andrest performance comparison (IEEE, 2015), pp. 91–96
15. G Zenger, S Kenner, K Volbert, T Waas, M Kucera, in Intelligent Solutions inEmbedded Systems (WISES), 2013 Proceedings of the 11thWorkshop On.Acquiring energy data from a medium-voltage grid for future smart gridsolutions: a practical smart grid application example realized by use ofcellular communication networks of the 2 nd and 3 rd generation (IEEE,2013), pp. 1–8
16. P Schlegl, P Robatzek, M Kucera, K Volbert, T Waas, in Second InternationalConference on Advances in Computing, Communication and InformationTechnology (CCIT’14). Performance analysis of mobile radio for automaticcontrol in smart grids (Seek Digital Library, 2014), pp. 135–141
17. S Akshay Uttama Nambi, M Vasirani, RV Prasad, K Aberer, in InnovativeSmart Grid Technologies Conference Europe (ISGT-Europe), 2014 IEEE PES.
Performance analysis of data processing architectures for the smart grid(IEEE, 2014), pp. 1–6
18. MM Rahman, M Kuzlu, M Pipattanasomporn, S Rahman, in InnovativeSmart Grid Technologies Conference (ISGT), 2014 IEEE PES. Architecture ofweb services interface for a home energy management system (IEEE,2014), pp. 1–5
19. E Joelianto, et al, inWireless and Optical Communications Networks, 2008.WOCN’08. 5th IFIP International Conference On. Performance of an industrialdata communication protocol on ethernet network (IEEE, 2008), pp. 1–5
20. Q Liu, Y Li, in Intelligent Control and Automation, 2006. WCICA 2006. TheSixthWorld Congress On. Modbus/tcp based network control system forwater process in the firepower plant, vol. 1 (IEEE, 2006), pp. 432–435
21. B Kim, D Lee, T Choi, in TENCON 2015-2015 IEEE Region 10 Conference.Performance evaluation for Modbus/TCP using network simulator NS3(IEEE, 2015), pp. 1–5
22. JL Fernandes, IC Lopes, JJ Rodrigues, S Ullah, in Ubiquitous and FutureNetworks (ICUFN), 2013 Fifth International Conference On. Performanceevaluation of restful web services and AMQP protocol (IEEE, 2013),pp. 810–815
23. H Hamad, M Saad, R Abed, Performance evaluation of restful web servicesfor mobile devices. Int. Arab J. e-Technol. 1(3), 72–78 (2010)
24. Z Shelby, Embedded web services. IEEE Wirel. Commun. 17(6), 52–57(2010)
25. D Srinivasan, T Reindl, et al, in Smart Grid Technologies-Asia (ISGT ASIA),2015 IEEE Innovative. Real-time display of data from a smart-grid ongeographical map using a GIS tool and its role in optimization of gametheory (IEEE, 2015), pp. 1–6
26. SA Kim, D Shin, Y Choe, T Seibert, SP Walz, Integrated energy monitoringand visualization system for smart green city development: designing aspatial information integrated energy monitoring model in the context ofmassive data management on a web based platform. Autom. Constr. 22,51–59 (2012)
27. RS Brewer, PM Johnson, in Smart Grid Communications (SmartGridComm),2010 First IEEE International Conference On. Wattdepot: an open sourcesoftware ecosystem for enterprise-scale energy data collection, storage,analysis, and visualization (IEEE, 2010), pp. 91–95
28. Manual: SENTRON PAC4200. https://support.industry.siemens.com/cs/document/34261595/systemhandbuch-sentron-multifunktionsmessger%C3%A4t-sentron-pac4200?dti=0&pnid=19739&lc=de-DE, Accessed12 Apr 2015
29. Manual:UMG96RM. https://wiki.janitza.de/display/GRIDVIS50EN. Accessed12 Apr 2015
30. Apache Cassandra 2.0 - Documentation. http://docs.datastax.com/en/cassandra/2.0/pdf/cassandra20.pdf. Accessed 27 May 2016
31. M Arenas-Martìnez, S Herrero-Lopez, A Sanchez, JR Williams, P Roth, PHofmann, A Zeier, in Smart Grid Communications (SmartGridComm), 2010First IEEE International Conference On. A comparative study of data storageand processing architectures for the smart grid (IEEE, 2010), pp. 285–290
32. A Nayak, A Poriya, D Poojary, Type of NOSQL databases and its comparisonwith relational databases. Int. J. Appl. Inf. Syst. 5(4), 16–19 (2013)
33. Highcharts, Highstock Libraries. http://www.highcharts.com. Accessed 19Feb 2016
34. V Pimentel, BG Nickerson, Communicating and displaying real-time datawith websocket. IEEE Internet Comput. 16(4), 45–53 (2012)
35. A Wessels, M Purvis, J Jackson, S Rahman, in Information Technology: NewGenerations (ITNG), 2011 Eighth International Conference On. Remote datavisualization through websockets (IEEE, 2011), pp. 1050–1051
36. Modbus Application Protocol Specification V1 1b3. http://www.modbus.org. Accessed 14 Apr 2015
37. GridVis-Documentation. https://wiki.janitza.de/display/GRIDVIS50EN/GridVisDocumentation+5.0. Accessed 12 Apr 2015
38. R Fielding, J Gettys, J Mogul, H Frystyk, L Masinter, P Leach, T Berners-Lee,Rfc 2616, hypertext transfer protocol-HTTP/1.1 (1999). https://www.ietf.org/rfc/rfc2616.txt. Accessed 01 Jul 2016