research openaccess blueanduvled · pdf fileresearch openaccess...
TRANSCRIPT
Mustafic et al. Journal of Biological Engineering 2014, 8:29http://www.jbioleng.org/content/8/1/29
RESEARCH Open Access
Blue and UV LED-induced fluorescence incotton foreign matterAdnan Mustafic1, Changying Li1* and Mark Haidekker2
Abstract
Background: Cotton is an important domesticated fiber used to manufacture a variety of products and industrialgoods. During harvesting with cotton strippers and cotton pickers, it is contaminated with foreign matter frombotanical and non-botanical sources which adversely affect the quality and consistency of cotton, and thereforereduces its market value. To improve the current grading done by the High Volume Instrument (HVI) and humaninspectors, it was explored whether fluorescence imaging can be used for cotton foreign matter detection.
Results: Eight types of botanical foreign matter (bark, bract, brown leaf, green leaf, hull, seed coat, seed, stem), andfour types of non-botanical foreign matter (paper, twine, plastic bale packaging, plastic bag) were subjected to afluorescence spectroscopy analysis to determine their optimal excitation and emission wavelength range. Matrix 3Dscans were performed in the excitation range from 300 nm to 500 nm, and emission range from 320 nm to 700 nm,and the results indicated the photo-excitable fluorescence in the aforementioned excitation range for all the selectedforeign matter categories. Consequently, the blue and the UV LEDs were selected as the excitation sources. The blueLED light provided optimal excitation light for bark, brown leaf, bract, green leaf, hull, and stem, while the UV LED lightprovided optimal excitation light for paper, plastic bag, plastic packaging, seed, seed coat, and twine.
Conclusions: UV and blue light induces fluorescence in 12 types of botanical and non-botanical cotton foreignmatter. An imaging apparatus with blue and UV light excitation sources, and a consumer grade SLR camera wassuccessfully developed to capture and characterize fluorescent images of cotton foreign matter. Based on the results,fluorescent imaging could be a promising method for cotton foreign matter detection. Future studies will focus onthe classification of cotton foreign matter categories and to further refine the image processing sequence.
Keywords: Cotton foreign matter, Fluorescence, Spectroscopy, Blue LED, UV LED, Imaging
BackgroundCotton is the most important natural fiber in the world.Worldwide in 2004, 40% of fiber utilized was cotton, withend products including clothes, home furnishings, indus-trial products, and food [1]. Food from cotton byproductsincludes cottonseed oil, while seed and hull are used toproduce animal feed. In the United States, cotton is har-vested with cotton pickers and strippers, while in therest of the world, cotton is primarily harvested by man-ual labor [1]. One challenge is the introduction of foreignmatter to the harvested seed cotton, which is picked up
*Correspondence: [email protected] of Engineering, University of Georgia, 712F Boyd Graduate Researchand Studies Center, 30602 Athens, GA, USAFull list of author information is available at the end of the article
both by human pickers and harvesting machines. Theforeign matter, considered to be trash, can be separatedinto two groups based on their respective origin: botan-ical and non-botanical foreign matter. Botanical foreignmatter (e.g. bark, bract, brown leaf, green leaf, hull, seedcoat, seed, stem) originates from cotton plants or othernearby plants, while non-botanical foreign matter is typ-ically brought to the field from elsewhere. The amountof foreign material in cotton is one of the most impor-tant cotton quality parameters, even more so when thecotton-processing equipment becomes more automatic.The presence of foreign matter in cotton severely affectscotton grade and thus the price per bale paid by thespinner to cotton growers [2]. In addition, the foreignmat-ter in cotton also reduces the efficiency of the spinning
© 2014 Mustafic et al.; licensee BioMed Central Ltd. This is an Open Access article distributed under the terms of the CreativeCommons Attribution License (http://creativecommons.org/licenses/by/4.0), which permits unrestricted use, distribution, andreproduction in any medium, provided the original work is properly credited. The Creative Commons Public Domain Dedicationwaiver (http://creativecommons.org/publicdomain/zero/1.0/) applies to the data made available in this article, unless otherwisestated.

Mustafic et al. Journal of Biological Engineering 2014, 8:29 Page 2 of 11http://www.jbioleng.org/content/8/1/29
and ginning operations, and eventually lowers the qualityof the final woven product. Therefore, rapid identifica-tion and classification of the foreign matter in cotton ateach stage of cleaning and processing is important toeliminate or reduce the presence of trash and improveginning/spinning efficiency and quality. Currently, cottonforeign matter grading is performed by human classersand instruments, such as the High Volume Instrument(HVI). Grades assigned by human classers are subjective,and more accurate grading is performed by the gradinginstruments. The HVI utilizes the geometric method toacquire images of the surface of cotton samples, and itestimates the area occupied by foreign matter, but lacksspecificity as to the type of foreign matter detected [3].Typically, spectroscopic and imaging methods have
been used to detect and differentiate cotton foreignmatter. A study by Himmelsbach et al. used FourierTransform-Infrared (FT-IR) spectroscopy combined withAttenuated Total Reflectance (ATR) to retrieve the spectraof distinct cotton foreign matter categories from botan-ical and non-botanical sources, and compare it to thespectra in the reference database [4]. Spectral matchingof reference spectra and sample spectra was observedbetween Pima cotton foreign matter and Upland cot-ton foreign matter. The accuracy diminished when sam-ples consisted of a mixture of cotton varieties, and amixture of experimental varieties, thus necessitating acontinuous update of the reference database spectralcontent.Fortier et al. used FT-Near-Infrared (FT-NIR) spec-
troscopy to obtain spectra from four botanical cottonforeign matter categories (hull, leaf, seed coat, stem) andcompare them to the spectra from the reference database[5]. The results show a 97% foreign matter category pre-diction accuracy with those found in the reference set,but it needs to be renewed periodically with the referencespectra from new cultivars. A study by the same researchgroup acquired the unique spectral signatures of botan-ical (hull, leaf, seed, seed coat, stem) and non-botanical(various types of polyethylene and polypropylene plastics)foreign matter in the wavelength range from 800–2500nm [6]. The aforementioned spectra were compared to thespectra present in the NIR spectral database, resulting inthe overall accuracy of 98%. The results could be furtherimproved with the addition of spectra from other types offoreign matter.Liu et al. attempted classification of seven leaf cate-
gories of cotton with a research grade spectrometer [7].Classification models were developed by employing thesoft independent modeling of class analogy (SIMCA) andprincipal component analysis (PCA). Subsequent applica-tion on 650 cotton lint samples with different leaf gradesresulted in classification rates ranging from 86% for thespectral region of 405–1095 nm to 95% for the spectral
region of 1105–1700 nm. However, the study did notclassify different types of botanical foreign matter.Gamble et al. focused on utilizing fluorescence spec-
troscopy to determine whether it is possible to quantita-tively estimate cotton foreign matter based on their chem-ical and spectroscopic properties [8]. Extracts of six typesof foreign matter (bract, hull, leaf, seed coat, shale, stem)in dimethyl sulfoxide (DMSO) were excited at a singlewavelength, producing emission spectra interposed withfluorescence spectra from other foreignmatter categories.Results from the partial least-squares (PLS) analysis dif-ferentiated hull and leaf due to the presence of a relativelystrong emission peak (R2
hull = 0.94, R2leaf = 0.93), but
the prediction results for bract, seed coat, shale, and stemwere poor (R2
bract = 0.73, R2seedcoat = 0.58, R2
shale = 0.43,R2stem = 0.79).Compared to the spectroscopy method, the imaging
approach provides the information related to color, geom-etry, and the spatial distribution of the foreign matter.Xu et al. constructed a cotton trash and cotton mea-surement (CTCM) system by assembling a video imagingsystem with the ability to estimate foreign matter contentand color parameters of cotton lint samples, but with-out the ability to differentiate various types of foreignmatter [9]. The results of the CTCM were compared tothe USDA standards for conventional colorimeters andhuman classers [10]. High correlations (R2 = 0.945–0.999)were reported for color measurements from the CTCMsystem and those from the HVI, Minolta CR-210 col-orimeter, and the grades assigned by human classers. Ina later study, the CTCM system was applied to cottonforeign matter differentiation. Xu et al. examined colorfeatures of four common types of foreign matter: bark,leaf, inner side of seed coat, and hairy side of seed coat[11]. For this purpose 400 cotton foreign matter particlesfrom 12 cotton sample were analyzed, and their respectivecolor features used as inputs to three clustering methods(sum of squares, fuzzy clustering, and neural networks).Sum of squares clustering and fuzzy clustering yieldedaccurate foreign matter classification of 83% for leaf cat-egory and 93% for bark category, and neural networkshad at least 95% accurate classification rate for all foreignmatter categories.Recently, a system with white light and Ultraviolet (UV)
excitation light has shown fluorescence imaging could bea useful tool in cotton foreignmatter detection. Zhou et al.constructed a system with the capacity to alternate whitelight and UV excitation light with the goal of foreign mat-ter detection in the spectral range of 250–850 nm [12]. Afluorescence spectroscopy study examined optimal excita-tion and emission spectral range (excitation range = 320–400 nm, emission range= 420–600 nm) of a single sampleof lint containing five foreign matter categories (whitebundle strip, black hair, red bundle strip, white paper strip,
Mustafic et al. Journal of Biological Engineering 2014, 8:29 Page 3 of 11http://www.jbioleng.org/content/8/1/29
and white woven strip), and indicated the presence ofphotoexcitable fluorophores. Preliminary results showedfluorescence imaging could possibly be used to detectboth white and colored foreign matter. However, the studypresented one sample and it only examined non-botanicalcotton foreign matter, whereas the majority of the foreignmatter in the US cotton is botanical foreign matter.Cotton foreign matter identification and differentiation
methods so far have either considered a limited numberof samples or types of foreign matter, and mainly usedspectroscopy and color imaging. Hence, there exists a gapwhen it comes to the consideration of additional typesof imaging modalities like fluorescence imaging to cottonforeign matter detection and differentiation, and a largernumber of foreign matter categories need to be taken intoaccount.To fill the knowledge gap, the overall goal of the study
was to conduct an in-depth study on fluorescence imagingof both botanical and non-botanical cotton foreign matterdetection. Specific objectives were to:
1. explore whether various cotton foreign mattercategories contain fluorophores with unique spectralsignatures
2. design a fluorescent imaging system and acquireimages of cotton foreign matter
3. establish a qualitative criteria to separate cottonforeign matter from lint.
ResultsFluorescence spectroscopy analysisOut of eight botanical foreign matter categories, five(bark, bract, green leaf, brown leaf, stem) had their opti-mal emission peaks in the red region of the visible spectraranging from 671 nm to 675 nm, with optimal excita-tion wavelengths either at 410 nm or 430 nm (Figure 1).The red fluorescence in the aforementioned emissionrange is due to the presence of chlorophyll. Consequently,the strongest measured emission signal was recorded forgreen leaves at the peak emission of 675 nm (2.38 × 10⁶counts/second (cps)), approximately 148 times strongerthan the weakest signal recorded for seed at the emissionpeak of 461 nm (16,000 cps).Seed and seed coat do not have chlorophyll, and there-
fore no emission in the red spectral range, but are ratheroptimally excited at 340 nm and 330 nm, with associatedblue emission at 461 nm and 415 nm, respectively. Hulloptimal excitation and emission wavelength is at 400 nmand 516 nm, and lint is at 360 nm and 434 nm.Regarding the non-botanical foreign matter, paper had
the strongest emission peak at 3.9× 10⁶ cps, with optimalexcitation and emission wavelength at 360 nm and 412nm (Figure 2). Plastic bale packaging had the same opti-mal excitation wavelength, but different optimal emission
at 434 nm. Plastic bag was optimally excited at 370 nm,with emission peak at 417 nm. Both plastic bale packagingand plastic bag were weakly fluorescent (8,000 and 34,000cps). On the other hand, twine had both optimal excita-tion and emission wavelength in the UV range (300 nmand 356 nm) with peak intensity at 482,000 cps. Lint wasfound to be optimally excited in the UV range at 360 nm,and optimum blue emission at 434 nm.From the summary of cotton foreign matter categories
and lint, their respective optimal excitation and emis-sion peaks, and peak intensities, it can be observed thatfive botanical foreign matter categories (green leaf, bark,brown leaf, bract, stem) can be excited in the blue spectralrange (410 nm and 430 nm) and emit in the red spectralrange (671 nm to 675 nm), with hull optimal excitationat 400 nm and optimal emission at 516 nm (Table 1).Two botanical foreign matter categories (seed, seed coat)can be excited in the UV range (330 nm and 340 nm),similar to all four types of non-botanical foreign mattercategories, which have optimal excitation wavelengths inthe region from 300 nm to 370 nm. With the exceptionof twine emitting in the UV region, all foreign mattercategories excited in the UV region have their optimalemission peaks in the visible light region.
Fluorescent imagingGreen fluorescence emission is dominant in all six typesof cotton foreign matter (bark, bract, brown leaf, greenleaf, hull, stem) and lint excited under blue LED illumi-nation (Figure 3). To a lesser extent, red fluorescence isalso present, but in a secondary role. On the other hand,in all types of cotton foreign matter (paper, plastic bag,plastic packaging, seed, seed coat (inner and outer), twine)and lint excited under UV LED illumination, blue fluores-cence emission predominates. Paper is a unique case, andbecause all of its three channels (red, green, blue) are highin value, it appears white.If any potential classification of cotton foreign matter is
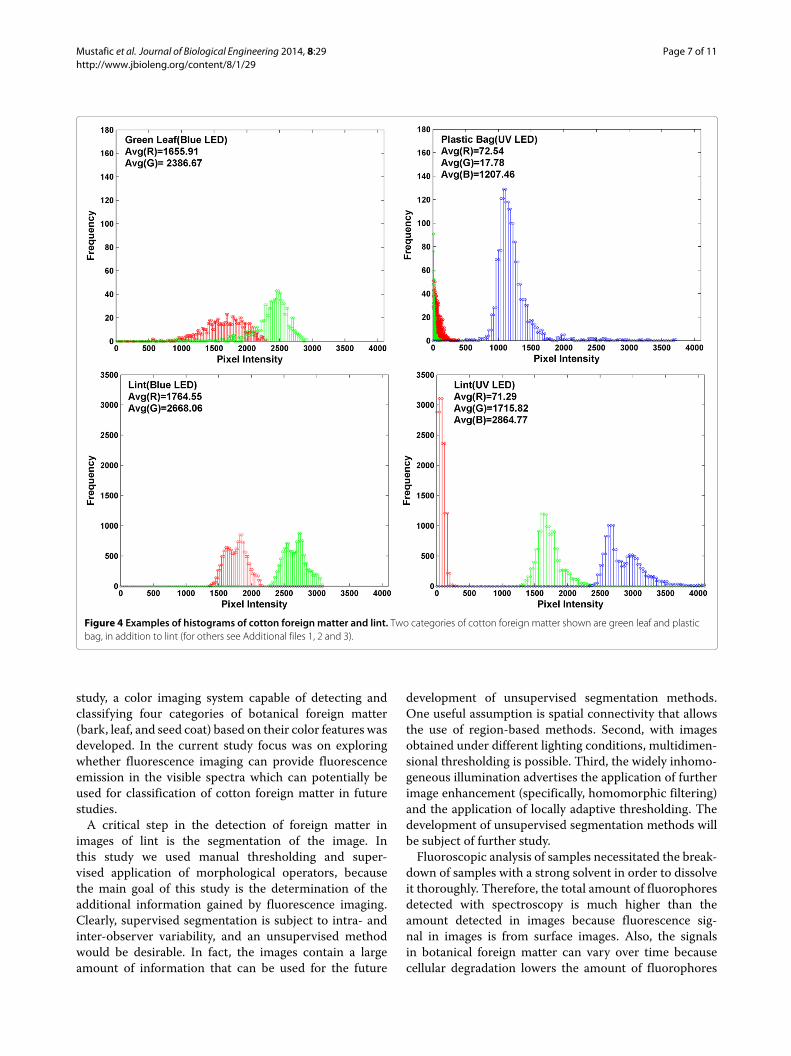
to be done, the first step in the image processing sequenceis to distinguish foreign matter from lint. By looking attheir respective histograms (Figure 4 and Additional files1, 2 and 3), cotton foreignmatter and lint have varying lev-els of fluorescence emission. Based on those differences,thresholding criteria specific to particular types of foreignmatter can be established.When comparing green leaf and plastic bag to lint, sev-
eral observations can be made (Figure 4). In the case ofgreen leaf, its red and green channel intensity is lowerwhen compared to the same color channels of lint. Whenplastic bag is compared to lint, their respective red chan-nels are very close in value. On the other hand, largerdifference is found in the green and blue channel wherelint exhibited much higher green and blue fluorescenceemission.

Mustafic et al. Journal of Biological Engineering 2014, 8:29 Page 4 of 11http://www.jbioleng.org/content/8/1/29
Figure 1Matrix 3D scans of botanical foreign matter and lint. Five foreign matter categories (bark, brown leaf, bract, green leaf, stem) have theoptimal excitation wavelength either at 410 nm or 430 nm. Their optimal emission wavelength ranges from 671 nm to 675 nm, and is due tochlorophyll presence. Due to the absence of chlorophyll, seed and seed coat are optimally excited in the UV range (340 nm and 330 nm) withoptimal emission at 461 nm and 415 nm, respectively. Hull optimum excitation and emission wavelength is at 400 nm and 516 nm, and lint’s at 360nm and 434 nm.
Mustafic et al. Journal of Biological Engineering 2014, 8:29 Page 5 of 11http://www.jbioleng.org/content/8/1/29
Figure 2Matrix 3D scans of non-botanical foreign matter. Non-botanical foreign matter categories have their optimal excitation wavelengthsin the UV range, with paper and plastic bale packaging at 360 nm, plastic bag at 370 nm, and twine at 300 nm. Twine optimal emission is also in theUV range (356 nm), while those of paper, plastic bale packaging, and plastic bag are in the visible light range at 412, 434, and 417 nm, respectively.
In general, studies focused on detection and differ-entiation of cotton foreign matter have typically usedwhite light as a source of illumination. To show howfluorescence emission differs from white light reflectance,a comparison can be made (Table 2). For six types of
Table 1 Optimal excitation and emission wavelength, andtheir associated intensities for botanical foreignmatter,non-botanical foreignmatter, and lint
Category Optimal Optimal Intensityexcitation λ emission λ (×103)
(nm) (nm) (cps)
Bark 430 672 620
Bract 430 672 291
Brown Leaf 430 672 640
Green Leaf 410 675 2,360
Hull 400 516 193
Seed 340 461 16
Seed Coat 330 415 86
Stem 430 671 424
Paper 360 412 3,940
Plastic Bag 370 417 34
Plastic Bale Packaging 360 434 8
Twine 300 356 482
Lint 360 434 16
botanical cotton foreign matter (bark, bract, brown leaf,green leaf, hull, stem) imaged under the blue LED excita-tion light and white light, lint in general (with the excep-tion of hull) has higher pixel intensity values in all threechannels. A similar pattern can be observed for cottonforeign matter imaged under the UV LED excitation lightand white light (seed coat, seed, twine), where lint is dom-inant in most color channels. Paper has higher signal inall three color channels in comparison to lint. Lint exhib-ited stronger blue and green fluorescence emission thanplastic bag and plastic packaging, respectively. However,when imaged under white light, lint has stronger red andgreen reflectance intensity than plastic bag, and strongerblue reflectance than plastic packaging.
DiscussionAccording to the spectroscopic analysis results, five out ofeight botanical foreignmatter categories exhibited red flu-orescence emission in the range from 671 nm to 675 nm.Fluorescence emission in the particular wavelength rangecan be attributed to the presence of chlorophyll, a greenpigment typically found in chloroplasts of green plants,and the leaf mesophyll cells [13]. In contrast, fluores-cent images of bark, bract, brown leaf, and stem exhibitedmainly green fluorescence. Specifically, we observed fluo-rescence primarily in the blue-green range, at λem = 461nm for seeds and λem = 415 nm for seed coat, and hull
Mustafic et al. Journal of Biological Engineering 2014, 8:29 Page 6 of 11http://www.jbioleng.org/content/8/1/29
Figure 3 A total of 13 types of cotton foreign matter and lintilluminated with blue LED and UV LED light. A) 6 types of cottonforeign matter illuminated with UV LED light. B) 7 types of cottonforeign matter illuminated with UV LED light. C) Lint illuminated withblue LED light. D) Lint illuminated with UV LED light.
emitted in the green emission range (λem = 516 nm).In some cases, such as brown leaf and stems, chloro-phyll fluorescence diminishes over time as the chloro-plasts degrade and the green fluorophores become moreprominent [14]. In other cases (i.e., bark, bract, stem), theabsence of chlorophyll emission is related to the absenceor low density of chloroplasts, making the green fluores-cence component prominently detectable. The source forthe blue-green fluorescence emission (400 nm to 560 nm)in foreign matter categories originating from the cottonplant can be traced back to the several UV-excitable fluo-rescing pigments, namely ferulic acid, cinnamic acid, andflavonoids [14]. Ferulic acid is derived from cinnamic acid,and both are found in cell walls, while flavonoid is found inplant vacuoles [15]. In contrast, research by Gamble et al.showed the strongest emission for hull, followed by bract,
leaf, and seed coat, and lowest for stem [8]. The afore-mentioned study used only single excitation wavelength atwhich the emission spectra of cotton foreign matter (withthe exception of hull and leaf ) overlapped significantly.Of the four non-botanical foreignmatter categories sub-
jected to fluoroscopic analysis, paper had the strongestemission signal in the blue range (λem = 412 nm). Thestrong signal can be attributed to the presence of fluo-rescent whitening agents used during chemical processingof wood pulp in order to alter its color. Twine is spunfrom fibers made from jute, a plant commonly used tomake rope and cloth for industrial use. Jute fibers emitfluorescence under excitation due to the pigments andlignin found in the cell walls [16]. Two other non-botanicalforeign matter categories, plastic bag and plastic balepackaging, exhibit fluorescence emission in the blue range(λem = 417 nm and 434 nm) due to the presence of col-oring pigments [17]. It should be noted all non-botanicalforeign matter categories achieved better optimum emis-sion under the UV LED light, and with the exception ofseed and seed coat, botanical foreign matter categoriescontaining chlorophyll achieved better optimum emissionunder the blue LED light. Since cotton foreign matter istypically found admixed with lint, it is necessary to con-sider its optimal blue emission band so foreign matter canbe segmented out.Since different types of foreign matter have varying flu-
orescence emission bands, it is advantageous to look atdifferent channels extracted from fluorescence images.Botanical cotton foreign matter possesses large amount ofchlorophyll, thus causing them to emit red fluorescence.However, the red fluorescence changes over time, as cot-ton plant parts age after they are harvested. The changeis typically not uniform, and depends on the cellularprocess following cell death which determine its degener-ation. In this instance, it could be beneficial to focus onthe green fluorescence emission caused by additional pig-ments found in cotton plant (ferulic and cinnamic acid,flavonoids) [14]. Botanical foreign matter categories (seedand seed coat), and non-botanical foreign matter cate-gories (twine, plastic bag, and plastic packaging) do notcontain a strong red fluorescence emission, but do con-tain other fluorescence emitting agents in the green andblue spectral region. The focus on red channel of the colorimages could be beneficial in foreign matter segmentationfrom lint, and potential classification between botanicaland non-botanical cotton foreign matter. Another sourceof potentially useful information would be to exploreother color models like HSV, in which the illuminationcomponent can be separated, and as a result, sourcesof illumination fluctuations minimized. Color measure-ments are less likely to change unlike geometric featureswhich change due to the fragility of foreign matter par-ticles being broken into smaller pieces [11]. In the same
Mustafic et al. Journal of Biological Engineering 2014, 8:29 Page 7 of 11http://www.jbioleng.org/content/8/1/29
Figure 4 Examples of histograms of cotton foreign matter and lint. Two categories of cotton foreign matter shown are green leaf and plasticbag, in addition to lint (for others see Additional files 1, 2 and 3).
study, a color imaging system capable of detecting andclassifying four categories of botanical foreign matter(bark, leaf, and seed coat) based on their color features wasdeveloped. In the current study focus was on exploringwhether fluorescence imaging can provide fluorescenceemission in the visible spectra which can potentially beused for classification of cotton foreign matter in futurestudies.A critical step in the detection of foreign matter in
images of lint is the segmentation of the image. Inthis study we used manual thresholding and super-vised application of morphological operators, becausethe main goal of this study is the determination of theadditional information gained by fluorescence imaging.Clearly, supervised segmentation is subject to intra- andinter-observer variability, and an unsupervised methodwould be desirable. In fact, the images contain a largeamount of information that can be used for the future
development of unsupervised segmentation methods.One useful assumption is spatial connectivity that allowsthe use of region-based methods. Second, with imagesobtained under different lighting conditions, multidimen-sional thresholding is possible. Third, the widely inhomo-geneous illumination advertises the application of furtherimage enhancement (specifically, homomorphic filtering)and the application of locally adaptive thresholding. Thedevelopment of unsupervised segmentation methods willbe subject of further study.Fluoroscopic analysis of samples necessitated the break-
down of samples with a strong solvent in order to dissolveit thoroughly. Therefore, the total amount of fluorophoresdetected with spectroscopy is much higher than theamount detected in images because fluorescence sig-nal in images is from surface images. Also, the signalsin botanical foreign matter can vary over time becausecellular degradation lowers the amount of fluorophores

Mustafic et al. Journal of Biological Engineering 2014, 8:29 Page 8 of 11http://www.jbioleng.org/content/8/1/29
Table 2 Average intensity of lint compared to cotton foreignmatter categories with respect to the individual colorchannels from images under blue LED, UV LED, and white light illumination
Category Blue LED UV LED White light
Bark, Bract, Lint has higher - Lint has higher red, green,Brown leaf, red and green - and blue reflectanceGreen leaf, fl. emission -Stem -
Hull Lint has higher - Lint has higher red, green,green fl. - and blue reflectanceemission -
Paper - Lint has lower red, green Lint has lower red, green- and blue fl. emission and blue reflectance
Plastic bag - Lint has higher green and Lint has higher red and- blue fl. emission green reflectance
Plastic bale - Lint has higher green and Lint has higher bluePackaging - blue fl. emission reflectance
Seed coat (Inner), - Lint has higher green and Lint has higher red, green,Seed coat (Outer), - blue fl. emission and blue reflectanceSeed, Twine -
gradually. In contrast smaller changes can be expected fornon-botanical foreignmatter like paper and plastic. In thisstudy, the fluorescence images were acquired one monthafter the spectroscopy experiment was done because theoptimal excitation and emission wavelengths must be firstidentified from the spectroscopy data before optical imag-ing system can be set up. This resulted in the differencebetween the spectroscopic and the imaging results.
ConclusionsExcitation in the UV and blue light spectral range induceda fluorescence emission signal for each individual foreignmatter categories under consideration. For some of thememission peaks overlapped, however their peak intensityvaried. Fluorescence spectroscopy results separate cottonforeign matter categories into two groups according to thetypes of optimal excitation light used to induced optimumfluorescence emission.
The blue LED light provided optimum excitation lightfor bark, brown leaf, bract, green leaf, hull, and stem, whilethe UV LED light provided optimum excitation light forpaper, plastic bag, plastic packaging, seed, seed coat, andtwine. An imaging apparatus containing blue and UV LEDexcitation sources was integrated to examine the feasibil-ity of using fluorescence imaging to detect cotton foreignmatter. The results showed that fluorescent imaging is apromising tool to detect cotton foreign matter on the sur-face of cotton lint. Future studies will focus on improvingthe image analysis process and to classify cotton foreignmatter categories.
MethodsSample preparationFor fluorescence spectroscopy analysis and fluorescenceimaging, two types of cotton foreign matter samples werecollected and analyzed: botanical and non-botanical for-eign matter (Figure 5). Botanical cotton foreign matter
Figure 5 Cotton foreign matter categories used in this study. Panels A (green leaf, stem, bark, hull) and B (bract, seed, seed coat (inner), seedcoat (outer), brown leaf) show botanical foreign matter categories, and Panel C (paper, plastic bag, twine, plastic bale packaging) showsnon-botanical foreign matter categories.

Mustafic et al. Journal of Biological Engineering 2014, 8:29 Page 9 of 11http://www.jbioleng.org/content/8/1/29
samples were collected from seed cotton of four cottoncultivars from the Fall 2012 harvest: Delta Pine 0912,Delta Pine 1050, PhytoGen 499, and FiberMax 1944. Indi-vidual botanical foreign matter categories (bark, bract,green leaf, brown leaf, stem, hull, seed, seed coat) wereextracted from seed cotton manually, and ground for 90swith an 8000MMixer/Mill (SPEX SamplePrep,Metuchen,NJ). At the time of analysis, it had been four months sincethe cotton samples were harvested from the field. Non-botanical foreign matter categories of paper, twine, andplastic bag were purchased from local stores, while plasticbale packaging was obtained from the cotton gin in Tifton,GA, and all were cut into smaller pieces (∼ 2×2mm) withscissors.
Fluorescence spectroscopyA total 0.05 g of individual cotton foreign matter cate-gories were extracted with 10 ml of DMSO for 2 hoursat room temperature. Extraction was followed by filter-ing (Whatman 42, 2.5 μm), 2:1 dilution with DMSO, andpipetting 3.5 ml of the solution into a glass cuvette (StarnaCells, Inc., Atascadero, CA), which was then placed intothe sample holder of a fluorospectrometer (Fluoromax 3,Horiba, Edison, NJ). Matrix scans were obtained in theexcitation range of 300–500 nm, emission range of 320–700 nm, with 0.5 s integration time, 2/2 slits, and figuresdrawn with OpenDX [18].
Fluorescent imaging apparatusThe fluorescent imaging apparatus (Figure 6) consisted ofan optical breadboard (Performance Series, 24′′ × 18′′ ×2.4′′ (L×W×T), Thorlabs Inc., Newton, NJ), two types ofexcitation sources used exclusive of each other: two blueLEDs, and a UV LED array. For reference purpose addi-tional white light source was also used.When LEDs (RoyalBlue Mounted High Power LEDs, nominal λ = 455 nm,1600 mA, Thorlabs Inc., Newton, NJ) were used as excita-tion sources, light intensity was controlled by two T-cubeLED drivers (1200 mA, Thorlabs Inc., Newton, NJ), andpower provided by two 15 V power supplies for T-cubes(Thorlabs Inc., Newton, NJ). A bandpass filter (CWL=450 nm, 40 nm bandpass, Thorlabs Inc., Newton, NJ) waspositioned in front of each blue LED to reduce the spec-tral bandwidth of the emission light. A 500 nm longpassfilter (cut-off λ = 500 nm, Thorlabs Inc., Newton, NJ) wasplaced in front of the SLR camera to avoid the spectraloverlap with the fluorescence excitation of samples underobservation.When the UV LED was used (λ = 370 nm,
Edmund Optics, Barrington, NJ), a 400 nm shortpass fil-ter (Edmund Optics, Barrington, NJ) was placed in frontof it, and a 400 nm longpass filter (cut-off λ = 400 nm,Thorlabs Inc., Newton, NJ) in front of the camera lensinstead of the 500 nm longpass filter used in combinationwith the blue LEDs. When the white light tungsten halo-gen source was utilized (JCD, GX6503A), the longpass
Figure 6 Side view of the fluorescent imaging apparatus. Excitation light was provided by two blue LEDs placed at a 60° angle with respect tothe camera post in order to homogeneously illuminate the sample under observation, and each equipped with an optical filter in front of it toprevent spectral overlap. An SLR camera with a 500 nm longpass filter was positioned above the sample. The entire apparatus was enclosed in alightproof enclosure. When other excitation sources were used (UV, white light), the blue LEDs and its bandpass filters were removed, and in thecase of UV LED a 400 nm shortpass filter positioned in front of the LED, and a 400 nm longpass filter in front of the SLR camera.
Mustafic et al. Journal of Biological Engineering 2014, 8:29 Page 10 of 11http://www.jbioleng.org/content/8/1/29
filter positioned in front of the camera was removed, sincethere was no need to reduce the spectral overlap. Imagesunder white light illumination were used for comparisonpurposes, while blue LED and UV LED light was used toprovide excitation light for fluorescent images.Cotton samples were centrally positioned on the opti-
cal breadboard while the LEDs were mounted on postsadjacent to the sample in order to provide a homogeneousexcitation light to the samples under observation. A digitalSLR camera (D40, Nikon Inc., Melville, NY) was mountedon a camera stand (Nikon Inc., Melville, NY) verticallyabove the sample and black cardboard with a hole inthe center attached to it block the background fluores-cence. The entire fluorescent imaging setup was enclosedand covered with black non-fluorescent cloth to excludeambient light.Images were acquired with an f/5.6 aperture and expo-
sure time of 6 s (under blue LED excitation), 1.6 s (underUV light excitation), 1/15 s (under white light illumina-tion), while camera sensitivity was kept at ISO 400. Threedifferent exposure times were used for different types ofillumination in order to prevent image saturation. RawNEF (Nikon Electronic Format) images were converted to16 bit TIFF images with UFRaw ( http://ufraw.sourceforge.net). Images were denoised and binned (4×4) to 759×503pixels with Crystal Image, a quantitative image analysissoftware [18]. Further denoising was performed by addi-tional applications of a median and a generalized Gaussianfilter.To compare the red, green, and blue intensities of
images taken under the blue LED, UV LED, andwhite lightillumination, five replicates of each type of foreign mat-ter was imaged once under each source of illumination.A fixed, but image-dependent, threshold was used to sep-arate the brightly fluorescent lint from the more weakly-fluorescent foreign-matter regions. This step resulted ina binary mask that contained binary zeros correspond-ing to lint pixels and binary ones corresponding to foreignmater pixels. In some cases, morphological operations(morphological opening, cluster labeling with a clustersize filter) were applied to the binary mask. The clusters ofbinary ones effectively acted as regions of interest (ROI)for the foreign matter, thereby effectively separating for-eign matter from the lint. The average intensity in theforeign-matter regions was then calculated and comparedto the average intensity of the lint layer.
Additional files
Additional file 1: Figure S1. Histograms of 13 types of cotton foreignmatter and lint imaged under white light.
Additional file 2: Figure S2. Histograms of 7 types of cotton foreignmatter and lint imaged under UV LED light.
Additional file 3: Figure S3. Histograms of 6 types of cotton foreignmatter and lint imaged under blue LED light.
Competing interestsThe authors declare that they have no competing interests.
Authors’ contributionsAM performed analysis of spectroscopic and fluorescent imaging data, andcontributed to writing. CL contributed to experimental design and writing.MH contributed to analysis of spectroscopic data. All authors read andapproved the final manuscript.
AcknowledgementsThe work was supported by the funding from the Georgia Cotton Commissionand the Cotton Incorporated. The authors gratefully acknowledge AndyKnowlton (Research Engineer/Gin Manager) at the UGA Cotton Micro Gin inTifton, GA, for kindly providing us with cotton lint and cotton foreign mattersamples.
Author details1College of Engineering, University of Georgia, 712F Boyd Graduate Researchand Studies Center, 30602 Athens, GA, USA. 2College of Engineering,University of Georgia, Driftmier Engineering Center, 30602 Athens, GA, USA.
Received: 11 July 2014 Accepted: 15 October 2014Published: 1 December 2014
References1. Wakelyn PJ, Bertoniere NR, French AD, Thibodeaux DP, Triplett BA,
Rousselle M-A, Goynes WRJr, Edwards JV, Hunter L, McAlister DD, GambleGR: Cotton Fiber Chemistry and Technology. Boca Raton: CRC Press; 2010.
2. Fortier C, Rodgers J, Foulk J: Investigation of the impact ofinstrumental and software applications on cotton and botanicaltrash identification by ultraviolet-visible and near-infraredspectroscopy. J Cotton Sci 2011, 15:170–178.
3. Lieberman MA, Bragg CK, Brennan SN: Determining gravimetric barkcontent in cotton with machine vision. Textil Res J 1998, 68(2):94–104.
4. Himmelsbach DS, Hellgeth JW, McAlister DD: Development and use ofan attenuated total reflectance/fourier transform infrared(ATR/FT-IR) spectral database to identify foreign matter in cotton.J Agric Food Chem 2006, 54(20):7405–7412.
5. Fortier CA, Rodgers JE, Cintron MS, Cui X, Foulk JA: Identification ofcotton and cotton trash components by fourier transformnear-infrared spectroscopy. Textil Res J 2011, 81(3):230–238.
6. Fortier C, Rodgers J, Foulk J, Whitelock D: Near-infrared classification ofcotton lint, botanical and field trash. J Cotton Sci 2012, 16(1):72–79.
7. Liu Y, Foulk J: Potential of visible and near infrared spectroscopy inthe determination of instrumental leaf grade in lint cottons. TextilRes J 2013, 83(9):928–936.
8. Gamble GR, Foulk JA: Quantitative analysis of cotton (gossypiumhirsutum) lint trash by fluorescence spectroscopy. J Agric Food Chem2007, 55(13):4940–4943.
9. Xu B, Fang C, Huang R, Watson MD: Chromatic image analysis forcotton trash and colormeasurements. Textil Res J 1997, 67(12):881–890.
10. Xu B, Fang C, Huang R, Watson M: Cotton color measurements by animaging colorimeter. Textil Res J 1998, 68(5):351–358.
11. Xu B, Fang C, Watson M: Clustering analysis for cotton trashclassification. Textil Res J 1999, 69(9):656–662.
12. Zhou F, Ding T: Detection of cotton lint trash within theultraviolet–visible spectral range. Appl Spectrosc 2010, 64(8):936–941.
13. DeEll JR, van Kooten O, Prange RK, Murr DP: Applications of chlorophyllfluorescence techniques in postharvest physiology. Hort Rev 1999,23:69–107.
14. Buschmann C, Lichtenthaler HK: Principles and characteristics ofmulti-colour fluorescence imaging of plants. J Plant Physiol 1998,152(2):297–314.
15. Daniel M, Purkayastha R: Handbook of Phytoalexin Metabolism and Action,Vol. 37. New York: CRC Press; 1995.

Mustafic et al. Journal of Biological Engineering 2014, 8:29 Page 11 of 11http://www.jbioleng.org/content/8/1/29
16. Khan F, Ahmad S: Chemical modification and spectroscopic analysisof jute fibre. Polymer Degrad Stabil 1996, 52(3):335–340.
17. Espi E, Salmeron A, Fontecha A, García Y, Real A: Plastic films foragricultural applications. J Plastic Film Sheeting 2006, 22(2):85–102.
18. Haidekker M: Advanced Biomedical Image Analysis. Hoboken: John Wiley &Sons; 2011.
doi:10.1186/1754-1611-8-29Cite this article as:Mustafic et al.: Blue and UV LED-induced fluorescencein cotton foreign matter. Journal of Biological Engineering 2014 8:29.
Submit your next manuscript to BioMed Centraland take full advantage of:
• Convenient online submission
• Thorough peer review
• No space constraints or color figure charges
• Immediate publication on acceptance
• Inclusion in PubMed, CAS, Scopus and Google Scholar
• Research which is freely available for redistribution
Submit your manuscript at www.biomedcentral.com/submit