research open access human bdh2, an anti-apoptosis factor
TRANSCRIPT

Yang et al. Journal of Biomedical Science 2013, 20:58http://www.jbiomedsci.com/content/20/1/58
RESEARCH Open Access
Human BDH2, an anti-apoptosis factor, is a novelpoor prognostic factor for de novo cytogeneticallynormal acute myeloid leukemiaWen-Chi Yang1,2, Wan-Chi Tsai3, Pai-Mei Lin4, Ming-Yu Yang5, Yi-Chang Liu1,6, Chao-Sung Chang1,Wen-Hui Yu1 and Sheng-Fung Lin1,6*
Abstract
Background: The relevance of recurrent molecular abnormalities in cytogenetically normal (CN) acute myeloidleukemia (AML) was recently acknowledged by the inclusion of molecular markers such as NPM1, FLT3, and CEBPA as acomplement to cytogenetic information within both the World Health Organization and the European Leukemia Netclassifications. Mitochondrial metabolism is different in cancer and normal cells. A novel cytosolic type 2-hydroxybutyratedehydrogenase, BDH2, originally named DHRS6, plays a physiological role in the cytosolic utilization of ketone bodies,which can subsequently enter mitochondria and the tricarboxylic acid cycle. Moreover, BDH2 catalyzes the production of2, 3-DHBA during enterobactin biosynthesis and participates in 24p3 (LCN2)-mediated iron transport and apoptosis.
Results: We observed that BDH2 expression is an independent poor prognostic factor for CN-AML, with an anti-apoptoticrole. Patients with high BDH2 expression have relatively shorter overall survival (P = 0.007) and a low complete responserate (P = 0.032). BDH2-knockdown (BDH2-KD) in THP1 and HL60 cells increased the apoptosis rate under reactive oxygenspecies stimulation. Decrease inducible survivin, a member of the inhibitors of apoptosis family, but not members of theBcl-2 family, induced apoptosis via a caspase-3-independent pathway upon BDH2-KD.
Conclusions: BDH2 is a novel independent poor prognostic marker for CN-AML, with the role of anti-apoptosis, throughsurviving.
Keywords: BDH2, Survivin, Cytogenetically normal acute myeloid leukemia, Prognosis, Survival, Apoptosis
BackgroundWhile morphological evaluation of bone marrow (BM)and blood remains a cornerstone for the diagnosis of acutemyeloid leukemia (AML), the presence or absence of spe-cific cytogenetic and molecular abnormalities is useful notonly for determining overall prognosis but also forguiding treatment. Clonal chromosomal aberrationsare not detected in 40–50% of patients [1]. Both theWorld Health Organization and the European LeukemiaNet classifications have included molecular markers such
* Correspondence: [email protected] of Hematology and Oncology, Department of Internal Medicine,Kaohsiung Medical University Hospital, No. 100 Tzyou 1st Road, 807Kaohsiung, Taiwan6Faculty of Medicine, College of Medicine, Kaohsiung Medical University, No.100 Tzyou 1st Road, 807 Kaohsiung, TaiwanFull list of author information is available at the end of the article
© 2013 Yang et al.; licensee BioMed Central LtCommons Attribution License (http://creativecreproduction in any medium, provided the or
normal-acute myeloid leukemia (CN-AML) reinforcingtheir importance in cytogenetics [2,3]. Other mutatedgenes (e.g., WT1, IDH1/IDH2, TET2, RUNX1, and MLL)or aberrantly expressed ones (e.g., BAALC, ERG, EVI1,and miR-181a) will likely become useful in refining mo-lecular risk in CN-AML [4-16]. Mithat Gönen et al.reported a panel of genetic profile that related to progno-sis of AML [17].In 1926, Otto Warburg initiated research on mito-
chondrial alterations in cancer and proposed a mechan-ism to explain the differences in energy metabolismbetween normal and cancer cells, suggesting that mito-chondrial alterations could provide unique therapeutictargets in various cancer types [18]. Understanding theexisting cross-talk between cellular metabolism andgrowth control has resulted in a better understanding ofnormal and disease processes and has facilitated the
d. This is an Open Access article distributed under the terms of the Creativeommons.org/licenses/by/2.0), which permits unrestricted use, distribution, andiginal work is properly cited.

Yang et al. Journal of Biomedical Science 2013, 20:58 Page 2 of 15http://www.jbiomedsci.com/content/20/1/58
discovery of new treatment modalities in oncology, forexample, trastuzumab and imatinib [19,20].Guo et al. identified BDH2 as a short-chain dehydrogen-
ase/reductase family member, originally named as DHRS6[21] BDH2 is a novel cytosolic-type 2-hydroxybutyrate de-hydrogenase and has a physiological role in the utilizationof cytosolic ketone bodies, which can subsequently entermitochondria and the tricarboxylic acid cycle [21]. Re-cently, Devireddy et al. reported that BDH2 catalyzes theproduction of 2,3-DHBA during enterobactin biosynthesisand participates in 24p3 (LCN2)-mediated iron transportand apoptosis [22]. We reported that LCN2 expression isassociated with prognosis in CN-AML previously [23].While BDH2 is a gene related to mitochondria metabol-ism and participates in LCN2 mediated iron transport andapoptosis, we have interest to know if BDH2 has prognos-tic impact on CN-AML.Here, we analyzed the relationship between BDH2, an
enzyme related to the lipid metabolic pathway and irontransport, and CN-AML. We assessed whether BDH2 isa prognostic factor for patient survival. Additionally, weinvestigated the mechanism underlying the prognosticability of BDH2 by using RNA interference-mediatedknockdown of BDH2 (BDH2-KD) in cell lines.
MethodsEthics statementThis research was approved by Kaohsiung-MedicalUniversity Chung-Ho Memorial Hospital institutional re-view boards and ethics committees. All human partici-pants provided written informed consent.
PatientsWe enrolled 130 patients newly diagnosed with CN-AML from August 2001 to February 2012, in a singlemedical center for retrospective analysis. Only 113 pa-tients (including 49 female and 64 male patients) couldbe analyzed because of poor RNA quality in theremaining 17 samples. The average patient age was 54.5years (age range, 22–86 years), with 47 patients morethan 60 y/o. We also collected 43 normal BM samples,defined by normal BM findings in both BM aspirationsmears and biopsy pathology reports and with no cyto-genetic abnormalities, as a control group. Most patientswere lymphoma without BM involvement. Moreover, werandom collected bone marrow samples with goodRNA quality from 10 newly diagnosed AML patientswith AML-ETO fusion gene (translocation the AML1[CBFA2, RUNX1] gene in the 21q22 region is fused tothe ETO [MTG8 , RUNX1T] gene in the 8q22 region),3 patients with cytogenetic finding of inv (16), as agood risk group, and 25 patients with multiple chro-mosomes abnormalities (more than 3 abnormalities) asa poor prognostic group from the samples in the past
10 years. Patients with chromosome 8 abnormality wasexcluded to avoid contaminated by myelodysplasiasyndrome transformed AML.Eighty-six CN-AML patients received conventional in-
tensive induction chemotherapy consisting of 7 days ofcytarabine at 200 mg·m−2·day−1 and 3 days of daunorubi-cin at 45 mg·m−2·day−1 (I3A7). Patients who failed toachieve complete remission (CR) but attained partial re-mission received the second induction chemotherapywith 70% doses of I3A7 under nadir status (between 7and 10 days after first intensive chemotherapy). Patientsachieving CR received consolidation chemotherapy withhigh dose AraC (cytarabine at 1 to 2 g·m−2·day−1 on day1, 3 and 5). Based on the findings of these patients, weanalyzed clinical outcomes, including overall survival(OS) and leukemia-free survival (LFS). Patients withoutCR after 2 rounds of intensive chemotherapy with goodperformance status (Eastern Cooperative Oncology Group,ECOG 0 or 1) and those with CR with a poor prognosticfactor, including patients with delayed CR and FLT3 in-ternal tandem duplication (FLT3-ITD) mutation detectedafter 2011, received hematopoietic stem cell transplant-ation (HSCT).
Clinical end pointsCR was defined as recovery of morphologically normalBM and blood counts (i.e., neutrophil count ≥ 1.5 × 10⁹/L and platelet count ≥ 100 × 109/L) and no circulatingleukemic blasts or evidence of extramedullary leukemia.Relapse was defined by ≥5% BM blasts, circulating leukemicblasts, or development of extramedullary leukemia. OS wasmeasured from the date of initial diagnosis until the date ofdeath, censoring for patients alive at the last follow-up. LFSwas measured from the date of CR until the date of relapseor death, regardless of the cause of death, censoring for pa-tients alive at the last follow-up. Relapse-free survival (RFS)was measured from the date of diagnosis until the date ofrelapse or death.Quantitative real-time reverse transcriptase-polymerase
chain reaction (qRT-PCR) for mRNA expression analysisof BDH2, LCN2, Meningionma1 (MN1), ETS-related gene(ERG), micro-RNA-181a (miR-181a), and micro-RNA-3151 (miR-3151).BM samples were collected at first diagnosis, and total
RNA was extracted using the Trizol method (Invitrogen,Carlsbad, CA, USA). Furthermore, the same method wasused to extract total RNA for RNA interference-mediatedBDH2-KD in THP1 and HL60 cell lines. The RNA input(2 μg) for cDNA synthesis was determined by OD260
measurement, and cDNA was reverse transcribed using aTaqMan® High Capacity Reverse Transcription Kit(Applied Biosystems, Carlsbad, CA, USA) according tothe manufacturer’s protocols. The cDNA sequences ofBDH2 and LCN2 were evaluated, and the specific

Yang et al. Journal of Biomedical Science 2013, 20:58 Page 3 of 15http://www.jbiomedsci.com/content/20/1/58
forward and reverse primers and TaqMan® probe weredesigned using Primer Express software version 1.5(Applied Biosystems). The TaqMan® MGB probe designedby the software was synthesized and labeled with FAMfluorescent dye (Applied Biosystems). The mRNA expres-sion levels of BDH2 and LCN2 were analyzed by qRT-PCR with the following primer sets and probes. BDH2:forward primer 5′-TTC CAG CGT CAA AGG AGTTGT-3′, reverse primer 5′-TTC CTG GGC ACA CACAGT TG-3′, TaqMan® MGB probe 5′-ACA GAT GTGTGT GTA CAG CAC-3′ and LCN2: forward primer 5′-GGT ATG TGG TAG GCC TGG CA-3′, reverse primer5′-AAC AGG ACG GAG GTG ACA TTG T-3′, TaqMan®MGB probe 5′-ACC CGC AAA AGA TGT A-3′. Expres-sion of human β-actin was used to normalize BDH2,LCN2, ERG and MN1gene expression in qRT-PCR.Expression of human U6 snRNA was used to normalizedmiRNA181a and miRNA3151 gene expression in qRT-PCR. This TaqMan® endogenous control and primers andTaqMan® probes of ERG1, MN1, miRNA-181a andmiRNA-3151 were purchased from Applied Biosystems. Allreactions were carried out in a 25-μL final volumecontaining 200 ng of cDNA (as total input RNA), 400 nMof each primer, 200 nM of probe, and 12.5 μL of 2XTaqMan® Universal PCR Master Mix (Applied Biosystems).For miRNA detection, RT reactions were performedwith
10 ng of total RNA, 50 nM stem–loop microRNA-specificRT primers, 1× RT buffer, 0.25 mM of dNTPs, 3.33 U/μlMultiScribe RTase and 0.25 U/μl RNase inhibitor. Thereaction mixture was incubated for 30 min at 16°C and 30min at 42°C, followed by 5 min incubation at 85°C toinactivate the RTase enzyme. RT products were subjectedto microRNA expression assay for real-time quantitativePCR in a 20-μl final volume containing 2 μl of RTproduct, 1 μl of 20× TaqMan® micro-RNA Assay (AppliedBiosystems), and 10 μl of 2× TaqMan® Universal PCRMaster Mix (Applied Biosystems).qRT-PCR was performed in an ABI Villi 7 Sequence
Detector (Applied Biosystems), and the PCR cyclingparameters were set as follows: 95°C for 10 min followedby 40 cycles of PCR reactions at 95°C for 20 secondsand 60°C for 1 min. The expression levels of the BDH2and LCN2 genes were normalized to the internal controlβ-actin to obtain the relative threshold cycle (ΔCT). Therelative expression between CN-AML and controls wascalculated by the comparative CT (ΔΔCT) method. TheCT values of β-actin were controlled between 18 and 22.
Mutation analysis of NPM1, FLT3, CEBPA, mixed lineageleukemia gene (MLL), IDH1/2 and DNMT3ABM samples that were collected at diagnosis were retro-spectively analyzed for gene mutations. Genomic DNA wasextracted from mononuclear cell preparations using anIllustra™ blood genomicPrep Mini Spin Kit (GE Healthcare
UK Limited, UK). The additional molecular markers associ-ated with AML with normal karyotype, i.e., FLT3-ITD,FLT3 tyrosine kinase domain (FLT3-TKD) mutation,NPM1 mutation, CEBPA mutation, isocitrate dehydro-genase 1/2 (IDH1/2), DNA (cytosine-5)-methyltransferase3A (DNMT3A) and mixed lineage leukemia gene (MLL)were screened as previously described [17,24-27].PCR products were analyzed by agarose gel electro-
phoresis and purified using a QIAquick PCR-purificationkit (Qiagen, Chatsworth, CA, USA). Purified PCR productswere directly sequenced with the forward or reverseprimers of each gene using an ABI BigDye TerminatorCycle Sequencing Kit (Applied Biosystems) in an ABI Prism310 DNA sequencer (Applied Biosystems).
Cell cultureThe THP1 cell line, an acute myelomonocytic leukemiacell line, was cultured in RPMI medium (GIBCO, LifeTechnologies, Hong Kong) supplemented with 10% fetalbovine serum (FBS) (GIBCO), 1% penicillin/strepto-mycin (P/S), 4.5 g/L glucose, 10 mM HEPES (4-(2-hydroxyethyl)-1-piperazineethane-sulfonic acid), 1 mMsodium pyruvate, and 1% beta-mercaptoethanol. ForTHP1 cells infected with shRNA empty vector andshRNA-BDH2 lentivirus, 1 μg/mL puromycin (Sigma-Aldrich, USA) was added as a stress selector.HL60 cells, an acute promyelocytic leukemia cell line
with t(15;17), were cultured in IMDM medium (GIBCO)supplemented with 1.5 g/L sodium bicarbonate, 20%FBS, and 1% P/S. Puromycin (1 μg/mL) was added toselect cells with RNA interference-mediated BDH2-KD.All cells were cultured at 37°C in a humidified atmos-
phere containing 5% CO2. All native cell lines werepurchased from Food Industry Research and Develop-ment Institute, Taiwan.
RNA interference-mediated BDH2-KD in THP1 and HL60 cellsThe shRNA-BDH2 lentivirus particle was purchasedfrom Sigma. The clones TRCN0000036735, 0000036736,0000036738, and 00000244979 were identified as shRNA-BDH2-1, shRNA-BDH2-2, shRNA-BDH2-3, and shRNA-BDH2-4, respectively. Naive THP1 and HL60 cells weretransduced with lentiviruses expressing shRNAs andselected for puromycin resistance (1 μg/mL). The knock-down efficiency was assessed by qRT-PCR and westernblot analyses.
Statistical analysisWe used software SPSS 17.0 for statistical analysis.ANOVA was used to compare the differences in BDH2mRNA expression and LCN2 mRNA expression betweenpatients with CN-AML, AML-ETO (+) under molecularstudies, inv (16) under cytogenetic study and those withnormal BM. Correlation regression was used for analysis

Figure 1 mRNA expression levels of BDH2 in bone marrow.BDH2mRNA expression levels in bone marrow from patients withnormal bone marrow and cytogenetically normal AML (CN-AML).P<0.001. Higher ΔCT-BDH2 means lower mRNA expression levels. BM:bone marrow. Sample number of bone marrows from normal bonemarrow and CN-AML are 43 and 113.
Yang et al. Journal of Biomedical Science 2013, 20:58 Page 4 of 15http://www.jbiomedsci.com/content/20/1/58
if there was a correlation between BDH2 and LCN2 ex-pression. We used the receiver operating characteristic(ROC) curve to estimate the cutoff point for BDH2 topredict death in CN-AML patients.Time-to-event analysis involved estimating the prob-
ability that an event would occur at different timepoints. The end-point of follow-up for patients who de-veloped AML was the date of death and for those whowere lost to follow-up was the date of the last visit, toarrive at “censored” data. Two-sample t-tests and X2
square tests were used to analyze the differences in age,sex, peripheral white blood cells (WBCs), hemoglobin(Hb), platelet and blast counts, CD34 and blasts percent-age in BM, percentage of FLT3-ITD, FLT3-TKD, NPM1mutations, CEBPA mutation, IDH1/2, DNMT3A andMLL mutations in the BDH2 low and high expressiongroups (BDH2low and BDH2high, respectively) and youn-ger and older patients group (separate at 60 year-old).ANOVA were used to analyze ERG, NM1, miR-181a andmiR-3151 in different groups of BDH2 expression andage. We divided low and high expression of BDH2 usingthe median BDH2 expression level (ΔCT-BDH2 = 9.0060),which was similar to the cutoff point from the ROCcurve prediction (ΔCT-BDH2 = 9.0113). The Kaplan–Meier estimates were computed for the risk among dif-ferent categories, were compared by Log-rank tests. Theanalysis was performed to estimate the differences in OSamong patients with different BDH levels, and FLT3-ITD mutation as well as the differences in LFS and RFSbetween BDH2high and BDH2low groups.Two sets of hazard rate ratios (HRR) were computed
for analysis factors by cox regression analyses. The uni-variate HRRs were estimated from separate Cox regres-sions with one analysis factor at a time. The factorsincluded all molecular analyses and other parameters.The multivariable-adjusted HRRs were computed fromCox regression with additional variables of the factorsthat were identified as being statistically significant inthe univariate analysis.
Apoptosis assay and flow cytometryWe treated THP1 and HL60 cells lines, including shRNA-BDH2 infected, shRNA empty vector infected, and paren-tal cells, with 50 μM H2O2 for 30 min and with 15 μMH2O2 for 30 min, respectively. Then apoptosis was exam-ined using the ApoScreen™ Annexin V-FITC ApoptosisKit (Beckman Coulter, CA, USA). Meanwhile, caspase-3was also analyzed by flow cytometry in cells treated withH2O2 using FITC rabbit anti-active caspase-3 (BDPharmingen, CA, USA).
Western blot analysisCells were treated with 15 and 50 μM H2O2 for 2 h andwere then lysed in cold lysis buffer supplemented with
protease inhibitor cocktails (BioExpress, UT, USA, addedat a 1:100 dilution). Cell lysates were separated by SDS-PAGE and transferred to a polyvinylidene fluoride mem-brane (PerkinElmer, Taiwan). Blots were probed withprimary antibodies specific for the following proteins:PARP, caspase-3, survivin (Cell Signaling Technology,MA, USA), Bcl-xL, Bax, XIAP (Santa Cruz Biotechnology,Texas, USA), BDH (Sigma), and β-actin (MilliporeCorporation, MA, USA). After incubation with theantibody, the proteins were detected with enhancedchemiluminescence (ECL, PerkinElmer).
JC-1 mitochondrial membrane potential detectionThe mitochondrial membrane potential was analyzedusing a MitoProbe™ JC-1 Assay Kit (Life technologies,CA, USA). The collapse of the electrochemical gradientacross the mitochondrial membrane was measured using afluorescent cationic dye, JC-1. This dye exhibits potential-dependent accumulation in the mitochondrial matrix. Fur-ther, 1 × 10⁶ cells were incubated with 2 mM JC-1 at 37°Cand 5% CO2 for 30 min. Cells were washed twice with PBSat 4°C, resuspended in 1 mL PBS, and assessed by aBeckman Coulter Epics XL.
ResultsAssociation of BDH2 expression with molecular markersand clinical characteristicsThe mRNA expression of BDH2 was higher in patientswith CN-AML and poor risk than in those with normalBM (P < 0.001, Figure 1 and Additional file 1: FigureS1). The mRNA expression of LCN2 was lower in

Yang et al. Journal of Biomedical Science 2013, 20:58 Page 5 of 15http://www.jbiomedsci.com/content/20/1/58
patients with CN-AML, inv (16) and poor risk groupthat we already reported [23]. However, we did not seedifference of BDH2 mRNA expression between good riskgroups and normal bone marrow or CN-AML patients.There was no correlation between BDH2 and LCN2 ex-pression (Additional file 2: Figure S2).We focused on CN-AML patients and used the me-
dian BDH2 mRNA expression level, ΔCT-BDH2 = 9.0060,as the cutoff point. This value is the same as the cutoffpoint predicted by the ROC curve. Among the 113 pa-tients newly diagnosed with CN-AML, no differenceswere observed between BDH2high and BDH2low groupswith regard to clinical features or biological characteris-tics such as age, sex, WBCs, Hb, platelets, blasts in per-ipheral blood, blasts in BM, amount of CD34 expressionin BM myeloblasts, and French-American-British (FAB)classification subtypes (Table 1). Moreover, no differ-ences were observed with regard to these clinical fea-tures between the 2 groups, among the 86 patients withCN-AML with intensive induction chemotherapy (datanot shown).The incidences of common genetic alterations in the
BDH2high and BDH2low groups are shown in Table 2. Onthe whole cohort analysis, our patients showed similarincidences of FLT3-ITD and FLT3-TKD mutations whencompared with data from Taiwan National University[28]; however, the incidences of NPM1, MLL and CEBPAmutations were higher and the incidence of IDH1 muta-tion was lower. FLT3-ITD showed a higher mutationrate in the BDH2high group (P = 0.030, Table 2) andDNMT3A showed a higher mutation rate in the BDH2low
group (P = 0.009, Table 2). We did not observe differencesin NPM1, FLT3-TD, CEBPA, and IDH1/2 mutations be-tween the 2 groups (Table 2).
Gene alternations frequencies between younger andelder patientsAs shown in Table 3, the frequency of FLT3-TKD muta-tion is higher in patients more than 60 years-old. Andthe CEBPA double mutation rate is higher in youngerpatients group. There are no different of NPM1, FLT3-ITD, IDH1/2, DNMT3A and MLL gene mutations, andno difference in BDH2, ERG, MN1, miR-181a andmiR-3151 expression levels, between different agegroup.
BDH2 expression as a prognostic markerWe analyzed 86 patients who received a standard inten-sive chemotherapy. In response rate analysis, patients inthe BDH2high group showed a lower complete responserate (60%) than those in the BDH2low group (80.42%).However, no difference was observed between the 2groups with respect to the time required to reach acomplete response (Table 1). We also analyzed complete
response (CR) rate based on genetic alterations and no-ticed that patients with DNMT3A mutations had signifi-cant higher CR rate than patients without DNMT3Amutation (P = 0.012). We did not find significant differ-ence in CR rate between FLT3-ITD, NPM1, CEBPA andIDH1/2 mutations (data not shown). Results of the sur-vival analysis showed that patients in the BDH2high
group had a lower overall survival (OS) with a mediumsurvival of 9 months than those in the BDH2low groupwith a median survival of 53.667 months (P = 0.007,Figure 2A). However, we did not note any difference inthe LFS rates between the BDH2high and BDH2low
groups, with median survivals of 12.033 months and13.2 months, respectively (P = 0.730, Figure 2B).In univariate analysis of the impact factors on OS, old
age, high BDH2 expression, and FLT3-ITD mutation ad-versely affected OS with statistical significance (P = 0.001,0.007, and < 0.001, respectively; Table 4). NPM1, FLT2-TKD, CEBPA, IDH1/2, DNMT3A and MLL mutations didnot show impact on OS. Multivariate analysis showed thatFLT3-ITD, FLT3-TKD and MN1 mutations adversely af-fected RFS. While NPM1 mutation showed positive im-pact on RFS. High BDH2 expression had a mild adverseeffect on RFS without statistical significance. However, asignificant, independent adverse impact of high BDH2 ex-pression, FLT3-ITD mutation, MN1 mutation, and old agewere observed in the OS multivariate analysis (Table 5). Inpatients with 60 year-old or younger, FLT3-ITD, FLT3-TKD, MN1 mutations, and ERG and BDH2 higher expres-sion level showed adverse impact on survival. In elderpatients, we saw ERG and BDH2 higher expressionlevel had poor survival (Table 6). No patients in elderlygroup had DNMT3A mutation.By combining two independent prognostic factors,
BDH2 expression and FLT3-ITD mutation, we foundthat patients with BDH2lowFLT3-ITD-wild type had thehighest OS, with a median survival surpassing 10 years.On the other hand, patients with BDH2highFLT3-ITD-mutation had the worst overall survival, with a mediansurvival of 3.833 months. We observed significant dif-ferences in the overall survival between the BDH2 ex-pression groups with and without the FLT3-ITDmutation (median survival: BDH2lowFLT3-ITD-wildtype vs. BDH2highFLT3-ITD-wild type vs. BDH2lowFLT3-ITD-mutation vs. BDH2highFLT3-ITD-mutation = notreached vs. 18.567 months vs. 6.2 months vs. 3.833months, P < 0.001, Figure 2C and 2D).We analyzed 22 patients who received allogeneic
hematopoietic stem cell transplantation, including 14 pa-tients in the BDH2 lower expression group and 8 in theBDH2 higher expression group. Though there was nostatistically significant difference, we saw a trend of lon-ger survival from hematopoietic stem cell infusion in theBDH2low group (P = 0.520, Additional file 3: Figure S3).

Table 1 Comparison of clinical manifestations between patients with AML in low and high BDH2 expression groupsa
Variables Total(n = 113)
Low BDH2, expression,(n = 57)
High BDH2, expression,(n = 56)
P
Sexb 113 57 56 0.467
Male 64 23 26
Female 49 34 30
Age (years)c 54.5 (21–86) 48 (22–86) 57 (21–85) 0.193
Laboratory datac
WBC, ìL−1 30,830 37,615 24,370 (600–243,290) 0.452
(300–296,300) (300–216,820)
Hb, g/dL 8.3 8.3 8.4 0.365
(4.2–15.6) (4.4–14.3) (4.2–15.6)
Platelet, ×1,000/ìL 42 44.5 41 0.582
(3–369) (4–175) (3–369)
Blast, ìL−1 20,188.5 13,074.15 26,001 0.172
(0–287,411) (126–145,572.7) (0–287,411)
Blast in BM, % 74.8% (24.8%–97.4%) 70.8% (24.8%–94.7%) 79% (27.2%–94.4%) 0.424
CD34 (+) in BM, % 31.1% 29.5% 33.25% (0%–99.5%) 0.272
(0%–99.9%) (0%–99.9%)
FABb
M0 3 1 (1.75%) 2 (2.44%) 0.057
M1 28 8 (13.89%) 20 (43.90%)
M2 47 25 (47.23%) 22 (34.15%)
M3 0 0 (0%) 0 (0%)
M4 23 15 (23.61%) 9 (14.63%)
M5 7 6 (9.72%) 1 (0%)
M6 0 0 (0%) 0 (0%)
M7 4 2 (2.78%) 2 (4.88%)
Undetermined 0 0 (0%) 0 (0%)
Induction responsebd
CR 61 (70.93%) 37 (80.42%)f 24 (60%)g 0.032*
PR and Refractory 32 20
Induction death 1 0
Reach CR timee
38 ± 38.0 40.5 ± 44.3 36 ± 29.7 0.526aThe median value of BDH2 expression in the total population was used as the cutoff level of 9.006 to define low- and high-expression groups.bNumber of patients (%).cMedian (range).dOnly the 86 patients who received conventional intensive induction chemotherapy, and then consolidation chemotherapy if CR was achieved, were included inthe analyses.ePatients received conventional intensive induction chemotherapy and achieved CR, median, days ± S.D.fOnly 46 patients received I3A7.gOnly 40 patients received I3A7 (Idarubicin and Ara-C).*Statistically significant (P < 0.05).
Yang et al. Journal of Biomedical Science 2013, 20:58 Page 6 of 15http://www.jbiomedsci.com/content/20/1/58
Survivin reduction was responsible for inducing apoptosisin BDH2-KD cells under hyperoxidative stress via acaspase-3-independent pathwayReactive oxygen species (ROS) can induce apoptosis [29].Devireddy et al. showed that the apoptosis rate increased
in BDH2-KD FL5.12 cells upon H2O2 treatment [22]. Theimpact of BDH2 was evaluated by using RNA interference-mediated BDH2-KD in THP1 and HL60 leukemia celllines. The efficacy of BDH2-KD was confirmed at bothRNA (Figure 3A and 3B) and protein levels (Figure 4B).

Table 2 Comparison of other genetic alterations between AML patients in low and high BDH2 expression groups
Variant Number of patients with the gene alternation (percentage) P
Whole cohort Low BDH2, expression High BDH2, expression
NPM1mut 36 (31.85%) 16 (28.07%) 20 (35.71%) 0.271
FLT3-ITD 23 (20.35%) 7 (12.28%) 16 (28.57%) 0.030*
FLT3-TKD 8 (7.08%) 5 (8.77%) 3 (5.36%) 0.338
NPM1mut/FLT3-ITDneg 20 (17.70%) 11(19.30%) 9 (16.07%) 0.368
CEBPAa 34 (30.09%) 16 (28.07%) 18 (32.14%) 0.444
CEBPADouble mutation 9 (7.96%) 3 (5.26%) 6 (10.71%) 0.593
IDH1b 3 (3.75 %) 1 (2.56 %) 2 (4.88%) 0.592
IDH2b 8 (10 %) 3 (7.69%) 5 (12.20%) 0.508
DNMT3Ab 12 (15 %) 10 (25.641%) 2 (4.88%) 0.009*
MLLb 7 (8.75%) 3 (7.69%) 4 (9.76%) 0.426
ERGc 11.17 (10.26-12.08) 11.60 (10.48-12.72) 10.68 (9.17-12.20) 0.320
MN1c 12.98 (12.28-13.68) 13.35 (12.42-14.28) 12.55 (11.47-13.64) 0.257
miR-181ac 3.12 (2.57-3.67) 3.17 (2.35-3.98) 3.07 (2.30-3.84) 0.864
miR-3151c 12.35 (11.90-12.80) 12.18 (11.53-12.84) 12.53 (11.89-13.16) 0.448
Values are number (%) of patients with alteration.aCEBPA single and double mutations.bOnly 80 patients with high quality of DNA to sequence; 39 patients are low BDH2 expression and 41 patients are high expression.cMean (95% CI).*Statistically significant (P < 0.05).
Table 3 Comparison of other genetic alterations between older and younger AML patientsa
Variant Number of patients with the gene mutation (percentage); Median of RNA expression (delta CT) P
Whole cohort 60 years or younger, (n=69) Older than 60 y/o, (n=44)
NPM1mut 38 (33.33%) 21 (30%) 17 (38.64%) 0.227
FLT3-ITD 23 (20.18%) 15 (21/43%) 8 (18.18%) 0.433
FLT3-TKD 8 (7.02%) 2 (2.86%) 6 (13.64%) 0.036*
NPM1mut/FLT3-ITDneg 22 (19.30%) 11(15.71%) 11 (25%) 0.164
CEBPAa 34 (30.36%) 18 (26.09%) 16 (37.20%) 0.151
CEBPADouble mutation,b 9 (78.04%) 8 (11.59%) 1 (2.23%) 0.016*
IDH1c 3 (3.75 %) 2 (4%) 1 (3.3%) 0.686
IDH2c 8 (10 %) 4 (8%) 4 (13.2%) 0.454
DNMT3Ac 12 (15 %) 10 (25.641%) 2 (4.88%) 0.095
MLL 7 (8.75%) 4 (8%) 3 (10%) 0.528
Delta BDH2d 9.006 (4.53-12.36) 9.051 (4.53-12.36) 8.915 (6.4-12.15) 0.102
ERGd 10.595 (4.52-19.92) 10.88 (5.17-19.92) 9.74 (4.52-19.85) 0.435
MN1d 13.25 (7.75-19.87) 13.06 (7.76-19.87) 13.25 (7.75-18.38) 0.992
miR-181ad 3.21 (−3.8-8.44) 3.3 (−0.03-8.44) 2.49 (−3.8-8.2) 0.140
miR-3151d 12.685 (4.97-15.29) 12.685 (9.16-15.07) 12.6 (4.97-15.29) 0.247
Values are number (%) of patients with alteration.aCEBPA single and double mutations.bCEBPA double mutation vs CEBPA single mutation vs no mutation.cOnly 80 patients with high quality of DNA to sequence; 50 patients are 60 y/o or younger patients and 30 patients are high expression.dMedian delta CT(range).*Statistically significant (P < 0.05).
Yang et al. Journal of Biomedical Science 2013, 20:58 Page 7 of 15http://www.jbiomedsci.com/content/20/1/58
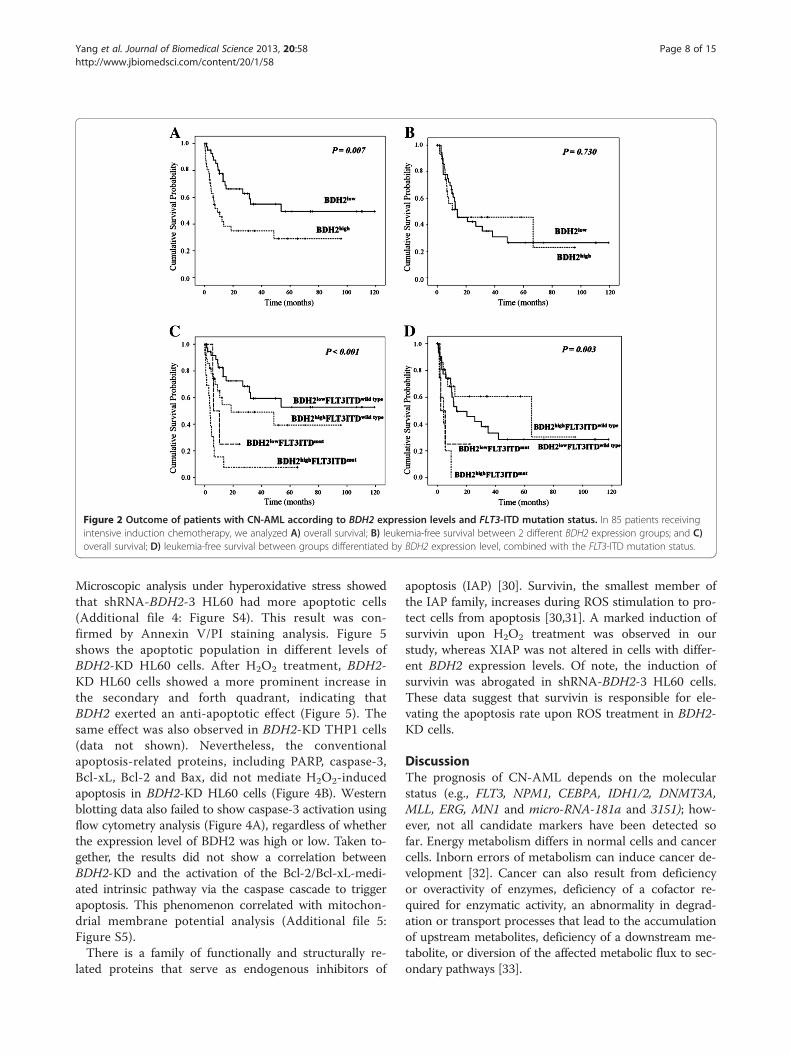
Figure 2 Outcome of patients with CN-AML according to BDH2 expression levels and FLT3-ITD mutation status. In 85 patients receivingintensive induction chemotherapy, we analyzed A) overall survival; B) leukemia-free survival between 2 different BDH2 expression groups; and C)overall survival; D) leukemia-free survival between groups differentiated by BDH2 expression level, combined with the FLT3-ITD mutation status.
Yang et al. Journal of Biomedical Science 2013, 20:58 Page 8 of 15http://www.jbiomedsci.com/content/20/1/58
Microscopic analysis under hyperoxidative stress showedthat shRNA-BDH2-3 HL60 had more apoptotic cells(Additional file 4: Figure S4). This result was con-firmed by Annexin V/PI staining analysis. Figure 5shows the apoptotic population in different levels ofBDH2-KD HL60 cells. After H2O2 treatment, BDH2-KD HL60 cells showed a more prominent increase inthe secondary and forth quadrant, indicating thatBDH2 exerted an anti-apoptotic effect (Figure 5). Thesame effect was also observed in BDH2-KD THP1 cells(data not shown). Nevertheless, the conventionalapoptosis-related proteins, including PARP, caspase-3,Bcl-xL, Bcl-2 and Bax, did not mediate H2O2-inducedapoptosis in BDH2-KD HL60 cells (Figure 4B). Westernblotting data also failed to show caspase-3 activation usingflow cytometry analysis (Figure 4A), regardless of whetherthe expression level of BDH2 was high or low. Taken to-gether, the results did not show a correlation betweenBDH2-KD and the activation of the Bcl-2/Bcl-xL-medi-ated intrinsic pathway via the caspase cascade to triggerapoptosis. This phenomenon correlated with mitochon-drial membrane potential analysis (Additional file 5:Figure S5).There is a family of functionally and structurally re-
lated proteins that serve as endogenous inhibitors of
apoptosis (IAP) [30]. Survivin, the smallest member ofthe IAP family, increases during ROS stimulation to pro-tect cells from apoptosis [30,31]. A marked induction ofsurvivin upon H2O2 treatment was observed in ourstudy, whereas XIAP was not altered in cells with differ-ent BDH2 expression levels. Of note, the induction ofsurvivin was abrogated in shRNA-BDH2-3 HL60 cells.These data suggest that survivin is responsible for ele-vating the apoptosis rate upon ROS treatment in BDH2-KD cells.
DiscussionThe prognosis of CN-AML depends on the molecularstatus (e.g., FLT3, NPM1, CEBPA, IDH1/2, DNMT3A,MLL, ERG, MN1 and micro-RNA-181a and 3151); how-ever, not all candidate markers have been detected sofar. Energy metabolism differs in normal cells and cancercells. Inborn errors of metabolism can induce cancer de-velopment [32]. Cancer can also result from deficiencyor overactivity of enzymes, deficiency of a cofactor re-quired for enzymatic activity, an abnormality in degrad-ation or transport processes that lead to the accumulationof upstream metabolites, deficiency of a downstream me-tabolite, or diversion of the affected metabolic flux to sec-ondary pathways [33].

Table 4 Univariate analyses of the impact on overallsurvival in patients with CN-AML who received intensiveinduction chemotherapy
Variable No. ofpatients
Overall survival
Mediana P
Age, years 0.001*
60 or younger 66 32.2
Older than 60 22 4.5
WBC 0.469
50000/uL or less 49 31.433
Greater than 50000/uL 37 13
BDH2 0.007*
Lower expression 46 53.667
Higher expression 40 9
CEBPA 0.755
Double mutation 9 31.433
Single mutation 16 53.667
No mutation 61 16.267
NPM1 0.179
Mutated 28 10.4
Wild 58 32.2
FLT3-ITD- <0.001*
Mutated 17 4.767
Wild 70 48.633
FLT3-TKD 0.596
Mutated 7 13.00
Wild 79 18.567
NPM1/FLT3-ITD 0.314
NPM1+/FLT3-ITD- 15 NR
Others 71 15.067
IDH1b 0.796
Mutated 3 22.21
Wild 61 27.055
IDH2b 0.749
Mutated 4 21.91
Wild 60 27.16
DNMT3Ab 0.508
Mutated 11 32.58
Wild 53 25.63
MLLb 0.178
Mutated 5 12.63
Wild 59 13.12
BDH2low/FLT3-ITD <0.001*
BDH2low/FLT3-ITDwild type 40 722.16
BDH2low/FLT3-ITDmutation 5 519.73
Table 4 Univariate analyses of the impact on overallsurvival in patients with CN-AML who received intensiveinduction chemotherapy (Continued)
BDH2high/FLT3-ITDwild type 27 371.56
BDH2high/FLT3-ITDmutation 13 182.27
Abbreviation: NR indicates not reached.aMedian, months.bOnly 64 patients who had high quality DNA preserved for sequence receivedstandard intensive induction chemotherapy.*Statistically significant (P < 0.05).
Yang et al. Journal of Biomedical Science 2013, 20:58 Page 9 of 15http://www.jbiomedsci.com/content/20/1/58
There are 3 different types of insults related to the in-born errors of metabolism: (1) toxic accumulation ofmetabolites, (2) metabolite channeling, and (3) mito-chondrial dysfunction. Toxin accumulation leads to anincrease in oxidative stress and ROS, as seen with iron ac-cumulation in hemochromatosis [34]. In addition, accu-mulation of toxic metabolites could affect gene expressionor cause a shift to alternative metabolic pathways, whichcould lead to tumorigenesis [29].Human BDH2 (DHRS6) is an enzyme that participates in
the citric acid cycle metabolism and ketogenesis [32], whichmay play a crucial role in promoting tumorigenesis [33,34].In our results, BDH2 mRNA expression was higher in theBM of patients with CN-AML and AML with multiplechromosome abnormalities, compared with normal BMsamples. We focused on CN-AML patients. No differenceswere observed in the incidence of clinical pictures, includ-ing blast amount in BM, FAB classification, and alterationsin genes, except FLT3-ITD and DNMT3A, betweenBDH2high and BDH2low groups. High BDH2 expression isan independent indicator of poor prognosis of CN-AML,which may be related to a poor response to conventionalintensive chemotherapy and a low CR rate. Given the inde-pendent adverse impact on survival and the low responserate in patients in the BDH2high group in both younger andelder patients, we suggest that higher BDH2 expressionmakes patients resistant to intensive induction chemother-apy. Although high BDH2 expression does not shorten theduration of relapse once patients obtain CR, patients withlow BDH2 expression may benefit from further treatment,including chemotherapy and allogenetic hematopoieticstem cell transplantation, which may prolong survival time.In outcome analysis by gene alternations, FLT3-ITD
and MN1 mutations, and BDH2 were independent adverseprognostic factor for survival, with statistics significant.ERG and MLL mutations, and higher miR-3151 expressionlevel showed a trend of adverse impact on survival. NPM1,CEBPA mutations and miR-181a showed positive out-come in CN-AML patients. However, DNMT3A muta-tions showed a good impact on survival, that could notcompatible with previous reports. The mutations inDNMT3A in eleven of twelve of our patients are R882(4279129C->T). One patient with DNMT3A mutation isR882 (4279073G->T). Only 12 CN-AML patients have

Table 5 Multivariate analyses (cox regression) of relapse-free survival and overall survivala
Variables
Relapse-free survival Overall survival
95% CI 95% CI
HR Lower Upper P HR Lower Upper P
Whole cohort (n = 86)
Ageb 3.083 0.184 51.762 0.434 3.252 1.322 8.002 0.010*
NPM1c 0.087 0.012 0.604 0.014* 0.392 0.128 1.195 0.100
FLT3-ITDd 21.079 1.427 311.302 0.026* 4.532 1.395 14.723 0.012*
FLT3-TKD 19.630 1.539 250.445 0.022* 1.801 0.184 17.603 0.613
CEBPAe 0.408 0.144 1.154 0.091 0.398 0.147 1.080 0.070
IDH1c 0.448 0.039 5.167 0.520 0.648 0.128 3.268 0.599
IDH2c 0.583 0.025 13.640 0.737 0.254 0.036 1.781 0.168
DNMT3Ac 0.292 0.041 2.098 0.221 0.731 0.158 3.380 0.689
MLL c 31.310 0.729 1344.29 0.073 1.040 0.215 5.020 0.961
MN1 1.391 1.027 1.883 0.033* 1.195 1.025 1.394 0.023*
ERG 5.799 0.548 61.325 0.144 2.545 0.993 6.520 0.052
miR-181a 0.824 0.598 1.135 0.236 0.860 0.692 1.069 0.174
miR-3151 1.183 0.750 1.867 0.469 1.285 0.884 1.866 0.189
BDH2f 2.035 0.472 8.782 0.341 2.547 1.094 6.685 0.050*
Abbreviations: HR indicates Hazard ratio; CI, confidence interval.aOnly patients with intensive induction chemotherapy enrolled.bAge > 60 relative to Age ≤ 60 (the reference).cNPM1mut versus NPM1wild type; IDH1mut versus IDH1wild type; IDH2mut versus IDH2wild type; DNMT3Amut versus DNMT3Awild type ; MLLmut versus MLLwild.dFLT3-ITDmut versus FLT3-ITDneg.eCEBPAdouble-mutation versus CEBPAsingle mutation versus CEBPAno mutation.fBDH2high relative to BDH2low group.*Statistically significant (P < 0.05).
Table 6 Multivariate analyses (cox regression) of overall survivala in younger and older patients
Variables
Patients ≦ 60 y/o Patients > 60 y/o
95% CI 95% CI
HR Lower Upper P HR Lower Upper P
NPM1b 0.000 0.000 1.490E89 0.898 0.263 0.021 3.377 0.305
FLT3-ITDc 7.505 1.538 36.614 0.013* 3.235 0.424 24.699 0.258
FLT3-TKD 9765.104 32.249 2.95E6 0.002* 144.617 0.000 3.75E169 0.980
CEBPAd 0.357 0.125 1.020 0.054 1.090 0.292 4.066 0.898
IDH1b 14220.871 0.000 3.9E99 0.932 174.990 0.000 4.56E169 0.979
IDH2b 0.000 0.000 2.695E210 0.958 0.459 0.050 4.242 0.492
DNMT3Ab 146.313 0.000 4.16E97 0.965
MLLb 0.059 0.000 1.78E94 0.980 2.245 0.173 29.122 0.536
MN1e 1.923 1.130 3.273 0.016* 1.198 0.916 1.567 0.187
ERG 53.777 1.820 1589.377 0.021* 32.349 2.889 362.237 0.005*
miR-181a 0.514 0.260 1.014 0.055 1.361 0.933 1.986 0.110
miR-3151 1.164 0.580 2.337 0.669 0.423 0.191 0.935 0.033*
BDH2e 4.829 1.002 23.274 0.050* 18.937 1.571 228.308 0.021*
Abbreviations: HR indicates Hazard ratio; CI, confidence interval.aOnly patients with intensive induction chemotherapy enrolled.bNPM1mut versus NPM1wild type; IDH1mut versus IDH1wild type; IDH2mut versus IDH2wild type; DNMT3Amut versus DNMT3Awild type.cFLT3-ITDmut versus FLT3-ITDneg.dCEBPAdouble-mutation versus CEBPAsingle mutation versus CEBPAno mutation.eBDH2high relative to BDH2low group.*Statistically significant (P < 0.05).
Yang et al. Journal of Biomedical Science 2013, 20:58 Page 10 of 15http://www.jbiomedsci.com/content/20/1/58
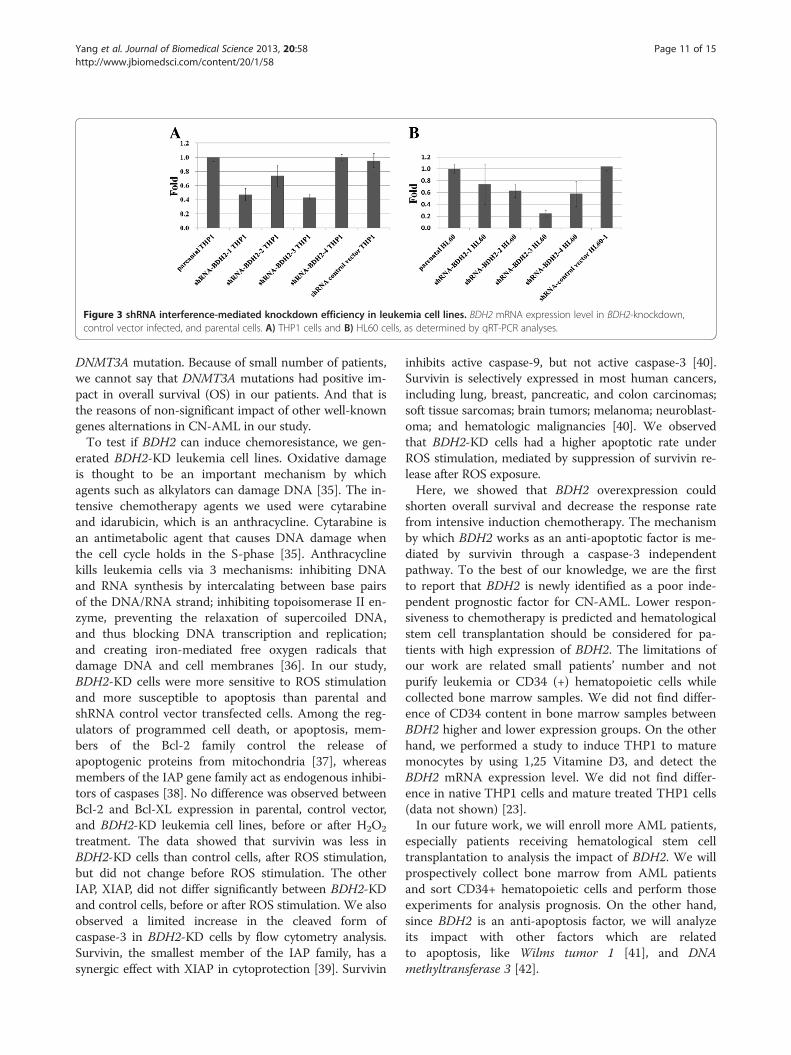
Figure 3 shRNA interference-mediated knockdown efficiency in leukemia cell lines. BDH2 mRNA expression level in BDH2-knockdown,control vector infected, and parental cells. A) THP1 cells and B) HL60 cells, as determined by qRT-PCR analyses.
Yang et al. Journal of Biomedical Science 2013, 20:58 Page 11 of 15http://www.jbiomedsci.com/content/20/1/58
DNMT3A mutation. Because of small number of patients,we cannot say that DNMT3A mutations had positive im-pact in overall survival (OS) in our patients. And that isthe reasons of non-significant impact of other well-knowngenes alternations in CN-AML in our study.To test if BDH2 can induce chemoresistance, we gen-
erated BDH2-KD leukemia cell lines. Oxidative damageis thought to be an important mechanism by whichagents such as alkylators can damage DNA [35]. The in-tensive chemotherapy agents we used were cytarabineand idarubicin, which is an anthracycline. Cytarabine isan antimetabolic agent that causes DNA damage whenthe cell cycle holds in the S-phase [35]. Anthracyclinekills leukemia cells via 3 mechanisms: inhibiting DNAand RNA synthesis by intercalating between base pairsof the DNA/RNA strand; inhibiting topoisomerase II en-zyme, preventing the relaxation of supercoiled DNA,and thus blocking DNA transcription and replication;and creating iron-mediated free oxygen radicals thatdamage DNA and cell membranes [36]. In our study,BDH2-KD cells were more sensitive to ROS stimulationand more susceptible to apoptosis than parental andshRNA control vector transfected cells. Among the reg-ulators of programmed cell death, or apoptosis, mem-bers of the Bcl-2 family control the release ofapoptogenic proteins from mitochondria [37], whereasmembers of the IAP gene family act as endogenous inhibi-tors of caspases [38]. No difference was observed betweenBcl-2 and Bcl-XL expression in parental, control vector,and BDH2-KD leukemia cell lines, before or after H2O2
treatment. The data showed that survivin was less inBDH2-KD cells than control cells, after ROS stimulation,but did not change before ROS stimulation. The otherIAP, XIAP, did not differ significantly between BDH2-KDand control cells, before or after ROS stimulation. We alsoobserved a limited increase in the cleaved form ofcaspase-3 in BDH2-KD cells by flow cytometry analysis.Survivin, the smallest member of the IAP family, has asynergic effect with XIAP in cytoprotection [39]. Survivin
inhibits active caspase-9, but not active caspase-3 [40].Survivin is selectively expressed in most human cancers,including lung, breast, pancreatic, and colon carcinomas;soft tissue sarcomas; brain tumors; melanoma; neuroblast-oma; and hematologic malignancies [40]. We observedthat BDH2-KD cells had a higher apoptotic rate underROS stimulation, mediated by suppression of survivin re-lease after ROS exposure.Here, we showed that BDH2 overexpression could
shorten overall survival and decrease the response ratefrom intensive induction chemotherapy. The mechanismby which BDH2 works as an anti-apoptotic factor is me-diated by survivin through a caspase-3 independentpathway. To the best of our knowledge, we are the firstto report that BDH2 is newly identified as a poor inde-pendent prognostic factor for CN-AML. Lower respon-siveness to chemotherapy is predicted and hematologicalstem cell transplantation should be considered for pa-tients with high expression of BDH2. The limitations ofour work are related small patients’ number and notpurify leukemia or CD34 (+) hematopoietic cells whilecollected bone marrow samples. We did not find differ-ence of CD34 content in bone marrow samples betweenBDH2 higher and lower expression groups. On the otherhand, we performed a study to induce THP1 to maturemonocytes by using 1,25 Vitamine D3, and detect theBDH2 mRNA expression level. We did not find differ-ence in native THP1 cells and mature treated THP1 cells(data not shown) [23].In our future work, we will enroll more AML patients,
especially patients receiving hematological stem celltransplantation to analysis the impact of BDH2. We willprospectively collect bone marrow from AML patientsand sort CD34+ hematopoietic cells and perform thoseexperiments for analysis prognosis. On the other hand,since BDH2 is an anti-apoptosis factor, we will analyzeits impact with other factors which are relatedto apoptosis, like Wilms tumor 1 [41], and DNAmethyltransferase 3 [42].

Figure 4 Caspase-3 activity after treatment with 50 μM H2O2 for 2 h in the HL60 cell line. A) Cleaved caspase-3 detected by flowcytometry. The gray area represents cells that were not subjected to the H2O2 treatment, and the dot- lines denote cells treated with H2O2. Topleft: parental HL60; top right: shRNA-BDH2-2 HL60; bottom left: shRNA-BDH2-3 HL60; bottom right: shRNA control vector HL60. B) Bcl-2, Bcl-xL,BAX, PARP, survivin, XIAP, and BDH2 protein expression on a western blot analyses.
Yang et al. Journal of Biomedical Science 2013, 20:58 Page 12 of 15http://www.jbiomedsci.com/content/20/1/58

Figure 5 Apoptosis rate in HL60 cells after treatment with 50 μM H2O2 for 2 h. The apoptosis rate was dependent on the BDH2-knockdown efficiency: A) shRNA-BDH2-1 HL60; B) shRNA-BDH2-2 HL60; C) shRNA-BDH2-3 HL60; D) shRNA-BDH2-4 HL60; and E) shRNA controlvector HL60; F) the apoptosis rate of each cell lines. Dark gray: late apoptosis bar; light gray bar: early apoptosis.
Yang et al. Journal of Biomedical Science 2013, 20:58 Page 13 of 15http://www.jbiomedsci.com/content/20/1/58
ConclusionWe reported that BDH2 overexpression could shortenoverall survival and decrease the response rate from in-tensive induction chemotherapy. The mechanism bywhich BDH2 works as an anti-apoptotic factor is medi-ated by survivin through a caspase-3 independentpathway.
Additional files
Additional file 1: Figure S1. mRNA expression levels of BDH2 in bonemarrow. BDH2mRNA expression levels in bone marrow from patientswith normal bone marrow, cytogenetically normal AML (CN-AML), goodrisk patients with AML-ETO fusion gene and chromosome inv (16), andpoor risk patients with multiple chromosome abnormalities. P<0.001.Higher ΔCT-BDH2 means lower mRNA expression levels. BM: bone marrow.Sample number of bone marrows from normal bone marrow, CN-AML,AML with AML-ETO (+), AML with inv (16), and AML with multiplechromosome abnormalities are 43, 113, 10, 3 and 25.
Additional file 2: Figure S2. Correlation between BDH2 and LCN2mRNA expression in bone marrow. There is no correlation between themRNA expression of BDH2 and LCN2.
Additional file 3: Figure S3. The Kaplan-Meier overall survival curves indifferent BDH2 expression groups. HSCT indicates hematopoietic stemcell transplantation.
Additional file 4: Figure S4. Apoptosis after 50 μM H2O2 treatment for2 h in each cell line, assessed under a light microscope at 200×. Bluearrows indicate apoptotic cells. shRNA-BDH2-3 HL60 cells had moreapoptotic cells.
Additional file 5: Figure S5. The mitochondrial membrane potentialchange. That was analyzed using a MitoProbe™ JC-1 Assay Kit and nodifference between BDH2-knockdown THP1 cells and control cells. shRNA1,shRNA-BDH2-1 THP1; shRNA3, shRNA-BDH2-3 THP1; shRNAc, shRNA emptyvector infected THP1; CCCP, carbonyl cyanide 3-chlorophenylhydrazone,positive control.
AbbreviationsBDH2: Type 2-hydroxybutyrate dehydrogenase; LCN2: Lipocalin-2;CEBPA: CCAAT/enhancer binding protein (C/EBP), alpha; FLT3-ITD: Fms-related tyrosine kinase 3 Internal tandem duplications;NPM1: Nucleophosmin 1; IDH1/2: Isocitrate dehydrogenase 1/2;DNMT3A: DNA (cytosine-5)-methyltransferase 3A; MLL: Mixed lineageleukemia gene; MN1: Meningionma1; ERG: ETS-related gene; miR-181a: Micro-RNA-181a; miR-3151: Micro-RNA-3151; CR: Complete remission;OS: Overall survival; RFS: Relapse free survival; LFS: Leukemia free survival.
Competing interestsThe authors declare no competing financial interests.
Authors’ contributionsWC designed and performed research experiments, analyzed data, andwrote the manuscript, WT and PL performed some research experiments, MYprovided cells and reagents, and reviewed and edited the manuscript, YLcollected patient data and samples, CC provided suggestions to the researchand data analysis, WY performed research experiments, SL reviewed andedited the manuscript, provided suggestions to the research. All authorsread and approved the final manuscript.
AcknowledgmentsThe authors thank the Statistical Analysis Laboratory, Department of InternalMedicine, Kaohsiung Medical University Hospital, Taiwan.
Author details1Division of Hematology and Oncology, Department of Internal Medicine,Kaohsiung Medical University Hospital, No. 100 Tzyou 1st Road, 807Kaohsiung, Taiwan. 2Graduate Institute of Medicine, Kaohsiung MedicalUniversity, No. 100 Tzyou 1st Road, 807 Kaohsiung, Taiwan. 3Department ofMedical Laboratory Science and Biotechnology, Kaohsiung MedicalUniversity, No. 100 Tzyou 1st Road, 807 Kaohsiung, Taiwan. 4Department ofNursing, I-Shou University, No. 1, Section 1, Syuecheng Road, Dashu Township824 Kaohsiung City, Taiwan. 5Graduate Institute of Clinical Medical Sciences,College of Medicine, Chang Gung University, 59 Wen-Hwa 1st Road, Kwei-Shan333 Tao-Yuan, Taiwan. 6Faculty of Medicine, College of Medicine, KaohsiungMedical University, No. 100 Tzyou 1st Road, 807 Kaohsiung, Taiwan.

Yang et al. Journal of Biomedical Science 2013, 20:58 Page 14 of 15http://www.jbiomedsci.com/content/20/1/58
Received: 30 May 2013 Accepted: 12 August 2013Published: 14 August 2013
References1. Byrd JC, Mrozek K, Dodge RK, et al: Pretreatment cytogenetic
abnormalities are predictive of induction success, cumulativeincidence of relapse, and overall survival in adult patients with denovo acute myeloid leukemia: results from Cancer and LeukemiaGroup B (CALGB 8461). Blood 2002, 100:4325–4336.
2. Dohner H, Estey EH, Amadori S, Appelbaum FR, et al: Diagnosis andmanagement of acute myeloid leukemia in adults:recommendations from an international report panel, on behalf ofthe European Leukemia Net. Blood 2010, 115:453–474.
3. Campo E, Swerdlow SH, Harris NL, Pileri S, Stein H, Jaffe ES: The 2008WHO classification of lymphoid neoplasms and beyond: evolvingconcepts and practical applications. Blood 2011,117(19):5019–5032.
4. Dang L, Jin S, Su SM: KDH mutations in glioma and acute myeloidleukemia. Trends Mol Med 2010, 16:387–397.
5. Delhommeau F, Dupont S, Della Valle V, et al: Mutation in TET2 in myeloidcancers. N Engl J Med 2009, 360:2289–2301.
6. Gaidzik VI, Bullinger L, Schlenk RF, et al: RUNX1 mutations in acutemyeloid leukemia: results from a comprehensive genetic andclinical analysis from the AML Study Group. J Clin Oncol 2011,29:1364–1372.
7. Langer C, Marcucci G, Holland KB, et al: Prognostic importance of MN1transcript levels, and biologic insights from NM1-associated gene andmicroRNA expression signatures in cytogenetically normal acute myeloidleukemia: a Cancer and Leukemia Group B study. J Clin Oncol 2009,27:3198–3204.
8. Langer C, Radmacher MD, Ruppert AS, et al: High BAALC expressionassociates with other molecular prognostic markers, poor outcome,and a distinct gene-expression signature in cytogenetically normalpatients younger than 60 years with acute myeloid leukemia: aCancer and Leukemia Group B (CALGB) study. Blood 2008,111:5371–5379.
9. Marcucci G, Maharry K, Whitman SP, et al: High expression levels of theETS-related gene, ERG, predict adverse outcome and improve molecularrisk-based classification of cytogenetically normal acute myeloidleukemia: a Cancer and Leukemia Group B study. J Clin Oncol 2007,25:3337–3343.
10. Marcucci G, Maharry K, Wu YZ, et al: IDH1 and IDH2 gene mutationsidentify novel molecular subsets within de novo cytogenetically normalacute myeloid leukemia: a Cancer and Leukemia Group B study. J ClinOncol 2010, 28:2348–2355.
11. Metzeler KH, Dufour A, Benthaus T, et al: ERG expression is anindependent prognostic factor and allows refined risk stratificationin cytogenetically normal acute myeloid leukemia: acomprehensive analysis of ERG, NM1 and BAALC transcript levelsusing oligonucleotide microarrays. J Clin Oncol 2009,27:5031–5038.
12. Metzeler KH, Maharry K, Radmacher MD, et al: TET2 mutations improve thenew European Leukemia Net risk classification of acute myeloidleukemia: a Cancer and Leukemia Group B study. J Clin Oncol 2011, 29(10):1378–1381.
13. Neubauer A, Maharry K, Mrozek K, et al: Patients with acute myeloidleukemia and RAS mutations benefit most from postremission high-dosecytarabine: a Cancer and Leukemia Group B study. J Clin Oncol 2008,26:4603–4609.
14. Paschka P, Marcucci G, Ruppert AS, et al: Wilms tumor 1 gene mutationsindependently predict poor outcome in adults with cytogeneticallynormal acute myeloid leukemia: a Cancer and Leukemia Group B study.J Clin Oncol 2008, 26:4595–4602.
15. Paschka P, Schlenk RF, Gaidzik VI, et al: IDH1 and IDH2 mutations arefrequent genetic alterations in acute myeloid leukemia and conferadverse prognosis in cytogenetically normal acute myeloid leukemiawith NPM1 mutation without FLT3 internal tandem duplication. J ClinOncol 2010, 28:3636–3643.
16. Tang JL, Hou HA, Chen CY, et al: AML1/RUNX1 mutations in 470 adultspatients with de novo acute myeloid leukemia: prognostic implicationand interaction with other gene alterations. Blood 2009, 114:5352–5361.
17. Mithat Gönen JP, Figueroa ME, Fernandez H, et al: Prognostic Relevance ofIntegrated Genetic Profiling in Acute Myeloid Leukemia. New Eng J Med2012, 366:1079–1089.
18. Warburg O: On the origin of cancer cells. Science 1956, 123:309–314.19. Vander Heiden MG, Cantley LC, Thompson CB: Understanding the Warbur
effect: The metabolic requirements of cell proliferation. Science 2009,324:1029–1033.
20. Luo J, Manning BD, Cantley LC: Targeting the PI3K-Akt pathway inhuman cancer: Rationale and promise. Cancer Cell 2003,4:257–262.
21. Guo K, Lukacik P, Papagrigoriou E, et al: Characterization of human DHRS6,an orphan short chain dehydrogenase/reductase enzyme: a novel,cytosolic type 2 R-beta-hydroxybutyrate dehydrogenase. J Biol Chem2006, 281:10291–10297.
22. Devireddy LR, Hart DO, Goetz DH, Green MR: A mammaliansiderophore synthesized by an enzyme with a bacterial homologinvolved in enterobactin production. Cell 2010, 141:1006–1017.
23. Yang WC, Lin PM, Yang MY, et al: Higher lipocalin 2 expression mayrepresent an independent favorable prognostic factor in cytogeneticallynormal acute myeloid leukemia. Leukemia Lymphoma 2012. 10.3109/10428194.2012.749402.
24. Schnittger S, Kinkelin U, Schoch C, et al: Screening for MLL tandemduplication in 387 unselected patients with AML identify aprognostically unfavorable subset of AML. Leukemia 2000,14:796–804.
25. Falini B, Mecucci C, Tiacci E, et al: Cytoplasmic nucleophosmin in acutemyelogenous leukemia with a normal karyotype. N Engl J Med 2005,352:254–266.
26. Kiyoi H, Naoe T, Nakano Y, et al: Prognostic implication of FLT3 andN-RAS gene mutations in acute myeloid leukemia. Blood 1999,93:3074–3080.
27. Pabst T, Mueller BU, Zhang P, et al: Dominant-negative mutations ofCEBPA, encoding CCAAT/enhancer binding protein-alpha (C/EBPalpha), in acute myeloid leukemia. Nat Genet 2001,27:263–270.
28. Chou WC, Hou HA, Chen CY, et al: Distinct clinical and biologiccharacteristics in adult acute myeloid leukemia bearing the the isocitratedehydrogenase 1 mutation. Blood 2010, 115:2749–2754.
29. Simon HU, Haj-Yehia A, Levi-Schaffer F: Role of reactive oxygen species(ROS) in apoptosis induction. Apoptosis 2000, 5:415–418.
30. Chu J, Wu S, Xing D: Survivin mediates self-protection throughROS/cdc25c/CDK1 signaling pathway during tumor cell apoptosisinduced by high fluence low-power laser irradiation. Cancer Lett2010, 297:207–219.
31. Yao LL, Wang YG, Cai WJ, Yao T, Zhu YC: Survivin mediates the anti-apoptotic effect of delta-opioid receptor stimulation in cardiomyocytes.J Cell Sci 2007, 120:895–907.
32. Laffel L: Ketone Bodies: a review of physiology, pathophysiology andapplication of monitoring to diabetes. Diabetes Metab Res Rev 1999,15:412–426.
33. Pavlides S, Tsirigos A, Mibneco G, et al: The autophagic tumor stromamodel of cancer: role of oxidative stress and ketone production infueling tumor cell metabolism. Cell Cycle 2010, 9:3485–3505.
34. Maurer GD, Brucker DP, Bahr O, et al: Differential utilization of ketonebodies by neurons and glioma cell lines: a rationale for ketogenic diet asexperimental glioma therapy. BMC Cancer 2011, 11:315–321.
35. Michael E: Trigg, MD, Anne Flanigan-Minnick: Mechanisms of action ofcommonly used drugs to treat cancer (Review). Comm Oncol 2011,8:357–369.
36. Müller I, Niethammer D, Bruchelt G: Anthracycline-derivedchemotherapeutics in apoptosis and free radical cytotoxicity (Review).Int J Mol Med 1998, 1:491–494.
37. Cory S, Adams JM: The Bcl2 family: regulators of the cellular life-or-deathswitch. Nat Rev Cancer 2002, 2:647–656.
38. Shi Y: Mechanisms of caspase activation and inhibition during apoptosis.Mol Cell 2002, 9:459–470.
39. Dohi T, Okada K, Xia F, et al: An IAP-IAP complex inhibits apoptosis. J BiolChem 2004, 279:34087–34090.
40. Mita AC, Mita MM, Nawrocki ST, Giles FJ: Survivin: key regulator of mitosisand apoptosis and novel target for cancer therapeutics. Clin Cancer Res2008, 14:5000–5005.

Yang et al. Journal of Biomedical Science 2013, 20:58 Page 15 of 15http://www.jbiomedsci.com/content/20/1/58
41. Bansal H, Seifert T, Bachier C, et al: The transcription factor Wilms tumor 1confers resistance in myeloid leukemia cells against the proapoptotictherapeutic agent TRAIL by regulating the antiapoptotic protein Bcl-xL.J Biol Chem 2012, 287(39):32875–32880.
42. Ribeiro AF, Pratcorona M, Erpelinck-Verschueren C, et al: Mutant DNMT3A: amarker of poor prognosis in acute myeloid leukemia. Blood 2012,119:5824–5831.
doi:10.1186/1423-0127-20-58Cite this article as: Yang et al.: Human BDH2, an anti-apoptosis factor, isa novel poor prognostic factor for de novo cytogenetically normal acutemyeloid leukemia. Journal of Biomedical Science 2013 20:58.
Submit your next manuscript to BioMed Centraland take full advantage of:
• Convenient online submission
• Thorough peer review
• No space constraints or color figure charges
• Immediate publication on acceptance
• Inclusion in PubMed, CAS, Scopus and Google Scholar
• Research which is freely available for redistribution
Submit your manuscript at www.biomedcentral.com/submit