research on foreign exchange interventions · abstract newswire reports have become an accepted...
TRANSCRIPT

2005
-2On the Inadequacy of Newswire Reports for EmpiricalResearch on Foreign Exchange InterventionsAndreas M. Fischer
Swis
s Na
tion
al B
ank
Wor
king
Pap
ers

The views expressed in this paper are those of the author(s) and do not necessarilyrepresent those of the Swiss National Bank. Working Papers describe research in progress.Their aim is to elicit comments and to further debate.
ISSN 1660-7716
© 2005 by Swiss National Bank, Börsenstrasse 15, P.O. Box, CH-8022 Zurich

On the Inadequacy of Newswire Reports for Empirical Research
on Foreign Exchange Interventions
(revised version)
Andreas M. Fischer*
Swiss National Bank and CEPR
Abstract
Newswire reports have become an accepted tool for empirical studies analyzing informational asymmetries in FX markets. This paper tests the accuracy of such reports for Swiss interventions in the foreign exchange market. The evidence finds that the time stamp of the reports does not always lie near the recorded time of the first intervention trade as is commonly assumed in market microstructure studies. The standard deviation of the time difference is measured in hours and not in minutes. These and other regression results question the accuracy of newswire reports for Swiss interventions. JEL Classification Number: F31, F33 Keywords: Central Bank Interventions, Intra-Daily Data, Newswire Reports
*address: Swiss National Bank, Postfach, CH-8022 Zurich, Switzerland telephone (+41 1) 631 31 11, fax (+41 1) 631 39 01 e-mail: [email protected]

1
1. Introduction
Reuters news reports have become an accepted tool for market microstructure studies of
foreign exchange interventions. A key attribute of the electronic media reports is their time stamp.
In the absence of actual intervention data, Reuters news reports allow researchers to define a
narrow reaction window that is measured in minutes rather than in hours or days (see Goodhart
and Hesse, 1993, for event windows defined in hours and Fatum and Hutchison, 2003, in days).
Dominguez (2003a, b) and Goodhart and Hesse (1993) use Reuters news reports together with
intra-daily data to test the signaling hypothesis. Chari (2002), Chang and Taylor (1998), and
Melvin and Peiers (1995) rely on the same information source to determine if central bank
interventions dampen exchange rate volatility. In a similar spirit, Peiers (1997) and Sapp (2002)
work with Reuters intervention announcements to examine issues of price leadership. The key
assumption in each of these empirical studies is that Reuters news reports are released shortly after
the central bank has intervened. This conjecture implies that the electronic archives of Reuters
offer researchers a high degree of precision in the absence of actual transactions data. One
drawback of this empirical approach is that the qualitative accuracy of the Reuters news reports for
exchange rate interventions has never been tested. I set out to do this.
The accuracy tests of Reuters intervention reports are carried out against transactions data
from the Swiss National Bank (SNB).1 The use of Swiss transactions data is interesting because,
unlike many central banks, the SNB has an open communication strategy. This together with the
observation that almost all SNB interventions were coordinated with a G3 country guarantees a
high level of market presence by Reuters.2 Against this backdrop, issues of time differences
between the time stamp of actual transactions and Reuters intervention reports and whether the
Reuters reports are able to capture the number of intervention transactions are examined. Tests
1 Osterberg and Wetmore Humes’ (1993) and Klein’s (1993) analysis of the accuracy of newspaper reports for central bank interventions may be regarded in many ways as a precursor to this study. 2 To build on past studies, it would have been preferable to conduct the analysis for a G-3 country. This, however, is not possible due to problems of data availability.

2
examining microstructure issues of trading volume and exchange rate volatility are also conducted
(see Jorian, 1996). More specifically, I examine whether the number of Reuters reports for day t is
able to replicate the volume-price volatility correlations observed for the number of actual
intervention trades.
The paper is organized as follows. The next section discusses the SNB’s intervention
strategy and how the interventions are communicated. The same section explains the qualitative
information of Reuters news reports. The section thereafter presents the empirical results. The
main findings are Reuters news reports are accurate in announcing SNB interventions when indeed
an intervention takes place but are deficient in capturing the timing and the frequency of the
intervention rounds. The last section considers the implications of the Swiss results for other
intervention studies using Reuters news reports.
2. SNB Interventions and Reuters News Reports
This section first outlines the SNB’s intervention strategy and how the intervention activity
is communicated to financial markets. Thereafter, the transactions data and Reuters news reports
are discussed.
2.1 Institutional Considerations
The SNB intervenes to influence the trend of the exchange rate or to counteract market
disturbances. Solidarity with other central banks has also been an important motive in the past
because almost all interventions were coordinated. This however does not imply that the SNB has
always followed the lead of the G-3 central banks. The Federal Reserve and the Bundesbank, for
example, have intervened more frequently than the SNB has during the last fifteen years. This is
further underscored by the observation that the scale of the SNB interventions tended to be small.
SNB interventions are conducted in the dealer market directly with foreign and domestic
commercial banks operating in several Swiss cities. The SNB’s activity in the dealer market is

3
limited and should not to be treated as a market maker. SNB interventions are thus based on
market exchange rates. It is common for the SNB’s trading desk to gather binding quotes from
commercial banks before executing an intervention transaction.
The SNB communicates its interventions directly with the counterparty. After the
intervention transaction has been completed, the SNB informs the trader of the commercial bank
that the transaction was an official intervention.3 According to SNB officials, the intervention
announcement spreads swiftly across the dealer market. The SNB makes no formal declaration to
news agencies that it is intervening. The SNB instead may be asked by Reuters if it has intervened
in which case a spokesman will confirm or refute the intervention claim. This unique
communication strategy for SNB interventions is valid for the entire sample considered in the next
section.
The SNB’s intervention strategy may be described as following a shotgun tactic.
Intervention sessions are characterized by numerous transactions of small volume in a short time
span. The sessions are generally completed within 10 to 30 minutes. It is hoped this way that the
intervention’s news is disseminated broadly in the dealer market. The trading volume per
transaction is most often either $5 or $10 million. On rare occasions is the transaction’s size over
$20 million.
2.2 SNB Transactions Data, Reuters News Reports, and Data Properties
The intervention data used in this study are SNB spot transactions. They cover the Swiss
franc/U.S. dollar, the Japanese Yen/U.S. dollar, the German mark/U.S. dollar, and the Swiss
franc/German mark currencies for the period from January 1989 to August 1995.4 The availability
of the Reuters news reports determines the starting date, whereas the last SNB intervention in
August 1995 marks the terminal date. There are three days when the SNB intervened alone: 27 3 The SNB also conducts customer transactions (i.e., passive interventions) for the federal government. These trades are transacted in the broker market or as interventions in the dealer market. 4 Earlier studies using SNB transactions data are by Fischer (2003), Fischer and Zurlinden (1999), Pasquariello (2002), and Payne and Vitale (2003).

4
December 1989, 6 March 1992, and 11 March 1992. The remaining 66 intervention days are
coordinated in the sense that the SNB intervened on the same day and in the same direction as the
Bundesbank and/or the Federal Reserve.5
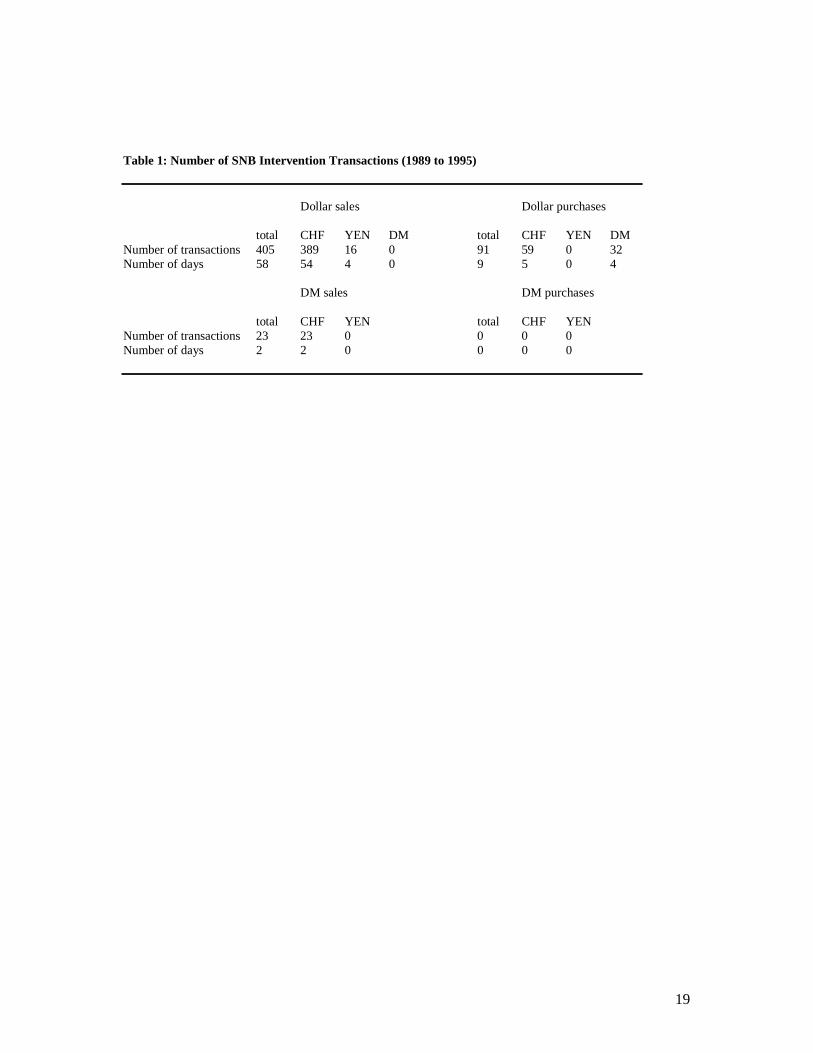
Table 1 shows the currency breakdown of SNB intervention transactions that were
conducted on the 69 intervention days. From 1989 to 1995, the SNB intervened primarily in the
Swiss franc/US dollar currency market, followed by the German mark/US dollar, and then the
Japanese Yen/US dollar currency market. Only on two intervention days did the SNB purchase
Swiss francs against German marks.
Before discussing the properties of the Reuters news reports, it is important to review
several uncertainties surrounding the use of this data source to capture Swiss intervention activity.
At the first level, there is no consensus among empirical practitioners on how much time passes
between the time stamp of the central bank intervention and that of the Reuters intervention
announcement. Goodhart and Hesse (1993), on the one hand, write ‘reliable sources confirm that
in most cases interventions intended to be visible tend to appear on the Reuters screen with a delay
no longer 15 to 30 minutes.’ Sapp (2002), on the other hand, claims it is less than 15 minutes. As a
consequence, the intervention studies do not work with an event window of the same size.
Goodhart and Hesse (1993) measure the difference in terms of one hour. Chang and Taylor (1998)
examine a 10 minute frequency, whereas Dominguez (2003a) and Sapp (2002) operate with a 5
minute interval.
A second form of uncertainty is that Reuters does not always mention in which market the
SNB intervenes and never its intervention volume.6 Most central banks intervene in one or two
currency markets. In the case of the SNB, there are four and on several occasions it intervened in
different markets on the same day.
5 During this sample, coordinated interventions arose in the following manner: the SNB and other European central banks were informed in advance when the Bundesbank or the Federal Reserve would intervene. It was then up to the SNB if it decided to participate or not in the coordinated intervention. 6 Several studies examining the reaction to U.S. or Japanese interventions mention that Reuters’ headlines give information on the volume or the exchange rate.

5
A third form of uncertainty concerns the proper filtering of the news reports and their
updates. This is an important issue because no common approach prevails in the literature. Several
studies such as Dominguez (2003a), Sapp (2002), and Chang and Taylor (1998) use the frequency
of media reports as an indirect proxy for the number of intervention trades or the number of
intervention sessions during a trading session. Chang and Taylor (1998) use a filtering rule that
excludes announcements two hours after the first announcement, whereas Sapp (2002) excludes
reports that are within the first two hours.
Table 2 and Figure 1 present comparative information between the SNB transactions and
the reported interventions. The main observations are the following. First, there are only six days
where Reuters failed to report an intervention when the SNB did intervene, however there were no
cases of false reporting; i.e., Reuters announces an SNB intervention but no intervention took
place. This latter issue of false reporting did arise in the accuracy studies of newspaper accounts by
Frenkel et al. (2004), Klein (1993), and Osterberg and Wetmore Humes (1993).
Second, the volatility of the number of SNB transactions is three times higher than the
number of intervention reports. This difference in the standard deviations also holds for
interventions in the Swiss franc/US dollar currency market. A further striking feature of the data is
that simple statistics of Table 2 show that the Reuters reports do not reflect the true intervention
activity. The correlation between the number of SNB transactions and Reuters reports is 0.21 for
the full sample and 0.33 for the days when the SNB intervened in the Swiss franc/US dollar
currency market. This information is also underpinned by the results from the (non parametric)
sign test, which strongly rejects the null hypothesis that the distribution of the actual and the
reported series are the same.
3. Actual and Reported Interventions
The analysis on the accuracy of Reuters news reports considers three issues: the timing of
the first intervention, the relationship between the frequency of the actual transactions and the

6
frequency of the reports, and the relationship between the exchange rate volatility and the trading
volume. In each case, the empirical regressions suggest that the Reuters reports do not accurately
capture information from the intervention activity.
3.1 The Timing of the First Intervention
Many intervention studies report that the first intervention is the most important.7 Figure 2
plots the time difference between the time stamp of the first SNB intervention trade and the first
(time stamped) Reuters announcement during Zurich trading hours. Positive values denote time
lags in Reuters reporting and negative values depict “too early” reporting. Of the twenty-one dates,
fifteen Reuters reports mention that the SNB had confirmed that it had intervened. The remaining
six reports do not give a source: i.e., dealer or central bank spokesman. The time differences of
these latter reports are shaded in Figure 2.
The limited number of first reported Reuters announcements stem from two factors.
Reuters news reports falling outside the Zurich trading hours were dropped from Figure 2. Many
had a time stamp around 23:00 Zurich time (i.e., corresponding to the market’s close in New
York). These announcements focus on the US interventions and mention only in passing that other
European central banks including the SNB had intervened. Further, no reported interventions and
reports without a time stamp accounted for 31% of the missing observations.
The evidence from Figure 2 suggests that the Reuters time stamp does not accurately
capture the timing of SNB behavior. The prior that Reuters announcements follow shortly (i.e.,
within 15 minutes) after the first intervention transaction does not hold. Only three (five) of the
twenty-one reported interventions fall within the first +15 (+30) minutes after the actual
interventions. While the average difference between actual and reported interventions is 44
minutes (with a standard deviation of 61 minutes), the absolute average difference is 51 minutes
7 See Fischer and Zurlinden (1999) and Payne and Vitale (2003) for Swiss evidence.

7
(with a standard deviation of 55 minutes). The time differences are thus frequently larger than the
30 minutes quoted in Goodhart and Hesse (1993).
A more puzzling feature of Figure 2 is that on six occasions Reuters reported that a SNB
intervention occurred before the first actual SNB intervention trade was conducted. Of these all but
one were confirmed by the SNB. This result is serious because the SNB confirmation process is
certainly more cumbersome and time consuming for Reuters than if it reports the FX dealers as the
source for the intervention news. This suggests that coordination problems existed within the SNB:
i.e., between the trading room and the press room.8
To understand the source of the outliers in Figure 2, regression results of the time
difference between the first SNB intervention and the first Reuters report on different measures of
intervention activity are presented in Table 3. The regressions are based on a limited sample of 21
observations and need to be treated with caution. They show that intervention activity measured by
the number of actual SNB trades (ACTUALt), the time of day (AFTERNOONt = +1 if the timing of
the first intervention was after 12:00, otherwise 0), coordinated intervention (COORDINATEDt =
+1 if the SNB intervention is coordinated with the Federal Reserve or the Bundesbank, otherwise
0), intervention volume (VOLUMEt), or whether the Reuters report was confirmed by the SNB
(CONFIRMEDt = +1 if the Reuters report mentions that the SNB confirmed the intervention,
otherwise 0) is unable to explain the time difference. Each of these variables is statistically
insignificant. This result says that the accuracy of Reuters time stamp is not dependent on the
whether the interventions are coordinated (i.e., afternoon interventions were frequently coordinated
with the Federal Reserve and always with the Bundesbank in the morning), the size of the
intervention, its frequency measured by the number of trades or whether it was confirmed by the
SNB. Instead, time variables such as year (YEARt) and day-of-the-week effects are more important
8 The SNB press was informed in advance that the SNB’s trading room would conduct interventions at a specific time. When asked by Reuters after several central banks had already confirmed their interventions, the SNB press responded affirmatively on occasions without consulting the trading room if it had gone through with the planned intervention.

8
for explaining the time difference. The results find that the time difference decreases over time and
is influenced by Tuesday and Thursday interventions.
The negative yearly trend in the time difference and the profile of Figure 2 suggests that the
quality of intervention reporting may have improved over the years. Three observations are offered
in support of this conjecture. First, the reported time difference for the first three years averaged 72
minutes (standard deviation 64 minutes) compared to an average of 5 minutes for the latter three
years (standard deviation 28 minutes). Second, the lions share of the Reuters reports without a time
stamp or those that fell outside the Zurich trading hours stem primarily from the years 1989, 1990,
and 1991. Third, probit regressions predicting the 21 observations depicted in Figure 2 find that
YEARt was the best determinant among the control variables of Table 3. The regressions, which are
presented in Table 4, find that the time trend is positive; i.e., the probability of observing a Reuters
report during Zurich trading hours when an intervention occurred increases over time. The
variables controlling for day-of-the-week effects, a dummy for coordinated interventions
(COORDINATEDt), intervention volume (VOLUMEt), and time of intervention (AFTERNOONt)
are found to be insignificant.
3.2 The Frequency of SNB Interventions and of Reuters News Reports
Although Reuters news reports do not mention the number of intervention trades, the
frequency of news reports is used in numerous studies as a proxy for the number of central bank
interventions.9 The frequency’s accuracy of the reports can be tested by regressing the frequency
error on a set of explanatory variables. The frequency error (R_ERRORt) is defined as the number
of SNB intervention trades for intervention day t minus the number of Reuters reports for t. The
null hypothesis under this setup is equivalent to an efficiency test of the residual between actual
and reported interventions; the constant and the coefficients of the explanatory variables should be
equal to zero. 9 The studies following this strategy are Chang and Taylor (1998), Chari (2003), Dominguez (2003a), Goodhart and Hesse (1993), Peiers (1997), and Sapp (2002).

9
Table 5 summarizes the regressions of the frequency error on a set of variables, again
relating to intervention activity. The considered variables are the intervention volume (VOLUMEt),
the number of intervention sessions (SESSIONSt, where a session is defined as a group of
interventions lasting no more than 30 minutes with time intervals between sessions of at least 30
minutes), time of intervention defined through an afternoon dummy (AFTERNOONt), and a
volatility variable based on intervention information from SNB transaction prices (VOLATILITYt =
[max(s*it) – min(s*
jt)]2, where s*it is the ith transactions price of a SNB intervention for day t). The
variables, intervention rounds (SESSIONSt) and exchange rate volatility (VOLATILITYt), are
motivated by the observation that more intervention sessions and greater exchange rate volatility
should be positively correlated with the number of intervention trades.
The regression results with R_ERRORt provide evidence that the Reuters reports are unable
to replicate the frequency of the actual interventions. Although the timing of interventions
(AFTERNOONt) and exchange rate volatility (VOLATILITYt) do not explain the difference in the
frequency error, the other two variables do.10 VOLUMEt and SESSIONSt are found to be
statistically significant at the 5% level, both by themselves and in regressions with other variables.
A further observation is that the two variables together are able to explain a large share of the
frequency error; the R2 is above 0.80%. A simple explanation for this result is that Reuters is more
likely to dedicate one news report to one intervention trade than devote 100 news reports to 100
trades. This implies that the relationship is nonlinear; a higher intervention volume or interventions
in sessions will lead to a greater error in reporting. The p-values of the Jarque-Bera tests in Table 5
support this claim. They show that the residuals from the linear regression suffer from excess
skewness and kurtosis.
10 The insignificance result of AFTERNOONt and VOLATILITYt is robust to alternative definitions of timing and exchange rate volatility. Although not shown in Table 5, other factors such as day-of-the-week effects or time trends were also found to be insignificant.

10
3.3 Exchange Rate Volatility and Reuters Reports
Several studies in the microstructure literature have reported a strong contemporaneous
correlation between trading volume and exchange rate volatility.11 Jorion (1996) motivates the
importance of the price-volume correlation as follows. The price-volume correlation offers an
alternative perspective on the structure of financial markets by relating information arrival with
market prices. The correlation also has implications about the probable success of new derivative
contracts, which rely on sufficient price uncertainty of the underlying asset that cannot be fully
cross-hedged through existing products. Lastly, the correlation is important for understanding the
empirical distribution of speculative prices. For the purposes of whether Reuters reports reveal
intervention activity, the first and third reasons apply.
Table 6 presents regression results between exchange rate volatility and intervention
volume. The volatility variable is defined in four ways: V1t = [max(sit) – min(sjt)]2, where max(sit)
and min(sjt) are the maximum and minimum values of the (intraday with 10 minute interval for i)
Swiss franc/US dollar exchange rate for intervention day t, V2t = [max(s*it) – min(s*
jt)]2, where s*it
is the ith transactions price for intervention day t, V3t is the one-day ahead forecast from a
GARCH(1,1) model with student-t distribution using the daily Swiss franc/US dollar exchange
rate, and V4t follows Dominguez (1998) and models volatility as a GARCH(1,1) with student-t
distribution that includes trading volume as an independent regressor in the variance equation
again using the daily Swiss franc/US dollar exchange rate.12 The volume variable is defined either
to be the number of SNB transactions for day t (i.e., denoted as ACTUALt in Table 6) or the
number of the Reuters’ intervention reports (i.e., REPORTEDt). The volatility regressions with V1t
V2t , and V3t are for the 69 intervention days, whereas the GARCH estimates for V4t are for daily
data, covering the period 1988:1:1 to 1995:12:27. Of interest is to determine how the Reuters
series matches up with the constructed volatility series.
11 See the discussion in Sarno and Taylor (2001) on page 28 and the references therein. 12 The daily exchange rates are 11:00 quotes (Zurich local time). The (one-day ahead) GARCH forecast uses a sample covering the period from 1988 to 1995.

11
The regression estimates in Table 6 show that trading volume is positively correlated with
the different measures of exchange rate volatility, however the strength of the correlations is
dependent on the volatility measure. While ACTUALt and REPORTEDt tend to corroborate the
same information for the GARCH generated volatility measures using daily exchange rates, the
same cannot be said for the two volatility measures based on intraday exchange rates. From the
reported R2s, V1t is found to be more strongly correlated with the number of Reuters reports,
whereas V2t is more strongly correlated with the number of SNB transactions.
4. Is it Possible to Extrapolate the Swiss Results to other Studies?
The empirical results in the previous section highlight the importance of working with
transactions data as opposed to the proxy data generated from Reuters news reports. The
suggestive but not conclusive evidence based on a limited sample finds that the time stamp of
Reuters news reports does not closely match the timing and trading intensity of SNB transactions.
Additional regressions find that the information content of Reuters news reports is unable to
capture fully the attributes of the SNB interventions. Can these negative results be generalized for
intervention studies using Reuters news reports for other currencies?
The short answer is no. Important institutional features, which differ strongly across
countries, do not allow the practitioner to determine the direction of the reporting bias for other
countries. However, the Swiss results do raise issues that have not been addressed in studies using
Reuters reports by Chang and Taylor (1998), Dominguez (2003), Peiers (1997), Sapp (2003) and
others. The issues concern the observation that Reuters’ coverage of foreign exchange
interventions is not uniform across countries and that disclosure practices among the central banks
have changed over time. These two issues are discussed next.
To gain an understanding that Reuters’ coverage is not equal across countries
comparisons are made with the Federal Reserve, the Bundesbank, and the Swiss National
Bank intervention reports. On the 66 days when the SNB conducted coordinated interventions

12
between 1989 and 1995, Reuters reported 158 times that the SNB was intervening as opposed
to 1465 reported Bundesbank interventions and 1637 reported Federal Reserve interventions.
The large difference in the number of reports between the Swiss reports and the reports of the
other two central banks suggests that financial markets and Reuters place greater weight on
news from G-3 interventions than from Swiss interventions.13 Under the assumption that
greater Reuters’ coverage leads to greater timing accuracy, this would bias the Swiss results
toward inaccuracy.14
A further consideration for Reuters news reports to be successful in capturing the timing of
interventions is that the level of central bank transparency should be high. The standard deviations
of the time differences between actual and reported interventions should be lower for central banks
with a high level of intervention disclosure as opposed to a low level of transparency. Chiu (2003)
notes there is considerable diversity regarding the visibility and disclosure of central bank
intervention operations. Her survey on intervention practices notes that although the Swiss policy
of announced interventions through the dealer market has been consistent since 1986, the
communication policy of the Federal Reserve and the Bank of Japan (BoJ) has varied considerably
over the last fifteen years. While the U.S. and Japanese monetary authorities have engaged in
secret interventions on a case by case basis particularly in the early 1990s, the intervention
operations in recent years have been visible.15
Again if the results from Figure 2 are to be used as a yardstick for other studies, then the
transparency factor would predict that the time differences for US and Japanese interventions
should not be smaller than the time differences for Swiss interventions for the early 1990 period.
Frenkel et al. (2004) offer indirect evidence in the Japanese case. They examine the accuracy of
newspaper reports on BoJ interventions between January 1995 and December 1999 and find that
13 Although Goodhart and Hesse (1993) do not explicitly mention it, their study shows that the frequency of Reuters news reports for similar intervention dates varies considerably across European countries. 14 At the same time it must be recognized that greater Reuters’ coverage requires the researcher to make stronger assumptions for the intervention flow, making the empirical results more sensitive to the filtering assumptions. 15 Chiu’s (2003) survey does not consider Bundesbank practices.
13
the press reports of interventions are an inaccurate indicator of actual BoJ interventions. Their
results are in line with the earlier empirical studies by Klein (1993) and Osterberg and Wetmore
Humes (1993) for the United States.
The two factors, i.e., reporting intensity and intervention visibility, show it is not possible
from the Swiss results to make claims regarding the directional bias in the timing error for other
studies using Reuters news reports. Nevertheless, this study offers a cautionary warning above and
beyond the newspaper studies of Frenkel et al. (2004), Klein (1993), and Osterberg and Wetmore
Humes (1993). First, the Reuters reports in this study show that the reporting of an intervention for
day t is fairly accurate (i.e., correct in 63 of 69 cases with no false reporting). The high percentage
suggests that future intervention studies using daily data should use Reuters and not newspaper
reports. Second and more importantly, Reuters reports are accepted by many empirical economists
as a relatively accurate tool that is able to replicate many of the attributes of financial transactions
in intraday data. This study questions that ability for Swiss interventions measured by the time
stamp and the trading intensity.
5. Conclusions
Reuters news reports have become an important tool for testing informational issues in the
microstructure literature on foreign exchange interventions. Although the accuracy of the Reuters
news reports for intervention announcements have never been formally tested, the combination of
high frequency data and the time stamp from news reports gives researchers the illusion they are
operating with a certain precision that is credible for microstructure studies. As such, these studies
make important assumptions, which have implications as to how the testing framework is designed
and how the empirical results are interpreted. The objective of this paper is to fill this void by
examining the accuracy of Reuters news reports against SNB transactions data.
The empirical findings are suggestive and not conclusive. The regression results based on a
limited sample show that the time-stamp of Reuters intervention reports do not match up closely

14
with those from SNB transactions slips. The regressions find that the time difference is best
captured not with variables reflecting intervention activity such as the number of trades or trading
volume, but with a negative time trend. This suggests that the quality of Reuters reporting
improved over the years. The empirical results show that key assumptions made in the
microstructure literature for foreign exchange interventions are not supported. The standard
assumption is that the Reuters announcements are concentrated five to fifteen minutes after the
first actual intervention. The Swiss evidence, however, finds the opposite result holds such that the
standard deviation of the prediction error can be measured in hours and not in minutes and that
there is evidence of Reuters intervention reporting before the first SNB intervention occurs.
These discrepancies in reporting Swiss interventions raise new questions for future studies.
Although it cannot be shown that the empirical results for Switzerland apply for G-3 intervention
studies using Reuters news reports, they do suggest that researchers need to recognize that the
quality of the Reuters’ coverage may be time and country dependent and that the accuracy of the
Reuters reports may also depend on the disclosure practices of central banks. These issues should
motivate future studies to define properly the event window for intervention news and to justify the
filtering of news reports.
Acknowledgements
The author would like to thank Michael Melvin and an anonymous referee for helpful
comments. He has also benefited from comments and suggestions by Kathryn Dominguez,
Rasmus Fatum, Charles Goodhart, Philipp Harms, Elmar Mertens, Freyan Panthaki, Paolo
Vitale, and Marcel Zimmermann in an earlier version of the paper.

15
References
Chang, Y., Taylor, S.J., 1998. Intraday Effects of Foreign Exchange Intervention by the Bank
of Japan, Journal of International Money and Finance 17 (1), 191-210.
Chiu, P., 2003. Transparency versus Constructive Ambiguity in Foreign Exchange
Intervention, BIS Working Papers No. 144.
Chari, A., 2002. Devine Intervention? Speculators and Central Banks in the Foreign Exchange
Market, manuscript, University of Michigan.
Dominguez, K.M., 2003a. The Market Microstructure of Central Bank Intervention, Journal
of International Economics 59 (1), 25-45.
Dominguez, K.M., 2003b. When Do Central Bank Interventions Influence Intra-Daily and
Longer-Term Exchange Rate Movements?, manuscript, University of Michigan.
Fatum, R., Hutchison, M.M., 2003. Is Sterilized Foreign Exchange Intervention Effective
After All? An Event Study Approach, Economic Journal 113, 390-411.
Fischer, A.M., 2003. Measurement Error and the Profitability of Interventions: A Closer Look
at SNB Transactions Data, Economics Letters 81 (1), 137-142.
Fischer, A.M., Zurlinden, M., 1999. Exchange Rate Effects of Central Bank Interventions: An
Analysis of Transaction Prices, Economic Journal 109, 662-676.
Frenkel, M., Pierdzioch, C., Stadtmann, G., 2004. The Accuracy of Press Reports Regarding
the Foreign Exchange Interventions of the Bank of Japan, Journal of International
Financial Markets, Institutions and Money 14 (1), 25-36.
Goodhart, C., Hesse, T., 1993. Central Bank Forex Intervention Assessed in Continuous
Time, Journal of International Money and Finance 12 (4), 368-389.
Klein, M.W., 1993. The Accuracy of Reports of Foreign Exchange Intervention, Journal of
International Money and Finance 12 (6), 644-653.

16
Jorion, P., 1996. Risk and Turnover in the Foreign Exchange Market. in Frankel, J.A., Galli,
G., Giovannini, A. (Eds.), The Microstructure of Foreign Exchange Markets. National
Bureau of Economic Research Conference Report Series, University of Chicago Press,
pp. 19-37.
Lyons, R.K., 1996. Foreign Exchange Volume: Sound and Fury Signifying Nothing? in
Frankel, J.A., Galli, G., Giovannini, A. (Eds.), The Microstructure of Foreign Exchange
Markets. National Bureau of Economic Research Conference Report Series, University
of Chicago Press, pp. 183-201.
Melvin, M., Peiers, B., 1995. Twice a Day or Continuously? Observation Frequency and
Influence on FX Volatility Persistence, in First International Conference on High
Frequency Data in Finance, Proceedings Volume 2 - Zurich, Switzerland.
Osterberg, W.P., Wetmore Humes, R., 1993. The Inaccuracy of Newspaper Reports of U.S.
Foreign Exchange Intervention, Federal Reserve Bank of Cleveland, Economic Review
29 (4), 25-34.
Payne, R., Vitale, P., 2003. A Transaction Level Study of the Effects of Central Bank
Intervention on Exchange Rates, Journal of International Economics 61 (2), 331-329.
Pasquariello, P., 2002. Informative Trading or Just Noise? An Analysis of Currency Returns,
Market Liquidity, and Transaction Costs in Proximity of Central Bank Interventions,
manuscript, Stern School of Business, NYU.
Peiers, B. 1997. Informed Traders, Intervention and Price Leadership: A Deeper View of the
Microstructure of the Foreign Exchange Market, Journal of Finance 52 (4), 1589-1614.
Sapp, S.G., 2002. Price Leadership in the Spot Foreign Exchange Market, Journal of
Financial and Quantitative Analysis 37 (3), 425-448.
Sarno, L., Taylor , M.P., 2001. The Microstructure of the Foreign-Exchange Market: A
Selective Survey of the Literature, Princeton Studies in International Economics No. 89
(May).

17
Figure 1: Number of Actual Transactions versus Number of Reported Interventions
0
5
10
15
20
25
30
35
40
89/01
/09
89/01
/19
89/02
/03
89/03
/17
89/04
/28
89/05
/05
89/05
/19
89/05
/26
89/08
/11
89/09
/05
89/09
/25
89/09
/28
89/10
/06
90/01
/04
90/03
/20
91/02
/12
91/03
/15
91/03
/22
91/04
/24
91/08
/19
92/07
/20
92/08
/24
95/03
/03
Number of Actual TransactionsNumber of Reported Interventions

18
Figure 2: Time Difference (in Minutes) between the First SNB Intervention and the First Reuters Report of an SNB Intervention
-100
-50
0
50
100
150
200
250
89/0
1/09
89/0
1/20
89/0
3/16
89/0
5/22
89/0
5/25
89/0
9/15
89/0
9/27
90/0
1/04
90/0
3/20
91/0
3/19
91/0
4/24
91/0
8/19
92/0
3/06
92/0
3/11
92/0
7/20
92/0
8/11
92/0
8/21
94/0
6/24
95/0
3/03
95/0
5/31
95/0
8/15
Min
utes
Date (Year / Month / Day)
Note: The non-shaded columns are reported interventions conf irmed by the SNB. All interventions are coordinated interventions except 92/03/06 and 92/03/11.
19
Table 1: Number of SNB Intervention Transactions (1989 to 1995) Dollar sales Dollar purchases total CHF YEN DM total CHF YEN DM Number of transactions 405 389 16 0 91 59 0 32 Number of days 58 54 4 0 9 5 0 4 DM sales DM purchases total CHF YEN total CHF YEN Number of transactions 23 23 0 0 0 0 Number of days 2 2 0 0 0 0

20
Table 2: Statistical Properties of SNB Intervention Transactions and Reported Interventions Total SNB Total Reported Only CHF/USD Only CHF/USD Transactions Interventions SNB Coor-Inter Reported Coor-Inter Total Observations 519 165 496 138 Number of days 69 63 59 53 Number of transactions or reports per day average 7.52 2.39 6.67 2.33 median 5 2 5 2 max 36 9 18 9 min 1 0 1 0 std. deviation 6.38 1.79 4.22 1.86 skewness 2.39* 1.53* 1.14* 1.63* kurtosis 7.18* 3.18* 0.52 3.37* corr(ACTUALt, REPORTEDt) 0.21 0.33 Sign Test(ACTUALt, REPORTEDt ) 0.00 0.00 Notes: ACTUALt is the number of SNB transactions and REPORTEDt is the number of Reuters reports for intervention day t. * denotes that the null hypothesis of no skewness and no kurtosis is rejected at the 5% significance level. The Sign Test considers whether the distribution of the actual transactions per day and the reported interventions are the same; their p-values are reported.

21
Table 3: OLS Regressions of the Time Difference
Dependent Variable is the time difference between the first SNB intervention and the first Reuters report (1) (2) (3) (4) (5) (6) CONSTANT 1158.245* 1056.645* 1081.856* 1116.021* 787.231* 1096.301 (263.536) (246.797) (253.644) (274.555) (203.664) (262.092) YEARt -11.863* -10.837* -11.401* -11.574* -7.809* -11.462* (2.805) (2.578) (2.766) (2.908) (2.250) (2.792) MONDAYt -29.250 -33.014 -31.222 -29.742 -26.427 -29.566 (18.295) (18.163) (19.550) (18.462) (015.831) (18.598) TUESDAYt -56.274* -55.242* -58.771* -60.151* -68.203* -57.006* (13.934) (11.931) (13.887) (14.300) (15.295) (12.697) WEDNESDAYt -17.220 -15.053 -13.990 -13.299 -17.214 -14.872 (17.605) (18.812) (19.251) (21.172) (12.668) (19.331) THURSDAYt 78.063* 80.502* 81.077* 85.562* 86.517* 82.677* (22.345) (23.537) (24.348) (24.816) (20.974) (23.526) AFTERNOONt -1.806 (2.236) ACTUALt -2.803 (2.214) COORDINATEDt 10.526 (12.287) VOLUMEt -1.265 (2.381) CONFIRMEDt -1.2654 (2.381) R2 0.82 0.82 0.82 0.82 0.82 0.81 Degrees of Freedom 14 14 14 14 14 15 Notes: YEARt is the year in which the intervention was conducted; the day-of-the-week effects are captured through the dummy variables MONDAYt , TUESDAYt, WEDNESDAYt, and THURSDAYt; AFTERNOONt is a dummy variable +1 if the first intervention is conducted in the afternoon, otherwise 0; TRADESt is the number of SNB intervention transaction for day t; COORDINATEDt is +1 if the SNB intervention is coordinated with either the Federal Reserve or the Bundesbank; VOLUMEt is the intervention volume for day t; CONFIRMEDt is a dummy variable +1 if the Reuters report mentions that the intervention was confirmed by the SNB, otherwise 0. Robust standard errors are given in the parentheses and * denotes significance at the 5% level.

22
Table 4: Probit Analysis of the Likelihood of a Reuters Report
Dependent variable is +1 when Reuters reports an intervention with a time stamp between 8:00 and 17:30 Zurich time on the day of an SNB intervention; otherwise 0 (Recall there are no false Reuters reports of a SNB intervention). (1) (2) (3) (4) (5) CONSTANT -33.167* -31.298* -33.119* -33.062* -36.155* (9.651) (9.533) (9.292) (9.223) (9.891) YEARt 0.362* 0.350* 0.371* 0.376* 0.410* (0.107) (0.104) (0.102) (0.101) (0.109) MONDAYt 0.200 0.192 0.414 (0.506) (0.507) (0.517) TUESDAYt -0.003 -0.009 0.139 (0.462) (0.467) (0.483) WEDNESDAYt -0.232 -0.246 -0.228 (0.556) (0.551) (0.572) THURSDAYt 0.434 0.435 0.689 (0.556) (0.557) (0.562) VOLUMEt -0.001 -0.001 (0.002) (0.002) AFTERNOONt 0.567 (0.414) COORDINATEDt -0.794 -1.021 -1.454 -1.836 (0.622) (0.671) (1.002) (1.045) Pseudo-R2 0.18 0.19 0.21 0.21 0.23 Cases Correct 55 55 53 52 55 Degrees of Freedom 67 66 62 61 60 Notes: YEARt is the year in which the intervention was conducted; the day-of-the-week effects are captured through the dummy variables MONDAYt , TUESDAYt, WEDNESDAYt, and THURSDAYt; VOLUMEt is the intervention volume for day t; AFTERNOONt is a dummy variable +1 if the first intervention is conducted in the afternoon, otherwise 0; COORDINATEDt is +1 if the SNB intervention is coordinated with either the Federal Reserve or the Bundesbank. Robust standard errors are given in the parentheses and * denotes significance at the 5% level.

23
Table 5: Regressions of (Number of Actual Trades minus Number of Reuters Reports) Dependent Variable: Frequency error = (ACTUALt - REPORTEDt) (1) (2) (3) (4) (5) (6) CONSTANT 5.130* 0.620 -3.428* -1.290 -1.260 -1.217 (0.743) (0.438) (1.688) (0.661) (1.027) (1.004) VOLUMEt 0.066* 0.058* 0.057* 0.058* (0.006) (0.006) (0.006) (0.006) SESSIONSt 6.216* 1.892* 1.883* 1.921* (1.461) (0.662) (0.666) (0.674) AFTERNOONt -0.028 0.035 (0.710) (0.716) VOLATILITYt -0.001 (0.002) Jarque-Bera Test 0.000 0.006 0.000 0.004 0.004 0.001 R2 0.00 0.81 0.50 0.84 0.84 0.84 Degrees of Freedom 68 67 67 66 65 64 Notes: ACTUALt is the number of SNB transactions on intervention day t; REPORTEDt is the number of Reuters reports on SNB interventions for day t; VOLUMEt is the intervention volume for day t; SESSIONSt is the number of intervention sessions lasting no more than 30 minutes with an interval of at least 30 minutes; AFTERNOONt is a dummy variable +1 if the first intervention is conducted in the afternoon, otherwise 0; VOLATILITYt is = [max(s*
it) – min(s*it)]2, where s*
it is the ith transactions price of a SNB intervention for day t. Robust standard errors are given in the parentheses and * denotes significance at the 5% level. The Jarque-Bera test reports the p-values.

24
Table 6: Exchange Rate Volatility and Trading Volume Dependent Variable: V1t V1t V2t V2t V3t V3t V4t V4t CONSTANT 8.786* 3.340 -25.685* 18.421 0.081* 0.083* -0.002 -0.002 (2.197) (4.503) (6.777) (9.758) (0.005) (0.007) (0.007) (0.007) ACTUALt 0.631* 8.357* 0.093 0.002* (0.307) (1.181) (0.056) (0.001) REPORTEDt 4.261* 7.841 0.001 0.005* (2.011) (4.003) (0.003) (0.002) ε2
t-1 0.032* 0.032* (0.007) (0.008) ht-1 0.912* 0.918* (0.0197) (0.019) η ( student t) 7.120* 7.110* (1.070) (1.089) R2 0.05 0.17 0.58 0.04 0.03 0.01 L -637.26 -639.26 Degrees of Freedom 67 67 67 67 67 67 2073 2073 Estimation OLS OLS OLS OLS OLS OLS ML ML Notes: The estimation with the dependent (volatility) variables V1, V2, and V3 are with OLS and robust standard errors are given in parentheses. V1t = [max(st) – min(st)]2, where st is the CHF/USD on the days of an SNB intervention and V2t = [max(s*
it) – min(s*it)]2, where
s*it is the ith transactions price of a SNB intervention for day t. The volatility variable, V3, is a volatility (one-day ahead) forecast stemming
from a GARCH(1,1) ~ student-t model. The volatility variable, V4, is derived from a GARCH(1, 1) ~ student-t with trading volume as an independent regressor. The (daily) exchange rate for V3 and V4 is the CHF/USD. ACTUALt is the number of SNB transactions and REPORTEDt is the number of Reuters reports for intervention day t. Standard errors are given in the parentheses for V4t and robust standards for V1t, V2t, and V3t. * denotes significance at the 5% level.

Swiss National Bank Working Papers published since 2004: 2004-1 Samuel Reynard: Financial Market Participation and the Apparent Instability of
Money Demand 2004-2 Urs W. Birchler and Diana Hancock: What Does the Yield on Subordinated Bank Debt Measure? 2005-1 Hasan Bakhshi, Hashmat Khan and Barbara Rudolf: The Phillips curve under state-dependent pricing 2005-2 Andreas M. Fischer: On the Inadequacy of Newswire Reports for Empirical Research
on Foreign Exchange Interventions

Swiss National Bank Working Papers are also available at www.snb.ch, section Publications/ResearchSubscriptions or individual issues can be ordered at Swiss National Bank, Fraumünsterstrasse 8, CH-8022 Zurich,fax +41 44 631 81 14, E-mail [email protected]